
Back to Journals » Journal of Pain Research » Volume 19
Global Co-Burden and Risk Factors of Low Back Pain and Osteoarthritis: Analysis of Global Burden of Disease 2021 Data Based on Machine Learning and SHAP
Authors Li X, Shuid AN, Mohd Miswan MF, Cao D, Zhang X, Mao P, Tian Y, Yuan H 
Received 23 December 2025
Accepted for publication 7 March 2026
Published 21 March 2026 Volume 2026:19 590969
DOI https://doi.org/10.2147/JPR.S590969
Checked for plagiarism Yes
Review by Single anonymous peer review
Peer reviewer comments 3
Editor who approved publication: Dr Alaa Abd-Elsayed
Xusheng Li,1,2 Ahmad Nazrun Shuid,2 Mohd Fairudz Mohd Miswan,2 Donghui Cao,1 Xiao Zhang,1 Pengcheng Mao,1 Yanrong Tian,1 Haifeng Yuan1
1Department of Spinal Orthopaedics, General Hospital of Ningxia Medical University, Yinchuan, Ningxia, People’s Republic of China; 2Faculty of Medicine, Universiti Teknologi MARA, Sungai Buloh Campus, Jalan Hospital, Sungai Buloh, Selangor, Malaysia
Correspondence: Haifeng Yuan, Email [email protected]
Background: Low back pain (LBP) and osteoarthritis (OA) are leading causes of disability in the elderly, but a global analysis of their comorbidity patterns and risk factors is lacking. The goal of this study was to examine the global epidemiology and risk factors of their comorbidity.
Methods: We analyzed the incidence, prevalence, and Years Lived with Disability (YLDs) for people aged 50 years and older for 204 countries and territories from the Global Burden of Disease 2021 study. Random Forest models with SHAP (Shapley Additive exPlanations) values were applied, and important risk factors were identified. Thereafter, multiple linear regression models with backward stepwise selection were applied to categorize the risk factors into the shared risk factors, OA-specific factors, and LBP-specific factors. Finally, we simulated the potential effect of risk factor interventions on disease burden.
Results: The global burden of OA was greatest in high-income countries, whereas the LBP burden was greatest in Europe and Central Asia. A Random Forest analysis revealed primary risk factors, including environmental and occupational exposures for OA, and metabolic and ergonomic factors for LBP. Five shared risk factors were found in both sexes combined, primarily dietary factors and low bone mineral density. Notably, high body mass index was identified as an OA-specific risk factor, while smoking and occupational ergonomic factors were distinctly LBP-specific. The interventions that had the largest burden reduction were those that targeted the shared risk factors, including indirect cascade effects.
Conclusion: The co-burden of LBP and OA is a complex phenomenon attributed to shared and disease-specific risk factors, highlighting the need for prevention strategies that are tailored by sex and geographic region.
Keywords: comorbidity, co-burden, risk factors, low back pain, osteoarthritis, global burden of disease
Introduction
Musculoskeletal disorders are the leading cause of the worldwide burden of disability, and low back pain (LBP) and osteoarthritis (OA) are consistently ranked as the most disabling disorders.1–3 The increasing prevalence of these conditions, as a result of global population ageing and increasing exposure to risk factors, is a major challenge to health systems and economies of the world.4 Low back pain (LBP) is the single leading cause of years lived with disability (YLDs) worldwide, and OA, particularly OA of the hip and knee, contributes a significant and increasing share of the nonfatal burden of disease.2
LBP and OA often coexist, particularly in older adults. The presence of this comorbidity can complicate diagnosis, management, and treatment, often resulting in worse patient outcomes such as increased functional impairment, impaired quality of life, and increased use of healthcare.4,5 The coexistence is believed to be caused by common systemic and local mechanisms. Pathophysiological pathways such as chronic low-grade inflammation, neuroimmune interactions, metabolic dysregulation, obesity-related mechanical loading, and structural alterations in the musculoskeletal system create a strong biological premise for their frequent co-occurrence.6–9 Despite the known clinical significance of this comorbidity, the overall epidemiologic picture of this comorbidity worldwide is unknown. There has been a shortage of studies examining the co-morbidity of LBP and OA, and particularly how the burdens of co-occurring LBP and OA co-vary among various geographical areas, economic levels, and sexes.5 Furthermore, whereas many risk factors have been identified for each condition separately, their relative contribution and positioning as either common or disease-specific risk factors of comorbidity have not been systematically analyzed worldwide.
The objective of this study was to offer a multi-dimensional analysis of LBP and OA comorbidity using the Global Burden of Disease 2021 dataset. We aimed to: (1) assess the correlation and geographical co-distribution of the burden of LBP and OA; (2) identify and prioritise risk factors for each condition using a machine learning approach; (3) identify which risk factors are common or disease-specific; and (4) estimate the potential reduction of the dual burden of these conditions from targeted risk factor interventions.
Methods
Data Source and Processing
This study used data from the Global Burden of Disease (GBD) 2021 study. We extracted country-level data of low back pain (LBP) and osteoarthritis (OA) for the year 2021, covering 204 countries and territories. The measures of interest were incidence, prevalence, and Years Lived with Disability (YLDs). The analysis was limited to age groups of 50 years and over.
Calculation of Age-Standardized Rates
Age-standardized rates (ASR) per 100,000 population were calculated for each metric in order to allow comparisons between countries. The direct standardization method was used with age-specific rates from the GBD 2021 and the GBD 2021 global standard population as the reference.
Geographical Analysis of Burden
A geographical analysis was performed to plot the worldwide patterns of the burden of LBP and OA. For each of the metrics (incidence, prevalence, and YLDs), all 204 countries and territories were ranked according to their ASR and divided into three tertiles (T1 representing the lowest burden and T3 the highest). Univariate choropleth maps were generated to represent the geographical distribution of the tertiles for LBP and OA independently. Bivariate choropleth maps were also created to display the co-distribution of the disease burden. In these maps, a 3×3 color matrix was employed in which the color of each country represents the tertile ranking of that country for both LBP and OA. This visualization technique provides the option of identifying regions with concordantly high or low burden, as well as regions in which the burden of one condition is much higher than for the other. This analysis was conducted for both sexes combined and also separately for males and females.
Risk Factor Analysis Using Machine Learning
To identify the relative significance of different risk factors to disease burden, a machine learning method was used. The analysis was based on a dataset combining three types of GBD 2021 data for 204 countries and territories: 1) the calculated age standardised incidence rate (ASIR) for individuals aged 50 and over of OA and LBP that was used as the outcome variables, 2) exposure data for a set of 36 relevant metabolic, environmental, occupational, and behavioural risk factors that were used as the predictor variables, and 3) corresponding population data.
Random Forest Modelling and SHAP Interpreting
Two independent Random Forest models were used; one to predict ASIR of OA and the other to predict ASIR of LBP using the 36 risk factors as predictor variables. The Random Forest algorithm was chosen because it can deal with complex interactions among variables. To prevent overfitting and ensure model robustness, the Random Forest models were built utilizing 10-fold cross-validation. Hyperparameter tuning was performed via grid search, ultimately setting the number of trees to 500, with optimal parameters selected for the number of variables available for splitting at each tree node (mtry) and the minimum node size (min_n).
In order to interpret the output of these models, we used SHAP (Shapley Additive exPlanations). SHAP analysis offers a strong measure of the importance of features by determining the contribution that each risk factor plays in the model’s prediction for individual countries. The general impact of a risk factor was calculated as the average of its absolute SHAP values across all the countries. SHAP summary plots were created to visualize the magnitude, prevalence, and direction of each risk factor’s effect on the predicted incidence of the disease.
Identification of Common and Unique Risk Factors
A statistical approach was used to differentiate shared and condition-specific risk factors. First, the age-standardized incidence rates of OA and LBP and all 36 risk factor variables were standardized in terms of z-score. A “Comorbidity Index” was then calculated for each country using a sum of the standardized rates of OA and LBP. Because z-score standardization transforms both variables to have a mean of 0 and a variance of 1, this process mathematically neutralizes the large absolute differences in baseline incidence rates, ensuring that both OA and LBP contribute equally to the variance of the resulting Comorbidity Index.
To mitigate model instability and overfitting associated with a large set of predictors relative to the sample size, Least Absolute Shrinkage and Selection Operator (LASSO) regression was utilized. For each group, the optimal penalty parameter (lambda) was determined using 10-fold cross-validation to minimize the mean cross-validated error. Predictors retaining non-zero coefficients at the optimal lambda were deemed significant.
Risk factors were then classified according to the results of these final models. “Shared factors” were defined as factors that were significantly associated (P < 0.05) with a positive coefficient in the model of comorbidity. “OA-specific” or “LBP-specific” factors were factors that were significantly linked to a positive coefficient in their own individual disease models but were not found to be shared factors.
Calculation and Visualization of Attributable Burden
The disease burden caused by each shared risk factor was measured using the Population Attributable Fraction (PAF) method. The calculation of PAF was done for each country based on the formula: PAF = pe(RR-1) / [pe(RR-1) + 1], where “p_e” is the prevalence of exposure to a given risk factor (obtained from GBD 2021 data) and “RR” is the corresponding relative risk for either OA or LBP. The RR values were defined according to a review of published meta-analyses and large-scale epidemiological studies.
The attributable incidence for each disease was then calculated by multiplying the disease-specific PAF with the total age-standardised incidence rate (ASIR) for that country. This process was done separately for OA and LBP with their respective RR values.
The attributable incidence estimate was categorized into tertiles in order to demonstrate results. Univariate and bivariate choropleth maps were created to visualize the spatial variation of these tertiles. This method enables the identification of the global distribution and co-burden hotspots for each risk factor.
Risk-Burden Matrix Construction
To develop the risk-burden matrix, two composite indices were generated for each country. The composite burden index was defined as the sum of the age-standardized incidence rates (ASIR) for OA and LBP.
To account for the differential impact of various exposures, the Composite Risk Index was calculated using a weighted approach. Rather than assuming equal contribution, the quartile score (0–3) for each risk factor was multiplied by its global mean absolute SHAP value derived from the Random Forest models. The Composite Risk Index for a country represents the sum of these weighted scores, providing a more accurate reflection of complex risk interactions.
In addition, a pattern of comorbidity was assigned to every country. This was calculated by determining the percentage of the total burden attributed to LBP. Countries with the lowest tertile of this proportion were categorized as “OA-dominant” countries, the countries in the highest tertile as “LBP-dominant” countries, and countries in the middle as “Consistent Area”. Countries were then plotted on a scatter plot based on their composite risk and burden indices, and their color was based on their pattern of comorbidities.
Multi-Dimensional Profile Analysis
A multi-dimensional analysis was performed to combine the economic data with the risk and burden indices. Country-level economic status was categorized based on four income groups (low, lower middle, upper middle, and high income) from the World Bank. GBD location names were harmonized with World Bank country names, so as to permit data linkage.
The resulting data set was visualised with a faceted bubble plot. For each of the comorbidity patterns (OA-dominant, LBP-dominant, and Consistent Area), countries were plotted with the World Bank income group on the horizontal axis and the composite risk index on the vertical axis. The size of each point was scaled to represent the composite burden index and gives a simultaneous picture of the relationships between the economic level of a country, its cumulative exposure to risk, and its total burden of disease.
Quantification of Intervention Effects
The potential impact of risk factor modification was quantified using scenario analysis. The median ASIR for OA and LBP for all countries was used as the baseline burden. Potential reduction by each risk factor was estimated with the mean absolute SHAP value for the risk factor, using the Random Forest models.
Four intervention scenarios were simulated: elimination of OA-specific factors, LBP-specific factors, and shared factors (assessed for both OA and LBP outcomes). For the shared factors scenarios, a cascade effect was included to account for the previously known comorbidity association between OA and LBP. This cascade effect was estimated using a risk linkage coefficient derived from previously published large-scale meta-analyses and epidemiological cohorts detailing the bidirectional risk between the two conditions (0.40 for the elevated risk of LBP incident to OA; 0.35 for the elevated risk of OA incident to LBP).5,6 The corresponding reduction in the comorbid condition was calculated as a product of the primary condition’s ASIR reduction and the linkage coefficient. The indirect cascade reduction for a secondary condition was calculated using the formula: Cascade Reduction = (Direct ASIR Reduction of Primary Condition) * (Linkage Coefficient). The results were visualized with waterfall plots, with which we deconstruct the overall reduction.
Statistical Analysis
A multi-stage statistical approach was adopted for the data analysis. For geographical and co-distribution analyses, countries were ranked and divided into quartiles according to the ASRs. In order to determine the most important risk factors, we trained Random Forest models and decoded them by using SHAP (Shapley Additive exPlanations) values to quantify the contribution of each risk factor. Afterwards, multiple linear regression models using backward stepwise selection were developed to categorize such risk factors as either common to both or specific to the disease. All analyses were performed using R software, and a two-tailed P-value of <0.05 was declared as statistically significant.
Results
Geographical Distribution of the Burden of Disease
To obtain a visual impression of the distribution of disease burden around the globe, countries were categorised according to tertiles of their age-standardized rates (ASR) for LBP and OA. The analysis revealed clear geographical patterns in each condition and how they occur together.
For OA, the highest burden (tertile 3) was consistently seen in high-income regions such as North America, South America, Western Europe, and Australia for all three measures. The lowest burden (tertile 1) was concentrated in sub-Saharan Africa and parts of South and Southeast Asia.
In contrast, the greatest burden of LBP was most prominent in Europe, North Africa, the Middle East, and Central Asia. Regions with the lowest burden of LBP included much of South America, parts of sub-Saharan Africa, and Southeast Asia.
The bivariate maps depicting the concomitant burden of both diseases showed a number of clear patterns. Countries with a high burden of both OA and LBP were found mostly in North America (eg, the United States), Western Europe (eg, Germany, the United Kingdom), and Australia. A pattern of high OA burden with low LBP burden was typical for a lot of countries in South and Central America (eg, Mexico, Peru). Conversely, low OA burden in association with high LBP burden was found in Eastern Europe (eg, Albania) and parts of South Asia (eg, Bangladesh). Regions with a low burden for both conditions were predominantly in sub-Saharan Africa and Southeast Asia (eg, Cambodia, Vietnam). These geographical patterns were fairly consistent across the analyses of incidence, prevalence, and YLD rates (Figure 1).
 |
Figure 1 Global burden patterns of LBP and OA, both sexes combined. |
Risk Factor Significance to OA and LBP
A Random Forest model, along with SHAP analysis, was adopted to determine and rank the importance of 36 risk factors in determining the ASIR of OA and low back pain LBP. The analysis for both sexes combined showed different risk factor profiles for the two conditions.
For OA, the risk factors that had the greatest influence were predominantly environmental and occupational. Lead exposure was the most significant predictor, followed by occupational exposure to particulate matter, gases and fumes, and household air pollution from solid fuels. Other significant contributors included: dietary factors, including a diet high in sugar-sweetened beverages and red meat, and metabolic factors, including high LDL cholesterol. Higher values of these risk factors were generally associated with a higher predicted ASIR of OA.
For LBP, the most significant risks were mainly metabolic, dietary, and ergonomic. High fasting plasma glucose was the single most important predictor. This was followed up by a diet that was deficient in vegetables and occupational ergonomic factors. Low bone mineral density and smoking were also ranked high as predictors. For these factors, an increased exposure level (or, for dietary factors, a higher deficiency level) was associated with an increased predicted ASIR of LBP. The risk factors that had the most effect on LBP were different from those found for OA (Figure 2 and Supplementary Figures 1, 2).
 |
Figure 2 Machine learning and SHAP analysis of risk factors of LBP and OA, both sexes combined. |
Shared and Specific Risk Factors Relating to OA and LBP
A regression-based LASSO analysis was performed to identify risk factors of the combined burden of OA and LBP, as well as to determine factors unique to each condition (Supplementary Figure 3). For the analysis of both sexes combined, five shared risk factors were identified: diet high in processed meat, diet low in milk, diet low in nuts and seeds, high alcohol use, and low bone mineral density. Interestingly, high body mass index was distinguished as an OA-specific risk factor. In contrast, four factors were distinctly LBP-specific: smoking, occupational ergonomic factors, drug use, and a diet low in seafood omega-3 fatty acids (Figure 3 and Supplementary Figures 4, 5).
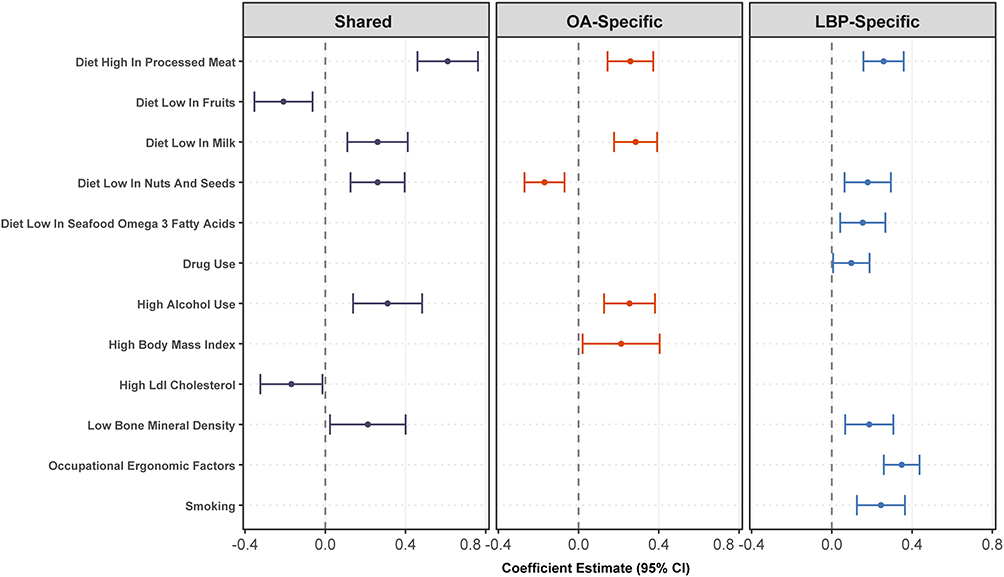 |
Figure 3 Screening of risk factors by regression coefficients for risk factors of LBP and OA, both sexes combined. |
Sex-stratified analyses revealed nuanced differences in risk factor profiles. For females, five shared risk factors were identified, uniquely including a diet high in red meat, while no positive OA-specific factors were selected by the model. Smoking and occupational ergonomic factors remained strongly LBP-specific in females. For males, the shared risk profile expanded to include high body mass index and a diet low in seafood omega-3 fatty acids, leaving high alcohol use as uniquely OA-specific, and drug use alongside ergonomic factors as LBP-specific (Figure 4).
 |
Figure 4 Gender specificity of risk factors of LBP and OA. |
Geographical Distribution of Attributable Burden of Shared Risk Factors
The proportion of osteoarthritis (OA) and low back pain (LBP) due to the identified shared risk factors was also estimated, and a map illustrating their distribution in the world was provided. For each common risk factor, a number of maps are presented illustrating the distribution in location holding the burden attributed to OA alone, LBP alone, and combined co-burden.
For instance, in the analysis that included both sexes, the burden of both OA and LBP due to high body mass index was at the greatest levels in regions with a high prevalence of obesity (ie, North America, some areas in Latin America, and the Middle East). Bivariate maps of bivariate risk factors showed that these were hotspots of areas in which obesity took a large toll for both conditions to co-occur (co-burden pattern 3–3).
The burden due to occupational ergonomic factors showed another pattern. The attributable incidence for LBP was highest in Eastern Europe and Asia (tertile 3), while the attributable burden for OA was less pronounced, but geographically more widespread. Smoking offered a third distinct pattern, with the greatest co-burden for both OA and LBP observed in Eastern European and Southeast Asian countries. In some areas of Western Europe, the combined high OA and low LBP burden (pattern 1–3) was likely due to smoking. Parallel analyses were conducted for all other investigated shared risk factors and by sex (Figure 5).
 |
Figure 5 Global co-burden of LBP and OA attributable risk factors, both sexes combined. (A) Shared risk factors. (B) Disease-specific risk factors. |
Risk-Burden Matrix
A risk-burden matrix was developed to graphically display how the cumulative exposures to key risk factors relate to the total combined burden of disease for osteoarthritis (OA) and low back pain (LBP) for every country. In this matrix, the composite risk index was plotted against the composite burden index for the population for both sexes.
A distinct positive linear association was found, with the result that higher composite risk index countries tended to have higher composite burden of OA and LBP. The matrix analysis identified different clusters of countries. Hungary, Poland, and Czechia were located in the quadrant of high risk, high burden. Conversely, low-risk, low-burden countries such as the Maldives and Myanmar were found in the low-risk, low-burden segment.
The analysis of comorbidity patterns revealed that the LBP dominant pattern was most common among the high-risk, high-burden countries, especially the Eastern European ones. The OA-dominant pattern was mainly located in countries with low to moderate levels of risk and burden, including several countries in Latin America. Countries identified as having a stable burden pattern were scattered throughout the matrix and included high-income countries like the United States, Australia, and New Zealand, which were medium-to-high risk countries with a medium-to-high burden (Figure 6).
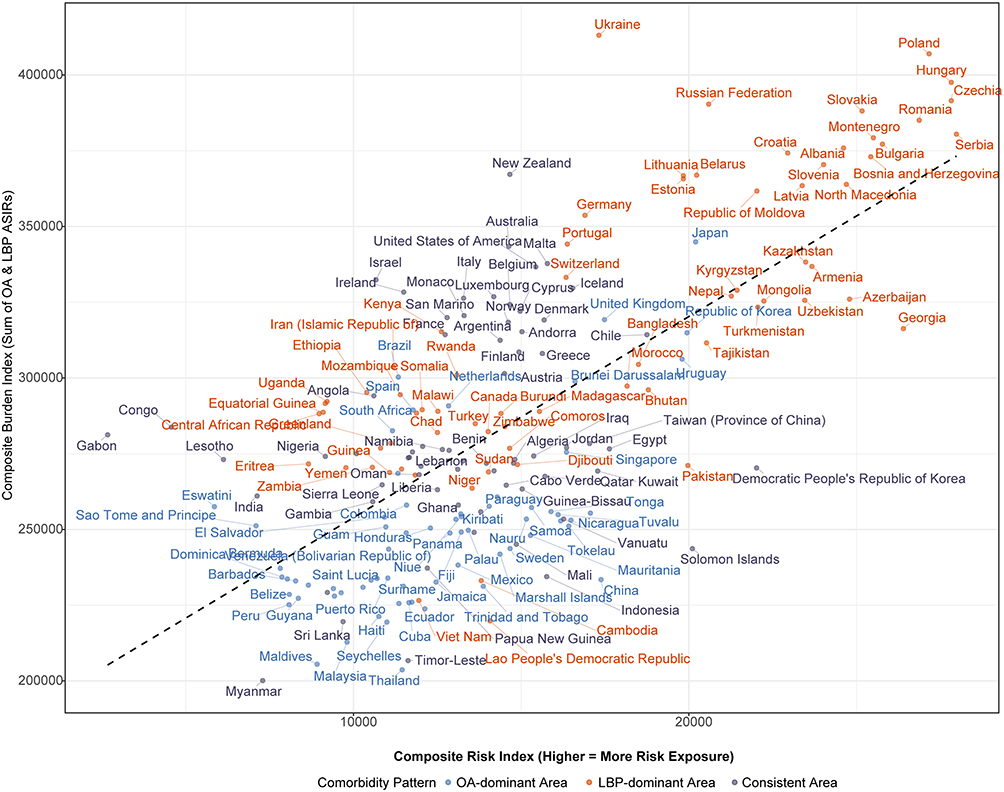 |
Figure 6 Risk-burden matrix of LBP and OA, both sexes. |
Multi-Dimensional Risk, Burden, and Economic Level Profiles
To investigate the interaction between economic status, risk exposure, and disease burden, a multi-dimensional profile was created for both sexes. The countries were stratified by World Bank income group and previously defined comorbidity profile.
A positive association was shown between the economic level and the composite risk index for all three patterns of comorbidity. The overall exposure to the identified risk factors also tended to increase with an increase in national income level. Similarly, the aggregate composite burden, as indicated by the magnitude of the points, was highest in high-income countries.
Countries with an LBP-dominant burden pattern had the highest composite risk scores, especially the upper-middle and high-income countries. Countries with stable burden patterns also followed a similar pattern, with high-income countries in this group also having high risk and burden. In contrast, the OA-dominant pattern was spread over the whole range of income levels and was generally correlated with a lower range of composite risk scores compared to the other two patterns (Figure 7).
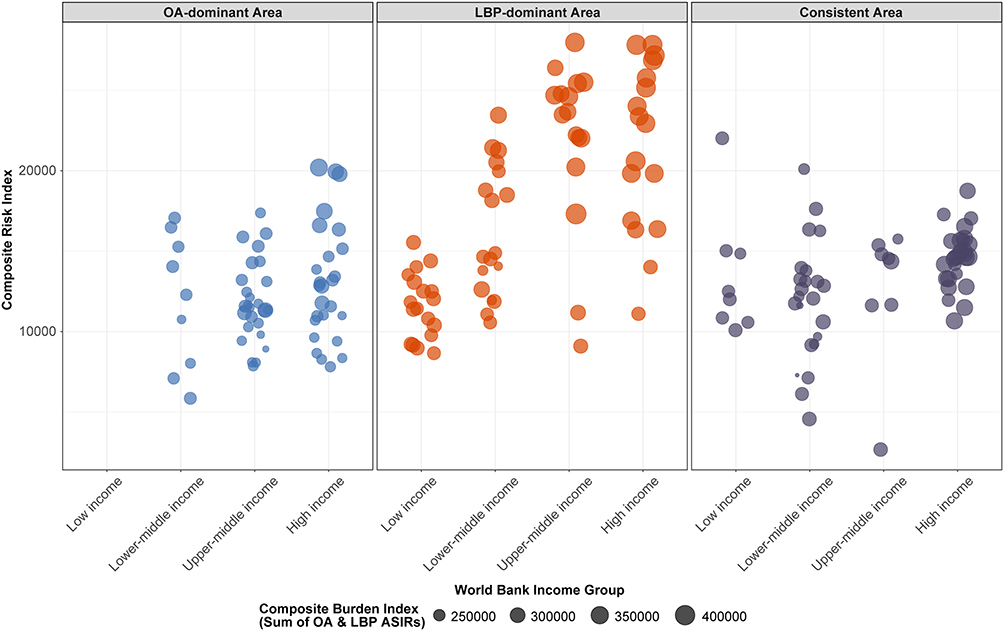 |
Figure 7 The relation between economic level, risk exposure, and disease burden of LBP and OA. |
Estimation of Potential Burden Reduction
We modeled the possible reduction in the age-standardized incidence rate (ASIR) of osteoarthritis (OA) and low back pain (LBP) under hypothetical intervention scenarios. The analysis took into account both the direct effect of risk factor elimination and the indirect cascade effects between the two conditions. For the combined population of both sexes, the mean baseline ASIR was 48,849 per 100,000 for OA and 234,916 per 100,000 for LBP. Eliminating the shared risk factors had the greatest impact. This intervention was calculated to reduce the ASIR of LBP by 12,158, with the greatest direct contributions from low bone mineral density, a diet high in processed meat, and high alcohol use. A cascade effect arising from the concomitant reduction in OA accounted for an additional 228 in the LBP ASIR reduction. The same intervention was estimated to achieve a reduction of the OA ASIR by 5424, of which the vast majority (4772) was driven by the indirect cascade effect from the reduced LBP burden. Interventions focusing on condition-specific risk factors yielded condition-targeted results. Eliminating the four LBP-specific factors (primarily occupational ergonomic factors and smoking) was estimated to directly reduce the LBP ASIR by 9227. Conversely, elimination of the singular OA-specific factor, high body mass index, was estimated to reduce the OA ASIR by 275 (Figure 8).
 |
Figure 8 Decomposition of LBP and OA burden reduction, both sexes combined. |
Discussion
The present study offers a worldwide analysis of the comorbidity between LBP and OA and identifies important insights into the epidemiological patterns, risk factors, and potential for targeted prevention. In this study, the global burden of LBP and OA was mapped, indicating that co-burden patterns are unique to certain regions, which were related to variations in population, environmental risk exposures, and health care systems.
The fact that high OA burden is concentrated in the high-income and sections of South America is consistent with other risk factors, including aging populations and increased obesity rates. However, the large LBP burden observed in Europe and Central Asia could be better associated with occupational variables and other sociocultural views on the problem of back pain. The disparity is especially evident in such regions as South America, where the OA burden is high, and the LBP burden is comparatively low, indicating that various approaches to the population’s health should be used in the case of these two musculoskeletal disorders. The trend of heavy burden of the two diseases in the most developed economies, including the United States and Western Europe, is probably an indication of a similar cause, such as sedentary lifestyles among an aging population. On the other hand, this could be due to younger demographics in the sub-Saharan parts of Africa and Southeast Asia that carry a lower burden. This can also be seen as a sign of under-reporting or variances in access to diagnosis and care, ie, the actual burden may be greater than what is recorded in global datasets.10–13
The application of machine learning and regression modelling offered a novel classification of shared and specific risk factors. Our LASSO-based classification challenges some traditional perspectives. While factors like high body mass index and smoking are universally recognized as musculoskeletal hazards, our model distinguished their primary impact pathways at the population level: high BMI predominantly drives OA-specific burden (though it acts as a shared factor in males), whereas smoking and occupational ergonomic factors are distinctly specific to LBP. Research also revealed distinct primary drivers.2,14–19 For OA, the prominence of environmental factors, such as lead exposure and air pollution, is a notable finding that prompts one to suspect that systemic inflammation caused by environmental toxicants may be more significant than was previously considered.20–23 For LBP, the predominance of the metabolic factors, more specifically high fasting plasma glucose, adds to the increasing body of evidence of association between metabolic syndrome and diabetes with intervertebral disc degeneration.24 This obvious difference between the risk factor profiles highlights the inadequacy of a one-size-fits-all approach to prevention and management.
This analysis of attributable burden allows for comparison between the major risk factors and their varied effect on OA and LBP at the global level. Although some of the risk factors are shared, they do not have a uniform geographical impression. For example, the strong co-burden of high BMI in high-income areas underscores the dual impact of obesity on joint diseases. On the other hand, the burden of occupational factors on LBP is higher in industrializing countries, indicating differences in economic structure and occupational practices.2 The discrete geographic clusters for each risk factor also indicate the need for focused, geographically specific public health interventions. Integrated tobacco control programs may be cost-effective for both diseases in areas with high smoking-attributable co-burden. When work-related factors are the main reasons for LBP, intervention at the workplace ergonomics level would be more appropriate. Integrated prevention programs in practice could include workplace wellness initiatives that simultaneously address ergonomic risk mitigation and provide weight management and smoking cessation support. Urban planning policies that improve access to green spaces and promote active transportation can dually address the physical inactivity linked to LBP and the metabolic risks associated with OA.
The geographical analysis and risk burden matrix combined these findings and uncovered archetypal patterns. For instance, the high-risk, high-burden, LBP-dominant profile for many Eastern European countries is consistent with the high prevalence of smoking and occupational exposures in the region. In contrast, the profile of the OA in many countries in the Americas is associated with the high prevalence of obesity in said region.1 These multi-dimensional profiles imply that national health strategies need to be customized to the local context of risk factor exposure and patterns of existing disease burden. For high-risk, high-burden countries, the adoption of aggressive public health policies for shared risk factors is urgently required.2 For some, a focus on particular types of risk factors, such as metabolic health for LBP or environmental conservation for OA, may be more successful.
The quantification of intervention scenarios further converted these findings into achievable public health targets.25 The large potential reduction in burden based on addressing shared risk factors, including the important cascade effects, is an economic and health argument for integrated prevention programs.26 For example, policies to decrease obesity may have a double dividend, reducing the incidence of both OA and LBP. The cascade effect, whereby reducing the burden of one condition indirectly leads to a lower incidence of the other, is a crucial and often neglected aspect in health economic modelling counted here by our study.
Several limitations must be acknowledged to ensure proper interpretation of our findings. First, as an ecological analysis based on country-level GBD 2021 data, the identified associations represent population-level relationships. Individual-level inference cannot be assumed, and the potential for ecological fallacy must be recognized.27 Second, the cross-sectional nature of the data is a limitation in establishing any temporal relationships. Variation in data quality and completeness across countries, particularly for environmental and occupational exposures, may influence the accuracy of our estimates. Regions with limited access to advanced diagnostic healthcare may systematically underreport the incidence of OA and LBP, leading to an underestimation of the disease burden in lower-income countries and potentially skewing the geographical patterns and related risk factor rankings toward affluent nations. Third, while Random Forest models and SHAP values enhance model interpretability, they reflect predictive importance rather than absolute causal effect sizes. We utilized LASSO regression to mitigate multicollinearity, but residual confounding may remain. Fourth, the comorbidity index and intervention simulations represent simplified, theoretical constructs. Estimates of attributable burden depend on literature-derived relative risks and assume a hypothetical complete elimination of risk factors. Consequently, the modeled cascade effects between OA and LBP represent best-case scenario estimates and may not fully capture population-specific variability. Finally, the relative risk values for the attributable burden calculations were based on literature reviews and are associated with inherent uncertainty.
Conclusions
The co-burden of LBP and OA is a complex phenomenon attributed to both shared and disease-specific risk factors. Intervention simulations demonstrated that targeting shared factors yields the greatest potential reduction in disease burden due to substantial direct benefits and indirect cascade effects between the conditions. Our findings provide compelling evidence to promote the development of integrated public health approaches tailored to regional risk profiles.
Data Sharing Statement
All datasets were provided in the manuscript and Supplementary Materials. Raw data has been supplied by a zip file named “RawData”. The input data used in these analyses can be downloaded from the Global Health Data Exchange GBD 2021 website.
Ethics Approval
This study utilized publicly available, de-identified data from the Global Burden of Disease (GBD) 2021 database. As human subjects were not directly involved, this research is exempt from Institutional Review Board (General Hospital of Ningxia Medical University) approval in accordance with Items 1 and 2 of Article 32 of the Measures for Ethical Review of Life Science and Medical Research Involving Human Subjects (dated February 18, 2023, China).
Author Contributions
All authors made a significant contribution to the work reported, whether that is in the conception, study design, execution, acquisition of data, analysis and interpretation, or in all these areas; took part in drafting, revising or critically reviewing the article; gave final approval of the version to be published; have agreed on the journal to which the article has been submitted; and agree to be accountable for all aspects of the work.
Funding
This work was supported by the Ningxia Natural Science Foundation (2024AAC05082); 2026 Appropriate Health Technology Promotion Project of Ningxia Hui Autonomous Region (2026-NWSY-A001).
Disclosure
The authors declare no competing interests in this work.
References
1. GBD 2021 Osteoarthritis Collaborators. Global, regional, and national burden of osteoarthritis, 1990–2020 and projections to 2050: a systematic analysis for the Global Burden of Disease Study 2021. Lancet Rheumatol. 2023;5(9):e508–15. doi:10.1016/s2665-9913(23)00163-7
2. GBD 2021 Low Back Pain Collaborators. Global, regional, and national burden of low back pain, 1990–2020, its attributable risk factors, and projections to 2050: a systematic analysis of the Global Burden of Disease Study 2021. Lancet Rheumatol. 2023;5(6):e316–e29. doi:10.1016/s2665-9913(23)00098-x
3. Wong AY, Samartzis D, Maher C. The global burden of osteoarthritis: past and future perspectives. Lancet Rheumatol. 2023;5(9):e496–e97. doi:10.1016/s2665-9913(23)00207-2
4. Du H, Li S, Tian Z, et al. Global burden of six musculoskeletal disorders in women of childbearing age from 1990 to 2021. Sci Rep. 2025;15(1):35423. doi:10.1038/s41598-025-19382-z
5. Gandløse JS, Sørensen CWM, Hemmingsen CT, Larsen KW, Palsson TS. Mapping comorbidities in patients with low back pain-a systematic review. Physiother Res Int. 2025;30(4):e70109. doi:10.1002/pri.70109
6. Amarasinghe P, Wadugodapitiya S, Weerasekara I. Biomechanical and clinical relationships between lower back pain and knee osteoarthritis: a systematic review. Syst Rev. 2023;12(1):28. doi:10.1186/s13643-022-02164-3
7. Tushingham S, Cottle J, Adesokan M, et al. The prevalence and pattern of comorbid long-term conditions with low back pain and osteoarthritis in low- and middle-income countries: a systematic review and meta-analysis. Int J Health Promot Educat. 2024:1–25. doi:10.1080/14635240.2024.2332911
8. Roberts KE, Ferreira ML, Beckenkamp PR, et al. Global trends in risk factors for low back pain: an analysis of the global burden of disease study data from 1990 to 2021. Arthritis Care Res. 2025;77(7):837–847. doi:10.1002/acr.25520
9. Mocanu V, Timofte DV, Zară-Dănceanu CM, Labusca L. Obesity, metabolic syndrome, and osteoarthritis require integrative understanding and management. Biomedicines. 2024;12(6):1262. doi:10.3390/biomedicines12061262
10. Segal NA, Nilges JM, Oo WM. Sex differences in osteoarthritis prevalence, pain perception, physical function and therapeutics. Osteoarthritis Cartilage. 2024;32(9):1045–1053. doi:10.1016/j.joca.2024.04.002
11. Pang H, Chen S, Klyne DM, et al. Low back pain and osteoarthritis pain: a perspective of estrogen. Bone Res. 2023;11(1):42. doi:10.1038/s41413-023-00280-x
12. Xu J, Lei M, Xu D. Global, regional, and national burden of low back pain in postmenopausal women from 1990 to 2021: a comprehensive analysis using data from the Global Burden of Disease Study 2021. Front Endocrinol. 2025;16:1683183. doi:10.3389/fendo.2025.1683183
13. Calais-Ferreira L, Pozzobon D, Pinheiro MB, et al. Sex differences in lifetime prevalence of low back pain: a multinational study of opposite-sex twin pairs. Eur J Pain. 2023;27(10):1150–1160. doi:10.1002/ejp.2146
14. Holz JD, Beier E, Sheu TJ, et al. Lead induces an osteoarthritis-like phenotype in articular chondrocytes through disruption of TGF-β signaling. J Orthop Res. 2012;30(11):1760–1766. doi:10.1002/jor.22117
15. Liu JF, Chi MC, Lin CY, et al. PM2.5 facilitates IL-6 production in human osteoarthritis synovial fibroblasts via ASK1 activation. J Cell Physiol. 2021;236(3):2205–2213. doi:10.1002/jcp.30009
16. Peng KT, Liu JF, Chiang YC, et al. Particulate matter exposure aggravates osteoarthritis severity. Clin Sci. 2019;133(21):2171–2187. doi:10.1042/cs20190458
17. Gong G, Yan Z, Lai Q, et al. Inflammation preservation strategy: reconciling pain control and disc resorption in lumbar disc herniation. Front Immunol. 2025;16:1653681. doi:10.3389/fimmu.2025.1653681
18. Ding L, Dai R, Jin D, et al. Age-specific comorbidity risks in osteoarthritis: implications for healthy aging across diverse populations. Arch Public Health. 2025;83(1):174. doi:10.1186/s13690-025-01670-9
19. Stamenkovic BN, Rancic NK, Bojanovic MR, et al. Is osteoarthritis always associated with low bone mineral density in elderly patients? Medicina. 2022;58(9):1207. doi:10.3390/medicina58091207
20. Courties A, Kouki I, Soliman N, Mathieu S, Sellam J. Osteoarthritis year in review 2024: epidemiology and therapy. Osteoarthritis Cartilage. 2024;32(11):1397–1404. doi:10.1016/j.joca.2024.07.014
21. Xia F, Li Q, Luo X, Wu J. Identification for heavy metals exposure on osteoarthritis among aging people and Machine learning for prediction: a study based on NHANES 2011–2020. Front Public Health. 2022;10:906774. doi:10.3389/fpubh.2022.906774
22. Nedunchezhiyan U, Varughese I, Sun AR, et al. Obesity, inflammation, and immune system in osteoarthritis. Front Immunol. 2022;13:907750. doi:10.3389/fimmu.2022.907750
23. Liu X. Air pollution and its impact on people with osteoarthritis. Osteoarthritis Cartilage. 2025. doi:10.1016/j.joca.2025.08.007
24. Li S, Du J, Huang Y, et al. From hyperglycemia to intervertebral disc damage: exploring diabetic-induced disc degeneration. Front Immunol. 2024;15:1355503. doi:10.3389/fimmu.2024.1355503
25. Lu Y, Xiao W, Tao K. Global burden of osteoarthritis attributable to high body mass index, 1990 to 2021: insights from the global burden of disease study 2021. Arthritis Rheumatol. 2025;77(11):1503–1511. doi:10.1002/art.43241
26. Kopec JA, Sayre EC, Cibere J, et al. Reducing the burden of low back pain: results from a new microsimulation model. BMC Musculoskelet Disord. 2022;23(1):804. doi:10.1186/s12891-022-05747-2
27. Bhak Y, Ahn TK, Peterson TA, Han HW, Nam SM. Machine learning models for low back pain detection and factor identification: insights from a 6-year nationwide survey. J Pain. 2024;25(8):104497. doi:10.1016/j.jpain.2024.02.011
 © 2026 The Author(s). This work is published and licensed by Dove Medical Press Limited. The
full terms of this license are available at https://www.dovepress.com/terms
and incorporate the Creative Commons Attribution
- Non Commercial (unported, 4.0) License.
By accessing the work you hereby accept the Terms. Non-commercial uses of the work are permitted
without any further permission from Dove Medical Press Limited, provided the work is properly
attributed. For permission for commercial use of this work, please see paragraphs 4.2 and 5 of our Terms.
© 2026 The Author(s). This work is published and licensed by Dove Medical Press Limited. The
full terms of this license are available at https://www.dovepress.com/terms
and incorporate the Creative Commons Attribution
- Non Commercial (unported, 4.0) License.
By accessing the work you hereby accept the Terms. Non-commercial uses of the work are permitted
without any further permission from Dove Medical Press Limited, provided the work is properly
attributed. For permission for commercial use of this work, please see paragraphs 4.2 and 5 of our Terms.