Back to Journals » OncoTargets and Therapy » Volume 14
Global Characterization of Immune Infiltration in Clear Cell Renal Cell Carcinoma
Authors Zheng Y, Wen Y, Cao H, Gu Y, Yan L, Wang Y, Wang L, Zhang L ![]() , Shao F
, Shao F
Received 21 September 2020
Accepted for publication 3 February 2021
Published 22 March 2021 Volume 2021:14 Pages 2085—2100
DOI https://doi.org/10.2147/OTT.S282763
Checked for plagiarism Yes
Review by Single anonymous peer review
Peer reviewer comments 2
Editor who approved publication: Dr XuYu Yang
Yan Zheng,1,* Yibo Wen,2,* Huixia Cao,1 Yue Gu,1 Lei Yan,1 Yanliang Wang,1 Limeng Wang,1 Lina Zhang,1 Fengmin Shao1
1Henan Provincial Key Laboratory of Kidney Disease and Immunology, Henan Provincial People’s Hospital, Zhengzhou, 450052, Henan, People’s Republic of China; 2Clinical Systems Biology Laboratories, The First Affiliated Hospital of Zhengzhou University, Zhengzhou, 450052, Henan, People’s Republic of China
*These authors contributed equally to this work
Correspondence: Fengmin Shao
Henan Provincial Key Laboratory of Kidney Disease and Immunology, Henan Provincial People’s Hospital, Henan, People’s Republic of China
Email [email protected]
Background: Immunotherapy has revolutionized the treatment of clear cell renal cell carcinoma (ccRCC). However, the therapy is constrained by drug resistance. Therefore, further characterization of immune infiltration in ccRCC is needed to improve its efficacy.
Methods: Here, we adopted the CIBERSORT method to analyze the level of 22 immune cells, and analyzed the correlation of immune cells and clinical parameters in ccRCC in The Cancer Genome Atlas. We used consensus clustering to cluster ccRCC and identified differently expressed genes (DEGs) between hot and cold tumors using the “Limma” package, and then performed enrichment analysis of DEGs. Finally, we constructed and validated a Cox regression model using the “survival”, “glmnet”, and “survivalROC” packages, implemented in R.
Results: Regulatory T cells upregulated in tumor tissue increased during tumor progression, and correlated with poor overall survival in ccRCC. Consensus clustering identified four clusters of ccRCC. To elucidate the underlying mechanisms of immune cell infiltration, we subdivided these four clusters into two major types, immune hot and cold, and identified DEGs between them. The results revealed different transcription profiles in the two tumor types, with hot tumors being enriched in immune-related signaling, whereas cold tumors were enriched in extracellular matrix remodeling and the phosphatidylinositol 3-kinase–AKT (PI3K/AKT) pathway. We further identified hub genes and prognostic-related genes from the DEGs, and constructed a Cox regression model for predicting the overall survival of patients with ccRCC. The areas under the receiver operating characteristics curve for the risk model for the training, testing, and external Zhengzhou validation cohorts were 0.834, 0.733, and 0.812, respectively. Notably, gene sets in the prediction model could also predict the overall survival of patients receiving immunotherapy.
Conclusion: These findings provide a comprehensive characterization of immune infiltration in ccRCC, while the constructed model can be used effectively to predict the overall survival of ccRCC patients.
Keywords: clear renal cell carcinoma, transcriptome profiling, immune infiltration, Cox risk model
Introduction
Renal cell carcinoma is a common urinary malignancy that accounts for about 5% and 3% of all malignant tumors in male and female cases, respectively. In the urinary system, the incidence rate of renal cell carcinoma is second to bladder cancer. The global cancer statistics of 2020 predicted that there will be 73,750 new cases and approximately 14,830 deaths from kidney cancer.1 Clear cell renal cell carcinoma (ccRCC) is the most common type of renal carcinoma, accounting for about 70% of all renal cell carcinoma cases.2 ccRCC is characterized by robust lipid and glycogen accumulation.3 Alteration of hypoxia-induced factor (HIF) signaling and activation of its downstream genes, including vascular endothelial growth factor (VEGF) and platelet-derived growth factor (PDGF), activates the mammalian targets of the rapamycin (mTOR) signaling pathway.4 Over the past decade, treatment therapies for ccRCC have mainly employedreceptor tyrosine kinase inhibitors that target VEGF signaling, such as sunitinib. However, the efficiency of this therapy has been limited by acquired resistance.5
Immunotherapy has revolutionized the therapies for treating tumors.6 For example, accumulating evidence suggests that blockade of an immune checkpoint (programmed cell death ligand-1 [PD-L1]) alone or in combination with bevacizumab prolongs patient survival.7–9 However, response rates vary depending on the tumor, with most limited to 10–25%. Furthermore, some patients do not respond to immunotherapy, whereas those who initially respond to immune checkpoint inhibitors are reported to develop disease progression, commonly known as innate and acquired resistance.10 Resistance to immunotherapy is mainly attributed to a complex tumor microenvironment (TME) generated by immune and stromal cells, extracellular matrix molecules, and numerous cytokines and chemokines. The TME, which is in a dynamic state, is associated with prognosis of patients.11 Immune escape of tumor cells is one of the crucial mechanisms resulting in disease progression.12 Consequently, immunotherapy based on restoring the function of the immune system in patients has become the fourth type of available tumor therapy, after surgery, chemotherapy, and radiotherapy. Therefore, understanding the underlying molecular mechanisms and cell composition of the TME is critical to developing therapies to effectively manage cancer progression and the immune response.13,14
Advances in next-generation sequencing technology have enabled the identification of numerous genetic alterations and enhanced the characterization of tumor heterogeneity. In particular, bioinformatics analysis provides researchers with convenient and user-friendly platforms, guiding the implementation of basic experiments.15 The comprehensive use of biology, computer science, and information technology allows the generation of datasets that can be used to analyze the immune infiltration in tumor tissues.16,17 To date, the role of immune infiltration in ccRCC remains unknown.
In this study, we analyzed 22 immune cells in ccRCC and evaluated the association between immune infiltration and clinical pathological parameters. Furthermore, we identified four ccRCC clusters, based on infiltration patterns of the immune cells, and elucidated the underlying mechanisms of infiltration of immune cells by redefining the four clusters as two major subtypes, referred to as hot and cold tumors. Our results indicated that alterations of extracellular matrix remodeling, and phosphatidylinositol 3-kinase–AKT (PI3K/AKT) signaling, inhibit immune infiltration. We also constructed a Cox regression model, based on the differently expressed gene (DEGs), and validated it in our clinical cohort to predict the overall survival of ccRCC patients. Taken together, our findings provide new insights into the mechanisms regulating immune cell infiltration. The model established herein provides a reliable method for predicting the overall survival of ccRCC patients.
Materials and Methods
Ethics Statement
Kidney renal clear cell carcinoma specimens were obtained from patients at the First Affiliated Hospital of Zhengzhou University. All participants signed an informed consent form approved by the ethics committee of the First Affiliated Hospital of Zhengzhou University prior to inclusion in the study (ethics number: 2019–1Y89). The study was conducted in accordance with the Declaration of Helsinki and approved by the ethics committee of the First Affiliated Hospital of Zhengzhou University.
Data Collection and Multiple Analysis Strategy Construction
RNA-sequencing data and clinical information on ccRCC patients were downloaded from the UCSC Cancer Browser (https://genome-cancer.ucsc.edu), as the log2(x+1)-transformed RSEM normalized count. Processed RNA sequencing datasets, as well as clinical information for metastatic urothelial cancer and renal cell carcinoma with immunotherapy, were downloaded from a previously reported platform.18,19 The strategies used in the analysis are shown in Figure 1.
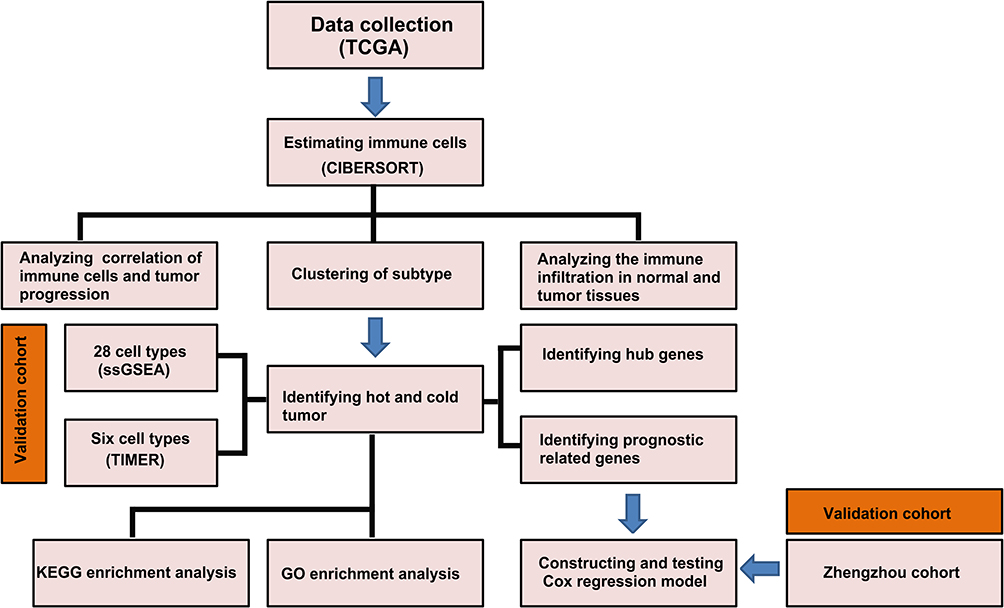 |
Figure 1 Workflow of the study: schematic representation of the multi-step analysis strategy. |
Analysis of Relationship Between Immune Infiltration and Clinical Parameters
For this part of analysis, patients with complete information on gender, age, pathological TNM stage, and overall survival were selected. In contrast, patients were excluded if these parameters were missing or unknown. The chi-squared test was used to analyze the correlations between immune infiltration and gender, age, and pathological TNM stage. The log-rank test was used to analyze differences in overall survival and level of immune infiltration. Heatmaps, Kaplan–Meier curves, and forest plots were used to visualize the results.
Immune Cell Estimation
We used the package “CIBERSORT”, implemented in R software, to estimate 22 types of immune cells in ccRCC samples, then selected samples with p<0.05 for further analysis.20,21 The package “ssGSEA” was used to calculate immune cells in supplied cell markers of 28 cell types.22 Data for six cell types were downloaded from the online tool TIMER (https://cistrome.shinyapps.io/timer/).23 We used “ESTIMATE” to calculate immune and stromal scores, as well as tumor purity.
Enrichment and Protein–Protein Network Analyses
DEGs in both hot and cold tumors, with p<0.05, were selected for enrichment analysis. GO enrichment was performed using the “clusterprofile” package, for which p<0.05 and q<0.05 were selected, whereas KEGG pathway analysis was performed using the online tool Database for Annotation, Visualization and Integrated Discovery (DAVID, https://david.ncifcrf.gov/), with FDR<0.05 being selected. PPI networks were constructed using the online tool STRING (https://string-db.org/), and we used confidence=0.9 to select the most reliable interactive genes. The top 10 hub genes were identified by “cytoHubba” tools in Cytoscape.
Consensus Clustering
Consensus clustering of the 22 immune cells was performed using the “ConsensusClusterPlus” package, with reps=100, pItem=0.8, and pfeature=1. The optimal number of clusters was determined using heatmaps and delta diagrams.
Analysis of Differently Expressed Genes
We divided the four clusters into two groups, based on their immune scores and immune cell infiltration. Cluster 4 was redefined as hot tumors, while clusters 1, 2, and 3 were redefined as cold tumors. Then, we applied the “limma” package to calculate DEGs using the following criteria: logFC>1 or <−1 and adjusted p value <0.05. The DEGs were visualized as volcano plots and heatmaps using the “ggplot2” and “pheatmap” packages.
Construction of a Prediction Model
RNA sequence data for ccRCC with survival information was first randomly divided into training and testing sets, using the “caret” package, with 50% in each of the training and testing sets. Then, DEGs in the hot and cold tumor groups were used for univariate survival analysis, and those genes with p<0.05 were selected. Thereafter, the “glmnet” package was used to perform LASSO regression analysis with maxit=20,000. A stepwise proportional hazards model was adopted for model optimization. Survival analysis was performed using the “survival” package, and receiver operating characteristic (ROC) curves were generated using “survivalROC”.
Quantitative Real-Time Polymerase Chain Reaction (qRT-PCR)
Fresh tumor specimens were obtained from patients undergoing surgery, then washed three times with PBS. Total RNA was isolated from the tumor tissues using Trizol reagent (TaKaRa, Tokyo, Japan), according to the manufacturer’s instructions. The concentration and purity of the RNA were determined using NanoDrop 2000 (Thermo Fisher Scientific, MA, USA), then 1 µg was used to generate complementary DNA (cDNA) using the ReverTra Ace qPCR RT Kit (Toyobo, Osaka, Japan). Primers used for the study were designed by and purchased from Sangon Biotech (Shanghai, China). Their sequences are listed in Table 1. Glyceraldehyde-3-phosphate dehydrogenase (GAPDH) was used as an internal amplification control.
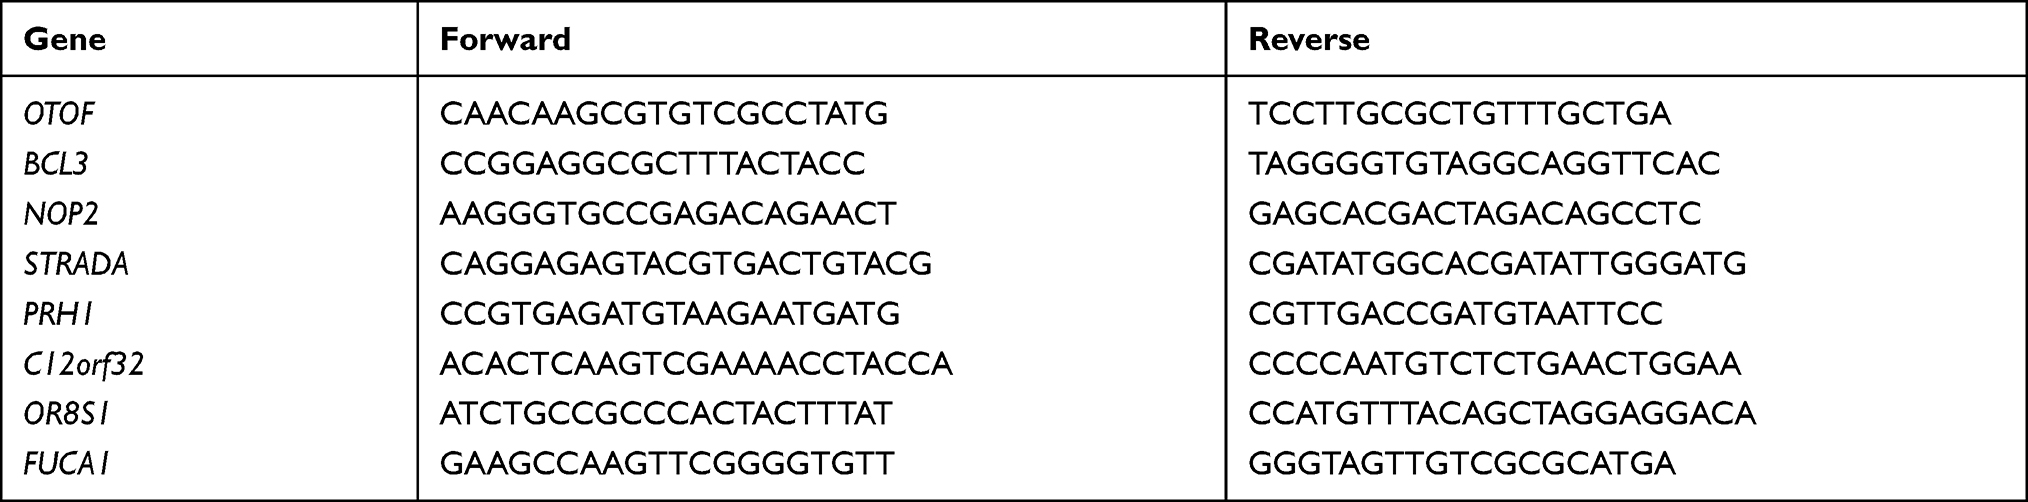 |
Table 1 Primers Used in This Study |
Statistical Analyses
All statistical analyses were performed in R version 3.5.1. To correlate immune infiltration and clinical pathological parameters, we divided the cells into two groups based on the clinical parameters, then applied the chi-squared test to analyze their relationships. Comparison of the infiltration of immune cells between normal and tumor tissues, as well as in hot and cold tumors, was performed using the Wilcoxon test. Immune and stromal scores, as well as tumor purity among the four clusters, were compared using analysis of variance (ANOVA). For survival analysis, p values were calculated using the log-rank test, with statistical significance set at p<0.05.
Results
Relationship Between Immune Infiltration and Clinical Parameters in ccRCC
To understand the role of immune infiltration in ccRCC, we first calculated the proportion of the 22 immune cells using CIBERSORT and evaluated the relationships between immune infiltration and clinical pathological parameters, including gender, age, pathological TNM stage, and overall survival. The results revealed higher levels of T-regulatory cells (hereafter referred to as Tregs) and neutrophils, but lower levels of plasma cells, in male than female patients. Moreover, Tregs as well as CD8+ T and follicular helper cells (hereafter referred to as Tfhs cells) increased during tumor progression. In contrast, M2 macrophages (hereafter referred to as M2) and resting mast cells decreased, indicating that M2 and Tregs may play different roles in mediating immunosuppressive function. Notably, we found elevated levels of resting cells in older patients (Figure 2A). Survival analysis revealed an association between higher infiltration of naïve B cells and good survival of patients, whereas Tregs, plasma cells, neutrophils, and Tfhs predicted unfavorable outcomes (Figure 2B–G). Overall, these results indicate that immune cells can predict malignant features of tumors, and the increased infiltration of immune cytotoxic cells is accompanied by immunosuppressive cells.
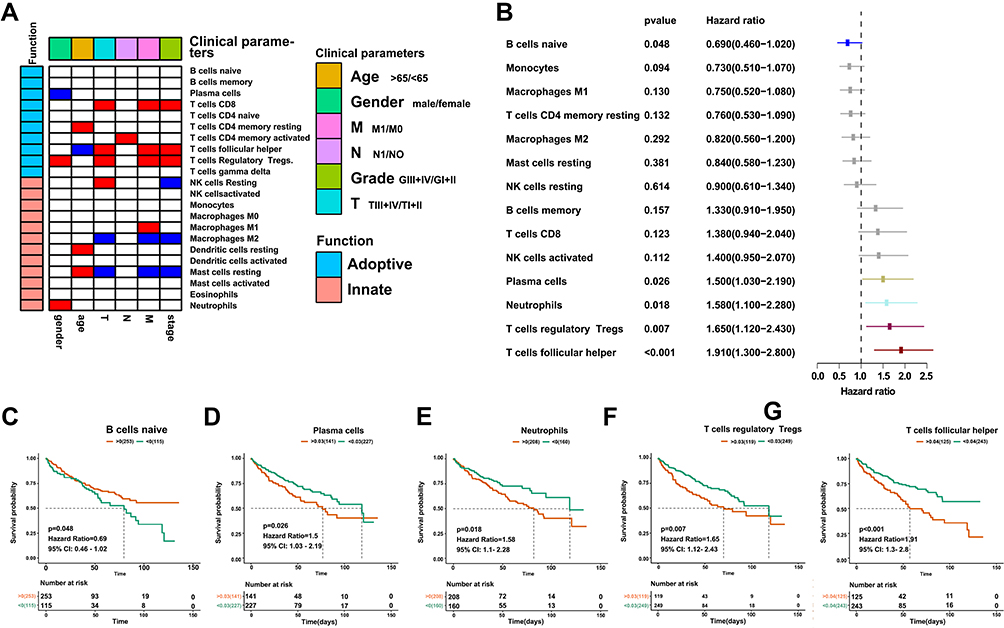 |
Figure 2 Correlation between immune infiltration and clinical parameters in ccRCC. (A) Heatmap showing the relationship between immune infiltration and clinical pathological parameters. Red denotes significant upregulation in patients with age >65 years, male, M1 stage, N1 stage, grade II–III, and T1; blue indicates downregulation; and white shows no significance. (B) Forest plot showing the relationship between immune infiltration and overall survival. (C–G) Kaplan–Meier curves showing the relationship between infiltration of naïve B cells, plasma cells, neutrophils, Tregs and Tfhs, and overall survival. |
Patterns of Immune Cell Infiltration in Normal and Tumor Tissues
To explore patterns of immune cell infiltration in normal and tumor tissues, we first estimated the proportion of immune cells in each sample. The results revealed different ratios across each cell type, affirming the heterogeneity of ccRCC (Figure 3A and B). Next, we compared levels of infiltration between tumor and normal tissues, and found that most cells responding to immune stimulation, including CD8+ T cells, Tfhs, and M1 macrophages (hereafter referred to as M1), increased the infiltration in tumor tissues. Notably, there was no significant difference in the infiltration of innate immune cells between tumor and normal tissues. In contrast, some types of naïve and resting cells were more abundant in normal than in tumor tissues (Figure 3C). These results indicate that immune cells accumulate in tumor tissues in response to the stimulation of neoantigens expressed in tumor cells.
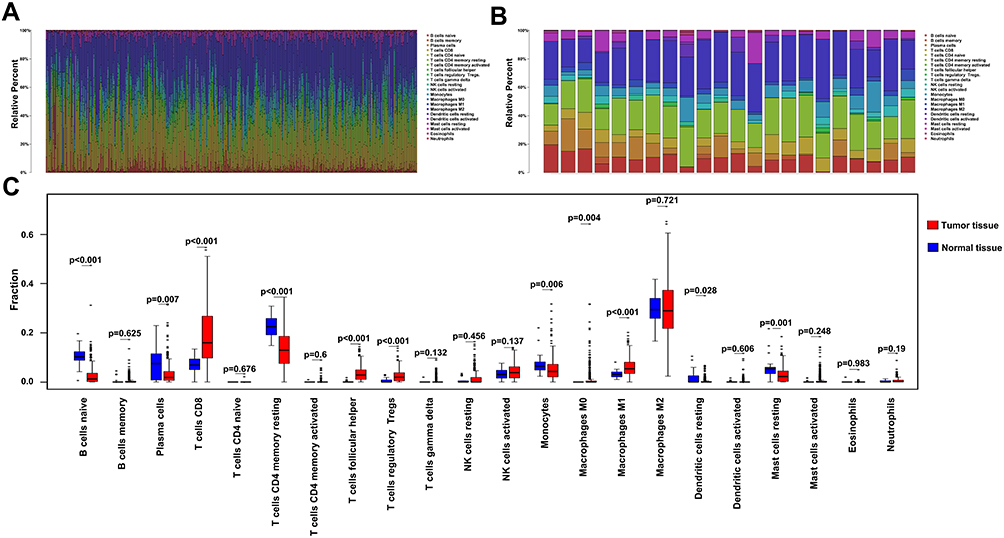 |
Figure 3 Profiles of immune cell infiltration in normal and tumor tissues. (A) Barplot showing distribution of the 22 immune cells in tumor tissues. (B) Barplot showing distribution of the 22 immune cells in normal tissues. (C) Boxplots showing infiltration of the 22 immune cells in normal and tumor tissues. |
Patterns of Immune Cells in Tumor and Normal Tissues
Immune activation and inhibition require a synergistic interaction among multiple cells. To this end, we sought to understand the relationship among the 22 immune cells between tumor and normal tissues. The results revealed a weak correlation in immune cells in normal tissues relative to those in tumor tissues. In particular, CD8+ T cells were positively correlated with Tfhs, activated natural killer (NK), mast, and dendritic cells, indicating that these cells interact during the immune response. Notably, CD8+ T cells were also positively correlated with Tregs, but negatively associated with M2, indicating that Tregs and M2 may have different functions in the inhibition of the immune response mediated by CD8+ T cells. Similarly, M2 was also negatively correlated with Tfh and activated NK cells, with these correlations not being observed in normal tissues. In contrast, CD4 activated memory T cells were positively correlated with monocytes, neutrophils, and eosinophils. Based on these results, we used consensus clustering to group the 22 immune cells in tumor tissues (Figure 4A and B). Results from the heatmap and delta diagrams revealed that the ccRCC could be divided into four clusters, revealing different infiltration patterns (Figure 4C and D).
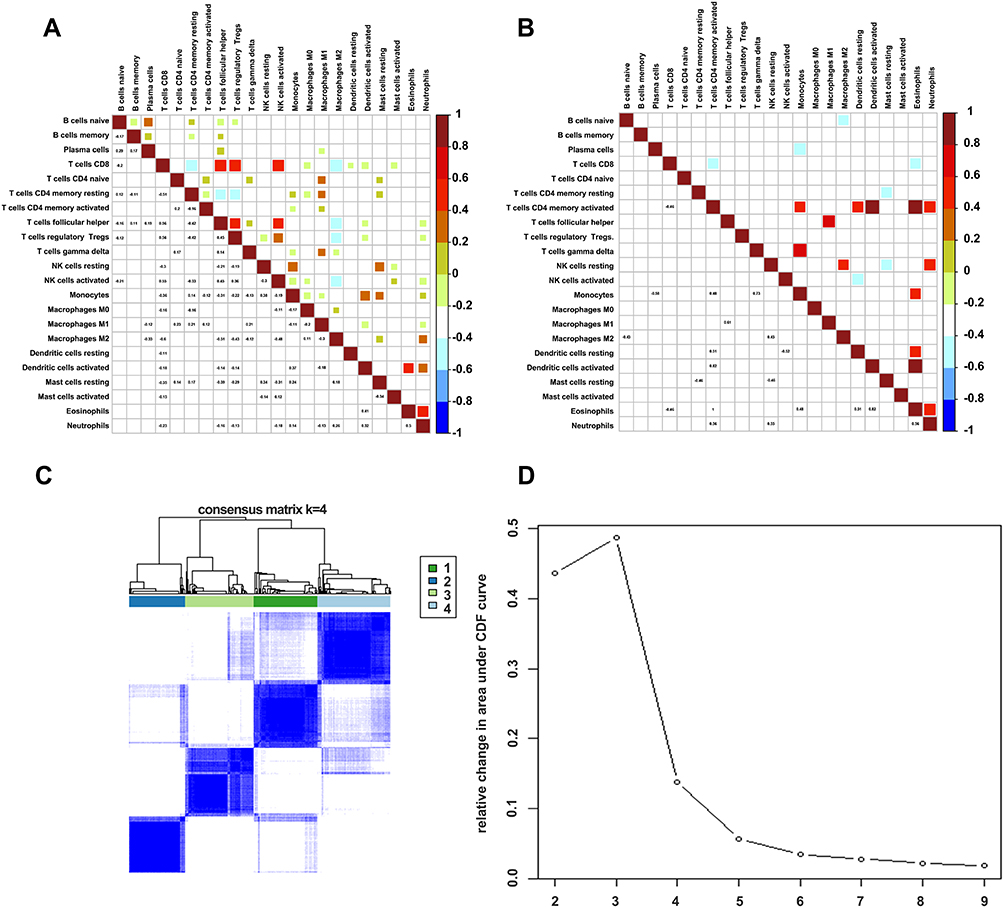 |
Figure 4 Correlations of immune cells between tumor and normal tissues. (A) Corrplot showing the relationship among the 22 immune cells in tumor tissues. (B) Corrplot showing the relationship among the 22 immune cells in normal tissues. (C) Heatmap showing the clusters of immune cells. (D) Delta diagram showing the change in area under the curve as the cluster changes. |
Immune Subtyping of ccRCC
We generated a heatmap showing the distribution of the 22 immune cells and used it to understand patterns of infiltration of immune cells across the four ccRCC clusters. Cluster 1 was mainly enriched in innate immune and CD4 adoptive immune cells, including dendritic cells, mast cells, eosinophils, macrophages, naïve, and memory-activated CD4+ T cells. Cluster 2 was mainly enriched in naïve B cells, plasma cells, M2, and monocytes, Cluster 3 was moderately enriched in B cells, CD8+ T cells, M1, and Tfhs, whereas cluster 4 was highly enriched in activated immune cells, including CD8+ T cells, Tfhs, and M1 cells. These cells play a vital role in antigen presentation and immune response, indicating an immune activation in cluster 4. Notably, cluster 4 also exhibited a high infiltration of Treg cells, suggesting that immune activation is further accompanied by TME-mediated immune suppression (Figure 5A). To further characterize the four ccRCC clusters, we calculated immune and stromal scores, as well as tumor purity. Just as in the above results, cluster 4 had the highest immune score relative to the other three clusters, but exhibited the lowest stromal and tumor purity scores (Figure 5B–D).
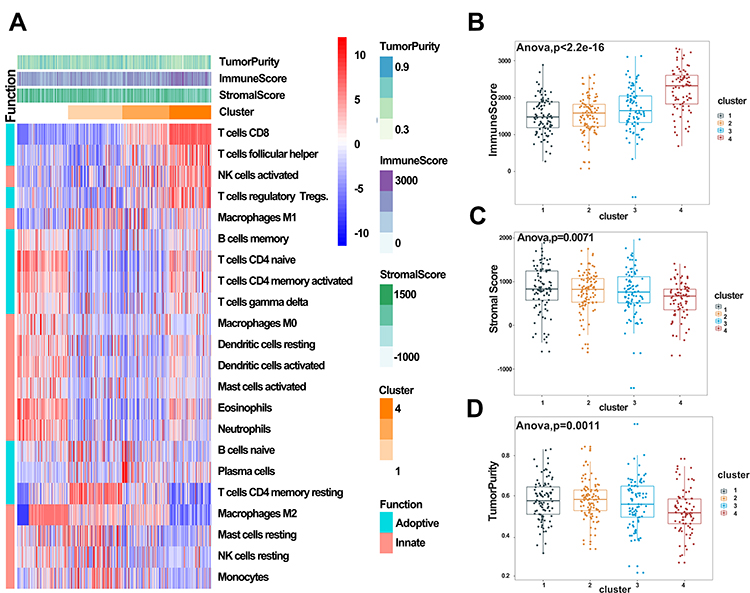 |
Figure 5 Immune subtyping of KIRC. (A) Heatmap showing immune clusters of KIRC. (B–D) Immune, stromal, and tumor purity scores in the four clusters. |
Signaling Alterations in Hot and Cold Tumors
Accumulating evidence suggests that immunotherapy has potential benefits in patients with high immune infiltration in tumors, called hot tumors. In contrast, tumors with low levels of immune cells reportedly resist immunotherapy.18,24 From our earlier results, it was evident that clusters 1, 2, and 3 had lower immune scores than cluster 4, although some immune cells, excluding CD8+ T cells, were enriched in these clusters. To elucidate the mechanisms regulating immune cell infiltration in tumors, we redivided the four ccRCC clusters into two major groups, hot and cold tumors, with cold tumors comprising clusters 1, 2, and 3, and hot tumors comprising cluster 4. We then applied two other methods to estimate and compare immune cells between the tumor groups. The results indicated that more immune and antigen-presenting cells were highly infiltrated in hot than in cold tumors, affirming our definition of ccRCC (Figure 6A and B). DEGs between the groups revealed different patterns between hot and cold tumors (Figure 6C and D). In particular, immune-related genes, such as CD8A, CD8B, GZMK, and IFNG, were upregulated in hot tumors, whereas those involved in extracellular matrix organization and the PI3K/AKT signaling pathway were highly expressed in cold tumors. GO and KEGG enrichment analyses further confirmed high immune activation in hot tumors, where cytokine–cytokine receptor interaction, T-cell receptor signaling pathway, and NK cell-mediated cytotoxicity were all enriched. Enriched DEGs in cold tumors were associated with extracellular matrix organization, extracellular matrix receptors, and PI3K/AKT signaling (Figure 6E–H). Overall, these results suggest that extracellular remodeling in the tumor environment may prevent immune cell infiltration, and this effect may be triggered by oncogenic signaling.
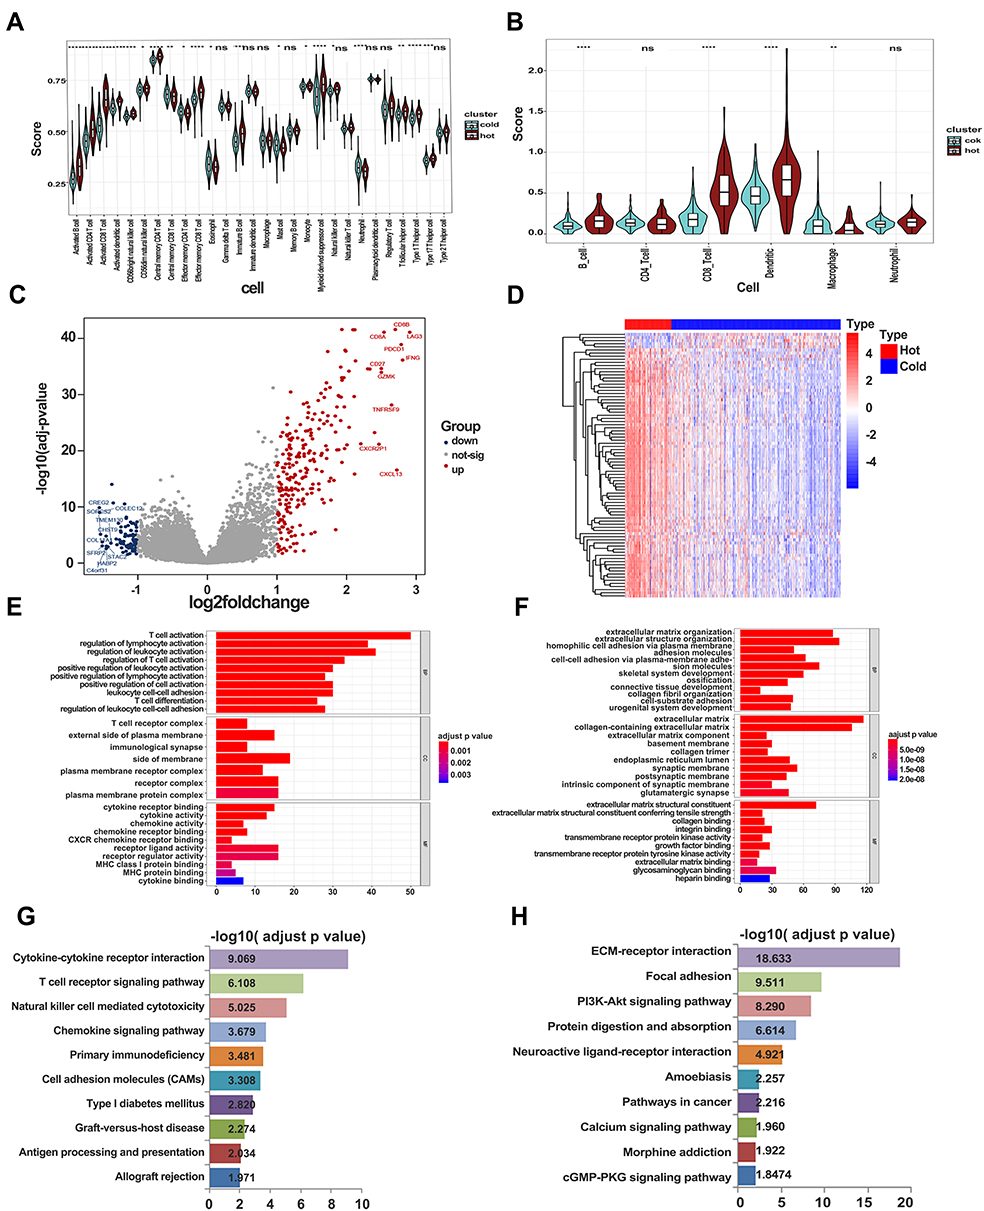 |
Figure 6 Signaling alterations in hot and cold tumors. (A) Immune infiltration in hot and cold tumors calculated by ssGSEA. (B) Immune infiltration in hot and cold tumors calculated by TIMER. (C) Volcano plot showing differentially expressed genes between hot and cold tumors. (D) Heatmap showing expression of differentially expressed genes in hot and cold tumors. (E) GO enrichment analysis in hot tumor. (F) GO enrichment analysis in cold tumor. (G) KEGG analysis in hot tumor. (H) KEGG analysis in cold tumor. |
Identification of Hub and Prognostic Genes
We further explored the function of the identified DEGs, between hot and cold tumors, by constructing PPI networks and identifying hub genes. The top 10 hub genes in hot tumors were those associated with the immune response, including cytokine molecular (IFNG, GZMA, GZMB, FASLG, and PRF1), chemokine receptor (CCR5 and CXCR3), immune checkpoint (CTLA4), and immune modulator (KLRK1) genes (Figure 7A). On the other hand, the top 10 hub genes in cold tumors were mainly those that regulate the extracellular matrix, consistent with the above results (Figure 7B). Next, we used The Cancer Genome Atlas (TCGA) and our external cohort to ascertain the role of DEGs in predicting the overall survival of ccRCC patients. Detailed information on the patients is listed in Table 2. First, we randomly divided patients in TCGA dataset into training and testing sets, based on equal mortality rates, and performed a uni-Cox analysis, in which genes with p<0.05 were selected, and then applied a LASSO regression model in the training cohort (Figure 7C). To optimize the model, we applied a stepwise multi-Cox regression model to select the most predictive genes. The results revealed a set comprising eight genes, with seven genes upregulated in hot tumors and one in cold tumors. Detailed information on the eight genes is provided in Table 3 (Figure 7D). Thereafter, we calculated a risk score for each patient in TCGA and validation cohorts using the following formula: Risk value= (0.2928 × OTOF expression) + (0.6238 × BCL3 expression) − (0.4764 × NOP2 expression) + (0.8631 × STRADA expression) + (0.2737 × PRH1 expression) + (0.5369 × C12orf32 expression) + (1.0196 × OR8S1 expression) – (0.5457 × FUCA1 expression).
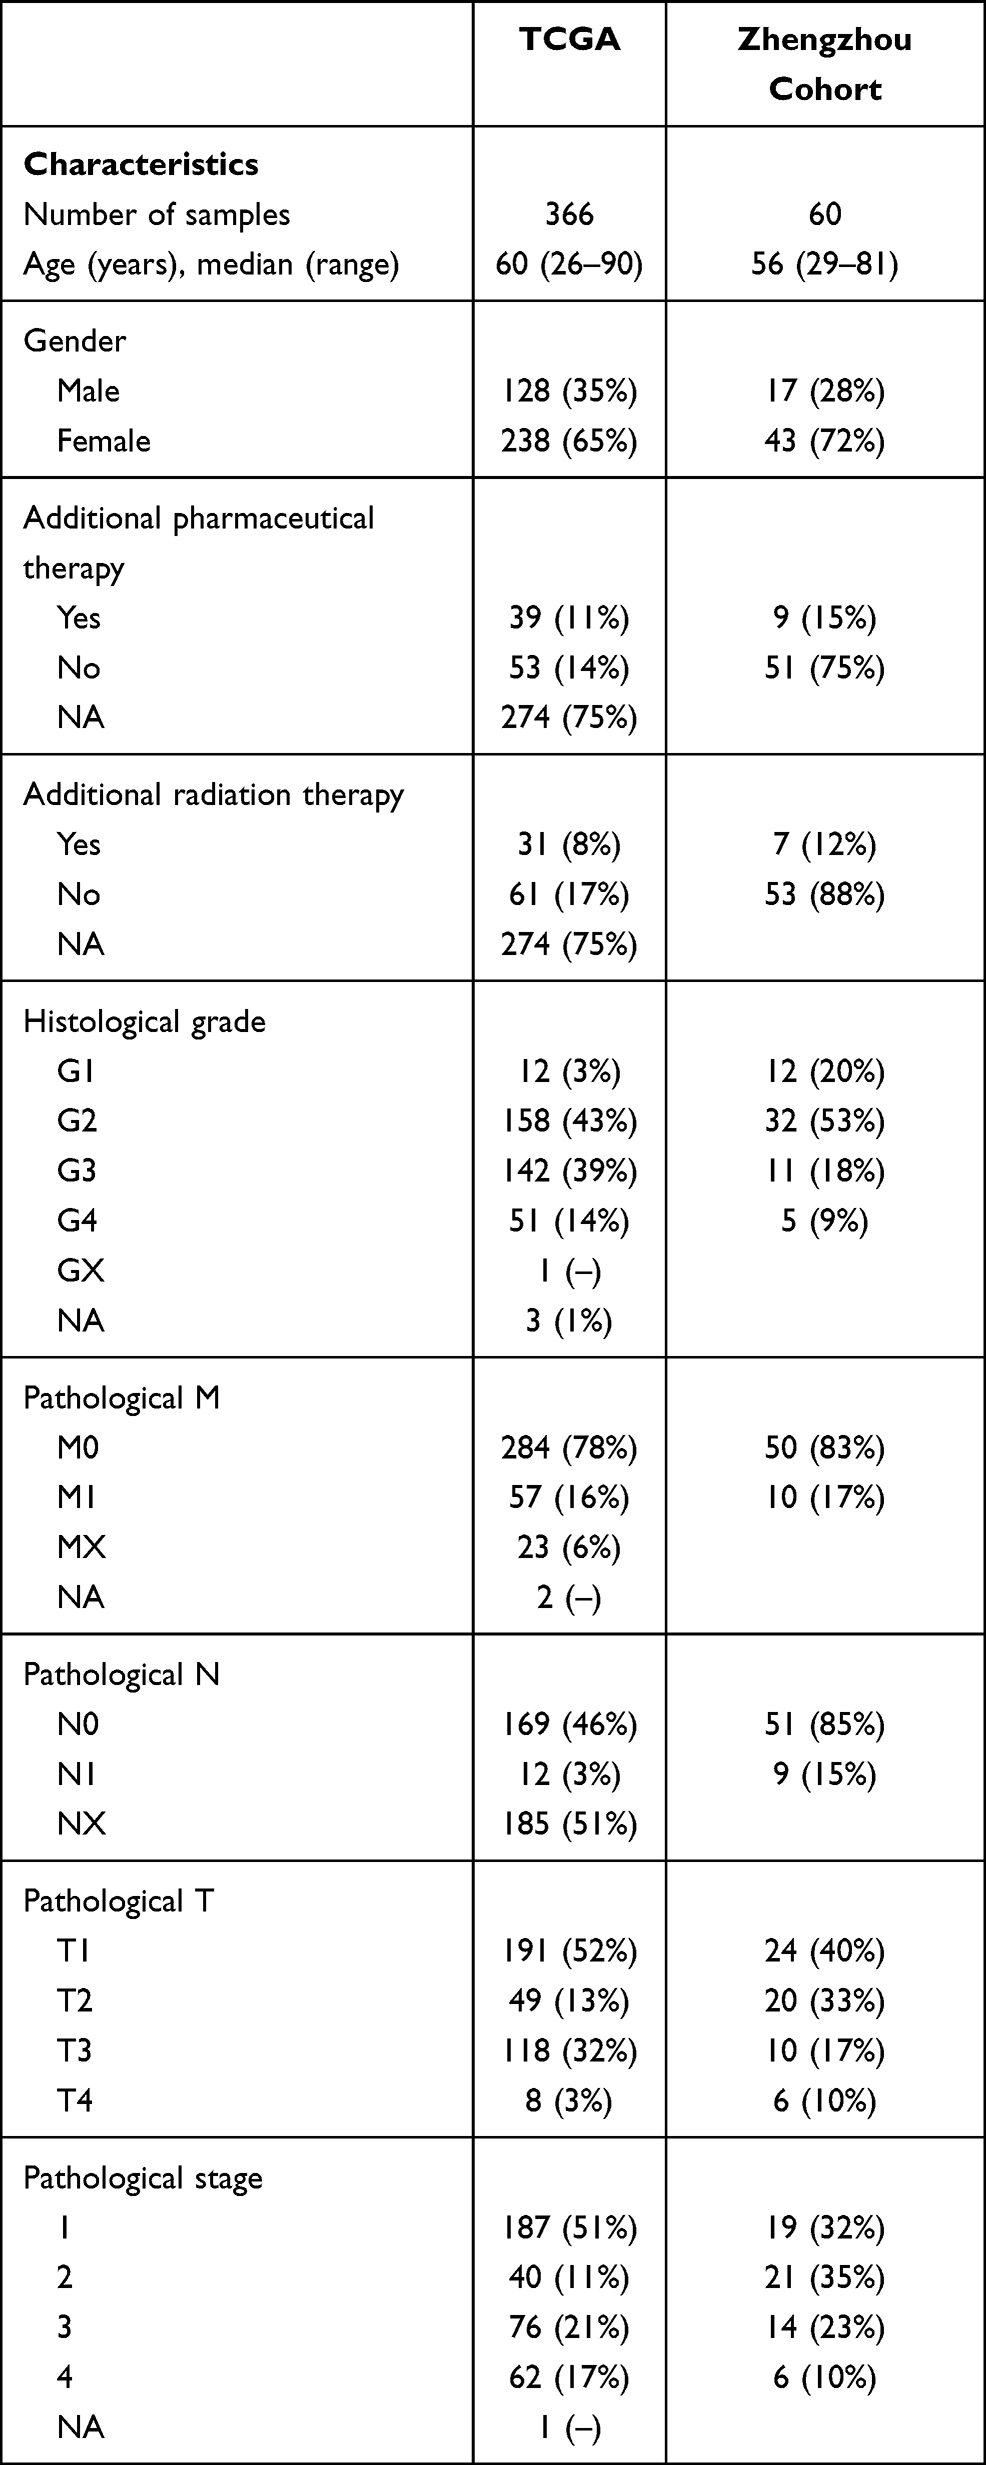 |
Table 2 Clinical and Pathological Characteristics of the Patients in TCGA and Zhengzhou Validation Cohort Analyzed in This Study |
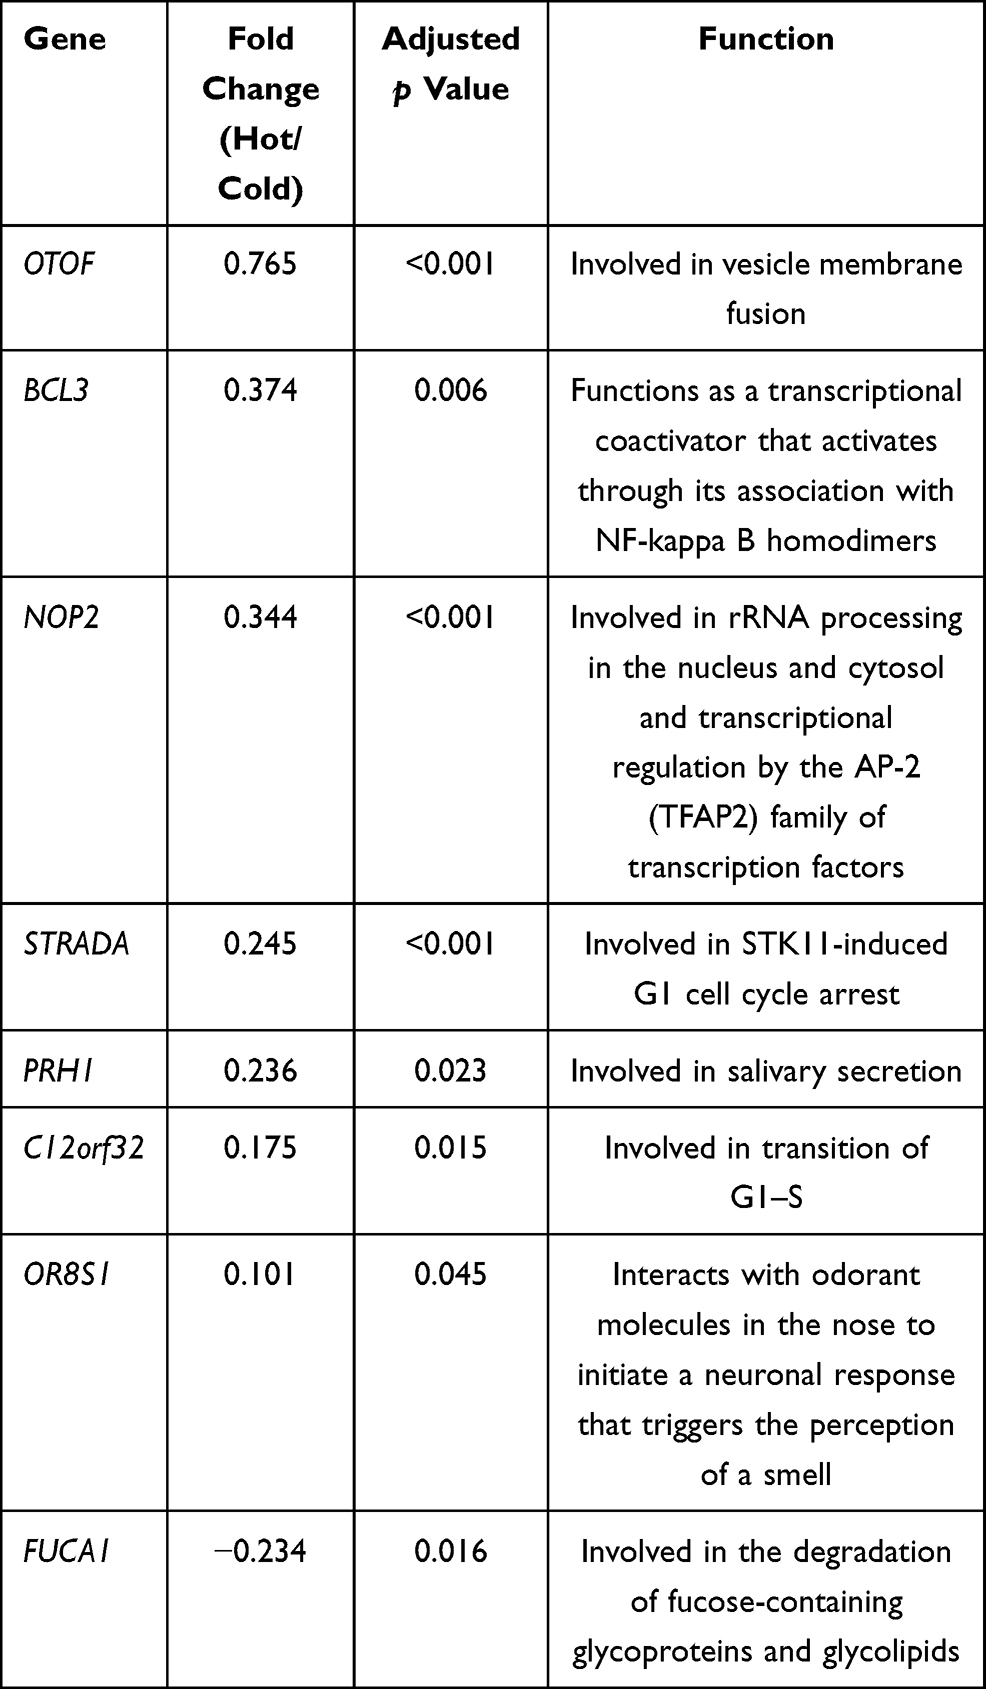 |
Table 3 Detailed Information of the Eight Genes in the Prediction Model |
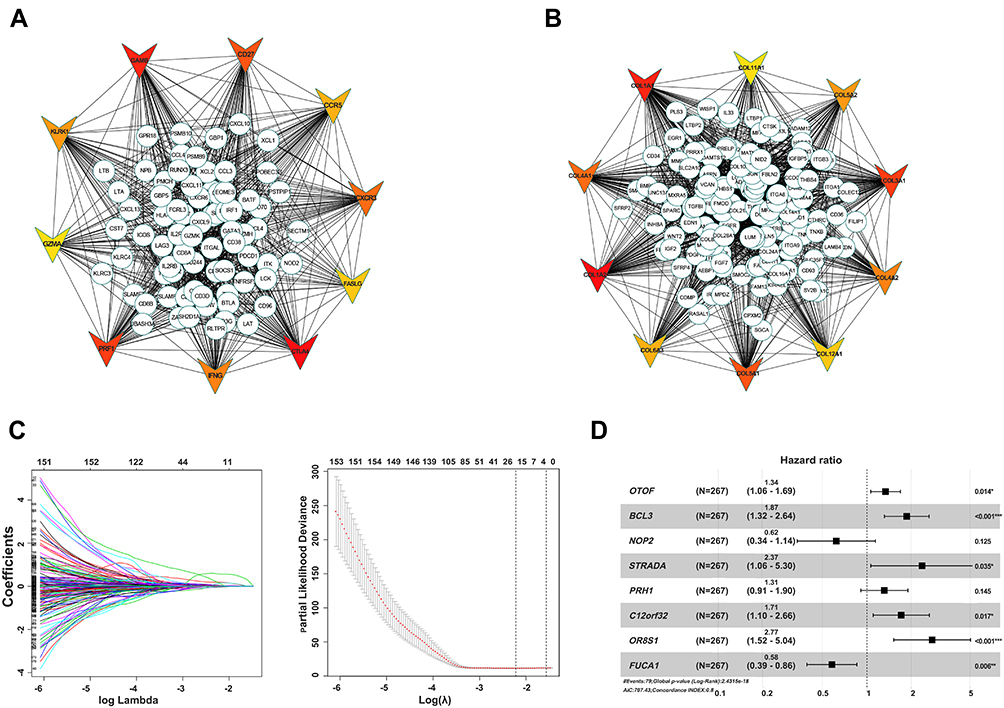 |
Figure 7 Identification of hub and prognostic-related genes. (A) PPI network of upregulated genes in hot tumor. (B) PPI network of downregulated genes in hot tumor. Top 10 hub genes are shown using triangles, with red color indicating the importance of genes. (C) LASSO and partial likelihood deviance coefficient profiles of the selected genes. (D) Forest plots showing HRs of selected genes by multivariate Cox analysis. |
Construction and Validation of a Model for Predicting Overall Survival of ccRCC Patients
To test the predictive power of the model, we first calculated risk scores in the training and testing cohorts (Figure 8A). The results revealed a similar risk score in both cohorts, indicating the good stability of both datasets. Survival analysis showed that the risk score could separate the patients well (Figure 8B). Notably, patients with high risk scores showed poor overall survival in both the training and testing cohorts (Figure 8C). The area under the curve (AUC) values for 5-year survival were 0.834 and 0.743 for the training and testing sets, respectively (Figure 8D). We validated the model using our clinical samples against an external Zhengzhou validation cohort, and found that it performed well (AUC=0.851) in predicting the survival of patients in this cohort (Figure 8E–H). Previous research showed that immune status in the TME can predict the immune response of patients to immunotherapy.24 Based on this, we tested the ability of our eight-gene signature in predicting the survival of patients with immunotherapy across two independent cohorts, metastatic urothelial cancer and a renal cell carcinoma, both treated with anti-PD-L1 antibody. The results revealed poor overall survival in high-risk patients in both cohorts (Figure 8I and J). These results suggest that this model can effectively predict overall survival; hence, it has potential for the clinical treatment of ccRCC patients.
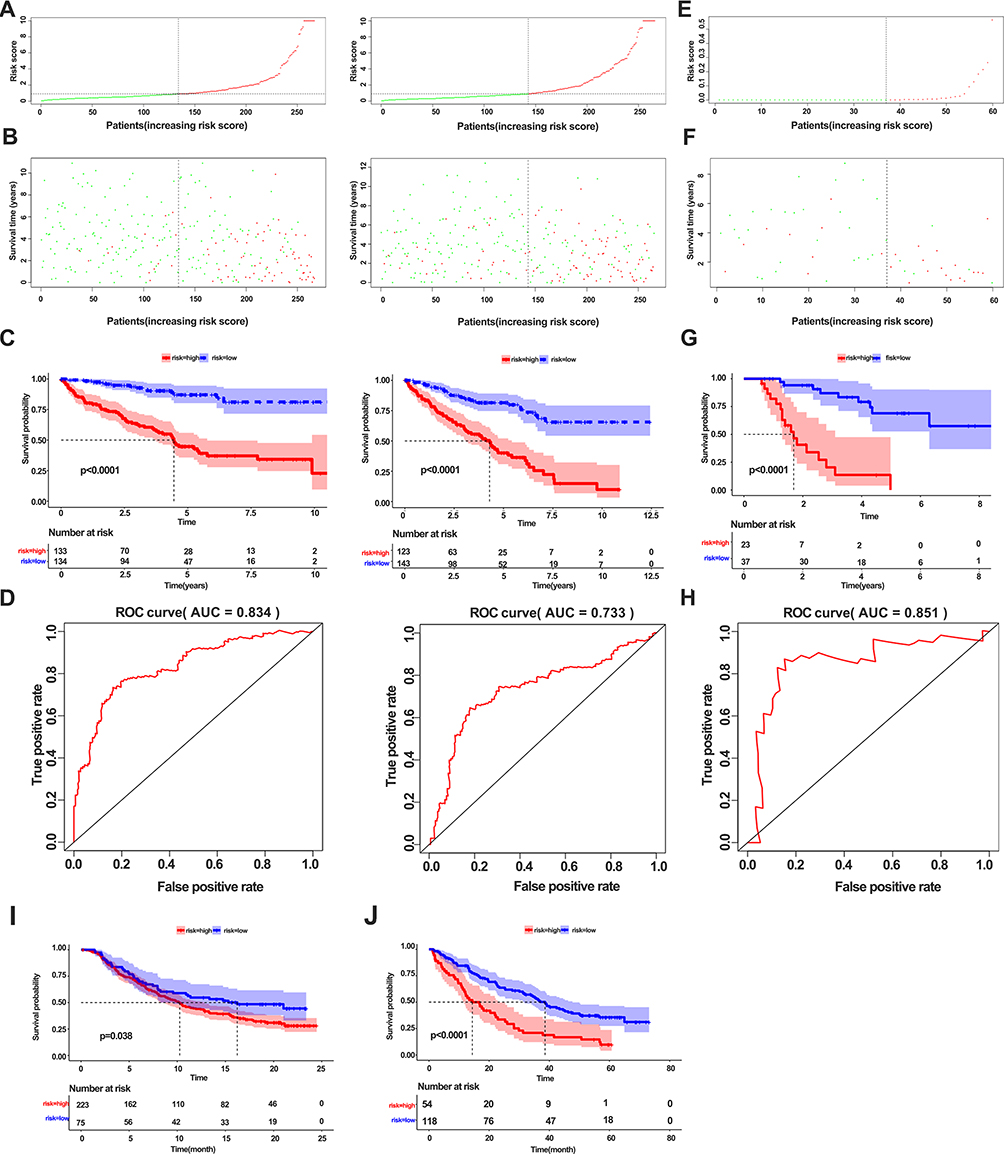 |
Figure 8 Construction and validation of a model for predicting overall survival of ccRCC patients. (A) Correlation of risk score and number of patients in the training cohort (left panel) and testing cohort (right panel). (B) Correlation of survival and number of patients with high risk and low risk in the training cohort (left panel) and testing cohort (right panel). (C) Kaplan–Meier survival curve showing survival of patients with high and low risk in the training cohort (left panel) and testing cohort (right panel). (D) ROC curve of 5-year survival for the training cohort (left panel) and testing cohort (right panel). (E, F) Distribution of the risk score (E) and survival status (F) in the external validation cohort. (G) Kaplan–Meier survival curve showing the survival of patients with high and low risk in the external validation cohort. (H) ROC curve of 3-year survival for the validation cohort. (I) Kaplan–Meier survival curve showing survival of patients with high and low risk in the metastatic urothelial cancer cohort. (J) Kaplan–Meier survival curve showing the survival of patients with high and low risk in the renal cell carcinoma cohort. |
Discussion
Clear cell renal cell carcinoma is the most common subtype of renal cell carcinoma, accounting for more than 70% of all cases worldwide.25 ccRCC is characterized by high genomic variability, which provides many potential therapeutic targets. Current first and second line treatment therapies for ccRCC employ tyrosine-kinase inhibitors and anti-VEGF agents. However, most patients exhibit poor survival rates and acquired resistance to the treatments.26 Research has shown that immune checkpoint blockade alone or in combination with anti-angiogenesis drugs has potential in treating advanced ccRCC,19 affirming the importance of immunotherapy in this treatment. However, some challenges have been documented. For example, some people do not respond to treatment while many other patients acquire resistance. Most of the resistance by tumor cells to immunotherapy is attributed to the heterogeneity of the TME, which comprises various cell types that support tumor progression.27 Therefore, characterizing cell components and elucidating the underlying mechanisms that regulate different subtypes of TME are imperative to the development of effective therapies against ccRCC.
In this study, we analyzed infiltration of 22 immune cells, with a view to comprehensively understand their biological role in ccRCC progression. Our results revealed elevated cytotoxic CD8+ T cells and Tfhs along with tumor progression. Infiltration of CD8+ T cells was highest in tumor samples with TIII and TIV stage, as well as those with metastasis. Overall, these results indicate that advanced tumors have the potential to stimulate an immune response because of cumulative mutation. In response to these disadvantages, previous studies have indicated that the tumor forms an immunosuppressive microenvironment to inhibit the immune response.27–29 Similarly, we also found high levels of infiltration of Tregs in the immune inflamed tumor samples, which are known to suppress the immune response.30–33 Besides, Tregs predicted poor overall survival in ccRCC patients. Notably, higher expression of Tfhs, neutrophils, and plasma cells was associated with poor survival rates, indicating the dysfunctional state of these cells. Danaher et al34 reported that a high tumor inflammation signature was associated with poor survival in low-grade glioma, prostate cancer, and kidney renal papillary cell carcinoma, in a similar fashion to the observations in ccRCC. These findings suggest that although a stimulated response occurred in the tumor tissue, the overall immune microenvironment is in a suppressed state. Furthermore, our results revealed the elevation of activated immune cells in tumor tissues relative to adjuvant normal tissues. In contrast, nave cells, including naïve B and resting mast cells, were more abundant in normal than in tumor tissues. M2 macrophages, also known as tumor-associated macrophages (TAMs), which abundantly infiltrate most solid tumors, contribute to tumor progression by suppressing the immune response and promoting the proliferation of tumor cells.35 Wang et al reported that TAMs promote metastasis and drug resistance of ccRCC through secretion of SOX17.36 In addition, tumor-infiltrating macrophages secrete IL-23 and enhance Treg function.37 In this study, we observed that the ratios of M2 macrophages were higher in the early stage of ccRCC, indicating that M2 macrophages play an important role in forming the immunosuppressive microenvironment in the early phase of the tumor. Notably, the CIBERSORT method calculates the proportions of 22 immune cells, which do not reflect the absolute numbers of infiltrating cells.20
Activation of an immune response usually requires synergy by multiple cells, including antigen presentation, recruitment, and stimulation of CD8+ T cells by chemokines and cytokines. In this study, we observed that CD8+ T cells were correlated with Tfhs, activated NK, and dendritic cells. This was not observed in normal tissues, indicating that immune activation drives CD8+ T-cell infiltration. Accumulating evidence suggests that immune subtypes in tumors show distinct responses to immune checkpoint blockade. Our ccRCC classification, based on infiltration of 22 immune cells, revealed four clusters with different immune infiltration patterns. Analysis of immune, stromal, and tumor purity scores across the four clusters indicated that cluster 4 was abundant in CD8+ T cells, activated NK cells, and Tfhs, a subtype reportedly more responsive to immunotherapy.24 Although the other three clusters revealed distinct immune infiltration patterns, their immune, stromal, and tumor purity scores were not significantly different, indicating that they have the same characteristics. In particular, cluster 3, which was enriched in CD8+ T cells, while lacking Tfhs and dendritic cells, could not activate effective immunity. These results were in line a previous study, which found that only stimulation of effector T cells and Tfhs can control tumor growth.38
Previous evidence has shown that the density and diversity of immune cells in the TME are closely associated with immune response and prognosis.39 The TME can simply be defined as hot and cold tumors, based on the inflamed cytokine expression and T-cell infiltration.40 Given the immune scores among the four clusters, we redefined cluster 4 as hot and the others as cold tumors. Expression analyses revealed significant differences between the two types of tumors, with upregulation of immune inflamed genes, including CD8A, PDCD1, LAG3, CXCL13, and IFNG, in the hot tumor. The most highly expressed gene in the cold tumor was cellular repressor of E1A stimulated genes 2 (CREG2). These are secreted glycoproteins and may be novel neuronal extracellular molecules.. GO indicated that this gene is associated with oxidoreductase activity.41,42 However, its function in immune modulation remains unknown. In addition, other genes that are overexpressed in cold tumor require further exploration. GO and KEGG analyses revealed enrichment of T-cell activation, cytokine–cytokine interaction, and some other immune responses in the hot tumor, whereas extracellular matrix and structural organization were the highly enriched processes in the cold tumor. Previous research has shown that extracellular matrix remodeling is the hallmark of tumor progression.43 Its transition promotes tumor metastasis but also acts as a physical barrier to inhibit immune cell infiltration.44 In addition, collagen, the major component of the extracellular matrix, can induce exhaustion of CD8 T cells.45 These results suggest that targeting the extracellular matrix may be a feasible way to promote immunotherapy.
We also observed that the PI3K/AKT pathway was activated in cold tumors. The PI3K/AKT pathway has been reported to be hyperactivated in most cancers, usually leading to aberrant cell proliferation and apoptosis, and thus mediating tumor initiation, progression, and drug resistance.46–48 Increasing evidence has confirmed the crucial role of the PI3K/AKT/mTOR pathway in the immune response. In PTEN-mutant melanoma murine models and PIK3CA-mutated bladder cancer, the administration of PI3K inhibitor induces immune activation and the response to PD-1 inhibitors.49,50 These reports affirm our results and highlight that the combination of inhibition of the PI3K/AKT pathway and immunotherapy may enhance the anti-tumor response.
Previous works have evaluated the potential of immune cells or immune-related long-coding RNAs and mRNA in predicting the prognosis of ccRCC patients.51,52 In this study, we also explored the prognostic value of the DEGs and built a risk model containing eight genes. We found an association between B-Cell Chronic Lymphocytic Leukaemia/Lymphoma-3 (BCL3), a well-known oncogene, and poor survival in ccRCC patients. BCL3 is identified by its translocation into the immunoglobulin alpha-locus in some cases of B-cell leukemia.53,54 Olfactory Receptor Family 8 Subfamily S Member 1 (OR8S1) genes are olfactory receptors that interact with odorant molecules in the nose, which initiate a neuronal response that triggers smell. We also observed that high expression of Alpha-L-Fucosidase 1 (FUCA1), a p53 targeted gene that encodes a fucosidase, was correlated with better survival in ccRCC patients. Upregulation of FUCA1 was found to suppress tumor growth and promote chemotherapy-induced cell death.54,55 These results are consistent with previous findings. Our prediction model performed well in predicting overall survival in TCGA and in the Zhengzhou external validation cohort. Notably, the eight gene sets also had a good predictive effect in patients with metastatic urothelial cancer and renal cell carcinoma receiving anti PD-L1 treatment.
There are some limitations of the model. First, only one external cohort was used to validate the model. Second, this model did not fit the ccRCC patients with all kinds of therapies.
Conclusion
In summary, our results reveal that immune infiltration is associated with tumor progression. Specifically, infiltration of immunosuppressive cells reflects the status of tumor progression. We identified four ccRCC clusters, based on different immune infiltration, with further analysis showing that extracellular matrix remodeling and the PI3K/AKT pathway may inhibit immune infiltration. We constructed a risk model for predicting overall survival rates of ccRCC patients, and validated it using our cohort. The established model, alongside an eight-gene signature, can effectively predict survival rates of ccRCC patients, affirming its potential predictive value in guiding the treatment of ccRCC.
Data Sharing Statement
All public data can be downloaded from TCGA website supplied in the study. Other data used in the current study are available from the corresponding author on reasonable request.
Acknowledgments
This study was supported by grants from the National Natural Science Foundation of China (NSFC, grant no 81770725) and Natural Science Foundation of Henan Province (grant no 202300410417).
Disclosure
The authors declare no conflicts of interest.
References
1. Siegel RL, Miller KD, Jemal A. Cancer statistics, 2020. CA Cancer J Clin. 2020;70(1):7–30. doi:10.3322/caac.21590
2. Ljungberg B, Bensalah K, Canfield S, et al. EAU guidelines on renal cell carcinoma: 2014 update. Eur Urol. 2015;67(5):913–924. doi:10.1016/j.eururo.2015.01.005
3. Du W, Zhang L, Brett-Morris A, et al. HIF drives lipid deposition and cancer in ccRCC via repression of fatty acid metabolism. Nat Commun. 2017;8(1):1769. doi:10.1038/s41467-017-01965-8
4. Baldewijns MM, van Vlodrop IJ, Vermeulen PB, et al. VHL and HIF signalling in renal cell carcinogenesis. J Pathol. 2010;221(2):125–138. doi:10.1002/path.2689
5. Motzer RJ, Nosov D, Eisen T, et al. Tivozanib versus sorafenib as initial targeted therapy for patients with metastatic renal cell carcinoma: results from a Phase III trial. J Clin Oncol. 2013;31(30):3791–3799. doi:10.1200/JCO.2012.47.4940
6. Topalian SL, Taube JM, Pardoll DM. Neoadjuvant checkpoint blockade for cancer immunotherapy. Science. 2020;367(6477):
7. Motzer RJ, Escudier B, George S, et al. Nivolumab versus everolimus in patients with advanced renal cell carcinoma: updated results with long-term follow-up of the randomized, open-label, Phase 3 CheckMate 025 trial. Cancer. 2020;126(18):4156–4167. doi:10.1002/cncr.33033
8. Hirsch L, Loirat D. Nivolumab versus everolimus in advanced renal-cell carcinoma. Oncologie. 2016;18(2–3):196–197.
9. Motzer RJ, Escudier B, McDermott DF, et al. Nivolumab versus everolimus in advanced renal-cell carcinoma. N Engl J Med. 2015;373(19):1803–1813. doi:10.1056/NEJMoa1510665
10. Schoenfeld AJ, Hellmann MD. Acquired resistance to immune checkpoint inhibitors. Cancer Cell. 2020;37(4):443–455. doi:10.1016/j.ccell.2020.03.017
11. Jiang X, Wang J, Deng X, et al. Role of the tumor microenvironment in PD-L1/PD-1-mediated tumor immune escape. Mol Cancer. 2019;18(1):10. doi:10.1186/s12943-018-0928-4
12. Zheng Y, Li Y, Tang B, et al. IL-6-induced CD39 expression on tumor-infiltrating NK cells predicts poor prognosis in esophageal squamous cell carcinoma. Cancer Immunol Immunother. 2020;69(11):2371–2380.
13. Şenbabaoğlu Y, Gejman RS, Winer AG, et al. Tumor immune microenvironment characterization in clear cell renal cell carcinoma identifies prognostic and immunotherapeutically relevant messenger RNA signatures. Genome Biol. 2016;17(1):231. doi:10.1186/s13059-016-1092-z
14. Jia D, Li S, Li D, et al. Mining TCGA database for genes of prognostic value in glioblastoma microenvironment. Aging (Albany NY). 2018;10(4):592–605. doi:10.18632/aging.101415
15. Zheng Y, Liu Y, Zhao S, et al. Large-scale analysis reveals a novel risk score to predict overall survival in hepatocellular carcinoma. Cancer Manag Res. 2018;10:6079–6096. doi:10.2147/CMAR.S181396
16. Shah N, Wang P, Wongvipat J, et al. Regulation of the glucocorticoid receptor via a BET-dependent enhancer drives antiandrogen resistance in prostate cancer. Elife. 2017;6. doi:10.7554/eLife.27861
17. Alonso MH, Aussó S, Lopez-Doriga A, et al. Comprehensive analysis of copy number aberrations in microsatellite stable colon cancer in view of stromal component. Br J Cancer. 2017;117(3):421–431. doi:10.1038/bjc.2017.208
18. Mariathasan S, Turley SJ, Nickles D, et al. TGFbeta attenuates tumour response to PD-L1 blockade by contributing to exclusion of T cells. Nature. 2018;554(7693):544–548. doi:10.1038/nature25501
19. McDermott DF, Huseni MA, Atkins MB, et al. Clinical activity and molecular correlates of response to atezolizumab alone or in combination with bevacizumab versus sunitinib in renal cell carcinoma (vol 24, pg 749, 2018). Nat Med. 2018;24(12):1941. doi:10.1038/s41591-018-0235-z
20. Newman AM, Liu CL, Green MR, et al. Robust enumeration of cell subsets from tissue expression profiles. Nat Methods. 2015;12(5):
21. Thorsson V, Gibbs DL, Brown SD, et al. The immune landscape of cancer. Immunity. 2018;48(4):
22. Tamborero D, Rubio-Perez C, Muinos F, et al. A pan-cancer landscape of interactions between solid tumors and infiltrating immune cell populations. Clin Cancer Res. 2018;24(15):3717–3728. doi:10.1158/1078-0432.CCR-17-3509
23. Li TW, Fan JY, Wang BB, et al. TIMER: a web server for comprehensive analysis of tumor-infiltrating immune cells. Cancer Res. 2017;77(21):E108–E110. doi:10.1158/0008-5472.CAN-17-0307
24. Jiang P, Gu S, Pan D, et al. Signatures of T cell dysfunction and exclusion predict cancer immunotherapy response. Nat Med. 2018;24(10):1550–1558. doi:10.1038/s41591-018-0136-1
25. Lopez JI. Renal tumors with clear cells. A review. Pathol Res Pract. 2013;209(3):137–146. doi:10.1016/j.prp.2013.01.007
26. Liu KG, Gupta S, Goel S. Immunotherapy: incorporation in the evolving paradigm of renal cancer management and future prospects. Oncotarget. 2017;8(10):17313–17327. doi:10.18632/oncotarget.14388
27. Lai Y, Tang F, Huang Y, et al. The tumour microenvironment and metabolism in renal cell carcinoma targeted or immune therapy. J Cell Physiol. 2021;236(3):1616–1627.
28. Galon J, Bruni D. Tumor immunology and tumor evolution: intertwined histories. Immunity. 2020;52(1):55–81.
29. Qu Y, Dou B, Tan H, et al. Tumor microenvironment-driven non-cell-autonomous resistance to antineoplastic treatment. Mol Cancer. 2019;18(1):69. doi:10.1186/s12943-019-0992-4
30. Li C, Jiang P, Wei S, et al. Regulatory T cells in tumor microenvironment: new mechanisms, potential therapeutic strategies and future prospects. Mol Cancer. 2020;19(1):116. doi:10.1186/s12943-020-01234-1
31. Togashi Y, Shitara K, Nishikawa H. Regulatory T cells in cancer immunosuppression - implications for anticancer therapy. Nat Rev Clin Oncol. 2019;16(6):356–371. doi:10.1038/s41571-019-0175-7
32. Veglia F, Perego M, Gabrilovich D. Myeloid-derived suppressor cells coming of age. Nat Immunol. 2018;19(2):108–119. doi:10.1038/s41590-017-0022-x
33. Talmadge JE, Gabrilovich DI. History of myeloid-derived suppressor cells. Nat Rev Cancer. 2013;13(10):739–752. doi:10.1038/nrc3581
34. Danaher P, Warren S, Lu R, et al. Pan-cancer adaptive immune resistance as defined by the Tumor Inflammation Signature (TIS): results from The Cancer Genome Atlas (TCGA). J Immunother Cancer. 2018;6(1):63. doi:10.1186/s40425-018-0367-1
35. Li X, Liu R, Su X, et al. Harnessing tumor-associated macrophages as aids for cancer immunotherapy. Mol Cancer. 2019;18(1):177. doi:10.1186/s12943-019-1102-3
36. Wang C, Wang Y, Hong T, et al. Targeting a positive regulatory loop in the tumor-macrophage interaction impairs the progression of clear cell renal cell carcinoma. Cell Death Differ. 2020:1–20.
37. Fu Q, Xu L, Wang Y, et al. Tumor-associated macrophage-derived interleukin-23 interlinks kidney cancer glutamine addiction with immune evasion. Eur Urol. 2019;75(5):752–763. doi:10.1016/j.eururo.2018.09.030
38. Alspach E, Lussier DM, Miceli AP, et al. MHC-II neoantigens shape tumour immunity and response to immunotherapy. Nature. 2019;574(7780):696–701. doi:10.1038/s41586-019-1671-8
39. Duan Q, Zhang H, Zheng J, et al. Turning cold into hot: firing up the tumor microenvironment. Trends Cancer. 2020;6(7):605–618. doi:10.1016/j.trecan.2020.02.022
40. Gajewski TF. The next hurdle in cancer immunotherapy: overcoming the non-T-cell-inflamed tumor microenvironment. Semin Oncol. 2015;42(4):663–671. doi:10.1053/j.seminoncol.2015.05.011
41. Weivoda MM, Chew CK, Monroe DG, et al. Identification of osteoclast-osteoblast coupling factors in humans reveals links between bone and energy metabolism. Nat Commun. 2020;11(1):87. doi:10.1038/s41467-019-14003-6
42. Kunita R, Otomo A, Ikeda J-E. Identification and characterization of novel members of the CREG family, putative secreted glycoproteins expressed specifically in brain. Genomics. 2002;80(5):456–460. doi:10.1006/geno.2002.6857
43. Cui J, Dean D, Hornicek FJ, et al. The role of extracelluar matrix in osteosarcoma progression and metastasis. J Exp Clin Cancer Res. 2020;39(1):178. doi:10.1186/s13046-020-01685-w
44. Winkler J, Abisoye-Ogunniyan A, Metcalf KJ, et al. Concepts of extracellular matrix remodelling in tumour progression and metastasis. Nat Commun. 2020;11(1):5120.
45. Peng DH, Rodriguez BL, Diao L, et al. Collagen promotes anti-PD-1/PD-L1 resistance in cancer through LAIR1-dependent CD8(+) T cell exhaustion. Nat Commun. 2020;11(1):4520. doi:10.1038/s41467-020-18298-8
46. Okkenhaug K, Graupera M, Vanhaesebroeck B. Targeting PI3K in cancer: impact on tumor cells, their protective stroma, angiogenesis, and immunotherapy. Cancer Discov. 2016;6(10):1090–1105. doi:10.1158/2159-8290.CD-16-0716
47. O’Donnell JS, Massi D, Teng MWL, et al. PI3K-AKT-mTOR inhibition in cancer immunotherapy, redux. Semin Cancer Biol. 2018;48:91–103. doi:10.1016/j.semcancer.2017.04.015
48. Brown KK, Toker A. The phosphoinositide 3-kinase pathway and therapy resistance in cancer. F1000Prime Rep. 2015;7:13. doi:10.12703/P7-13
49. Peng W, Chen JQ, Liu C, et al. Loss of PTEN promotes resistance to T cell-mediated immunotherapy. Cancer Discov. 2016;6(2):202–216. doi:10.1158/2159-8290.CD-15-0283
50. Borcoman E, De La Rochere P, Richer W, et al. Inhibition of PI3K pathway increases immune infiltrate in muscle-invasive bladder cancer. Oncoimmunology. 2019;8(5):e1581556. doi:10.1080/2162402X.2019.1581556
51. Du GW, Yan X, Chen Z, et al. Identification of transforming growth factor beta induced (TGFBI) as an immune-related prognostic factor in clear cell renal cell carcinoma (ccRCC). Aging (Albany NY). 2020;12(9):8484–8505. doi:10.18632/aging.103153
52. Gu YY, Chen G, Lin P, et al. Development and validation of an immune prognostic classifier for clear cell renal cell carcinoma. Cancer Biomark. 2020;27(2):265–275. doi:10.3233/CBM-191017
53. Legge DN, Chambers AC, Parker CT, et al. The role of B-Cell Lymphoma-3 (BCL-3) in enabling the hallmarks of cancer: implications for the treatment of colorectal carcinogenesis. Carcinogenesis. 2020;41(3):249–256. doi:10.1093/carcin/bgaa003
54. Massoumi R, Chmielarska K, Hennecke K, et al. Cyld inhibits tumor cell proliferation by blocking Bcl-3-dependent NF-κB signaling. Cell. 2006;125(4):665–677. doi:10.1016/j.cell.2006.03.041
55. Ezawa I, Sawai Y, Kawase T, et al. Novel p53 target gene FUCA1 encodes a fucosidase and regulates growth and survival of cancer cells. Cancer Sci. 2016;107(6):734–745. doi:10.1111/cas.12933
 © 2021 The Author(s). This work is published and licensed by Dove Medical Press Limited. The
full terms of this license are available at https://www.dovepress.com/terms
and incorporate the Creative Commons Attribution
- Non Commercial (unported, 3.0) License.
By accessing the work you hereby accept the Terms. Non-commercial uses of the work are permitted
without any further permission from Dove Medical Press Limited, provided the work is properly
attributed. For permission for commercial use of this work, please see paragraphs 4.2 and 5 of our Terms.
© 2021 The Author(s). This work is published and licensed by Dove Medical Press Limited. The
full terms of this license are available at https://www.dovepress.com/terms
and incorporate the Creative Commons Attribution
- Non Commercial (unported, 3.0) License.
By accessing the work you hereby accept the Terms. Non-commercial uses of the work are permitted
without any further permission from Dove Medical Press Limited, provided the work is properly
attributed. For permission for commercial use of this work, please see paragraphs 4.2 and 5 of our Terms.