")
Back to Journals » OncoTargets and Therapy » Volume 13
GINS2 Functions as a Key Gene in Lung Adenocarcinoma by WGCNA Co-Expression Network Analysis
Authors Tian W, Yang X, Yang H, Zhou B
Received 24 March 2020
Accepted for publication 11 June 2020
Published 8 July 2020 Volume 2020:13 Pages 6735—6746
DOI https://doi.org/10.2147/OTT.S255251
Checked for plagiarism Yes
Review by Single anonymous peer review
Peer reviewer comments 4
Editor who approved publication: Dr Leo Jen-Liang Su
Wen Tian,1,2 Xianglin Yang,1,2 He Yang,1,2 Baosen Zhou1,2
1Department of Clinical Epidemiology, First Affiliated Hospital, China Medical University, Shenyang, People’s Republic of China; 2Department of Epidemiology, School of Public Health, China Medical University, Shenyang, Liaoning 110001, People’s Republic of China
Correspondence: Baosen Zhou Puhe Road, Shenyang, Liaoning 110012, People’s Republic of China
Email [email protected]
Background: Lung adenocarcinoma is one of the malignant tumors in the world. This study aimed to explore the biological mechanism of GINS2 in lung adenocarcinoma.
Materials and Methods: Raw data were downloaded from GEO. WGCNA co-expression network and PPI network were established to identify the hub gene. The expression profile and clinical features of GINS2 were collected from TCGA-LUAD cohort. Survival analysis in TCGA-LUAD cohort was plotted by R package. GSEA was analyzed via GSEA software. MTS, Transwell and apoptosis assays were used to detect the proliferation, migration and apoptotic abilities of lung adenocarcinoma cells.
Results: GINS2 was identified as the hub gene via WGCNA co-expression network and PPI network. Higher GINS2 expressions were observed in TCGA-LUAD cohort, GSE32863 and clinical samples dataset. Overexpression of GINS2 had a significantly negative connection with poor survival outcome. GSEA results revealed that GINS2 could be enriched in “HALLMARK_G2M_CHECKPOINT”, “HALLMARK_E2F_TARGETS”, “HALLMARK_DNA_REPAIR” and “HALLMARK_MYC_TARGETS_V2”. Overexpression of GINS2 promoted tumor cell proliferation and migration and suppressed cell apoptosis.
Conclusion: Our results explored that GINS2 functioned as an oncogene in lung adenocarcinoma, and suggested that GINS2 could act as a promising prognosis biomarker for lung adenocarcinoma.
Keywords: GINS2, lung adenocarcinoma, WGCNA, biological function
Introduction
Lung cancer is one of the most prevalent cancers in the world, with 226,160 new cases and 160,340 mortalities in 2012.1 Lung adenocarcinoma is a major subtype of lung cancer.2 Due to the complex pathomechanism, the survival rate of lung adenocarcinoma is still low.3 Therefore, it is important to explore the underlying molecular mechanisms for lung adenocarcinoma development and progression.
GINS complex subunit 2 (GINS2), a member of GINS family, plays a crucial role in DNA duplication.4 In acute promyelocytic leukemia, up-regulation of GINS2 facilitated HL60 cell proliferation.5 Down-regulation of GINS2 inhibited breast cancer cells growth by activation of endogenous DNA damage.6,7 Elsewhere, it was found that deregulated GINS2 expression promoted distant metastasis free survival and endocrine therapy resistance in breast cancer patients.8 A previous study has reported that GINS2 mRNA was found to be significantly up-regulated in stage II lung adenocarcinoma.9
In this research, we identified a novel oncogene, GINS2, in lung adenocarcinoma based on GSE32863 dataset. Additionally, we found that up-regulation of GINS2 had better diagnostic values in lung adenocarcinoma. Notably, over-expression of GINS2 promoted lung adenocarcinoma cells proliferation and migration and inhibited apoptosis in vitro.
Materials and Methods
Data Collection and DEGs Identification
GSE32863 contained 58 lung adenocarcinoma and 58 adjacent non-tumor lung fresh frozen tissues. The gene expression profile of GSE32863 was downloaded. Raw data was normalized by GEO2R calculation. Adjusted p<0.05 and |log2FC|>1 were set as the criterion for DEGs. The RNA sequencing and clinical data of lung adenocarcinoma were downloaded from TCGA database (http://cancergenome.nih.gov/). A total of 106 clinical samples from the case-control study were collected to analyze the relationship between GINS2 expression and clinical information. All patients were informed of the study and provided written informed consent. The experiment was approved by the Institutional Review Board of China Medical University (No.67 in 2010) and conducted using methodologies conforming to the standards set by the Declaration of Helsinki.
Construction of WGCNA Co-Expression Network
The WGCNA was performed to construct a co-expression network of DEGs via R (3.6.2) WGCNA package. The soft threshold was determined when scale-free R2>0.85. Then the cluster dendrogram and network heatmap of genes were constructed. In addition, eigengene values of modules were calculated, and a clustering tree was carried out.
KEGG and PPI Network Analyses
In order to explore the biological functions of cancer-associated genes, KEGG enrichment was analyzed via R ggplot2 package. PPI network helps us to explore novel molecular mechanism. STRING (https://string-db.org/) online database is a tool to search the interaction among different proteins. The significantly associated genes with weight value >0.8 were collected to construction PPI network.
Real Time-Polymerase Chain Reaction
Total RNA from cells was isolated by the reagent (Takara 9108, Takara, Japan). Then RNA was retro-transcribed according to the manufacturer`s instructions (Takara RR047A, Takara, Japan). RT-PCR was performed by the SYBR Green PCR kit (Takara, Japan). PCR amplification was performed in triplicate according to Takara RR820A (Takara, Japan) under the conditions of 95°C for 30 and 40 second cycles at 95°C for 5 seconds and 60°C for 34 seconds. The Ct values were calculated via ABI 7500 Fast Real-time PCR System (ABI, USA). Fold changes in GINS2 were measured by the 2−ΔΔCT method. The sequences of primer probes were as follows:
GINS2: Forward: AAACTCCGCACGAACCT
Reverse: CCACGAGTACCTCATCACG
Western Blot
First, 20 μL proteins were separated by 10% SDS-PAGE (Beyotime, People's Republic of China) and then transferred onto 0.45 μm PVDF (Millipore, USA) membranes. After blocking with skim milk (BD 232100, BD, USA), the membranes were incubated overnight at 4°C with anti-GINS2 (ABcam 37683, Abcam, People's Republic of China) and anti-GAPDH (ABcam 8245, Abcam, People's Republic of China) antibodies. Then membranes were incubated with a horseradish peroxidase-conjugated secondary antibody (ABcam 150117, Abcam, People's Republic of China) for 1 hour. The signal was detected with enhanced chemiluminescence (Thermo Scientific™ 34076, USA).
Cell Culture and Transfection
HBE and A549 were purchased from GeneChem (Shanghai, People's Republic of China). HBE and A549 cells were all cultured in RPMI-1640 (GIBCO, USA). All cell lines were maintained at 37°C in a humidified chamber with 5% CO2. GINS2 overexpression plasmid (OE-GINS2) and negative control plasmid (NC) were all purchased from Syngeneiech (Beijing, People's Republic of China). 1x10⁵ to 1.5x10⁵ cells were seeded into 6-well plates and transfected plasmids using jetPRIME transfection reagent (Polyplus transfection, USA) according to the manufacturer`s instructions. After being transfected for 48 hours, all cells were collected and used for the next experiments. The sequences of all plasmids were as follows:
OE-GINS2: 5′-GGATCCCGAAGGCAGACGA-3′
NC: 5′-TTCTCCGAACGTGTCACGT-3′
Cell Growth
A total of 1x10⁴ cells were collected and seeded into 96-well plates. The cell growth was measured with MTS solution (Promega G3580, People's Republic of China) according to the instructions. Cells were incubated at 37°C for 2 hours, adding 20 uL MTS solution. The OD was assessed at 0, 12, 24 and 48 hours at 490 nm. Each group was tested in five parallel samples.
Cell Apoptosis
Transfected cells were seeded in a 6-well plate. And then cells were collected by trypsin digestion without EDTA (Thermo Fisher, USA). The apoptotic rates of cells were estimated by Annexin V-APC/7-AAD (KGA1016, KeyGen BioTECH, People's Republic of China) according to the protocols. Cells were stained with 5 μL 7-Amino-Actinomycin D and 5 μL Annexin V-Allophycocyanin at 37°C for 10 minutes. The cells were detected by FCM (Merck Millipore, Germany).
Cell Migration
Transfected cells were starved for 48 hours. Then cells (1x10⁴) were resuspended in 200 μL serum‐free medium, and seeded in the top chamber with 8.0 μm pores in the membrane (Corning, NY, USA). Culture medium with 10% FBS was added to the bottom chamber. After 48 hours at 37°C, the cells in the top chamber were immobilized with paraformaldehyde for 15 minutes and then stained with crystal violet (0.1%) for 10 minutes. After washing with double-distilled water three times, the chamber was stained with 0.1% the crystal violet. After drying, the number of cells migrating was counted by an inverted microscope (ECHO, CA, USA).
Statistical Analysis
The overall survival (OS) were analyzed via R survival package. Student`s test was performed to validate GINS2 expression differences between different groups via R ggplot2 package. Two-way analysis of variance was conducted to analyze the difference in cell growth between the two groups. A two-sided p<0.05 was considered statistically significant.
Results
Identification of DEGs
In order to verify DEGs, we normalized the raw data of GSE32863 via GEO2R calculation (Figure 1A). The heatmap of all genes is shown in Figure 1B. Adjusted p<0.05 and |log2FC|>1 were set as the criterion of DEGs (Figure 1C), including 628 up-regulated genes and 339 down-regulated genes (Table 1).
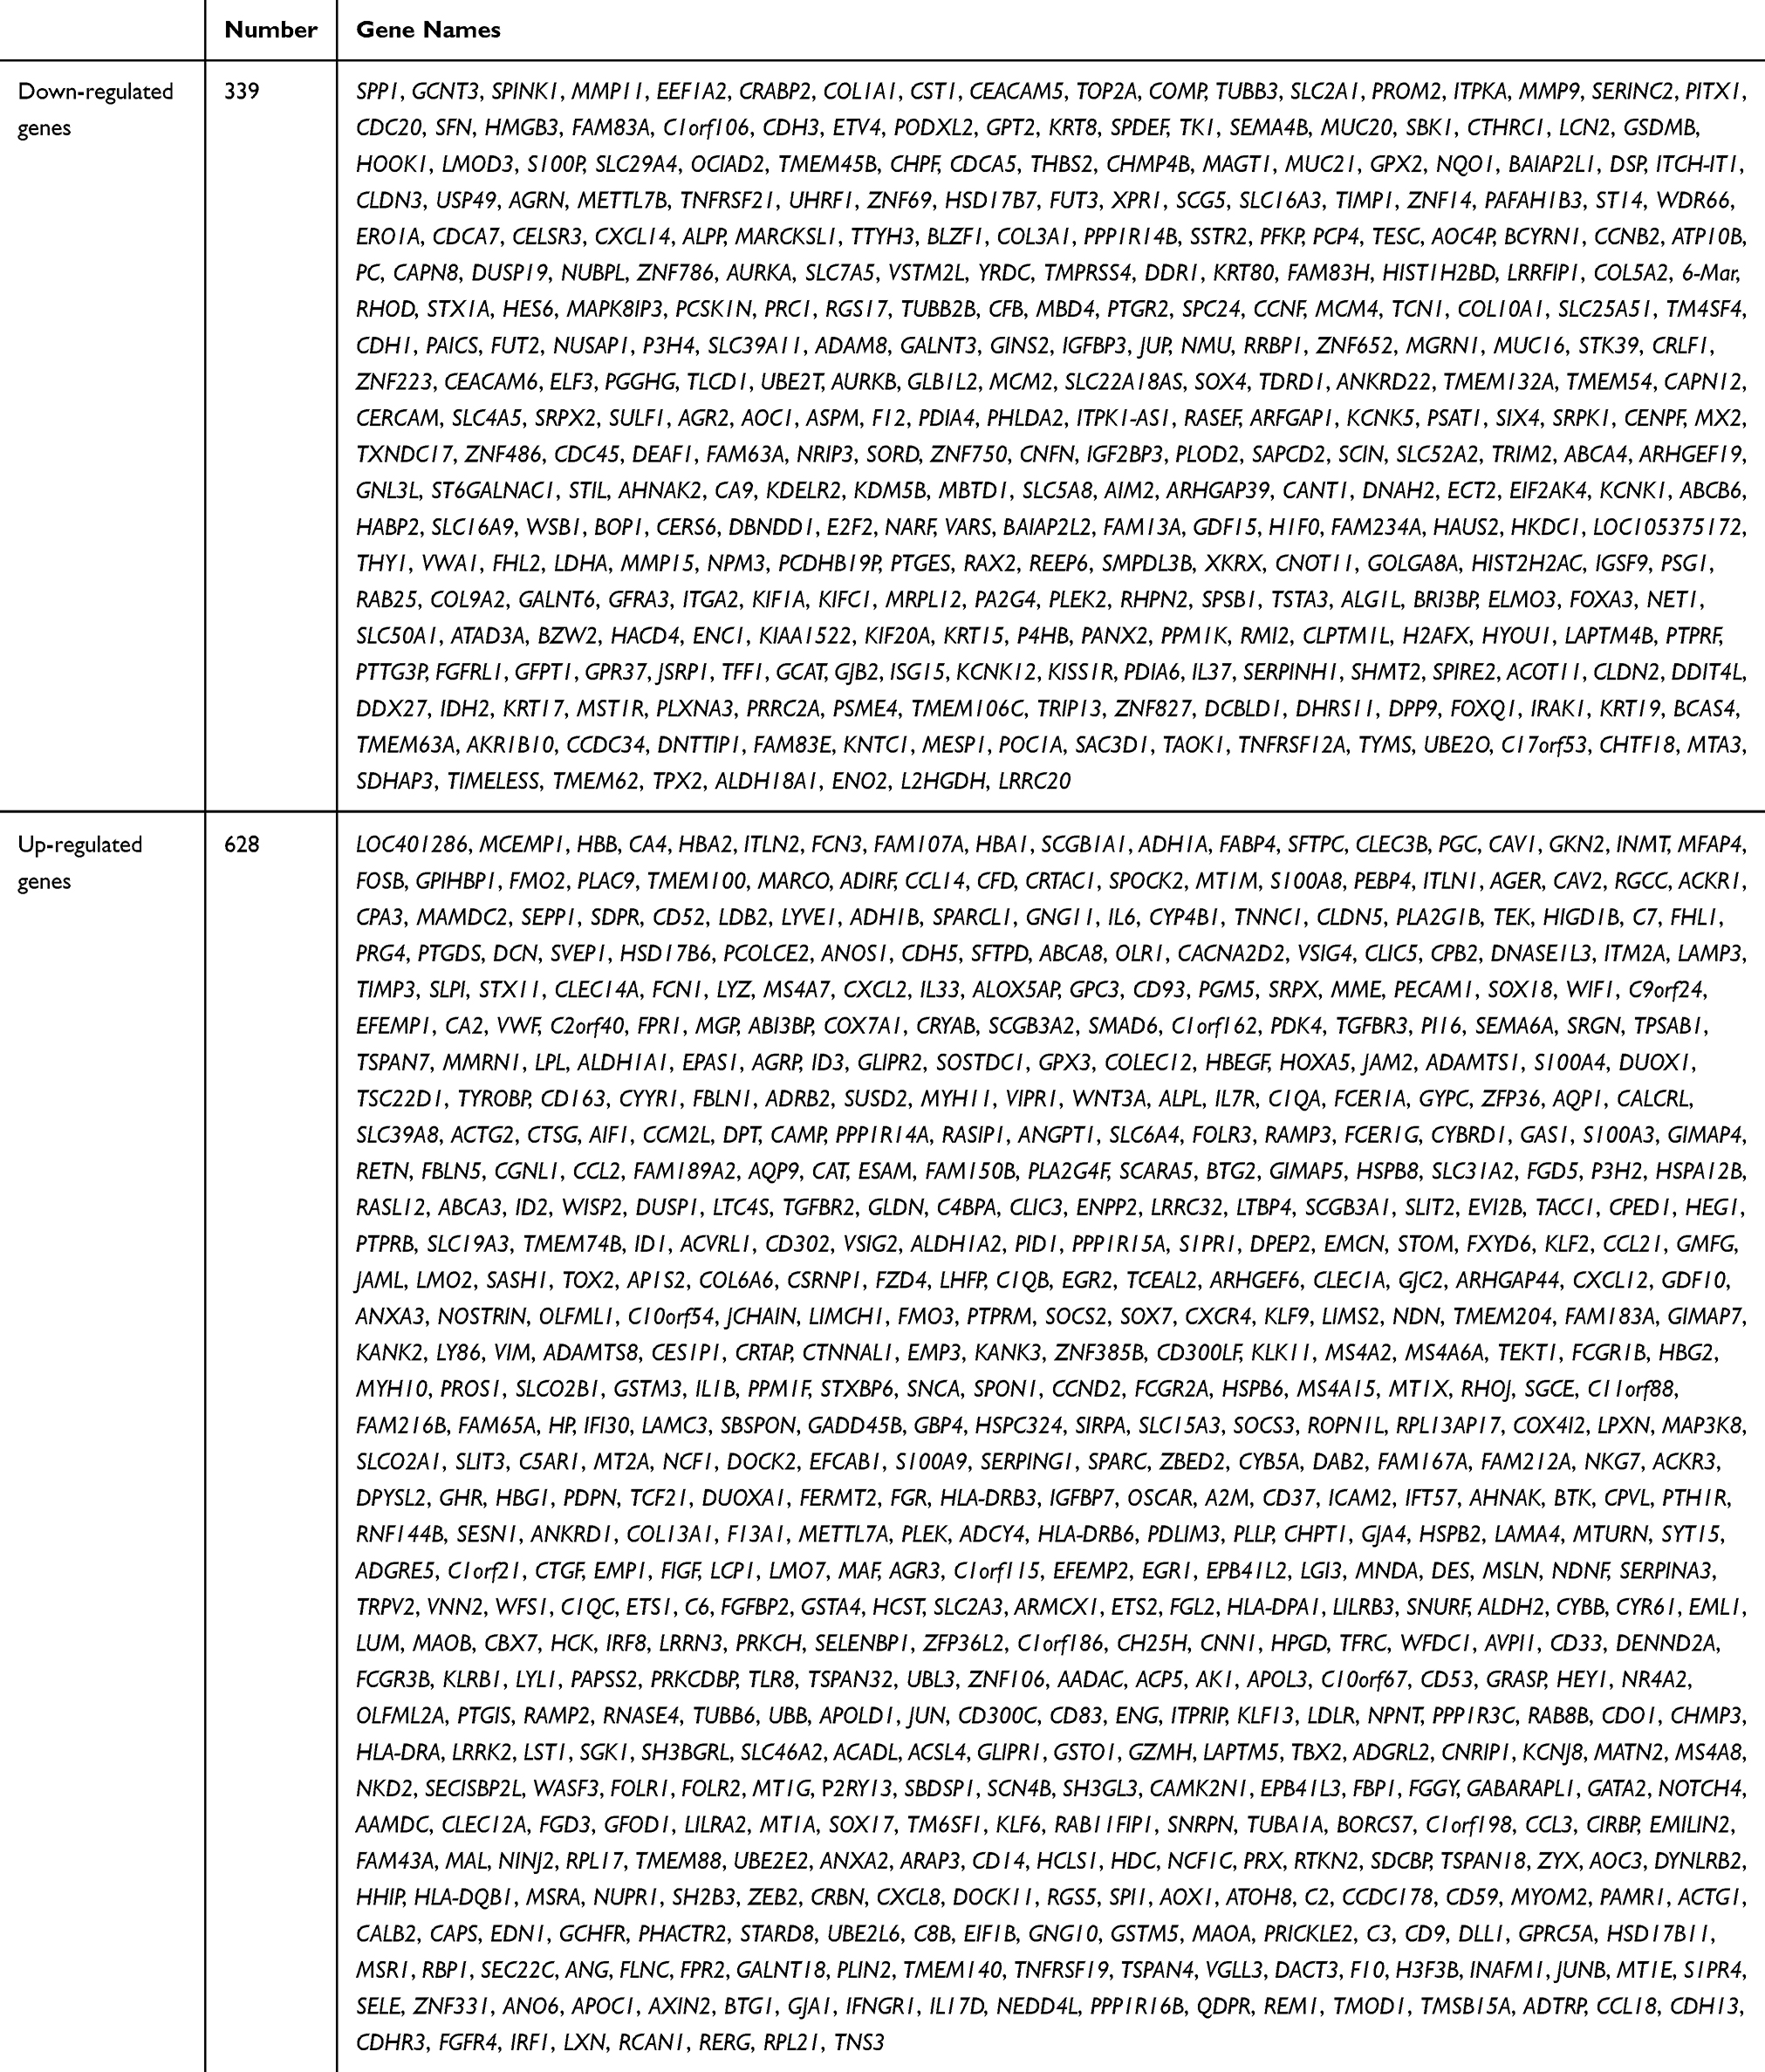 |
Table 1 The Differently Expressed Genes in GSE32863 |
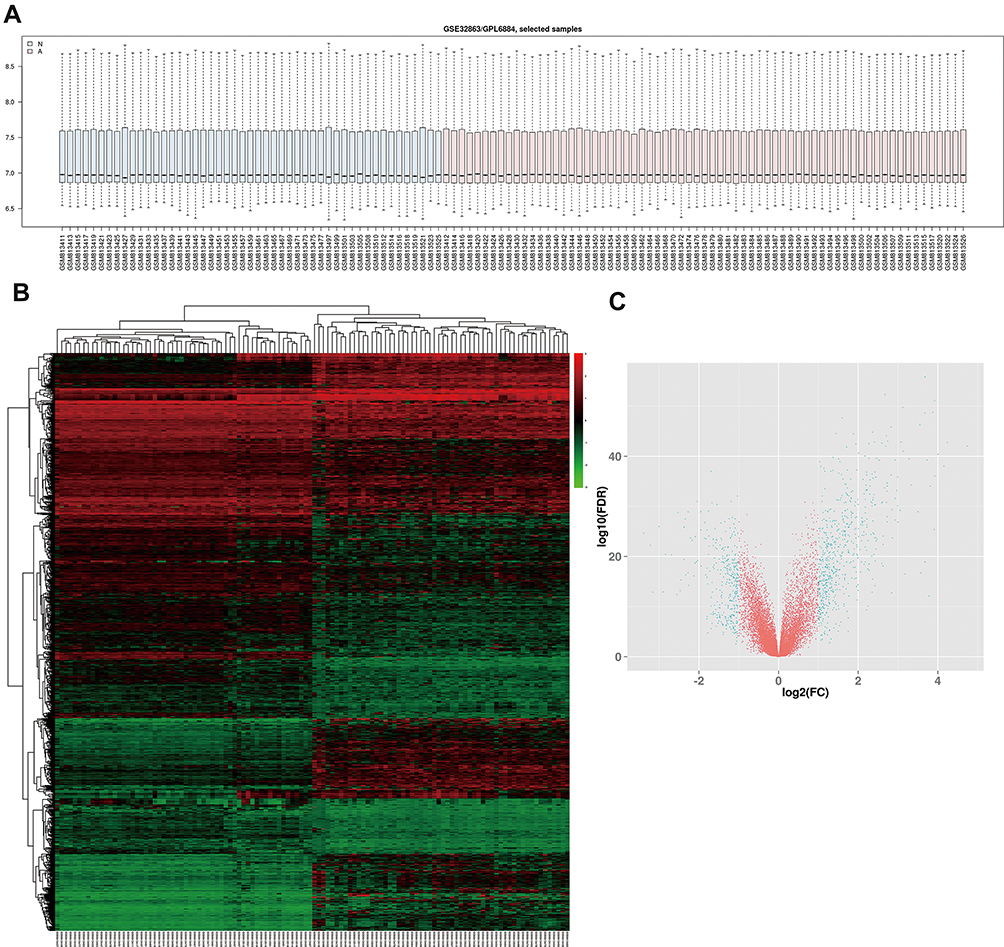 |
Figure 1 Identification of DEGs in GSE32863 dataset. (A) Normalization of GSE32863 data. (B) Hatmap of all genes expression in GSE32863. (C) The volcano map of DEGs. |
WGCNA Co-Expression Network
Based on GSE32863 up-regulated genes expression, we constructed a WGCNA co-expression network. As shown in Figure 2A, the soft threshold of β=18 was identified (R2=0.9, slope=−1.38). Then, all up-regulated genes were split into eight modules (Figure 2B). Each module had different color and genes (Table 2). Figure 2C plotted the network heatmap of interaction of eight modules. All the modules were significantly independent of each other, and a similar result was also observed in gene expressions in each module. In addition, eigengene module values were calculated in each module and a clustering tree is presented in Figure 2D.
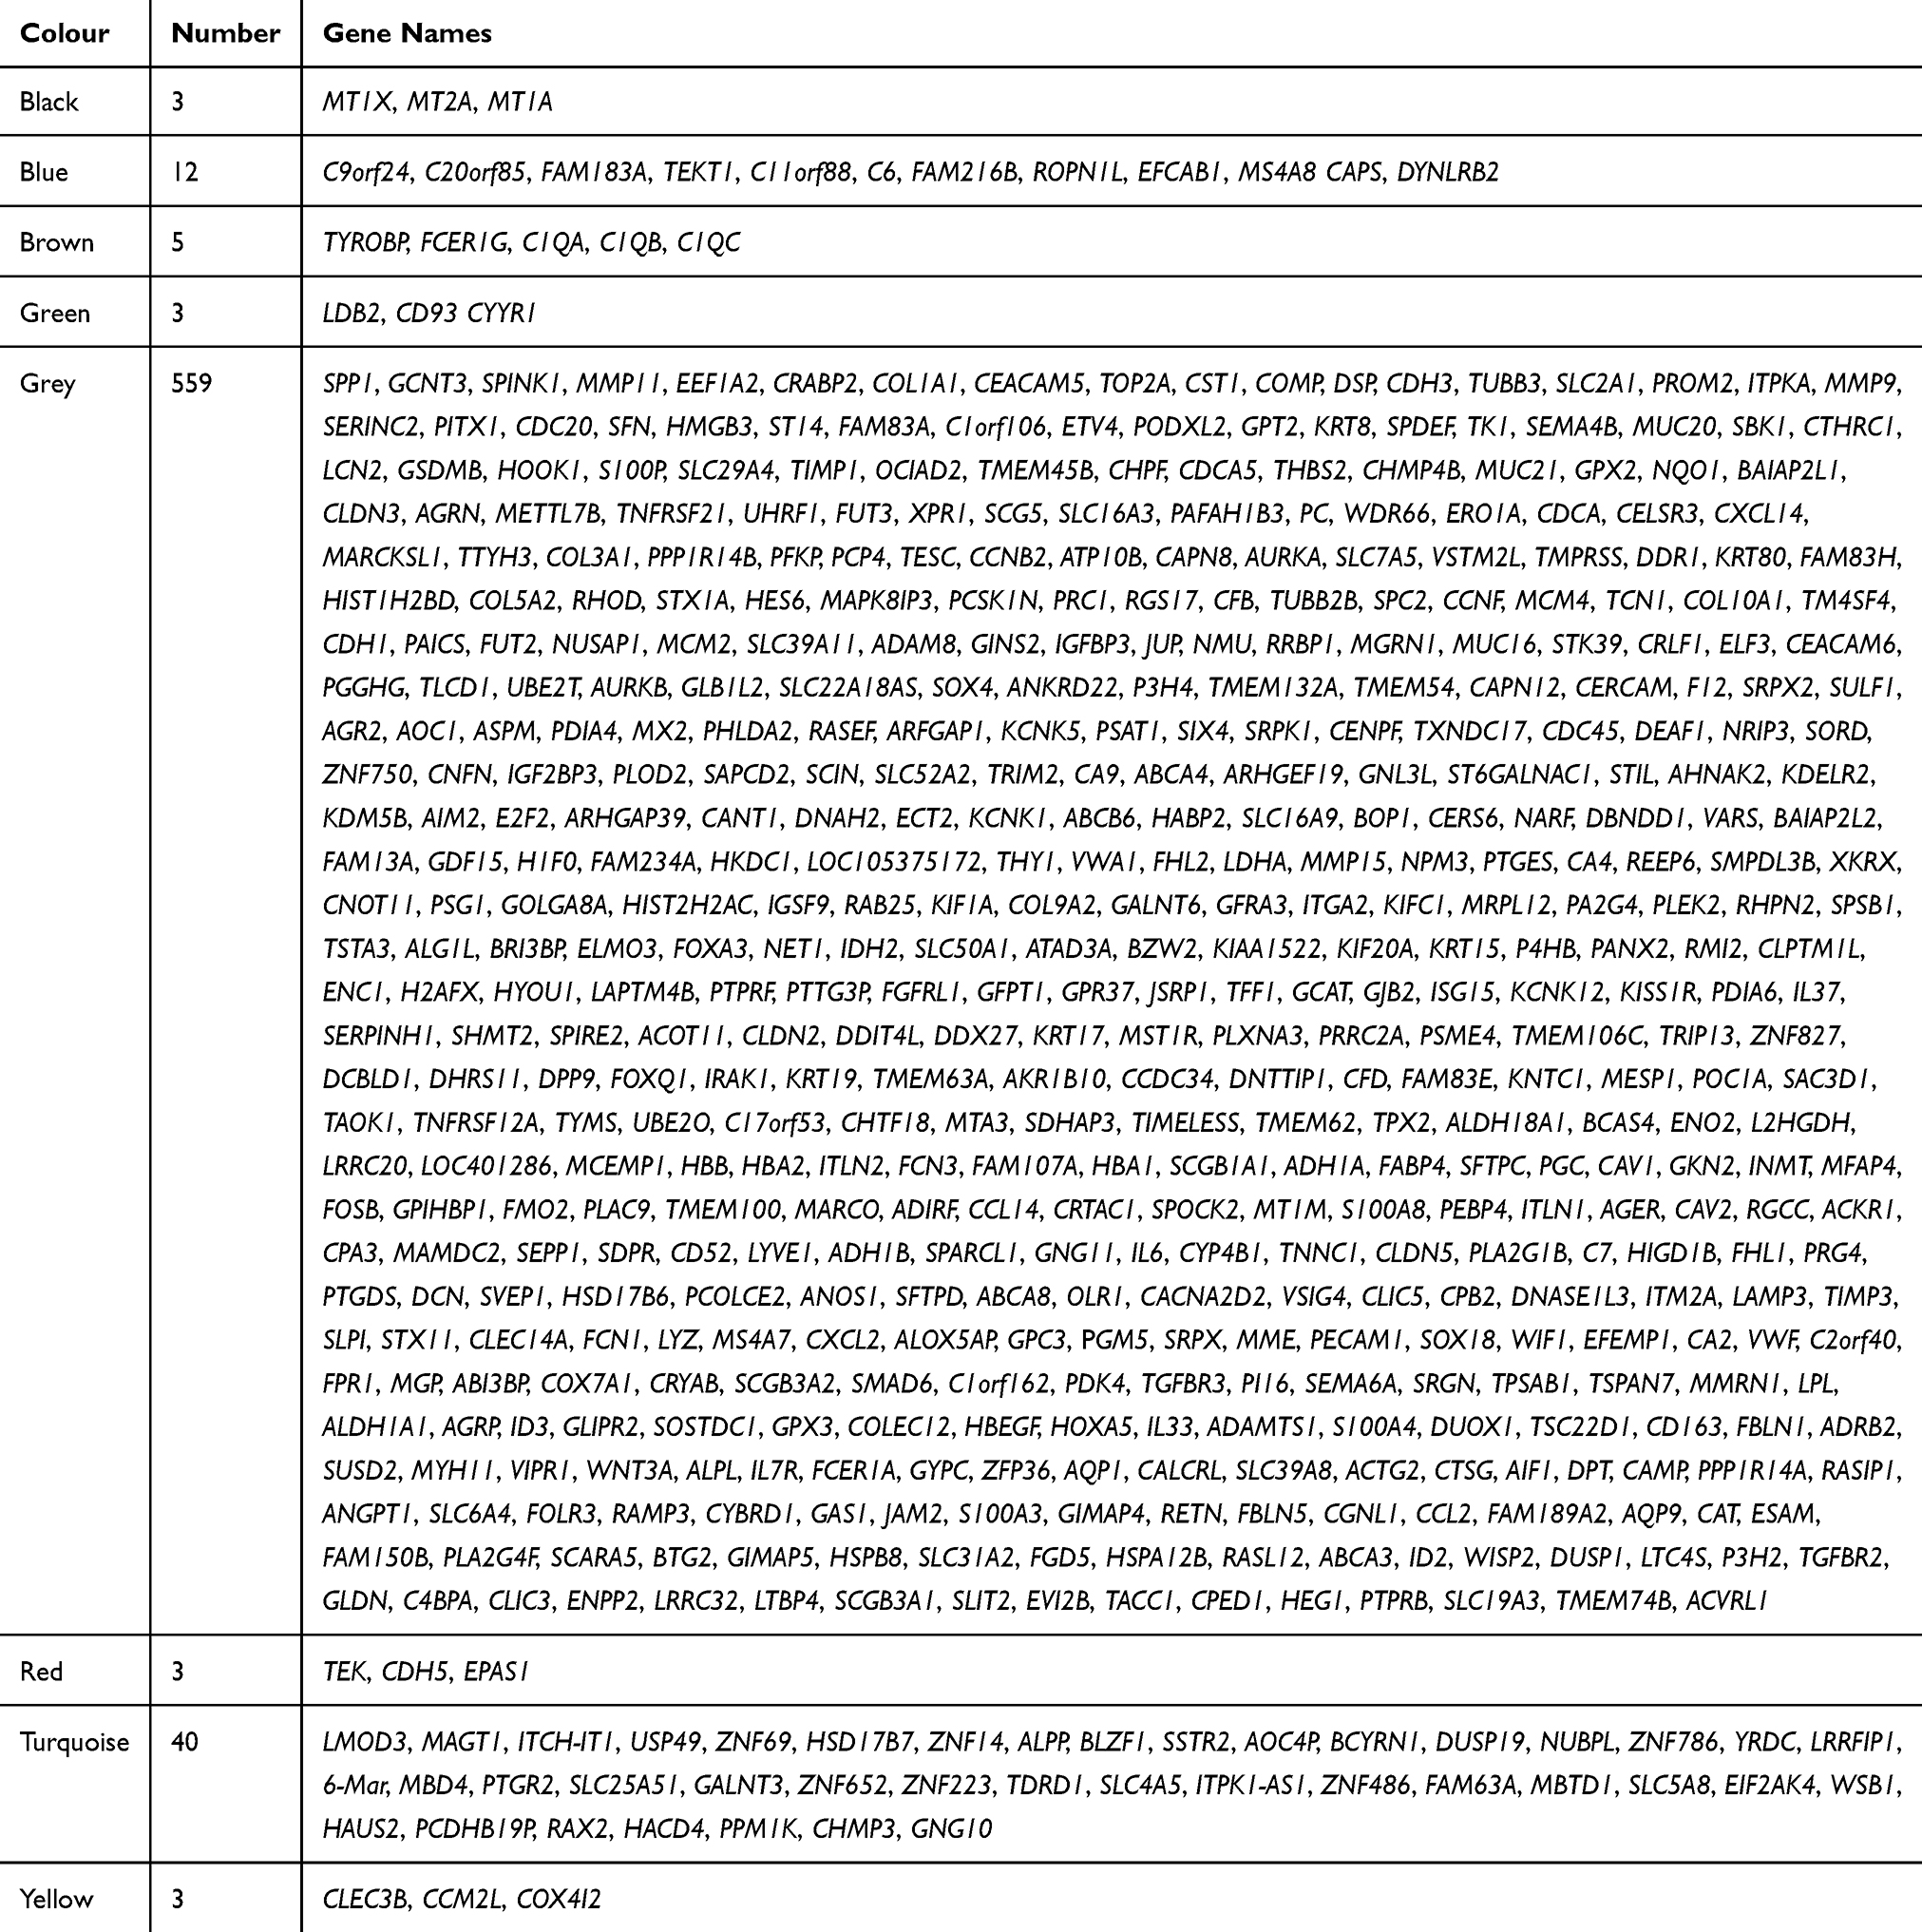 |
Table 2 Each Number of Each Module in WGCNA |
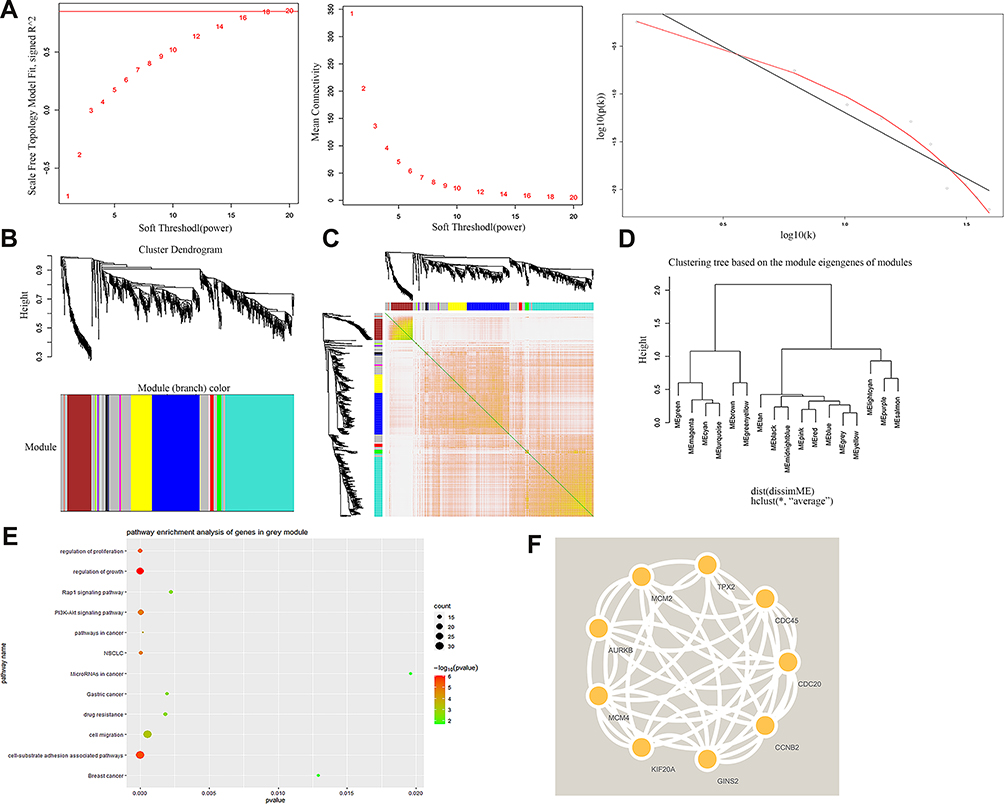 |
Figure 2 WGCNA co-expression network analysis of GSE32863. (A) Scale independence, mean connectivity and scale-free topology. (B) Cluster dendrogram of all up-regulated genes. (C) interaction relationship of co-expression genes. (D) Clustering tree based on the module eigengenes of modules. (E) KEGG analysis of genes in grey module. (F) PPI analysis of top nine up-regulated genes. |
Among all the modules, the grey module had the highest number of genes, containing 559 up-regulated genes. KEGG results indicated that those highly expressed genes were mainly enriched in regulation of growth, cell migration and cell-substrate adhesion associated pathways (Figure 2E). Then we constructed a PPI network to further identify the hub gene. The PPI network of the top nine genes is presented in Figure 2F. Table 3 shows that GINS2 in the grey modules had the highest score (score=0.999). Herein, we explored the biological function of GINS2 in lung adenocarcinoma.
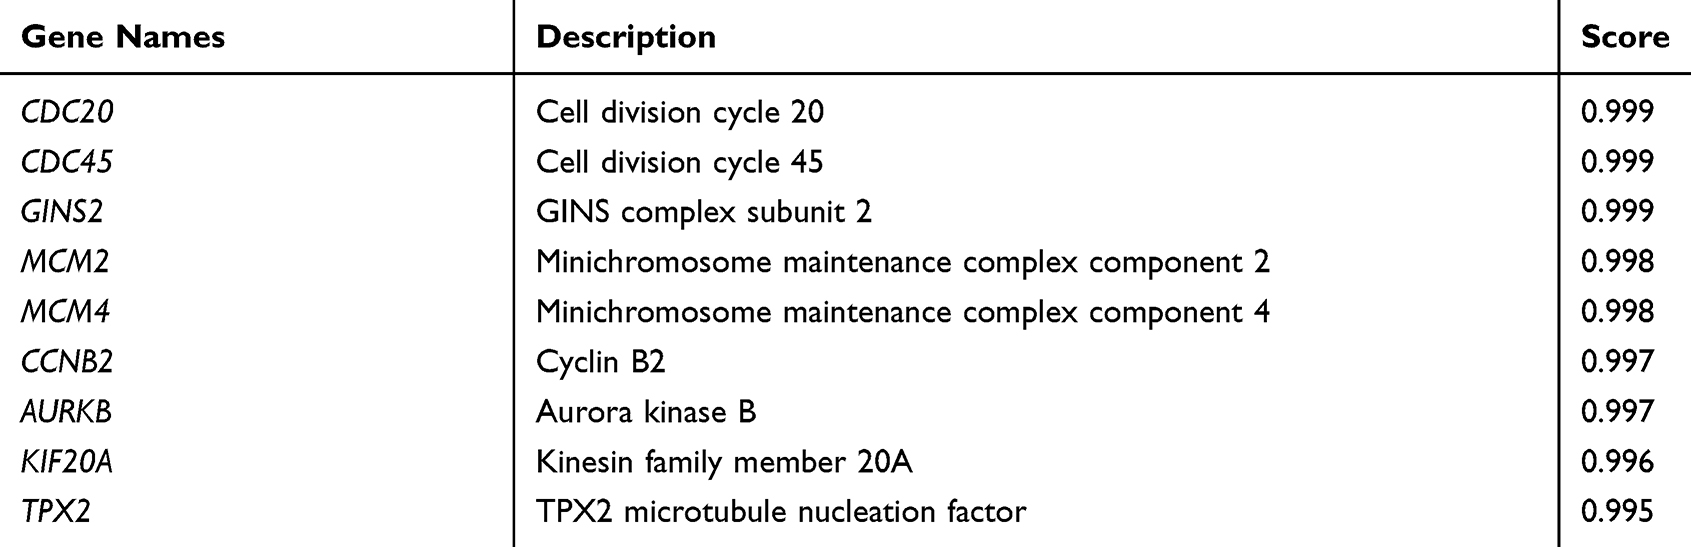 |
Table 3 Nine Hub Genes in the PPI Network Constructed by STRING |
Expression and Clinical Value of GINS2 in Lung Adenocarcinoma
Figure 3A shows that the expressions of GINS2 in patients from the TCGA-LUAD cohort, GSE3286 and clinical samples dataset were significantly higher than that in healthy controls (TCGA-LUAD cohort: p<0.001; GSE32863: p<0.001; clinical samples dataset: p<0.001). Overexpression of GINS2 in the TCGA-LUAD cohort was strongly associated with poor prognosis (Figure 3B: p=0.0075). Next, we performed the ROC curve to establish the prognostic ability of GINS2 in the TCGA-LUAD cohort (Figure 3C), GSE32863 (Figure 3D) and clinical samples dataset (Figure 3E). Table 4 shows that the AUCs of GINS2 in the TCGA-LUAD cohort, GSE32863 and clinical samples dataset were 0.847 (p=0.0023), 0.894 (p<0.001) and 0.851 (p<0.001), respectively. Combined with high sensitivity and specificity, GINS2 could be considered as a candidate prognostic biomarker in lung adenocarcinoma. In addition, GSEA results revealed that high GINS2 expression in the TCGA-LUAD cohort was significantly enriched in the gene sets of “HALLMARK_G2M_CHECKPOINT”, “HALLMARK_E2F_TARGETS”, “HALLMARK_DNA_REPAIR” and “HALLMARK_MYC_TARGETS_V2” (Figure 3F). The results further suggest that GINS2 plays a vital role in the prognosis of lung adenocarcinoma.
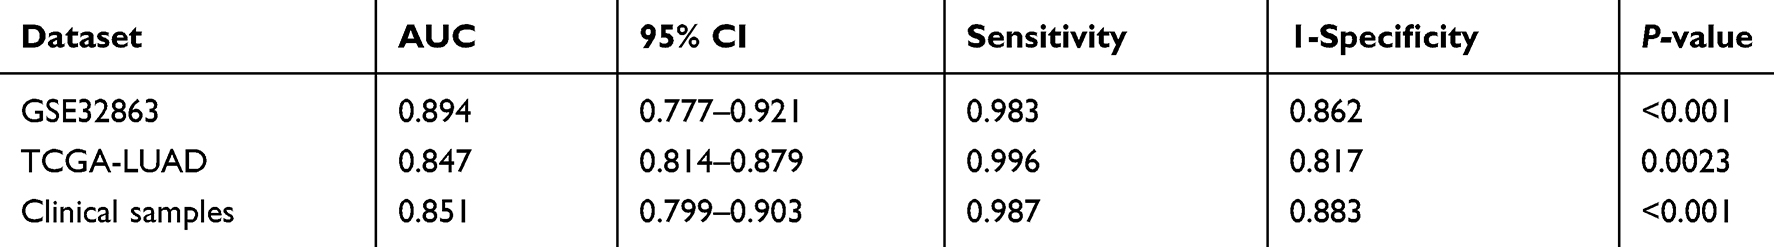 |
Table 4 ROC Analyses Results of GSE32863, TCGA and Clinical Samples |
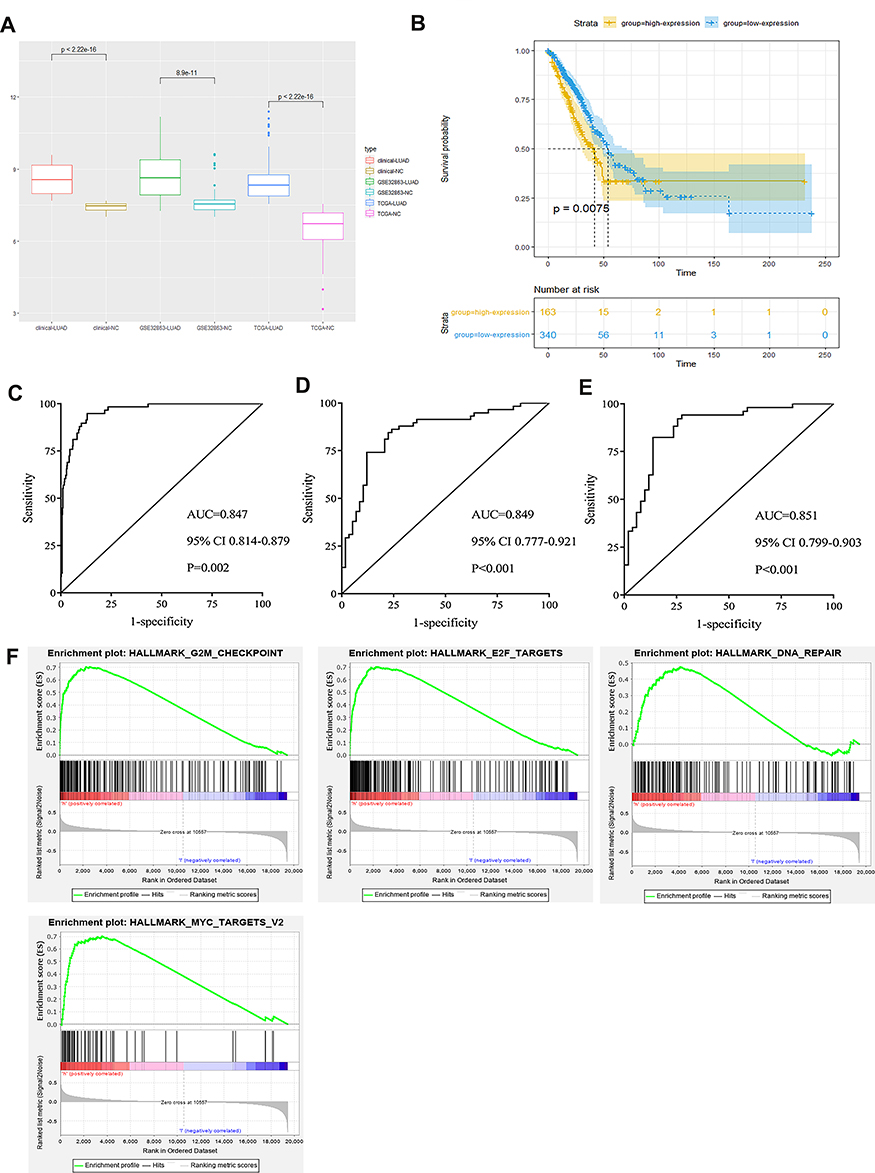 |
Figure 3 Integrative analyses of GINS2. (A) GINS2 expression in TCGA-LUAD cohort, GSE32863 and clinical samples dataset. (B) Prognostic analysis of GINS2 in TCGA-LUAD cohort. (C–E) ROC analysis of GINS2 in TCGA-LUAD cohort (C), GSE32863 (D) and clinical samples dataset (E). (F) GSEA analysis results of GINS2. |
We also explored the relationship between GINS2 expression and clinical information. As Table 5 illustrates, in the clinical samples dataset, GINS2 expression is significantly related to the clinical stage (p<0.001), but not with age, gender or smoking status.
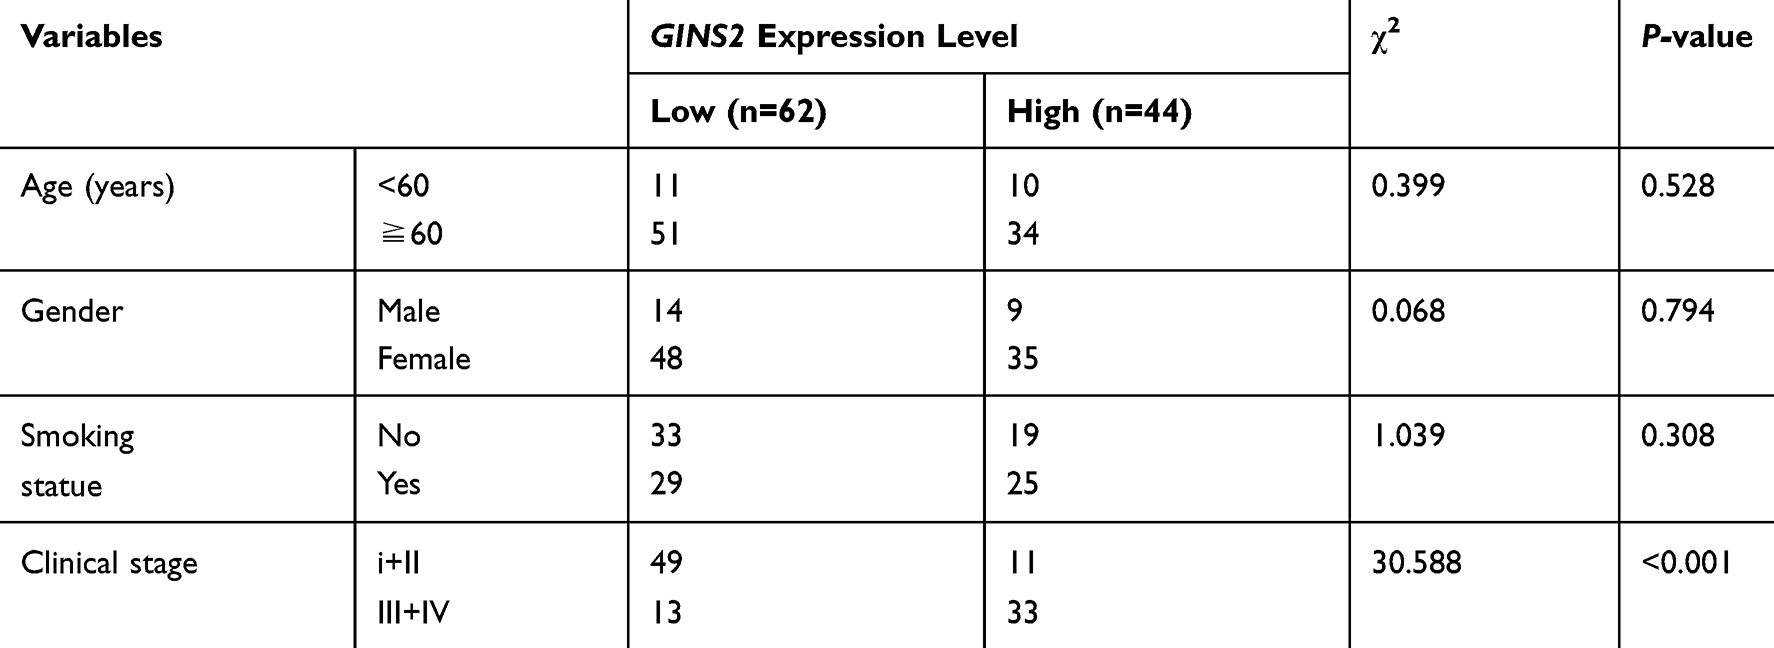 |
Table 5 The Relationship Between GINS2 Expression and Clinical Features in Our Case-Control Study |
Effects of GINS2 on Growth, Migration and Apoptosis of Tumor Cells
The results of RT-PCR (Figure 4A) and Western blot (Figure 4B) showed that the expression of GINS2 in A549 cells was significantly up-regulated. Then we transfected OE-GINS2 and NC plasmids to A549 cells to explore biological functions of GINS2. Expression levels of GINS2 in cells transfected with blank, NC and OE-GINS2 were estimated by PCR (Figure 4C) and Western blot (Figure 4D). GINS2 expression was significantly over-expressed in cells transfected with OE-GINS2 (p<0.001). The result of the MTS assay showed that the growth rate was significantly increased in cells transfected with OE-GINS2 (Figure 4E: p<0.001), suggesting that up-regulation of GINS2 had a significant promotion effect on lung adenocarcinoma cells proliferation. In addition, Figure 4F showed that the migration viability of cells transfected with OE-GINS2 was significantly increased compared with cells transfected with NC and blank (p < 0.001). Figure 4G showed that the apoptosis rate of tumor cells with GINS2 overexpression was significantly decreased. No significant differences between NC and blank groups were observed.
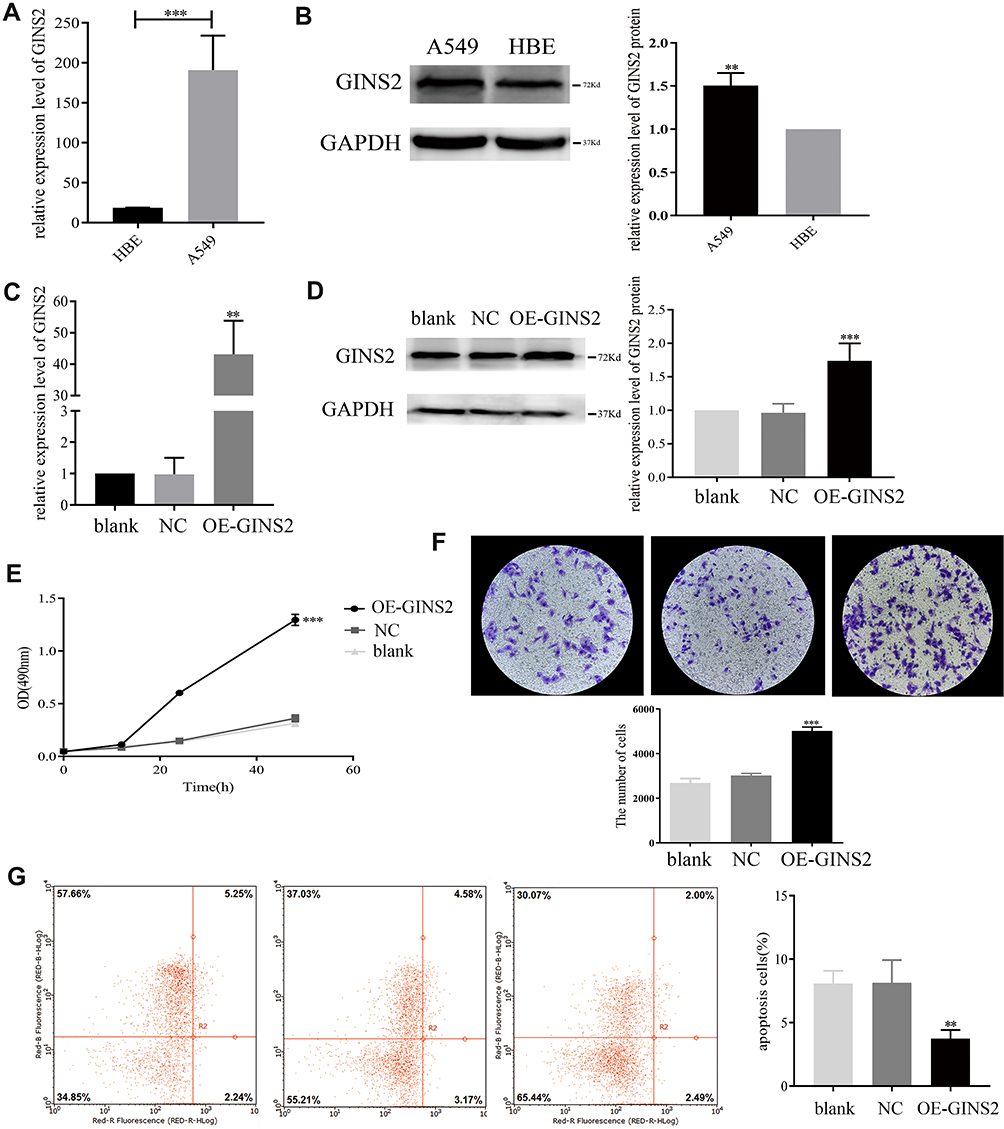 |
Figure 4 Biological mechanism of GINS2 in lung adenocarcinoma. (A) GINS2 mRNA expression in HBE and A549 cells. (B) GINS2 protein expression in HBE and A549 cells. (C) GINS2 mRNA expression in cells transfected with blank, NC and OE-GINS2. (D) GINS2 protein expression in cells transfected with blank, NC and OE-GINS2. (E) up-regulation of GINS2 promoted tumor cells growth. (F) overexpression of GINS2 promoted tumor cells migration. (G) up-regulation of GINS2 suppressed tumor cells apoptosis. **p<0.01, *** p<0.001. |
Discussion
The pathomechanism of lung adenocarcinoma is complicated and multifaceted. Numbers of oncogenes or tumor suppressor genes had been proved in the occurrence and progression of lung adenocarcinoma. In our study, we systematically analyzed the oncogene role of GINS2 in lung adenocarcinoma.
Initially, we analyzed the raw data in GSE32863 and 967 DEGs were identified. Next, we constructed a WGCNA co-expression network to classify DEGs into different modules. WGCNA is a systematic approach to dividing genes with similar expression patterns into the same modules and further exploring correlation between modules.10,11 In our study, after identifying the key module, pathway prediction results illustrated that those genes were mainly enriched in regulation of growth, regulation of cell proliferation and substrate adhesion pathways, suggesting that those DEGs may participate in the occurrence and development of lung adenocarcinoma. In addition, we constructed a PPI network to further identify the hub gene in the grey module. GINS2, with the highest score, was selected to explore the molecular mechanism in lung adenocarcinoma.
Based on the heterotetramer complex structure, GINS2 plays a vital role in chromatin binding and replication activity.12 In other human tumors, for example, in thyroid cancer, over-expression of GINS2 activated cancer cells proliferation and inhibited apoptosis by mediating CITED2 and LOXL2;13,14 In early-stage cervical cancer, GINS2 was significantly over expressed in tumor tissues and cancer cells and had a negative correlation with OS of cervical cancer patients.15 In our study, we downloaded GINS2 expression profile and clinical characteristics in TCGA-LUAD cohort. Over-expression of GINS2 was observed in the TCGA-LUAD cohort, GSE32863 and clinical samples dataset. Additionally, aberrant expression of GINS2 was significantly associated with poor prognosis in lung adenocarcinoma patients. ROC analysis results showed the higher diagnostic value of GINS2 in lung adenocarcinoma. Besides, we concluded that aberrant GINS2 expression had a significant correlation with lung adenocarcinoma clinical stage. Consistently, a study had illustrated that higher expression of GINS2 had significantly association with TNM stages and clinical stages.16 Above all, these findings suggested that overexpression of GINS2 could be a novel diagnostic biomarker in lung adenocarcinoma.
The previous study had indicated that GINS2 acted on PI3K/Akt and MEK/ERK pathways to regulate NSCLC cells proliferation, migration and invasion.16 In our study, GSEA results showed that GINS2 may be enriched in G2M_checkpoint, E2F_targets, DNA-repair and MYC_targets_V2 pathways. Researchers have reported that G2M_checkpoint plays a crucial role in various human tumors.17,18 For example, G2M_checkpoint participated in regulating cells growth and apoptosis of ovarian tumor,19 colon cancer,20 hepatocellular carcinoma,21 and breast cancer.22 Similarly, E2F_targets,23–25 DNA-repair26–28 and MYC_targets_V229–31 pathways were found to participate in tumor therapy, drug resistance, immune evasion and progression. These results further supported that GINS2 participated in the initiation and progression of lung adenocarcinoma.
We found GINS2 to be significantly over expressed in lung adenocarcinoma cells in vitro. MTS results demonstrated that GINS2 accelerated proliferation of tumor cells which is consistent with a previous report.16 In addition, the number of migration cells with higher expression of GINS2 was significantly increased. Consistent with the GSEA results, we indicated that GINS2 promoted the growth and migration abilities of tumor cells in lung adenocarcinoma. The apoptotic rate of cells transfected with GINS2 overexpression plasmids was significantly lower than blank and NC, proving that GINS2 inactivated tumor cells apoptosis. Consistent with the previous study,16 these results further imply that GINS2 could accelerate tumor cell proliferation and migration and inhibit tumor cells apoptosis in vitro.
In conclusion, we utilized GEO raw data to construct WGCNA co-expression network. A hub gene was identified based on the score of PPI network. High expression of GINS2 had better diagnostic values in lung adenocarcinoma. GSEA results predicted pathways which GINS2 may be involved in the progress and development of lung adenocarcinoma. Moreover, we found that GINS2 promoted the proliferation and migration of tumor cells and suppressed the apoptotic rates of tumor cells, further indicating that GINS2 could function as a novel diagnostic and therapeutic biomarker in lung adenocarcinoma.
Abbreviations
AUC, area under curve; Ct, cycle threshold; DEG, differently expressed gene; EDTA, ethylene diamine tetraacetic acid; FBS, fetal calf serum; FCM, flow cytometry; GEO, gene expression omnibus; GSEA, gene set enrichment analysis; KEGG, Kyoto Encyclopedia of Genes and Genomes; LUAD, lung adenocarcinoma; NSCLC, non-small cell lung cancer; OD, optical density; OS, overall survival; PPI, protein-protein interaction; PVDF, polyvinylidene fluoride; ROC, receiver operating characteristic curve; TCGA, The Cancer Genome Atlas; WGCNA, weighted gene co-expression network analysis.
Disclosure
The authors report no conflicts of interest in this work.
References
1. Torre LA, Bray F, Siegel RL, Ferlay J, Lortet-Tieulent J, Jemal A. Global cancer statistics, 2012. CA Cancer J Clin. 2015;65(2):87–108. doi:10.3322/caac.21262
2. Yerukala Sathipati S, Ho SY. Identifying the miRNA signature associated with survival time in patients with lung adenocarcinoma using miRNA expression profiles. Sci Rep. 2017;7(1):7507. doi:10.1038/s41598-017-07739-y
3. Spiro SG, Tanner NT, Silvestri GA, et al. Lung cancer: progress in diagnosis, staging and therapy. Respirology. 2010;15(1):44–50. doi:10.1111/j.1440-1843.2009.01674.x
4. Kubota Y, Takase Y, Komori Y, et al. A novel ring-like complex of Xenopus proteins essential for the initiation of DNA replication. Genes Dev. 2003;17(9):1141–1152. doi:10.1101/gad.1070003
5. Zhang X, Zhong L, Liu BZ, Gao YJ, Gao YM, Hu XX. Effect of GINS2 on proliferation and apoptosis in leukemic cell line. Int J Med Sci. 2013;10(12):1795–1804. doi:10.7150/ijms.7025
6. Rantala JK, Edgren H, Lehtinen L, et al. Integrative functional genomics analysis of sustained polyploidy phenotypes in breast cancer cells identifies an oncogenic profile for GINS2. Neoplasia. 2010;12(11):877–888. doi:10.1593/neo.10548
7. Thomassen M, Jochumsen KM, Mogensen O, Tan Q, Kruse TA. Gene expression meta-analysis identifies chromosomal regions involved in ovarian cancer survival. Genes Chromosomes Cancer. 2009;48(8):711–724. doi:10.1002/gcc.20676
8. Zheng M, Zhou Y, Yang X, et al. High GINS2 transcript level predicts poor prognosis and correlates with high histological grade and endocrine therapy resistance through mammary cancer stem cells in breast cancer patients. Breast Cancer Res Treat. 2014;148(2):423–436. doi:10.1007/s10549-014-3172-7
9. Liu M, Pan H, Zhang F, et al. Identification of TNM stage-specific genes in lung adenocarcinoma by genome-wide expression profiling. Oncol Lett. 2013;6(3):763–768. doi:10.3892/ol.2013.1469
10. Grobner SN, Worst BC, Weischenfeldt J, et al. The landscape of genomic alterations across childhood cancers. Nature. 2018;555(7696):321–327. doi:10.1038/nature25480
11. Zhai X, Xue Q, Liu Q, Guo Y, Chen Z. Colon cancer recurrence-associated genes revealed by WGCNA coexpression network analysis. Mol Med Rep. 2017;16(5):6499–6505. doi:10.3892/mmr.2017.7412
12. Kamada K, Kubota Y, Arata T, Shindo Y, Hanaoka F. Structure of the human GINS complex and its assembly and functional interface in replication initiation. Nat Struct Mol Biol. 2007;14(5):388–396. doi:10.1038/nsmb1231
13. Ye Y, Song Y-N, He S-F, Zhuang J-H, Wang G-Y, Xia W. GINS2 promotes cell proliferation and inhibits cell apoptosis in thyroid cancer by regulating CITED2 and LOXL2. Cancer Gene Ther. 2018;26.
14. Barkley LR, Song IY, Zou Y, Vaziri C. Reduced expression of GINS complex members induces hallmarks of pre-malignancy in primary untransformed human cells. Cell Cycle. 2009;8(10):1577–1588. doi:10.4161/cc.8.10.8535
15. Fei O, Liu J, Xia M, et al. GINS2 is a novel prognostic biomarker and promotes tumor progression in early-stage cervical cancer. Oncol Rep. 2017;37(5):2652–2662. doi:10.3892/or.2017.5573
16. Liu X, Sun L, Zhang S, Zhang S, Li W. GINS2 facilitates epithelial‐to‐mesenchymal transition in non‐small‐cell lung cancer through modulating PI3K/Akt and MEK/ERK signaling. J Cell Physiol. 2019. doi:10.1002/jcp.29381
17. Charrier-Savournin FB, Chateau MT, Gire V, Sedivy J, Piette J, Dulic V. p21-Mediated nuclear retention of cyclin B1-Cdk1 in response to genotoxic stress. Mol Biol Cell. 2004;15(9):3965–3976. doi:10.1091/mbc.e03-12-0871
18. Evan GI, Vousden KH. Proliferation, cell cycle and apoptosis in cancer. Nature. 2001;411(6835):342–348. doi:10.1038/35077213
19. Zaffaroni N, De Marco C, Villa R, Riboldi S, Daidone MG, Double JA. Cell growth inhibition, G2M cell cycle arrest and apoptosis induced by the imidazoacridinone C1311 in human tumour cell lines. Eur J Cancer. 2001;37(15):1953–1962. doi:10.1016/S0959-8049(01)00227-1
20. Yang D, Zhang X, Zhang W, Rengarajan T. Vicenin-2 inhibits Wnt/beta-catenin signaling and induces apoptosis in HT-29 human colon cancer cell line. Drug Des Devel Ther. 2018;12:1303–1310. doi:10.2147/DDDT.S149307
21. Luo Q, Li Y, Deng J, Zhang Z. PARP-1 inhibitor sensitizes arsenic trioxide in hepatocellular carcinoma cells via abrogation of G2/M checkpoint and suppression of DNA damage repair. Chem Biol Interact. 2015;226:12–22. doi:10.1016/j.cbi.2014.12.007
22. He J, Chen Y, Cai L, Li Z, Guo X. UBAP2L silencing inhibits cell proliferation and G2/M phase transition in breast cancer. Breast Cancer. 2018;25(2):224–232. doi:10.1007/s12282-017-0820-x
23. De Meyer T, Bijsmans IT, Van de Vijver KK, et al. E2Fs mediate a fundamental cell-cycle deregulation in high-grade serous ovarian carcinomas. J Pathol. 2009;217(1):14–20. doi:10.1002/path.2452
24. Li Y, Jiao Y, Fu Z, Luo Z, Su J, Li Y. High miR-454-3p expression predicts poor prognosis in hepatocellular carcinoma. Cancer Manag Res. 2019;11:2795–2802. doi:10.2147/CMAR.S196655
25. Ma Y, Kurtyka CA, Boyapalle S, et al. A small-molecule E2F inhibitor blocks growth in a melanoma culture model. Cancer Res. 2008;68(15):6292–6299. doi:10.1158/0008-5472.CAN-08-0121
26. Shah AP, Patel CN, Sureja DK, Sanghavi KP. A review on DNA repair inhibition by PARP inhibitors in cancer therapy. Folia Med (Plovdiv). 2018;60(1):39–47. doi:10.1515/folmed-2017-0067
27. Mladenov E, Magin S, Soni A, Iliakis G. DNA double-strand-break repair in higher eukaryotes and its role in genomic instability and cancer: cell cycle and proliferation-dependent regulation. Semin Cancer Biol. 2016;37–38:51–64. doi:10.1016/j.semcancer.2016.03.003
28. Truini A, Germano G, Bardelli A. Inactivation of DNA repair-prospects for boosting cancer immune surveillance. Genome Med. 2018;10(1):91. doi:10.1186/s13073-018-0603-9
29. Dang CV. MYC on the path to cancer. Cell. 2012;149(1):22–35. doi:10.1016/j.cell.2012.03.003
30. Stine ZE, Walton ZE, Altman BJ, Hsieh AL, Dang CV. MYC, metabolism, and cancer. Cancer Discov. 2015;5(10):1024–1039. doi:10.1158/2159-8290.CD-15-0507
31. Hsieh AL, Walton ZE, Altman BJ, Stine ZE, Dang CV. MYC and metabolism on the path to cancer. Semin Cell Dev Biol. 2015;43:11–21. doi:10.1016/j.semcdb.2015.08.003
 © 2020 The Author(s). This work is published and licensed by Dove Medical Press Limited. The full terms of this license are available at https://www.dovepress.com/terms.php and incorporate the Creative Commons Attribution - Non Commercial (unported, v3.0) License.
By accessing the work you hereby accept the Terms. Non-commercial uses of the work are permitted without any further permission from Dove Medical Press Limited, provided the work is properly attributed. For permission for commercial use of this work, please see paragraphs 4.2 and 5 of our Terms.
© 2020 The Author(s). This work is published and licensed by Dove Medical Press Limited. The full terms of this license are available at https://www.dovepress.com/terms.php and incorporate the Creative Commons Attribution - Non Commercial (unported, v3.0) License.
By accessing the work you hereby accept the Terms. Non-commercial uses of the work are permitted without any further permission from Dove Medical Press Limited, provided the work is properly attributed. For permission for commercial use of this work, please see paragraphs 4.2 and 5 of our Terms.