Back to Journals » International Journal of Nanomedicine » Volume 17
Gentiopicroside PLGA Nanospheres: Fabrication, in vitro Characterization, Antimicrobial Action, and in vivo Effect for Enhancing Wound Healing in Diabetic Rats
Authors Almukainzi M ![]() , A El-Masry T, A Negm W
, A El-Masry T, A Negm W ![]() , Elekhnawy E
, Elekhnawy E ![]() , Saleh A, E Sayed A, A Khattab M, H Abdelkader D
, Saleh A, E Sayed A, A Khattab M, H Abdelkader D ![]()
Received 24 January 2022
Accepted for publication 9 March 2022
Published 17 March 2022 Volume 2022:17 Pages 1203—1225
DOI https://doi.org/10.2147/IJN.S358606
Checked for plagiarism Yes
Review by Single anonymous peer review
Peer reviewer comments 4
Editor who approved publication: Prof. Dr. Anderson Oliveira Lobo
May Almukainzi,1 Thanaa A El-Masry,2 Walaa A Negm,3 Engy Elekhnawy,4 Asmaa Saleh,1,5 Ahmed E Sayed,6 Mohamed A Khattab,7 Dalia H Abdelkader8
1Department of Pharmaceutical Sciences, College of Pharmacy, Princess Nourah Bint Abdulrahman University, Riyadh, Saudi Arabia; 2Pharmacology and Toxicology Department, Faculty of Pharmacy, Tanta University, Tanta, Egypt; 3Pharmacognosy Department, Faculty of Pharmacy, Tanta University, Tanta, Egypt; 4Pharmaceutical Microbiology Department, Faculty of Pharmacy, Tanta University, Tanta, Egypt; 5Department of Biochemistry, Faculty of Pharmacy, Al Azhar University, Cairo, Egypt; 6Faculty of Medicine, Tanta University, Tanta, Egypt; 7Department of Cytology and Histology, Faculty of Veterinary Medicine, Cairo University, Giza, Egypt; 8Pharmaceutical Technology Department, Faculty of Pharmacy, Tanta University, Tanta, Egypt
Correspondence: Dalia H Abdelkader, Pharmaceutical Technology Department, Faculty of Pharmacy, Tanta University, Tanta, 31111, Egypt, Tel +20 40 3336007, Fax +20 40 3335466, Email [email protected]; [email protected]
Purpose: Gentiopicroside (GPS), an adequate bioactive candidate, has a promising approach for enhancing wound healing due to its antioxidant and antimicrobial properties. Its poor aqueous solubility negatively affects oral absorption accompanied by low bioavailability due to intestinal/hepatic first-pass metabolism. Our aim in this study is to fabricate GPS into appropriate nanocarriers (PLGA nanospheres, NSs) to enhance its solubility and hence its oral absorption would be improved.
Methods: Normal and ODS silica gel together with Sephadex LH20 column used for isolation of GPS from Gentiana lutea roots. Crude GPS would be further processed for nanospheres fabrication using a single o/w emulsion solvent evaporation technique followed by in vitro optimization study to examine the effect of two formulation variables: polymer (PLGA) and stabilizer (PVA) concentrations on the physical characterizations of prepared NSs. Possible GPS-PLGA chemical and physical interactions have been analyzed using Fourier-transform infrared spectroscopy (FTIR) and differential scanning calorimetry (DSC). The optimum GPS-PLGA NSs have been chosen for antimicrobial study to investigate its inhibitory action on Staphylococcus aureus compared with unloaded GPS NSs. Also, a well-designed in vivo study on streptozotocin-induced diabetic rats has been performed to examine the wound healing effect of GPS-PLGA NSs followed by histological examination of wound incisions at different day intervals throughout the study.
Results: The optimum GPS PLGA NSs (F5) with well-controlled particle size (250.10± 07.86 nm), relative high entrapment efficiency (83.35± 5.71), and the highest % cumulative release (85.79± 8.74) have increased the antimicrobial activity as it exhibited a higher inhibitory effect on bacterial growth than free GPS. F5 showed a greater enhancing impact on wound healing and a significant stimulating effect on the synthesis of collagen fibers compared with free GPS.
Conclusion: These findings demonstrate that loading GPS into PLGA NSs is considered a promising strategy ensuring optimum GPS delivery for potential management of wounds.
Keywords: core/shell nanospheres, in-vitro optimization, sustained-release, Staphylococcus aureus, histological evaluation, collagen fibers
Introduction
Gentiana lutea L. (Family Gentianaceae) is a perennial plant used to prepare pharmaceutical and food items worldwide.1 Gentiana lutea root (Gentianae radix) is an authorized European Pharmacopoeia drug that was used to treat a variety of human digestive ailments.2 G. lutea also has several medical benefits and immunomodulatory properties.3–5 The presence of the primary bitter-tasting secoiridoid gentiopicroside (GPS) is attributed to the health benefits of G. lutea roots.6 Gentiopicroside is a well-known chemical constituent present as a major constituent in G. lutea roots, it has various biological effects like antifungal, antibacterial, anti-inflammatory, hepatoprotective, and free radical-scavenging activities.7 In our research, we focused on the wound healing activity of GPS that might be attributed to its free radical scavenger property, antimicrobial effect, and enhancing the synthesis of collagen fibers via supporting the vascularity, suppressing cell damage, and improving cellular migration/proliferation.8 Furthermore, the antimicrobial activity of GPS has been individually investigated against Staphylococcus aureus because it is a broadly distributed pathogenic bacteria that are responsible for different diseases. It can result in many worldwide invasive infections with high mortality rates owing to its multiple virulence factors. In addition, the quick emergence and spreading of multi-drug resistant isolates have become a great problem for public health.9
Recently, PLGA core/shell nanospheres (NSs) could be considered an optimum drug delivery nanosystem encapsulation versatile types of bioactive agents with different physical and chemical properties.10 The single emulsion-solvent evaporation method (SESEM) is widely employed for the fabrication of PLGA nanospheres, it could produce NSs with homogeneous size distribution, controlled particle size, stable nanostructured carriers with little risk of aggregation, and better drug stability.11 There are two basic processes in SESEM. Firstly, the polymer and the drug are dissolved in a volatile organic solvent. The oil-in-water emulsion (o/w) is made by diluting the polymer organic solution (oil phase) with water and a stabilizer. The organic solvent is then evaporated in the second step, either by continuous stirring at ambient temperature or under reduced pressure. Following the evaporation of the organic solvent, the polymer precipitates as nanospheres with diameters of a few hundred nanometers. To remove the excess stabilizer and free drug, the nanoparticles are usually recovered by ultracentrifugation and rinsed with distilled water.12 Several factors could be studied to investigate the efficacy of the nanoencapsulation process such as a) the nature and solubility of the drug; b) polymer concentration, molecular weight, and type; c) the drug/polymer proportion; d) the organic solvent used; e) the concentration and type of surfactant used; f) the emulsification process regarding stirring speed and temperature, and g) the volume and viscosities of the dispersed and continuous phases. Manipulation of these variables has been demonstrated to optimize NSs size and encapsulation efficiency.11
PLGA is a universe polymer widely employed for encapsulating the hydrophobic drug in an organic core surrounding the hydrophilic aqueous shell that might be loaded with a second hydrophilic active agent.13,14 PLGA offers high drug entrapment efficiency and sustained release effect with controlled kinetic parameters.15 Loading GPS into nanocarriers could effectively enhance its solubility, absorption, and bioavailability. As mentioned in previous literature, GPS is sparingly soluble (20mg/mL) and poorly absorbed from the gastrointestinal tract. It might be exposed to decomposition by GIT bacterial flora. Also, it is metabolized by intestinal/hepatic first-pass metabolism achieving very low oral bioavailability 39.6%.16,17 In our study, we have prepared PLGA NSs loaded with GPS using SESEM. Then, in vitro optimization survey has been carried out to select the most appropriate formula utilized in further antimicrobial and in vivo studies.
Materials and Methods
Material
PLGA, MW 24,000–38,000, Poly (D,L-lactide-co-glycolide, acid terminated, lactide: glycolide 50:50), PVA, Poly (vinyl alcohol) (MW=31,000–50,000, 87–89% hydrolyzed) and Streptozotocin (STZ) were supplied from Sigma Aldrich, UK. Sodium citrate, Citric acid, Sodium lauryl sulfate (SLS), Dichloromethane (DCM), and Dimethylformamide (DMF) were all purchased from Al - Gomhoria Co. for medicines and medical supplies, Egypt. Oxoid™ Phosphate Buffered Saline Tablets were obtained from ThermoFisher Scientific, USA.
Gentiana lutea L. radix was purchased from Bozhou Swanf Commercial and Trade Co., Ltd, China. Silica gel F254 (Merck, 70–230 mesh), ODS (RPC18, Merck, Germany), and Sephadex LH-20 (Sigma–Aldrich Chemical Co. St. Louis, MO, USA) were used for column chromatography. All the chemicals and solvents utilized for extraction and isolation of Gentiopicroside (GPS) were purchased from Sigma Aldrich, USA. All solvents, reagents, and kits used throughout the study were of proper standard limits with no further purification.
Plant Material, Extraction, and Isolation of GPS
The identification of the plant was confirmed by Dr/Esraa Ammar, Plant Ecology Assistant Professor, Faculty of Science, Tanta University. A voucher specimen (PGA-G-124-W) was preserved in the herbarium of the Pharmacognosy Department, Tanta Pharmacy. The powdered root (250 g) was extracted with methanol using the cold maceration method (3 × 3 L) at room temp. to obtain a residue (53.33 g), the methanol extract was filtered, and the filtrate was concentrated under pressure, suspended in water, then partitioned with n-hexane, ethyl acetate, and n-butanol in order. The n-butanol fraction (10 g) was chromatographed (φ 3.5×75 cm, 250 g silica, fraction collected 30 mL) eluting with CHCl3 then MeOH 10% increment. The fraction eluted with CHCl3/MeOH 70:30 (1.16 g) was subjected to a reversed-phase silica gel column (ODS) eluted with H2O then decrease the polarity by MeOH. The fraction was eluted with MeOH/H2O 60:40 to yield a yellowish powder (593 mg) then purified on Sephadex LH-20 eluted with 100% MeOH to obtain compound I (GPS) that has been further encapsulated into PLGA NSs.
Spectral Techniques
NMR spectra were recorded at 500 MHz for 1H and 125 MHz for 13C using a JEOL ECA-500 II NMR spectrometer. To dissolve the NMR sample, DMSO-d6 was utilized. The solvent resonances were used to normalize the chemical shifts. The ESI-MS was conducted using Thermo Scientific ISQ Quantum Access MAX Triple Quadrupole system, Xcalibur 2.1 software, and USA Mass Spectrometer.
Preparation of GPS PLGA NSs
GPS-loaded PLGA NSs were prepared using the single emulsion solvent evaporation method as previously mentioned.11,18 As demonstrated in Table 1, different concentrations of PLGA (% w/v) dissolved in DCM were added to DMF containing GPS (60 mg). The organic phase with a volume ratio of DCM (1): DMF (1) was then vortexed for 1 minute to ensure complete homogeneity. The organic phase was added drop wisely to 10 mL of aqueous phase containing various concentrations of PVA (%w/v) (Table 1) under intense sonication using an ultrasonic probe (Cole-Parmer Model 50 Cp T 4710 Series, USA) for 2 minutes followed by cooling in ice bath.19 The formulated o/w emulsions were gently stirred for 2–3 hrs of solvent evaporation. GPS-PLGA NSs pellets were then collected by centrifugation (Hettich Microliter Centrifuge MIKRO 220, Germany) at 15,000 rpm and - 4°C for 20 minutes. Two additional centrifugation cycles were performed after the dispersion of the collected pellets in 10 mL of purified water to remove residuals of PVA and then NSs pellets were finally redispersed19 for further characterization. Unloaded placebo NSs were similarly prepared without the addition of GPS in the organic phase (Table 1).
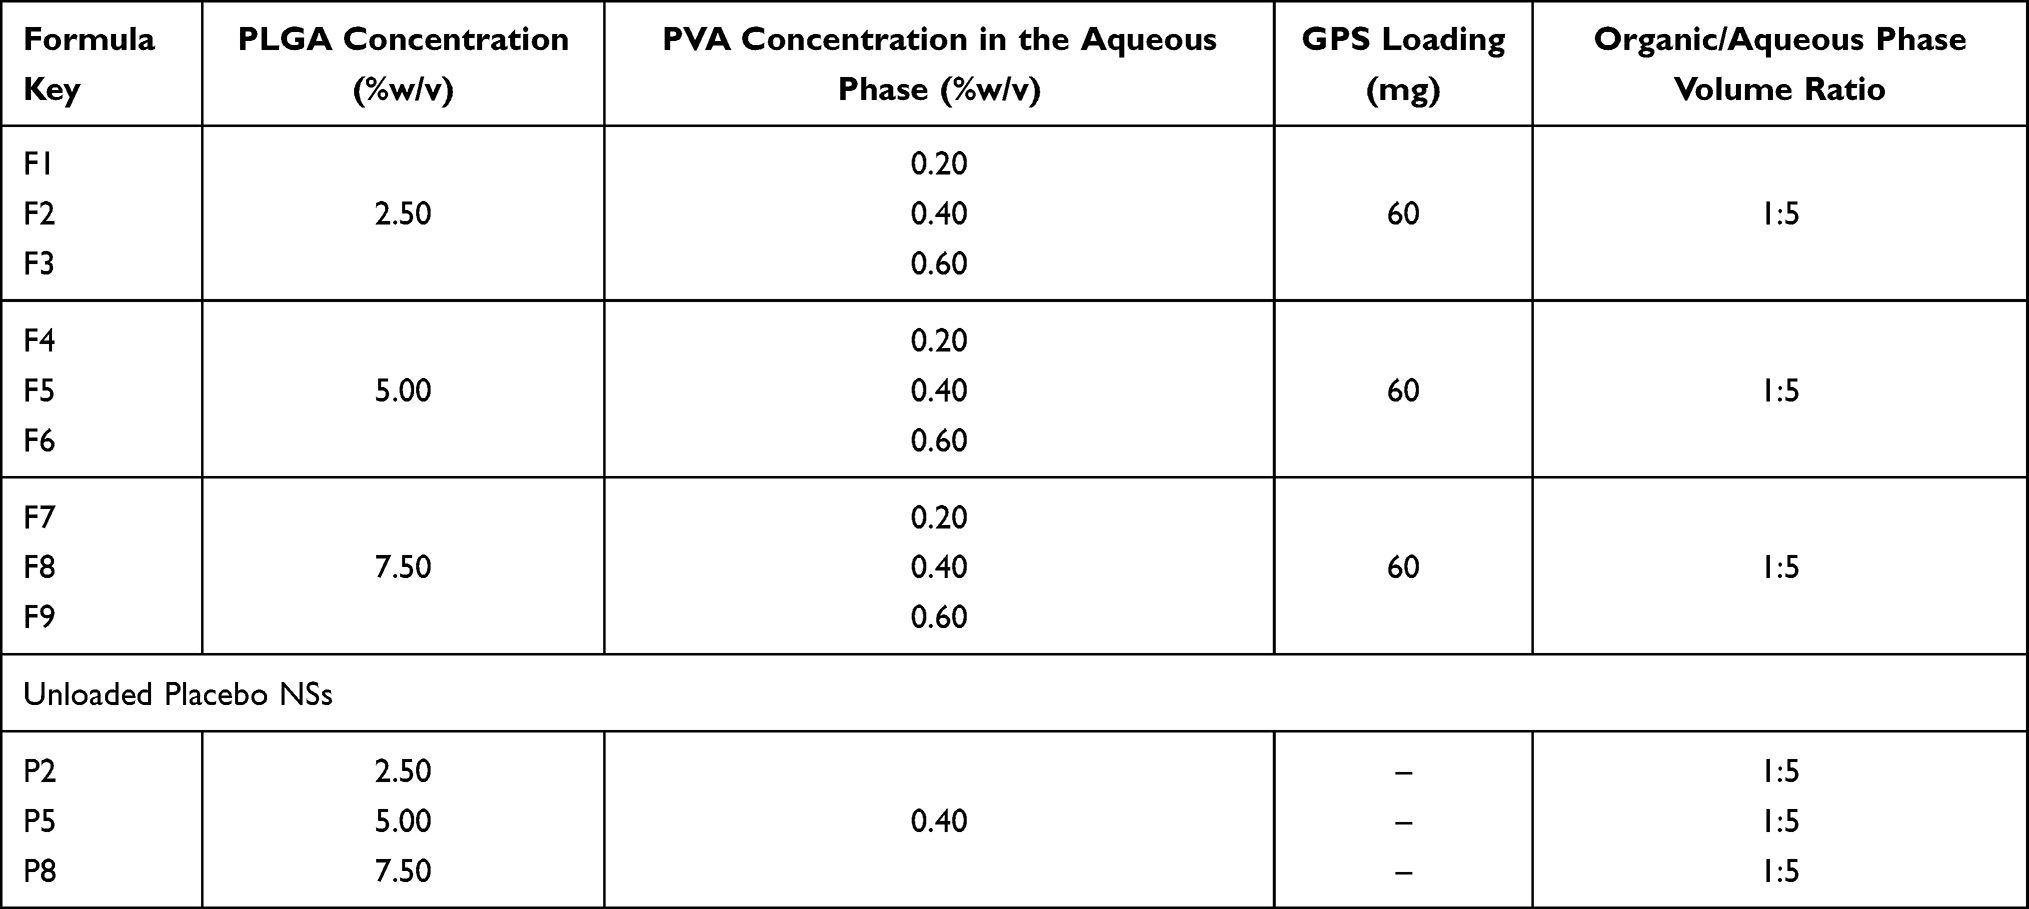 |
Table 1 Formulae Key, Composition, and Formulation Variables of PLGA NSs Unloaded/Loaded with GPS |
In vitro Characterization of PLGA NSs Loaded with GPS
Two formulations variables, PLGA and PVA concentrations, upon three levels of each (Table 1) were fully investigated to study their influences on the physical characterizations of GPS loaded PLGA NSs regarding particle size, polydispersity index (PDI), zeta potential, percent entrapment efficiency (%EE) and in vitro release behavior.
Particle Size, Polydispersity Index, and Zeta Potential
All the prepared unloaded/loaded PLGA NSs (presented in Table 1) have been evaluated in terms of mean particle diameter, size distribution range, and surface charge. Particle size (nm), polydispersity index (PDI), and zeta potential (mV) were measured using Brookhaven zetasizer (NanoBrook 90Plus, Brookhaven Instruments Corporation, U.S.A). PLGA-NSs samples were properly diluted for accurate analysis. All measurements were performed in triplicate and the results were represented as mean ±SD.
Percent Entrapment Efficiency and Drug Loading
The amount of GPS loaded into PLGA core was quantified indirectly by measuring the amount of unentrapped GPS escaped from nanocomposite. Free GPS remained in the supernatant after centrifugation step during preparation of PLGA-NSs has been estimated using UV-visible spectrophotometry (Evolution 300 spectrophotometer, Thermo Scientific, UK) at a detection wavelength of 230 nm.20 The percent of GPS entrapment has been calculated as follows:21

Transmission Electron Microscopy
The morphology of GPS-loaded PLGA NSs (F2, F5, and F8) and their corresponding unloaded placebo PLGA NSs (P2, P5, and P8) were analyzed under transmission electron microscopy (JEM-2100 Electron Microscope, JEOL Ltd, Japan). Samples of PLGA-NSs were loaded onto copper grids coated with carbon film and left till fixation before visualization. Scale bars and measurements have been adjusted using Image J software.
Polymer-Drug Compatibility
Fourier-Transform Infrared Spectroscopy (FTIR)
The FTIR spectra bands of GPS PLGA NSs (F5) and its individual components of PLGA 50:50 and free GPS were fully investigated using FTIR spectrophotometer (Bruker Tensor 27, Germany). Potassium bromide was physically mixed with the samples, compacted into spherical desks, and then loaded into FTIR spectrophotometer run in the range of 4000 to 400 cm−1.
Differential Scanning Calorimetry (DSC)
Endothermic peaks of GPS-PLGA NSs (F5), PLGA 50:50, and free GPS were detected using (DISCOVERY DSC25, WatersTM, TA instruments, USA). The rate of nitrogen purge was set at 40 mL/min into DSC cell. Additionally, the heating rate was adjusted to be 10°C/min for all samples. Thermal scanning was run in the range of 20–200°C.
In vitro Release Pattern
In -vitro release study has been carried out using dialysis membrane method.22,23 Pockets of dialysis membrane (Molecular weight cut off 12–14 kDa, Fisher Scientific, U.S.A) were saturated with release media by soaking overnight. Dispersions of GPS-PLGA NSs (4 mL) were then tightly packed in the previously saturated dialysis bags to be immersed in 100 mL24 of PBS (pH=7.4)25 containing 1%w/v SLS at 37°C23 with continuous stirring at 100 rpm.26 At different time intervals of 1, 2, 4, 6, 8, 10, 24, 48, and 72 hours, a sample (5 mL) has been withdrawn for UV-spectrophotometry analysis. Release media has been replenished with a similar volume of fresh medium. The release of free GPS with an equivalent amount to its corresponding loaded in PLGA NSs was parallelly investigated using the same procedure mentioned before. All in vitro release runs were performed in triplicate and the total percent cumulative release was expressed as a mean +SD.18
Antimicrobial Study
Isolation and Identification of Bacteria
A total of 25 S. aureus clinical isolates were recovered from foot ulcers in diabetic patients. They were subjected to microscopical examination and biochemical testing to be identified as S. aureus.27
Antimicrobial Susceptibility Testing
It was performed by Kirby–Bauer method to examine the bacterial susceptibility to 9 antimicrobials. The utilized antimicrobial discs (Oxoid, UK) were amoxicillin-clavulanic acid, cefoxitin, ceftriaxone, oxacillin, vancomycin, trimethoprim-sulfamethoxazole, ciprofloxacin, erythromycin, chloramphenicol.28 Isolates that are resistant to three or more antimicrobial classes are considered to be multidrug-resistant.
Susceptibility to Placebo NSs, Free GPS, and GPS PLGA NSs
In vitro antibacterial effect of free GPS, GPS PLGA NSs (F5), and placebo NSs was studied by Kirby–Bauer method.29 The tested concentration of free GPS was tightly controlled to be equivalent to that loaded in GPS-PLGA NSs. Briefly, suspensions (100 µL) of each tested isolate were dispersed on Muller-Hilton agar plates. Five wells were made using a sterile cork-borer and the wells were filled with 100 μL aliquot of free GPS, GPS PLGA NSs (F5), placebo NSs, dimethyl sulfoxide (10%, negative control), and vancomycin (30 μg/mL, positive control).
Determination of Minimum Inhibitory Concentrations (MICs) of Free GPS and GPS PLGA NSs
The values of MICs were determined for free GPS and GPS PLGA NSs (F5) by broth microdilution method.30 Each microtitration plate contained a positive control (bacterial suspension only) and negative control (broth only). The values of MICs were estimated as the lowest concentration that exhibited a complete growth inhibition. The subsequent tests (growth curve and microscopical examination) were conducted by treatment of S. aureus isolates with 0.5 MIC values of free GPS and GPS PLGA NSs.
Effect on the Growth Process
The impact of free GPS and GPS PLGA NSs (F5) on the growth of S. aureus was demonstrated as previously described using 0.5 MIC values.31 The optical density (OD) of the treated and untreated S. aureus isolates was detected at 620 nm by UV–Vis spectrophotometer (SHIMADZU, Japan) at different time intervals of 0, 1, 3, 5, 7 till 24 hrs. Then, the bacterial growth curves were created by plotting log OD620 against time (hrs).
Effect on Bacterial Morphology Using a Scanning Electron Microscope (SEM)
The treated and untreated S. aureus isolates were inspected as previously described32 using a scanning electron microscope (JSM-6510LV Scanning Electron Microscope, JEOL Ltd, Japan) to study the impact of free GPS and GPS PLGA NSs (F5) on the bacterial morphology.
In vivo Wound Healing Study
The animal protocol including details of handling, feeding, framework design, and authentication at the end of the study was approved (Approval No: TP-RE-09-21-001) by the Animal Ethics Committee of Faculty of Pharmacy, Tanta University, Egypt. The welfare of experimental animals has been implemented according to the guidelines of The Animal (Scientific Procedures) Act 1986).
Induction of Streptozotocin (STZ) Diabetes
In this study, our model animal is a male Sprague-Dawley rat weighing 200–250 g injected with a single intraperitoneal dose of STZ (50–60mg/kg) freshly prepared in 0.1 M sodium citrate buffer (pH= 4.5). All rats have fasted for 6–8 hrs prior to injection. A blood glucose level was measured 48 hrs post-injection using a glucometer (Clever Check, TD-4231, Simple Diagnostics, U.S.A). Rats were considered to be diabetic if their glucose level exceed 250 mg//dL.33
Experimental Groups
Four groups, each containing 24 rats, were randomly assigned. Group I (Control) received no medication throughout the study. Placebo PLGA NSs, free GPS (300 mg/kg),34 and GPS-PLGA NSs loaded with an equivalent dose of free GPS were orally administrated for groups II, III, and IV respectively. The treatment was readministered every three days for 12 days.
Incision of Wounds and Treatment
An excision wound with approximately 0.7 cm diameter was created on the dorsal thoracic area on each rat after cleansing with a depilatory agent.35 Proper anesthetic protocol using interpretational injections of xylapan (0.3 mg/kg) and ketamine (10 mg/kg)36 was employed before surgery considering the time of wound incision is day zero. At day intervals of 3, 6, 9, and 12 days, six rats from each group were euthanized and wound diameter was estimated to calculate % of wound injury index36 (Eqn. 2) using digital calipers and the average of multiple readings recorded from different wound’s directions has been calculated. Then, skin tissues were collected for further histological analysis.

Skin Histological Analysis
Dissected Skin wound tissue samples were fixed in 10% neutral buffered formalin for 72 hrs. Samples were processed in serial grades of ethanol, cleared in xylene then infiltrated with synthetic paraplast tissue embedding medium. Tissue sections were cut by rotatory microtome at middle zones of different wound samples for demonstration of different skin layers. Then, fixed into glass slides and stained with hematoxylin and eosin as a general microscopic examination staining method. Masson’s trichrome stain was also utilized for the demonstration of collagen fibers. All standard procedures for samples fixation and staining were done according to Culling techniques.37 Six random non-overlapping fields from each sample were totally scanned and analyzed for obtaining the mean area percentage of segmented dermal collagen in Masson’s trichrome stained section.38 All data and micrographs were obtained by using a Full HD microscopic imaging system operated by using Leica application module (Leica Microsystems GmbH, Germany) for histological analysis.
Statistical Analysis
At least triplicate measurements were performed for all experiments throughout the study. Mean ± SD was calculated. Prism 5 (Graph-Pad Software) was employed for statistical analysis. A one-way ANOVA, followed by a pairwise comparison posthoc test, was utilized wherever appropriate. (p<0.05) was the significance level for rejecting the null hypothesis.
Results
Structure Elucidation of GPS
The compound I was identified as gentiopicroside by comparing chemical, physical, ESI-MS, 1H, and 13C NMR data with those described in the literature.39,40 GPS: yellow amorphous powder, ESI-MS m/z 355.322 [M-H]−, with a molecular formula of C16H20O9. The chemical structure of GPS was presented in Figure 1. 1H NMR (DMSO-d6, 500 MHz) and 13C NMR (DMSO-d6, 125 MHz) results were displayed in Table 2.
 |
Table 2 1H NMR (DMSO-D6, 500 MHz) and 13C NMR (DMSO-D6, 125 MHz) for GPS Compound |
 |
Figure 1 Structure of gentiopicroside (GPS). |
In vitro Characterization of GPS PLGA NSs
Effect of Polymer Concentration
PLGA 50:50 constitutes the main core component encapsulating GPS molecules in its center. Three different PLGA concentrations have been utilized in this study 2.5, 5.0, and 7.5%w/v to investigate the effect of increasing PLGA concentration on % EE, particle size, and zeta potential of GPS NSs. As it is shown in Table 3, PLGA concentration has a significant (p<0.05) effect on % EE. Increasing PLGA concentration results in more GPS molecules entrapped into PLGA core. For example, F1, F4 and F5 exhibited %EE equal to 55.78±3.74, 69.08±3.87 and 77.84±5.82% at PLGA concentration of 2.5, 5.0 and 7.5% w/v respectively. A larger mean particle size (nm) has been produced with increasing PLGA concentration. As it is demonstrated in Table 3, F3, F6, and F9 showed mean particle size with values of 189.75±10.42, 288.73±09.85, and 387.93±14.75 nm respectively. An approximate 100 nm increase in the particle size of GPS-PLGA NSs at higher PLGA concentrations increased by 2.5% w/v increment (Table 3). Regrading to zeta potential values, higher PLGA concentration significantly (p<0.05) increases the net negative charge surrounding the surface of PLGA NSs (Table 3). F2, F5, and F8 showed zeta potential values equal to −7.23±0.92, −12.75±2.41, and −19.45±2.89 mV respectively indicating that increasing PLGA concentration by 2.5%w/v increment might significantly (p<0.05) raise the negative value of zeta potential by approximately 5.52 to 6.70 mV.
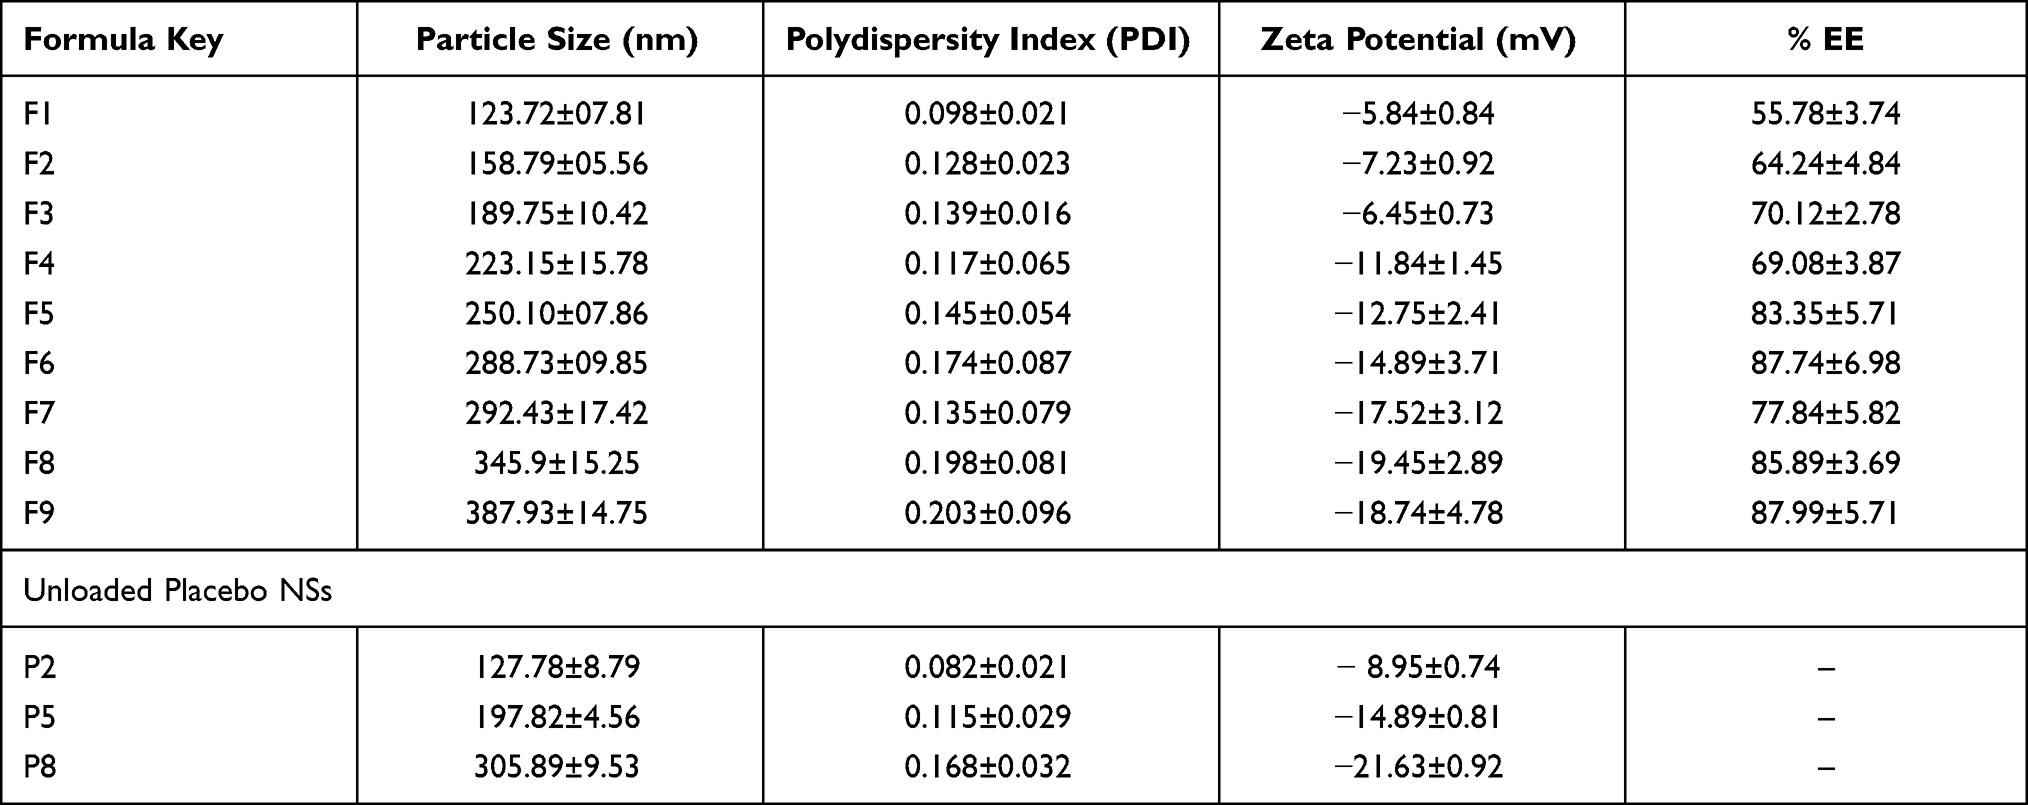 |
Table 3 Characteristics of PLGA NSs Unloaded/Loaded with GPS Prepared by Single Emulsion Solvent Evaporation Method |
Effect of Stabilizer (Surfactant) Concentration
Generally, the effect of PVA concentration on particle size, zeta potential, and % EE for all GPS-PLGA NSs formulae is less significant compared with the influence of PLGA concentration (Table 3).41 The impact of increasing PVA concentration on particle size and % EE could be significantly observed (p<0.05) at a higher PVA concentration (0.6%w/v) as demonstrated in Table 3. For example, % EE of F1 elevated from 55.78±3.74 to 64.24±4.84 (F2) when PVA concentration increased to 0.4% w/v (p>0.05), whereas a significant increase (p<0.05) in % EE (F3, 70.12±2.78) has been occurred when PVA concentration reached to 0.6% w/v. For particle size analysis, F1 exhibited particle size equal to 123.72±07.81 nm with a slight non-significant increase (p>0.05) in F2 (158.79±05.56 nm). Whereas, at a higher PVA concentration (0.6% w/v) a significant increase (p<0.05) of particle size could be seen in F3 (189.75±10.42 nm). Zeta potential measurements for all GPS NSs showed non -significant change with increasing PVA concentration (Table 3).
Effect of Drug Loading
The incorporation of GPS molecules into the PLGA matrix has a significant impact on the physical features of PLGA NSs. Drug loading has significantly led to an increase in the particle size of GPS NSs (p <0.05). As it is shown in Table 3, the particle size of unloaded placebo NSs was 127.78±8.79, 197.82±4.56, and 305.89±9.53 nm for P2, P5, and P8 PLGA NSs respectively. Whereas after drug loading the particle size increases by 30–50 nm increments to be equal to 158.79±05.56, 250.10±07.86, and 345.9±15.25 nm for F2, F5, and F8 respectively.
Regarding zeta potential, GPS PLGA NSs have significantly lower negative values of zeta potential compared with their corresponding placebo PLGA NSs. After GPS loading, zeta potential has approximately decreased by 1.72 to 2.18 mV (Table 3). Additionally, we found that unloaded placebo PLGA NSs exhibited a smaller range of size distribution showing better homogeneity in fabricated PLGA NSs. For example, PDI values of loaded F2, F5, and F8 NSs were equal to 0.128±0.023, 0.145±0.054, and 0.198±0.081 respectively. For unloaded Placebo P2, P5, and P8 NSs, PDI values were equal to 0.082±0.021, 0.115±0.029, and 0.168±0.032 respectively (Table 3).
Surface Morphology
PLGA NSs have demonstrated well-defined spherical geometry as shown in Figures 2–4. Moreover, GPS-loaded PLGA NSs displayed a shaded surrounding coat encapsulating a dense core loaded with GPS molecules (Figure 3) whereas placebo NSs showed unloaded free core (Figure 4).
 |
Figure 2 Transmission electron micrographs of GPS-PLGA NSs. F2: A&D, F5: B&E, and F8:C&F (Formulae code shown in Table 1). Captured at low magnification; (A–C) and at high magnification: (D–F). Image J software utilized for measurements display. |
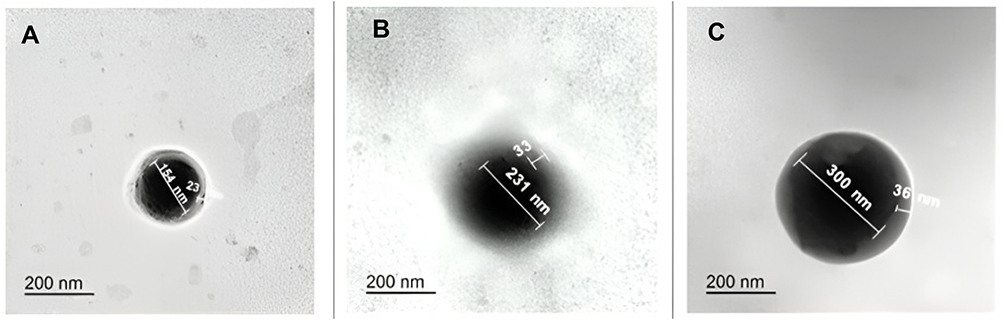 |
Figure 3 Transmission electron micrographs of GPS-PLGA NSs showing core/shell nanostructure. (A–C) for F2, F5, and F8 respectively. Image J software utilized for measurements display. |
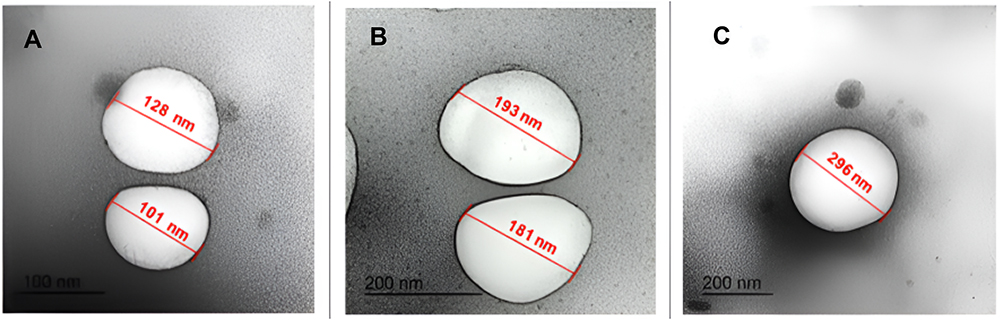 |
Figure 4 Transmission electron micrographs of placebo PLGA NSs showing unloaded centered core. (A–C) for P2, P5, and P8 respectively. Image J software utilized for measurements display. |
The findings of TEM images for F2, F5, and F7 in addition to their corresponding placebo NSs P2, P5, and P7 are closely matched with the results of particle size measurements shown in Table 3. A significant increase in particle size of placebo NSs; P2 (114.5 nm), P5 (187 nm), and P8 (296 nm) after loading of GPS to fabricate F2 (162.7 nm), F5 (253.5 nm), and F8 (339 nm) (the numerical values of particle diameter were calculated as a mean for the individually labeled diameters in Figures 2–4). As is shown in Figures 2 and 3, increasing PLGA concentration leads to GPS NSs with bigger particle sizes.
Analysis of Polymer-Drug Compatibility
After fabrication of PLGA NSs loaded with GPS, there is no major shift in the characteristic peaks for all the constitutes of nanospheres (Figure 5). FTIR spectrum of GPS-PLGA NSs displays peaks at 3425, 2998–2954-2854, 1758, 1168, and 1092 cm−1 for stretching of O-H, C-H, C=O, =C-O and C-O-C respectively and at 1457- 1397 - 1275 cm−1 for C-H bending lying at similar positions of PLGA peaks previously demonstrated in detail by Abdelkader et al.18 As it is shown in Figure 5, the reduced peak intensity of O-H stretching at 3425 cm−1 after loading GPS might be attributed to partial adsorption of GPS molecules on PLGA surface.42 Generally, some of the characteristic peaks of GPS summarized in Table 4 might be masked by the PLGA spectrum after encapsulation into its matrix.43 Additionally, the absence of distinctive peaks in GPS-PLGA NSs manifests that no chemical intermolecular interaction occurred during NSs preparation.44 The intensity of the vibrational peak at 2854 cm−1 has increased due to the merging of CH2 stretching of both GPS and PLGA. Also, the OH bending peak of GPS at 708 cm−1 has been displayed on FTIR spectrum of GPS-PLGA NSs (Figure 5).
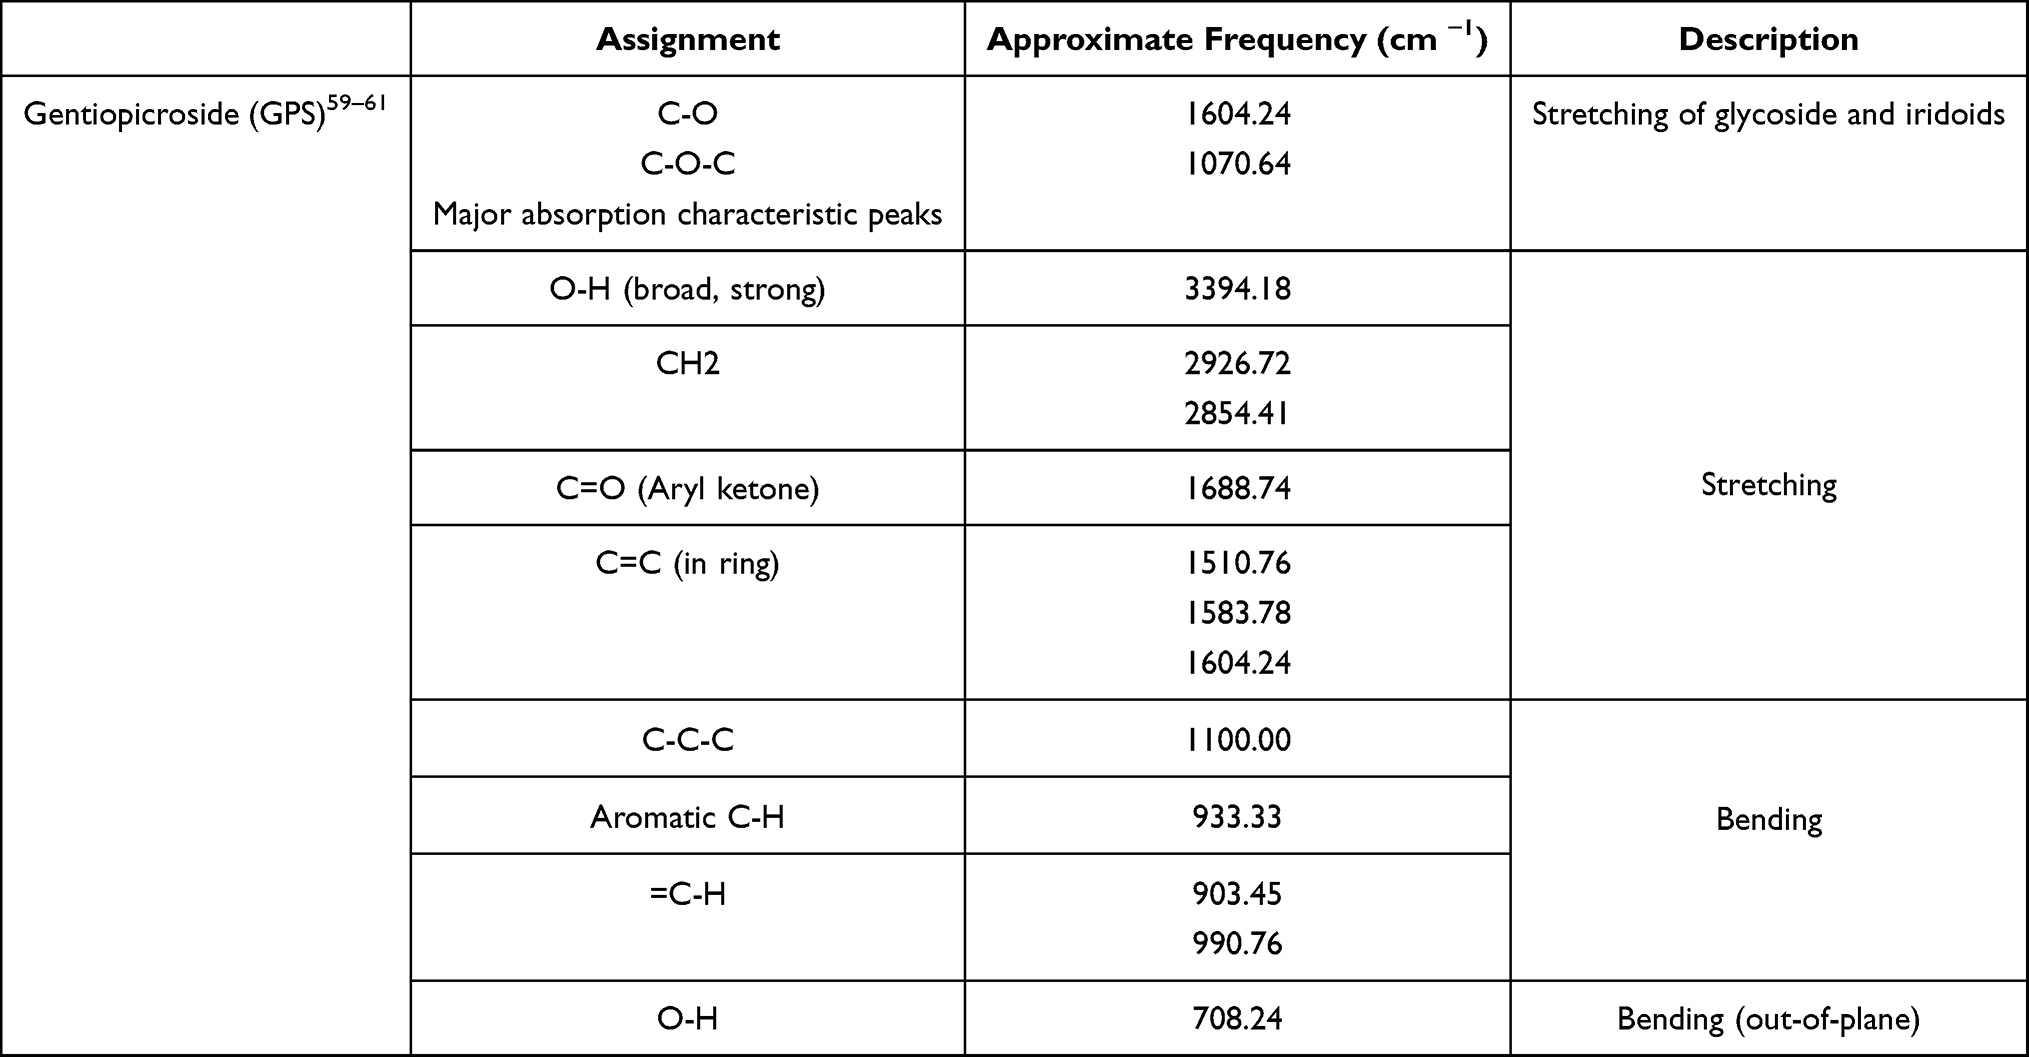 |
Table 4 Characteristic IR Peaks of GPS |
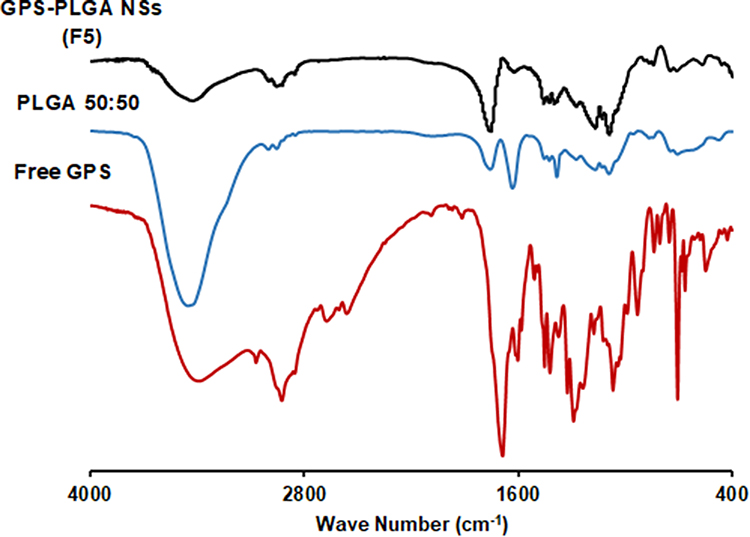 |
Figure 5 FTIR spectrum of free GPS, PLGA 50:50, and GPS-PLGA NSs (F5). |
A thermal study has been performed to investigate the encapsulation of GPS into the PLGA core of nanospheres. As shown in Figure 6, the endothermic peaks of PLGA 50:50 and GPS were observed at 52.12 and 111.77 °C respectively.26,45 Whereas, GPS-PLGA NSs (F5) showed their endothermic peaks (51.52°C) in a position similar to PLGA 50:50 with no existing peaks appearing in the range of GPS endothermic peaks between 109 to 113 °C.
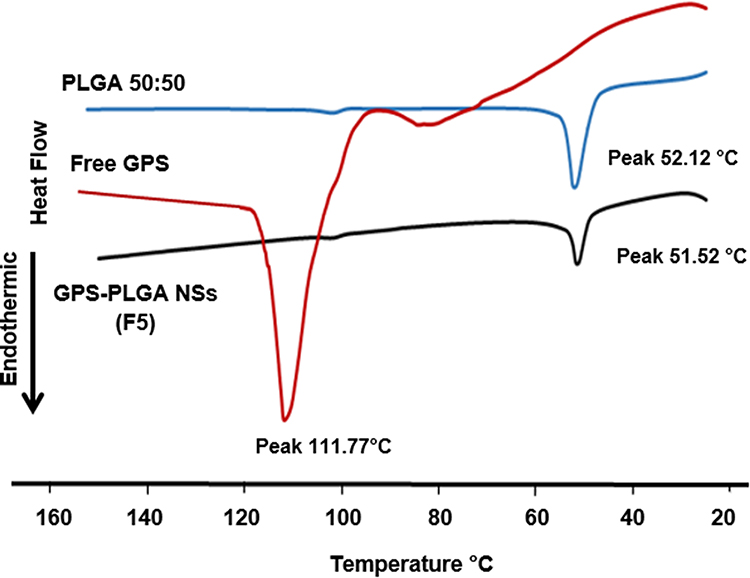 |
Figure 6 DSC thermograms showing endothermic peaks at 111.77, 52.12, and 51.52°C for free GPS, PLGA 50:50, and GPS-PLGA NSs (F5). |
In vitro Release Pattern
GPS release patterns for all NSs formulae showed biphasic behavior with initial burst after 4 hours and sustained effect extended for 72 hours (Figure 7). It is obviously demonstrated that % cumulative release of free GPS has reached 93.89±6.78 exhibiting a rapid onset after 4 hours (Figure 7A). All GPS-PLGA NSs showed a significant (p < 0.05) sustained release profile compared with free GPS. Increasing PLGA concentration which produces NSs with larger particle size leads to less % initial burst. For example, F1 (123.72±07.81nm), F4 (223.15±15.78 nm), and F7 (292.43±17.42 nm) showed % initial burst equal to 40.86±6.99, 36.89±6.72, and 32.65±4.26 respectively. Whereas, more GPS molecules entrapped into PLGA with greater % EE offer higher % cumulative release after 72 hours. As demonstrated in Figure 7A–C, % cumulative release values of F1 (%EE, 55.78±3.74), F4 (% EE, 69.08±3.87), and F7 (%EE, 77.84±5.82) were equal to 63.89±8.34, 76.89±8.23, and 78.82±5.41 respectively with increasing PLGA concentration by 2.5 increments from 2.5% to 7.5% w/v.
 |
Figure 7 In vitro drug release profiles for GPS-PLGA NSs (Formulae keys shown in Table 1). For clarification, error bars are shown as mean + SD (n=3). (A–C) platforms for GPS NSs prepared with PLGA at concentrations of 2.5, 5.0, and 7.5% w/v respectively. In vitro release behavior of free GPS is presented in (A) showing the sustained action of polymeric PLGA-GPS NSs. Similar patterns of GPS dispersed in 0.4 and 0.6% w/v of PVA (not shown). |
Similar results could be observed with increasing PVA concentration for 0.2 to 0.6%w/v. Increasing PVA concentration results in bigger GPS NSs flashing significantly (p < 0.05) lower amount of GPS in the initial burst stage at 4 hours. As it is shown in Figure 7A, FI (123.72±07.81 nm), F2 (158.79±05.56 nm), and F3 (189.75±10.42 nm) have values of % initial burst equal to 40.86±6.99, 35.85±7.89, and 30.89±4.63 respectively. Higher PVA concentrations do not significantly (p >0.05) affect the % cumulative release over three days. For example, F7, F8, and F9 (Figure 7B) offer % cumulative release with values of 78.82±5.41, 81.75±9.78, and 80.86±11.79, respectively. F5 has been chosen to extend the antimicrobial and in vivo wound healing studies because it exhibits optimum values of particle size (250.10±07.86 nm) and PDI (0.145±0.054) with high % EE (83.35±5.71) (Table 3), additionally, F5 showed the highest % cumulative release (85.79±8.74), Figure 7B.
Antimicrobial Activity
Antimicrobial susceptibility testing of 9 antimicrobials against the isolated S. aureus strains (n=25) from clinical samples was performed using Kirby–Bauer method. The antimicrobial resistance profile of the tested isolates is shown in Table 5.
 |
Table 5 Antibiotic Resistance Profile of the Tested Isolates |
Susceptibility to Free GPS, GPS PLGA NSs, and Placebo NSs
Free GPS and GPS PLGA NSs (F5) exhibited antimicrobial activity against the tested isolates while placebo NSs did not show any antimicrobial activity. The MIC values of free GPS and GPS PLGA NSs (F5), determined by broth microdilution method, were ranged from 512–2048 µg/mL and 32–250 µg/mL, respectively.
Growth Curve
Growth curves were created for the non-treated isolates in addition to the isolates treated with free GPS and GPS PLGA NSs (F5) to study the effect of free GPS and GPS PLGA NSs (F5) on the growth process, As shown in Figure 8, a significant delay (p<0.05) in the growth of the isolates treated with GPS PLGA NSs (F5) was observed relative to the non-treated isolates and the isolates treated with free GPS.
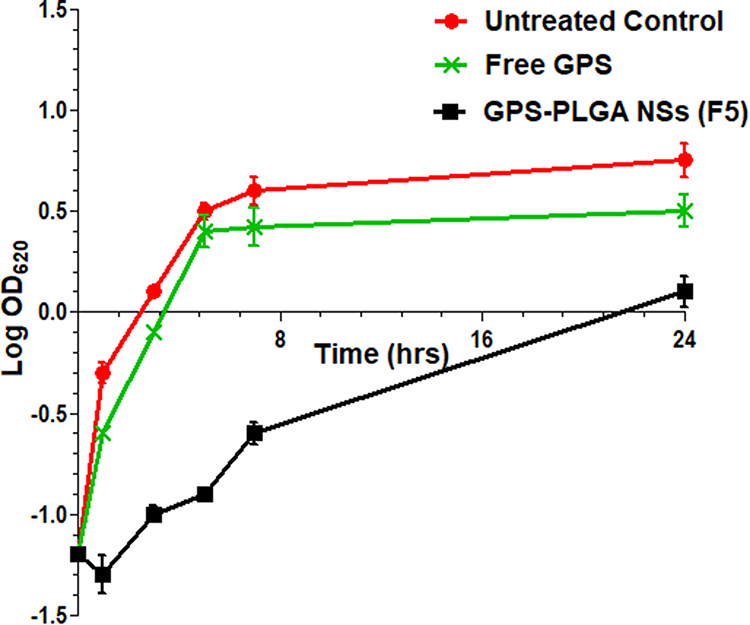 |
Figure 8 Growth curve of a representative S. aureus isolate; untreated control (circles), exposed to free GPS (cross) or GPS-PLGA NSs, F5 (squares). |
Effect of Free GPS and GPS-PLGA NSs on Bacterial Morphology
The impact of the free GPS and GPS PLGA NSs (F5) on bacterial morphology was investigated using SEM. There was no obvious change in the spherical shape of S. aureus bacteria after treatment with either free GPS or GPS PLGA NSs (F5) (Figure 9).
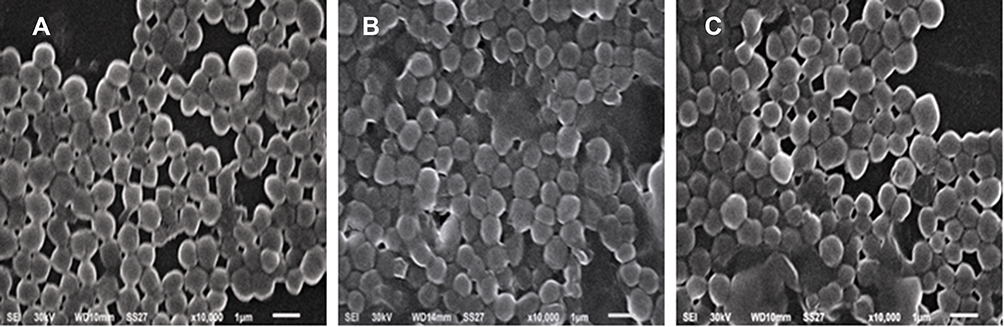 |
Figure 9 Scanning electron micrographs of a representative S. aureus isolate (A–C) for untreated control, treated with free GPS, and GPS PLGA NSs (F5) respectively. |
In vivo Wound Healing Study
The hyperglycemia-induced in all experimental groups has been verified by general symptoms of diabetes such as weight loss, polyuria, and polydipsia. The average blood glucose level before surgery was equal to 390.89±30.82 mg dl.−1 The blood glucose level was individually checked at two-day intervals throughout the study. Generally, no risks or complications were observed during and after wound creation in all groups. Daily clinical reports have been fulfilled including weight measurement, water intake, food consumption, physical status, and wound healing rate.
Wound Closure
Oral administration of GPS-PLGA NSs (F5) resulted in obvious complete healing with an intact wound closure that occurred after 12 days (Figure 10), whereas an open wound covered with a hard crust is still existing in rats receiving; no treatment (untreated control) and placebo NSs. Free GPS exerts a wound healing action45 but it might need more frequent administration and a longer period of treatment Figure 10.
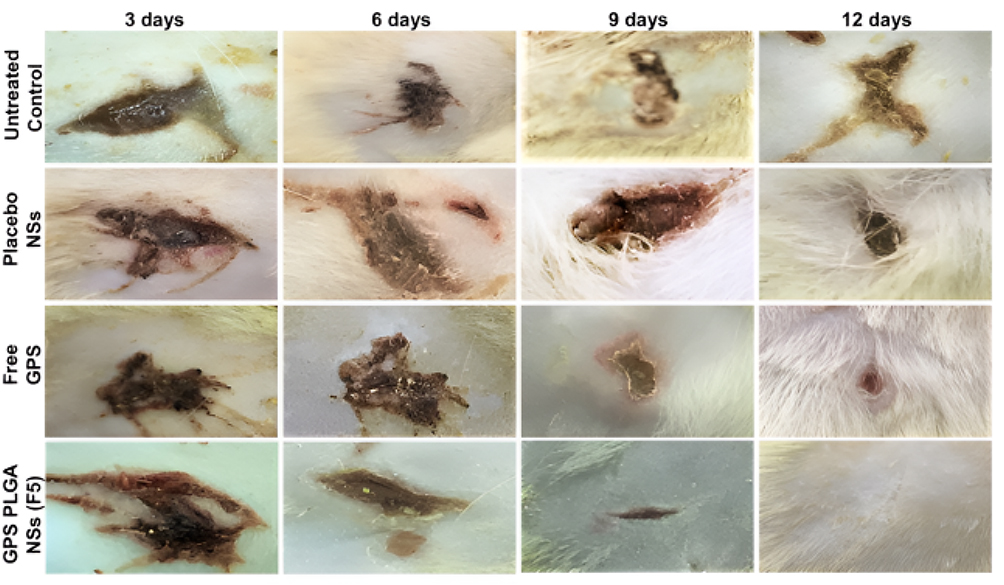 |
Figure 10 Macroscopic images of wound area showing healing and closure stages. The wound closure was observed at three-day intervals till day (12) post wound. |
A significant difference in wound healing rate between GPS (free or GPS-PLGA NSs, F5) and untreated control, il as well as placebo NSs with greater impact for GPS-PLGA NSs (F5), has been observed (Figure 11). At the first three days of the study, the progress of wound healing was almost similar for free GPS and GPS-PLGA NSs achieving a % wound injury index equal to 80.63±8.79 and 74.56±9.56 respectively. A greater significant effect for GPS-PLGA NSs at days 6, 9, and 12 compared with (p<0.05) free GPS and (p<0.001) compared with untreated control as well as placebo NSs (Figure 11). For example, at the end of the study, % the wound injury index was equal to 70.45±10.89, 65.89±9.89, 40.12±7.86, and 5.36±2.80 for untreated control, placebo NSs, free GPS, and GPS-PLGA NSs (F5) respectively.
 |
Figure 11 % wound injury index of untreated control (circles), placebo NSs (triangles), free GPS (cross) and GPS-PLGA NSs, F5 (squares) in male Sprague–Dawley rats. Results are expressed as means ± SEM. (n=6 per group, at each day interval). GPS-PLGA NSs were statistically (p < 0.05) different from untreated control, placebo NSs and free GPS at all day intervals (3, 6, 9, and 12 days). Untreated control and placebo NSs were non-significant different (p > 0.05). |
Skin Histological Analysis
Light microscopic examination of different skin samples demonstrated normal morphological features of rat skin tissue with complete epidermis showing apparent intact keratinocytes as well as an intact dermal layer (Figure 12A) with normally organized densely backed mature collagen fibers (Figure 14A) (up to 48% of mean area percentage of the dermal layer, Figure 15) with normal vasculatures and minimal inflammatory cells inf. Normal subcutaneous layers without alterations were observed (Figure 12A). However, at day 3 of the experimental wound timeline, all groups demonstrated wide areas of ulcerated wound gab with complete loss of covering epidermal layer and underlying dermis filled with newly formed highly cellular granulation tissue with abundant inflammatory cells infiltrates and occasionally covered by a scab of necrotic tissue depress and inflammatory cells (Figure 12B, D, F, and H). At day 6 interval persistent records of morphological features and ulcerations were shown in the untreated control (Figure 12C), placebo NSs (Figure 12E) and free GPS (Figure 12G) groups with severe inflammatory cells infiltrate and retarded mature collagen formation. Unlike other groups at day 6 interval, significantly accelerated wound healing process under scab of necrotic tissue depress were demonstrated in GPS - PLGA NSs (F5) with complete re-epithelialization of the epidermal layer with newly formed keratinocytes and mild persistence records of underlying granulation tissue with mild inflammatory cells infiltrates, higher records of mature collagen fibers and focal subepidermal hemorrhage occasionally found in some tissue sections (Figure 12I). Day 9 interval showed persistent records of epidermal loss and ulceration (Figure 13A and C) with persistent retardation of dermal collagen fibers formation were observed in the untreated control (Figure 14B) and placebo NSs (Figure 14D). However, free GPS showed more accelerated mature collagen fibers formation in the dermal layer (Figure 14F) with up to 3.3 folds (p<0.05) compared with untreated control (Figure 15) with focal extravasation of blood in a narrower wound gap (Figure 13E). The most accelerated fibroblastic activity with abundant mature collagen fibers resembling normal controls was shown in GPS - PLGA NSs (F5) (Figures 14H and 15 p<0.01) with almost complete bridging and re-epithelialization of epidermal layer (Figure 13G). At day 12 interval persistence records of epidermal loss were recorded in untreated control, placebo NSs and free GPS groups (Figure 13B, D, and F) with severe dermal and subcutaneous inflammatory cells infiltrate were shown in the untreated control (Figure 13B). However, higher records of mature collagen fibers were observed in free GPS (Figure 14G) up to 2.4 folds more than untreated control approaching normal healthy (Figure 15, p<0.05). GPS - PLGA NSs (F5) at day 12 interval showed almost intact histological features of skin samples with intact dermal layer (Figure 13H) showing abundant mature collagen fibers (Figures 14I and 15 p<0.01) comparing with untreated control (Figure 14C), placebo NSs (Figure 14E) and free GPS (Figure 14G). Cutaneous wound treated with GPS - PLGA NSs (F5) showed newly formed hair follicles and complete restoration of epidermal layer resembling those of normal healthy tissue (Figure 13H).
 |
Figure 12 Wound healing process at day 3 and day 6-time interval in different groups. (A) Normal healthy, (B and C) Untreated Control, (D and E) Placebo NSs, (F and G) Free GPS, and (H and I) GPS - PLGA NSs (F5). H&E stain 40X. Arrow = Epidermal layer. Black star = Dermal layer, Red star = Wound gab granulation tissue. |
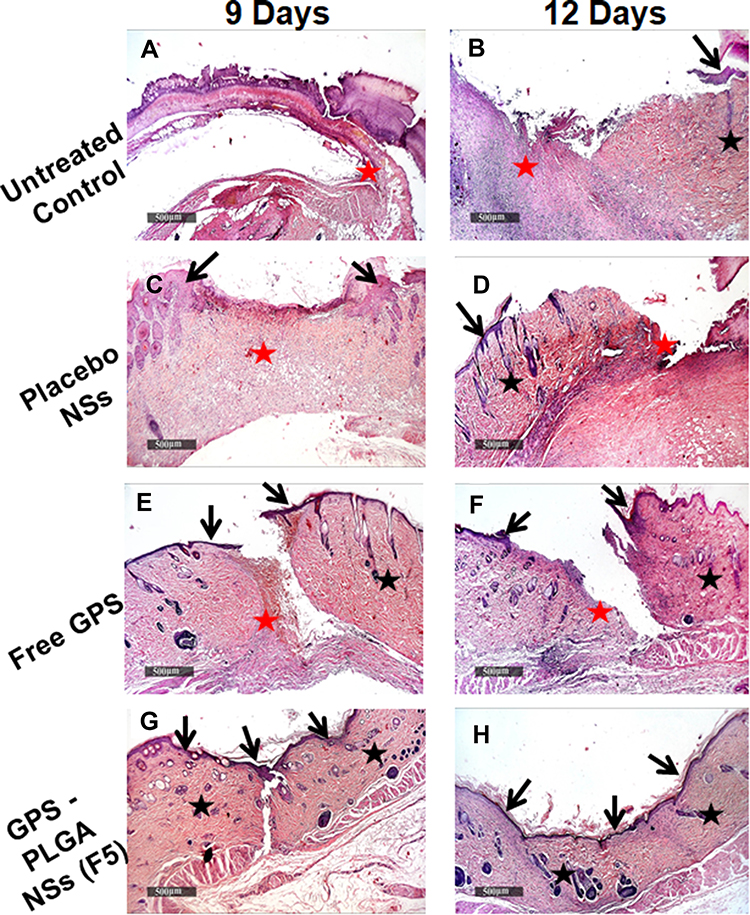 |
Figure 13 Wound healing process at day 9 and day 12-time interval in different groups. (A and B) Untreated Control, (C and D) Placebo NSs, (E and F) Free GPS, and (G and H) GPS - PLGA NSs (F5). H&E stain 40X. Arrow = Epidermal layer. Black star = Dermal layer, Red star = wound gab granulation tissue. |
 |
Figure 14 Reactive dermal collagen fibers (star) at day 9 and day 12-time interval in different groups. (A) Normal healthy, (B and C) Untreated Control, (D and E) Placebo NSs, (F and G) Free GPS, and (H and I) GPS - PLGA NSs (F5). Masson’s trichrome stain 40X. |
 |
Figure 15 Quantitative analysis for immunohistochemical staining expressed as % area of collagen fibers. Data are represented as mean ± SEM, (n=6). **p<0.01; significantly different from normal healthy. ++p<0.01 significantly different from GPS-PLGA NSs (F5). #p<0.05; significantly different from free GPS. *+p<0.05 significantly different between free GPS and normal healthy and GPA-PLGA NSs (F5). NS; the non-significant difference between normal healthy and GPS-PLGA NSs & untreated control and placebo NSs. |
Discussion
PLGA is considered the most powerful factor significantly affecting the physical properties of GPS NSs including particle size and zeta potential in addition to % EE.18,41 The higher viscosity of the internal phase at greater PLGA concentration provides more intact oil globules tightly entrapped GPS molecules preventing their diffusion out to the external aqueous phase11 that produces GPS-PLGA NSs with significantly higher %EE (Table 3). Generally, PLGA contents have a crucial effect on the total amount of GPS encapsulated into formulated NSs. Increasing PLGA concentration might increase the particle size of GPS NSs because of the larger shear force with higher homogenization speed needed to break more rigid oily droplets. The processing parameters including homogenization time and speed have been fixed throughout the study resulting in coarser emulsion formulated at higher PLGA concentration with bigger oily droplets/globules individually dispersed in emulsion background (Table 3).11 Moreover, increasing PLGA concentration imposes more carboxylic acid groups in GPS NSs dispersion leading to a significant increase in a negative value of zeta potential conferring greater inter particulate repulsion and better stability (Table 3).
Incorporation of the optimized type and concentration of surfactant is the magic key trade to controlling the stability of the drug-loaded nanosystem, protecting the drug from fast degradation, and keeping the integrity of PLGA matrix.46 Among versatile types of surfactant used in NSs preparation, it is clear that PVA is widely used with a significant impact on the stability and physical features of drug-loaded nanoparticles including nanospheres and/or nanocapsules.18,46,47 GPS has hydrophobic nature with limited aqueous solubility.26 Increasing PVA concentration in the external aqueous phase supports GPS molecules to be tightly incorporated into PLGA core and minimum diffusion out to the external phase leading to higher entrapment efficiency (Table 3).11,18 The larger particle size of GPS -PLGA NSs produced with increasing PVA concentration could be attributed to the hydrophobic linkage formed between hydrocarbon chains of PVA and the external surface of PLGA NSs. Additionally, inter/intramolecular hydrogen bonds spontaneously formed between peripheral hydroxyl groups of PVA and the external aqueous phase during NSs preparation.18,48 The residual remains of PVA on the surface of PLGA NSs after three washing cycles during centrifugation of NSs pellets results in a non-significant change in zeta potential values of GPS-loaded PLGA NSs (Table 3).18 All GPS-PLGA NSs have well-controlled PDI values indicating that employing probe ultrasonication is considered an optimum homogenization tool producing nanosized spherical particles with a narrow size distribution range.49
Loading PLGA NSs with GPS molecules might cause an expansion through the polymeric network because the organic phase does not only composed from PLGA but also GPS molecules have interfered within polymeric architecture leading to a bigger central core resulting in increasing the overall particle size of loaded PLGA NSs.33,50 Increasing the individual components to fabricate the nanosystem might negatively affect the homogeneity of the nano-environment producing NSs with higher PDI values.33,50 So, Placebo NSs with no encapsulated GPS have smaller PDI values compared with loaded PLGA NSs. Also, it is worthy to mention that GPS molecules may produce a masking effect on the carboxylic acid groups of PLGA leading to a decrease in the negative values of zeta potential due to the presence of GPS molecules adsorbed on the surface of PLGA NSs.33,50
The compatibility between GPS and polymeric matrix has been fully investigated using the FTIR technique. The possibility of chemical interactions could be confirmed by comparing FTIR spectrum of GPS PLGA NSs with their individual components (Figure 5).51 The peaks of main functional groups of GPS and PLGA remain at similar wavenumbers after fabrication of GPS-PLGA NSs ensuring that the method of preparation preserves GPS stability and integrity with no possible interaction and/or incompatibility between drug and polymer.18
Thermal analysis of GPS-PLGA NSs and their individual components elucidate that GPS might be completely encapsulated into PLGA core. Also, this indicates that GPS was fully dissolved in the organic phase during nanospheres preparation with no risk of aggregation and/or recrystallization after solvent evaporation because polymer chains would efficiently surround GPS in its molecular/amorphous state.18,43
The dialysis membrane method is a universe drug release experiment used to investigate the extended-release of nanoformulations ensuring a controlled separation of drug molecules from polymeric matrix from the donor to receiver compartment.22 Free GPS release showed a rapid onset reaching approximately 100% within the first 4 hrs ensuring that the construction of dialysis membrane method does not offer any sustain release effect.18 SLS has been added in the release medium to enhance the solubility of released GPS supporting sink conditions to continue GPS diffusion out from the polymeric network.23 It has been stated in most of the literature that drug-loaded nano-vesicular structures would mainly be absorbed directly into the blood circulation via Peyer’s patches pathway.52,53 Our in vitro release study was employed pH =7.4 to simulate in vivo conditions investigating the release behavior of GPS molecules in pH value similar to blood vascularity.
Encapsulation GPS with PLGA polymeric matrix offers a sustained release platform extended for three days for all NSs formulae (Figure 7). GPS has been released to the surrounding medium through two phases (biphasic release behavior). The initial burst after the first four hours at which approximately 30–40% of GPS adsorbed on the surface NSs has been shotted in the release medium. The second phase exhibiting the sustained effect is mainly due to the slow diffusion of GPS out of PLGA matrix and/or erosion might occur through polymeric network leading to ease GPS molecules separation.11,18 The effect of PLGA concentration could be mainly attributed to its influences on particle size and % entrapment efficiency.11,18 Smaller particles size GPS NSs provide higher initial burst peaks, whereas NSs entrapped larger amounts of GPS molecules showed greater % cumulative release with more sustained effect. Different literature showed that the effect of PVA on release profile is basically concentration-dependent.47,48 GPS is tightly incorporated with inner PLGA core and insoluble in an aqueous phase containing lower concentrations of PVA, below that is required for micellar formation and/or solubilizing GPS,46 resulting in suppressing the initial burst of GPS out to release medium parallel with neglected effect on the total % cumulative release after three days.47,48 Typical spheres of GPS-loaded PLGA nanoformulations demonstrated by transmission electron micrographs ensure that emulsion solvent evaporation method utilizing probe sonication could be considered an accessible and optimum technique could produce core /shell nanosystem.10
The vast spread of infections caused by S. aureus is a worldwide problem that should be handled to avoid the high morbidity and mortality caused by this pathogen.54 The use of natural products is one of the approaches that is currently studied due to its safety, affordability, and efficacy.55 Thus, the antimicrobial activities of the free GPS and GPS PLGA NSs were studied. GPS PLGA NSs (F5) resulted in a significant delay (p<0.05) in the bacterial growth with no obvious effect on bacterial morphology (Figure 9). Generally, bacterial examination by SEM was performed to examine the extent of the integrity of the bacterial surface.56 The non-significant change in the bacterial morphology in the current study may be due to the utilized concentration (0.5 MIC). Future studies are warranted to comprehend the exact mechanism of action.
Generally, diabetic wounds have retarded and deteriorated wound healing features with impaired progress. A diabetic wound is considered one of the worldwide risk morbidity complications for diabetic patients.57,58 Wound healing stages include contraction, epithelization, granulation, and collagenation.57 GPS could effectively enhance wound healing through the collagenase stage via accelerating collagen fibers sytnehsis34 as shown in Figures 14F–G and 15. After entrapping GPS into PLGA NSs, encapsulated GPS effect has been significantly improved (p<0.05) in the synthesis of collagen fibers compared with free GPS. Wounds treated with GPS-PLGA NSs have been completely healed after 12 days (Figures 10) with no residual scar or crust. Histological evidence (Figures 13H and 14I) has confirmed these findings ensuring that GPS -PLGA NSs could significantly increase skin cell migration and proliferation for wound closure that is might need to be confirmed in future work employing in vitro cell culture studies.
Conclusion
Nanofabrication of GPS into PLGA nanospheres offers an appropriate carrier for higher GPS loading capacity maintaining its stability with a sustained release for approximately three days. GPS-PLGA NSs showed optimum physical characterizations in terms of surface charge, particle size measurements, and distribution range. Furthermore, GPS PLGA NSs exhibited an improved antimicrobial activity against the tested S. aureus clinical isolates. This finding could help in the battle against multi-drug resistant S. aureus bacteria. Importantly, the evidence of in vivo work confirmed that GPS PLGA NSs speed up cutaneous wound healing. When compared to PLGA or GPS alone, we found that PLGA-based continuous administration of GPS considerably improved wound healing activity. The findings of higher re-epithelialization, granulation tissue development, and greater rate of collagen synthesis revealed that PLGA matrix as nano spherical structure has the potential of accelerating diabetic wound closure.
Acknowledgments
This research was funded by the Deanship of Scientific Research (DSR) at Princess Nourah bint Abdulrahman University, through the Research Funding Program (FRP-1442-7). The authors are appreciative of the financial and technical support offered by DSR.
We thank Prof. Hytham M Ahmed for his valuable comments on the manuscript.
Disclosure
The authors report no conflicts of interest in this work.
References
1. Mudrić J, Pajić M, Bigović D, Đuriš J. Development of gastroretentive floating granules with gentian root extract by hot-melt granulation. Lek sirov. 2020;40(40):40–44. doi:10.5937/leksir2040040M
2. Karalija E, Ćavar Zeljković S, Dahija S, Bešta-Gajević R, Parić A. Phenolics of aerial parts of Gentiana lutea L. and their biological activity. Agronomy. 2021;11(7):1442. doi:10.3390/agronomy11071442
3. Pan Y, Zhao Y-L, Zhang J, Li W-Y, Wang Y-Z. Phytochemistry and pharmacological activities of the genus Gentiana (Gentianaceae). Chem Biodivers. 2016;13(2):107–150. doi:10.1002/cbdv.201500333
4. Cafaro T, Carnicelli V, Caprioli G, et al. Anti-apoptotic and anti-inflammatory activity of Gentiana lutea root extract. Adv Tradit Med. 2020;20(4):619–630. doi:10.1007/s13596-020-00447-5
5. Živković I, Šavikin K, Zdunić G, et al.Antiviral activity of medicinal plants extracts against foodborne norovirus. Lek sirov. 2018;(38):31–34. doi:10.5937/leksir1838031Z
6. Mustafa AM, Caprioli G, Dikmen M, et al. Evaluation of neuritogenic activity of cultivated, wild and commercial roots of Gentiana lutea L. J Funct Foods. 2015;19:164–173. doi:10.1016/j.jff.2015.09.018
7. Zhou W, Ouyang J, Wang H, Wang X. Antidermatophyte activity of the Gentiopicroside-rich n-butanol fraction from Gentiana siphonantha Maxim. Root on a Guinea pig model of dermatophytosis. Complement Med Res. 2019;26(1):31–38. doi:10.1159/000492384
8. Thakur R, Jain N, Pathak R, Sandhu SS. Practices in wound healing studies of plants. Evid Based Complement Alternat Med. 2011;2011:1–17. doi:10.1155/2011/438056
9. El-Hamid A, Marwa I, El-Naenaeey EY, et al. Promising antibiofilm agents: recent breakthrough against biofilm producing methicillin-resistant Staphylococcus aureus. Antibiotics. 2020;9(10):667. doi:10.3390/antibiotics9100667
10. Application B, Kim SM, Patel M, Patel R. PLGA core-shell nano/microparticle delivery system for Biomedical Application. Polymers. 2021;13:1–22.
11. Abdelkader DH, El-Gizawy SA, Faheem AM, McCarron PA, Osman MA. Effect of process variables on formulation, in-vitro characterization and subcutaneous delivery of insulin PLGA nanoparticles: an optimisation study. J Drug Deliv Sci Technol. 2018;43:160–171. doi:10.1016/j.jddst.2017.10.004
12. Nava-Arzaluz MG, Pinon-Segundo E, Ganem-Rondero A, Lechuga-Ballesteros D. Single emulsion-solvent evaporation technique and modifications for the preparation of pharmaceutical polymeric nanoparticles. Recent Pat Drug Deliv Formul. 2012;6(3):209–223. doi:10.2174/187221112802652633
13. Faheem AM, Abdelkader DH. Novel drug delivery systems. In: Engineering Drug Delivery Systems; 2020:1–16. doi:10.1038/nbt0289-127
14. Swider E, Koshkina O, Tel J, Cruz LJ, de Vries IJM, Srinivas M. Customizing poly (lactic-co-glycolic acid) particles for biomedical applications. Acta Biomater. 2018;73:38–51. doi:10.1016/j.actbio.2018.04.006
15. Zeng W, Liu Z, Li Y, et al. Development and characterization of cores–shell poly (lactide-co-glycolide)-chitosan microparticles for sustained release of GDNF. Colloids Surf B Biointerfaces. 2017;159:791–799. doi:10.1016/j.colsurfb.2017.08.052
16. Zhao Q, Luan X, Zheng M, et al. Synergistic mechanisms of constituents in herbal extracts during intestinal absorption: focus on natural occurring nanoparticles. Pharmaceutics. 2020;12(2):128. doi:10.3390/pharmaceutics12020128
17. Wang C, Cheng X, Bligh SWA, White KN, Branford-white CJ, Wang Z. Pharmacokinetics and bioavailability of gentiopicroside from decoctions of Gentianae and Longdan Xiegan Tang after oral administration in rats — comparison with gentiopicroside alone. J Pharm Biomed Anal. 2007;44(5):1113–1117. doi:10.1016/j.jpba.2007.04.036
18. Abdelkader DH, Abosalha AK, Khattab MA, Aldosari BN, Almurshedi AS. A novel sustained anti-inflammatory effect of atorvastatin — calcium PLGA nanoparticles: in vitro optimization and in vivo evaluation. Pharmaceutics. 2021;13(10):1–21. doi:10.3390/pharmaceutics13101658
19. Boltnarova B, Kubackova J, Skoda J, et al. Plga based nanospheres as a potent macrophage‐specific drug delivery system. Nanomaterials. 2021;11(3):1–17. doi:10.3390/nano11030749
20. Deng F, Yang H, Liu X, Hong H, Paek N, Cai Q. HPLC fingerprinting and quantification of gentiopicroside and loganic acid in gentianae macrophyllae radix crude drugs. J Chin Pharm Sci. 2010;19(04):243–250.
21. Mahboob T, Nawaz M, de Lourdes Pereira M, et al. PLGA nanoparticles loaded with gallic acid-A constituent of Leea indica against Acanthamoeba triangularis. Sci Rep. 2020;10(1):1–12. doi:10.1038/s41598-020-65728-0
22. Lombardo SM, Günday N, Koch M, Schneider M, Türeli E. Reliable release testing for nanoparticles with the NanoDis System, an innovative sample and separate technique. Int J Pharm. 2021;609:121215. doi:10.1016/j.ijpharm.2021.121215
23. Kim SR, Ho MJ, Lee E, Lee JW, Young wook choi MJK. Cationic PLGA/Eudragit RL nanoparticles for increasing retention time in synovial cavity after intra-articular injection in knee joint. Int J Nanomedicine. 2015;10:5263–5271. doi:10.2147/IJN.S88363
24. Souza SD. A review of in vitro drug release test methods for nano-sized dosage forms. Adv Pharm. 2014;2014:1–12.
25. Abdelkader DH, Osman MA, El-Gizawy SA, Hawthorne SJ, Faheem AM, McCarron PA. Effect of poly(ethylene glycol) on insulin stability and cutaneous cell proliferation in vitro following cytoplasmic delivery of insulin-loaded nanoparticulate carriers – a potential topical wound management approach. Eur J Pharm Sci. 2018;114:372–384. doi:10.1016/j.ejps.2017.12.018
26. Zhang K, Lv S, Li X, et al. Preparation, characterization, and in vivo pharmacokinetics of nanostructured lipid carriers loaded with oleanolic acid and gentiopicrin. Int J Nanomedicine. 2013;8:3227–3239. doi:10.2147/IJN.S45031
27. MacFaddin JF Biochemical tests for identification of medical bacteria; 2000.
28. Dolinsky AL, Ohiro RK, Fan W, Xiao C, Wu F. National Committee for Clinical Laboratory Standards. 2000. Performance standard for antimicrobial susceptibility testing. Document M100–S10. J Int Med Res. 2019;46:18.
29. Mayrhofer S, Zitz U, Birru FH, et al. Comparison of the CLSI guideline and ISO/IDF standard for antimicrobial susceptibility testing of lactobacilli. Microb Drug Resist. 2014;20(6):591–603. doi:10.1089/mdr.2013.0189
30. Elekhnawy E, Sonbol F, Abdelaziz A, Elbanna T. An investigation of the impact of triclosan adaptation on Proteus mirabilis clinical isolates from an Egyptian University hospital. Brazilian J Microbiol. 2021;52(2):927–937. doi:10.1007/s42770-021-00485-4
31. Attallah NGM, Negm WA, Elekhnawy E, et al. Elucidation of phytochemical content of Cupressus macrocarpa leaves: in vitro and in vivo antibacterial effect against methicillin-resistant Staphylococcus aureus clinical isolates. Antibiotics. 2021;10(8):890. doi:10.3390/antibiotics10080890
32. Abdelaziz A, Sonbol F, Elbanna T, El-Ekhnawy E. Exposure to sublethal concentrations of benzalkonium chloride induces antimicrobial resistance and cellular changes in Klebsiellae pneumoniae clinical isolates. Microb Drug Resist. 2019;25(5):631–638. doi:10.1089/mdr.2018.0235
33. Musumeci T, Ventura CA, Giannone I, et al. PLA/PLGA nanoparticles for sustained release of docetaxel. Int J Pharm. 2006;325(1–2):172–179. doi:10.1016/j.ijpharm.2006.06.023
34. Mathew A, Taranalli AD, Torgal SS. Evaluation of anti-inflammatory and wound healing activity of Gentiana lutea Rhizome extracts in animals evaluation of anti-inflammatory and wound healing activity of Gentiana lutea Rhizome extracts in animals. Pharm Biol. 2004;42(1):8–12. doi:10.1080/13880200390502883
35. Dunn L, Prosser HCG, Tan JTM, Vanags LZ, Ng MKC, Bursill CA. Murine model of wound healing. J Vis Exp. 2013;75:1–6. doi:10.3791/50265
36. Abdelkader DH, Murtaza T, Mitchell CA, et al. Enhanced cutaneous wound healing in rats following topical delivery of insulin-loaded nanoparticles embedded in poly(vinyl alcohol)-borate hydrogels. J Drug Deliv Transl Res. 2018;8(5):1053–1065. doi:10.1007/s13346-018-0554-0
37. Culling CFA. Handbook of Histopathological and Histochemical Techniques.
38. Abbas H, El Sayed NS, Ali ME, Elsheikh MA. Integrated lecithin–bile salt nanovesicles as a promising approach for effective skin delivery of luteolin to improve UV-induced skin damage in Wistar albino rats. Colloids Surf B Biointerfaces. 2021;211:112299. doi:10.1016/j.colsurfb.2021.112299
39. Liu Q, Cheng L, Matsuura A, Xiang L, Qi J. Gentiopicroside, a secoiridoid glycoside from Gentiana rigescens Franch, extends the lifespan of yeast via inducing mitophagy and antioxidative stress. Oxid Med Cell Longev. 2020;2020:1–12. doi:10.1155/2020/9125752
40. Alphonse M, Thiagarajan K. Optimisation of gentiopicroside production in Gentiana kurroo Royle from adventitious root cultures in a liquid culture system. Vitr Cell Dev Biol. 2021;57(2):179–189. doi:10.1007/s11627-021-10168-2
41. Stromberg ZR, Phipps ML, Magurudeniya HD, et al. Formulation of stabilizer-free, nontoxic PLGA and elastin-PLGA nanoparticle delivery systems. Int J Pharm. 2021;597:120340. doi:10.1016/j.ijpharm.2021.120340
42. Prabhuraj RS, Bomb K, Srivastava R, Bandyopadhyaya R. Dual drug delivery of curcumin and niclosamide using PLGA nanoparticles for improved therapeutic effect on breast cancer cells. J Polym Res. 2020;27(133):1–13.
43. Ismail R, Sovány T, Gácsi A, et al. Synthesis and statistical optimization of Poly (Lactic-Co-Glycolic Acid) nanoparticles encapsulating GLP1 analog designed for oral delivery. Pharm Res. 2019;36(7):7. doi:10.1007/s11095-019-2620-9
44. Jana U, Mohanty AK, Pal SL, Manna PK, Mohanta GP. Felodipine loaded PLGA nanoparticles: preparation, physicochemical characterization and in vivo toxicity study. Nano Converg. 2014;1(31):1–10. doi:10.1186/s40580-014-0031-5
45. Pool H, Quintanar D, Figueroa JDD, et al. Antioxidant effects of quercetin and catechin encapsulated into PLGA nanoparticles. J Nanomater. 2012;2012:1–12. doi:10.1155/2012/145380
46. Behnke M, Vollrath A, Klepsch L, et al. Optimized encapsulation of the FLAP/PGES-1 inhibitor BRP-187 in PVA-stabilized plga nanoparticles using microfluidics. Polymers. 2020;12(11):1–16. doi:10.3390/polym12112751
47. Takeuchi I, Kato Y, Makino K. Effects of polyvinyl alcohol on drug release from nanocomposite particles using poly (L-lactide-co-glycolide). J Oleo Sci. 2021;70(3):341–348. doi:10.5650/jos.ess20299
48. Sharma N, Madan P, Lin S. Effect of process and formulation variables on the preparation of parenteral paclitaxel-loaded biodegradable polymeric nanoparticles: a co-surfactant study. Asian J Pharm Sci. 2016;11(3):404–416. doi:10.1016/j.ajps.2015.09.004
49. Sandhya M, Ramasamy D, Sudhakar K, Kadirgama K, Harun WSW. Ultrasonication an intensifying tool for preparation of stable nanofluids and study the time influence on distinct properties of graphene nanofluids–A systematic overview. Ultrason Sonochem. 2021;73:105479.
50. Ramalho MJ, Loureiro JA, Gomes B, Frasco MF, Coelho MAN, Carmo Pereira M. PLGA nanoparticles as a platform for vitamin D-based cancer therapy. Beilstein J Nanotechnol. 2015;6(1):1306–1318. doi:10.3762/bjnano.6.135
51. Dandamudi M, Mcloughlin P, Behl G, et al. Chitosan-Coated PLGA nanoparticles encapsulating triamcinolone acetonide as a potential candidate for sustained ocular drug delivery. Pharmaceutics. 2021;13(1590):1–20. doi:10.3390/pharmaceutics13101590
52. Da silva AB, Miniter M, Thom W, et al. Gastrointestinal absorption and toxicity of nanoparticles and microparticles: myth, reality and pitfalls explored through titanium dioxide. Curr Opin Toxicol. 2020;19:112–120. doi:10.1016/j.cotox.2020.02.007
53. Awaad A, Nakamura M, Ishimura K. Imaging of size-dependent uptake and identification of novel pathways in mouse Peyer’s patches using fluorescent organosilica particles. Nanomedicine. 2012;8(5):627–636. doi:10.1016/j.nano.2011.08.009
54. Cheung GYC, Bae JS, Otto M. Pathogenicity and virulence of Staphylococcus aureus. Virulence. 2021;12(1):547–569. doi:10.1080/21505594.2021.1878688
55. Atanasov AG, Zotchev SB, Dirsch VM, Supuran CT. Natural products in drug discovery: advances and opportunities. Nat Rev Drug Discov. 2021;20(3):200–216. doi:10.1038/s41573-020-00114-z
56. Hartmann M, Berditsch M, Hawecker J, Ardakani MF, Gerthsen D, Ulrich AS. Damage of the bacterial cell envelope by antimicrobial peptides gramicidin S and PGLa as revealed by transmission and scanning electron microscopy. Antimicrob Agents Chemother. 2010;54(8):3132–3142. doi:10.1128/AAC.00124-10
57. Abdelkader DH, Osman MA, El-Gizawy SA, Faheem AM, McCarron PA. The role of insulin in wound healing process: mechanism of action and pharmaceutical applications. J Anal Pharm Res. 2016;2(1):1–6. doi:10.15406/japlr.2016.02.00007
58. Yang P, Wang D, Shi Y, et al. Insulin-containing wound dressing promotes diabetic wound healing through stabilizing HIF-1α. Front Bioeng Biotechnol. 2020;8:1–10. doi:10.3389/fbioe.2020.592833
59. Wang C, Gong X, Agula B, et al. Iridoids: research advances in their phytochemistry, biological activities, and pharmacokinetics. Molecules. 2020;25(287):1–24.
60. Zhao Y, Yuan T, Wu L, Ji Z, Zuo Z, Wang Y. Identification of Gentiana rigescens from different geographical origins based on HPLC and FTIR fingerprints. Anal Methods. 2020;12(17):2260–2271. doi:10.1039/d0ay00309c
61. Mi L-J, Zhang J, Zhao Y-L, Zuo ZT, Wang Y-Z, Li F-S. Discrimination and evaluation Gentiana rigescens–Camellia sinensis with different planting year using Fourier transform infrared spectroscopy. Agroforest Syst. 2019;93(3):1157–1166. doi:10.1007/s10457-018-0216-8
 © 2022 The Author(s). This work is published and licensed by Dove Medical Press Limited. The
full terms of this license are available at https://www.dovepress.com/terms
and incorporate the Creative Commons Attribution
- Non Commercial (unported, 3.0) License.
By accessing the work you hereby accept the Terms. Non-commercial uses of the work are permitted
without any further permission from Dove Medical Press Limited, provided the work is properly
attributed. For permission for commercial use of this work, please see paragraphs 4.2 and 5 of our Terms.
© 2022 The Author(s). This work is published and licensed by Dove Medical Press Limited. The
full terms of this license are available at https://www.dovepress.com/terms
and incorporate the Creative Commons Attribution
- Non Commercial (unported, 3.0) License.
By accessing the work you hereby accept the Terms. Non-commercial uses of the work are permitted
without any further permission from Dove Medical Press Limited, provided the work is properly
attributed. For permission for commercial use of this work, please see paragraphs 4.2 and 5 of our Terms.