Back to Journals » Clinical Ophthalmology » Volume 16
Genotyping of Clinical Parameters in Age-Related Macular Degeneration
Authors Battu P, Sharma K ![]() , Thangavel R, Singh R, Sharma S, Srivastava V, Anand A
, Thangavel R, Singh R, Sharma S, Srivastava V, Anand A
Received 5 May 2021
Accepted for publication 20 August 2021
Published 25 February 2022 Volume 2022:16 Pages 517—529
DOI https://doi.org/10.2147/OPTH.S318098
Checked for plagiarism Yes
Review by Single anonymous peer review
Peer reviewer comments 3
Editor who approved publication: Dr Scott Fraser
Priya Battu,1,* Kaushal Sharma,1,* Rajarathna Thangavel,2 Ramandeep Singh,3 Suresh Sharma,4 Vinod Srivastava,5 Akshay Anand1
1Neuroscience Research Lab, Department of Neurology, Post Graduate Institute of Medical Education and Research, Chandigarh, India; 2Department of Ophthalmology, Vasan Eye Care, Chennai, India; 3Advanced Eye Centre, Post Graduate Institute of Medical Education and Research, Chandigarh, India; 4Department of Statistics, Panjab University, Chandigarh, India; 5College of Health and Behavioral Sciences, Fort Hays State University, Hays, KS, USA
*These authors contributed equally to this work
Correspondence: Akshay Anand, Neuroscience Research Lab, Department of Neurology, Post Graduate Institute of Medical Education and Research, Chandigarh, 160012, India, Tel +911722756094, Email [email protected]
Background: Optical coherence tomography (OCT) parameters like subretinal fluid (SRF), intra retinal fluid (IRF) and retinal detachment (RPED) etc are routinely accessed by ophthalmologists in patients with retinal complaints. Correlation of OCT findings with genotype and phenotype of AMD patients is relatively unexplored. Here, we have investigated the association of OCT parameters’ with genetic variants along with protein expressions and examined their clinical relevance with AREDS (Age-Related Eye Disease Study) criteria in AMD patients.
Methods: For this study, samples were recruited from Advanced Eye Centre, PGIMER, Chandigarh, India. Case-only analysis of anonymous imaging data (OCT/Fundus) acquired during the routine clinical evaluation of patients was done to examine the OCT findings in the AMD patients. TaqMan genotyping assays were used to analyze the single nucleotide polymorphisms in these patients. ELISA (enzyme linked immunosorbent assay) was used to estimate the protein levels of these genes in serum. Information pertaining to lifestyle/habits was also collected by administering a standard questionnaire at the time of recruitment of the patients.
Results: Intra-retinal fluid (IRF) was associated significantly with the LIPC genotype (p=0.04). Similarly, smoking status and early AMD were also associated with the APOE genotype (p=0.03). Additionally, variants of IER-3 and SLC16A8 were also found to be associated with co-morbidities (p=0.02) and males (p=0.02), respectively. RPED has shown a significant association with AREDS criteria, which demonstrated an area under AUROC around 72%.
Conclusion: Results of genotype–phenotype association can give a precise impression of AMD severity and can be beneficial for the early diagnosis of AMD cases.
Keywords: age-related macular degeneration, RPE detachment, OCT parameters, TIMP-3, HTRA1, IPC, APOE, anti-VEGF therapy, AREDS
Introduction
Age-related macular degeneration (AMD) is a retinal degenerative disorder that develops in late life, generally after 50 years of age. It is a painless condition but results in irreversible central vision loss.1 It is the third most common cause of blindness in the world. It has been estimated that, by 2020, 196 million people will be suffering from AMD. This number is predicted to increase to 240 million by 2088.2 AMD can occur due to impaired functioning of choroidal blood vessels, retinal pigment epithelial cells, Bruch’s membrane (BM), and the photoreceptor layer.3 AMD is broadly categorized into dry and wet forms. The advent of high-resolution OCT imaging (optical coherence tomography) brought new insights into the evaluation and monitoring of phenotypic variations of retinal layers in AMD patients.4,5 Ophthalmologists frequently use it for qualitative phenotypic manifestations assessment, such as cystoid spaces, retinal pigment epithelium detachments (PEDs), sub-retinal fluid (SRF), and/or vitreomacular pathologies.6
The characteristic feature of dry AMD, such as drusen (deposition of lipofuscin between the RPE and its underlying basement membrane – Bruch’s membrane), appears as the distinct elevation of the RPE with varying reflectivity on an OCT image. These are seen as hyper-reflective stacks below the RPE layers on an OCT image, causing RPE irregularity. Moreover, the sub-retinal fluid appears as an opaque space between the neuro-sensory retina’s rear end and the RPE/choroid-capillaries complex reflection. The RPE detachment gives slightly more reflection on OCT. This increased reflectivity of the RPE severely overshadows the noise from the underlying choroid. In SD-OCT, geographic atrophy appears as a central thinning of the retina over a degenerated zone of RPE. Pigment epithelial detachment is usually responsible for impaired vision, usually indicated with choroidal neovascularization (CNV). Therefore, the identification of pigment epithelial defects (PEDs) by OCT analysis carries a prognostic value.7,8 These morphological changes are being used to determine the course of diagnosis and treatment of such patients to enhance AMD management.
AMD is a multifactorial disease. Inflammation, drusen formation (lipofuscin genesis), and neovascularization contribute to AMD’s pathophysiology.9 Many factors have been linked with AMD occurrence and progression, but age being the most important factor. Rudnicka et al have found that the risk of AMD incidence increases four times with an increase in age by 10 years. Additionally, family history, smoking habits and previous cataract surgery have been identified as risk factors for AMD.10 Cholesterol, diabetes and menopausal age have also been associated with AMD.11 Results have also found that higher circulating levels of white blood cells that the gut microbiome has been observed to be different among AMD cases and controls12 which can be used as biomarkers for AMD.13 In addition to environmental factors, genetics also play a crucial role in the manifestation of AMD.14
Many studies have examined the association of AMD with various genetic factors. Genetic variants of complement factors (C2, CFI, CFH, CCL2), angiogenesis (VEGFs, VEGFRs, etc), pro-angiogenic genes (TIMP3, ADAMTS9), and metabolizing genes (LIPC, APOE) genes have been reported to be associated with the risk of AMD15–20 genetic polymorphisms in different genes have been linked to AMD like CFHY402H (rs1061170), ARMS2 (rs10490924), C2 (rs547154), ABCA1 (rs1883025), VEGFA (rs4711751) are associated with advanced AMD, ie, neovascular form of AMD,21 genetic polymorphisms in TLR are associated with AMD in Indian population.19 Some studies have shown a negative association of AMD with genetic variants of rs2075650 ofApoE,22 rs10468017 of hepatic lipase (LIPC),23 and allele T of variant rs493258of hepatic lipase.24 Hence, the exact role of these genes can be defined by examining their expression profile in serum of AMD patients. For example, lipid metabolizing proteins (LIPC and APOE), monocarboxylic acid transporter protein SLC16A8, TIMP‐3,20 angiogenic VEGF16 and HTRA1,25 ARMS2, COL8A126 levels were found to be increased in serum of AMD patients in comparison to controls. Daily life activities like sleeping patterns are also known to modulate the protein expression of the genes.15 We have also identified that genetic variants and subsequent protein alterations especially lipid metabolising proteins (APOE and LIPC) can modulate the anti-VEGF response in wet AMD patients.53 But, the translation of such studies to diagnostic and therapeutic advancement remains neglected because most of the studies lack the approach to consider the clinical findings, genotype, protein expression and socio-demographic variables as an integral entity to dissect the AMD complexity. Hence, we have conducted a pilot study where an association between genotype, phenotype, protein levels and demographic variables has been investigated and attempted to investigate the association of genetic differences with OCT findings of AMD patients.
Materials and Methods
Study Design
The present study is a case-only analysis of 53 AMD patients attending the retina clinic of Advanced Eye Centre, Post Graduate Institute of Medical Education and Research (PGIMER), Chandigarh during the period 2014–2018. Patients were recruited after obtaining written consent at the time of enrollment. The ethical approval for the study was obtained from the Institutional Ethical Committee, PGIMER, Chandigarh. Retrospective case-only analysis of anonymous imaging data was acquired during the routine clinical evaluation of patients diagnosed with AMD. This study received ethical approval from the PGIMER Ethical Committee (No: PGI/IEC/2005-06; dated: 23.07.2013), PGIMER, Chandigarh, India, and followed the provisions of the ethical approval. Study was conducted in accordance with the declaration of Helsinki. Participants were informed about purpose and nature of the study before recruiting them.
Recruitment of Patients
The patients included in this study were recruited from the co-author’s clinic. The inclusion criteria of research subjects included a diagnosis of AMD following AREDS criteria during a dilated Fundus examination by this study’s co-author, a retina specialist.
Only patients aged 50 or above were recruited as research subjects of this study. Group 1: Each eye had no drusen or non-extensive small drusen (AMD category 1); Group 2 (Intermediate Drusen): At least one eye had one or more intermediate drusen, extensive small drusen, or pigment abnormalities associated with AMD (AMD category 2); Group 3 (Large Drusen): At least one eye had one or more large drusen or extensive intermediate drusen; Group 4 (Geographic Atrophy): At least one eye had geographic atrophy. Group 5 (Neovascular): Choroidal neovascularization or RPE detachment in one eye (nondrusenoid RPE detachment, serous sensory or hemorrhagic retinal detachment, subretinal hemorrhage, subretinal pigment epithelial hemorrhage, subretinal fibrosis, or evidence of confluent photocoagulation for neovascular AMD.27
Patients below the age of 50 and having AMD-like clinical features but associated with some other pathological conditions, such as diabetic retinopathy, uveitis, and near-sightedness were excluded from the study.
OCT Findings
Macular OCT image of AMD patients was acquired using Cirrus HD-OCT (Carl Zeiss Meditec, Dublin, CA) with a super-luminescent diode (840 nm). It can obtain 27,000 optical coherence A-scans per second. Macular cube and radial scans were performed in the eyes of AMD patients. Retinal layer thickness (μm) was estimated by analyzing the macular cube (512 × 128) protocol covering a 10.4° radius foveal area. Additionally, 6 mm radial lines consisting of 128 A-scans per line and cross-hair protocol including two 6 mm lines (6–12 to 9–3 o’clock) at 512 scan resolution were also carried out in these eyes.
Distance between anterior inner limiting membrane (ILM) and posterior RPE was measured to denote the retinal thickness (μn). Tabular output mode was used to analyze foveal thickness from the OCT image. Morphological deformities in the retinal layer were analyzed based on OCT images, which have been reported in previous literature, including subretinal fluid (SRF), intra-retinal fluid (IRF), pigment epithelial detachment (RPED), RPE irregularity (RPE Irr), and fibrosis. Clinical parameters obtained from OCT images like retinal thickness, presence, and location of intra-retinal cysts, RPED, SRF were also observed in clinical trials for CNV AMD patients to show morphological integrity of retinal layers.28
SRF was identified as a non-reflective space between the posterior RPE layer and the neuro-sensory retina above. The intra-retinal fluid was determined by the presence of cysts that were defined as round, minimally reflective spaces within the neuro-sensory retina. PED was described as a focal elevation of the reflective retinal pigment epithelium (RPE) band over an optically clear or moderately reflective space.
Collection of Socio-Demographic Data
The demographic information like age, gender, smoking habits, food habits and co-morbidities (eg hypertension, cardiovascular diseases, diabetes etc) of the patients was collected, like by administering a standard questionnaire. Socio-demographic details of the study population are described in Table 1.
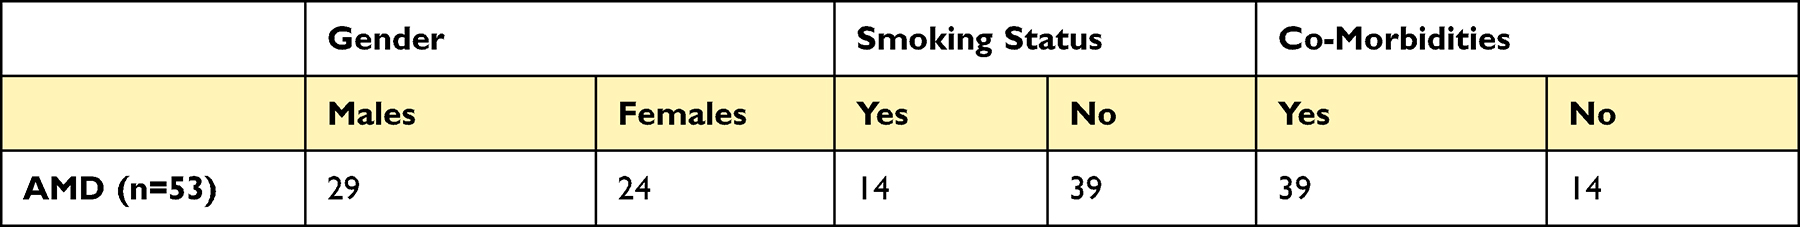 |
Table 1 Sociodemogaphic details of AMD patients recruited in the study |
Isolation of Serum
2–4 mL blood was taken in the vacutainers containing clot activators (BD Biosciences, USA). Centrifugation was carried out at 2500 rpm (high knob) at room temperature for 30 minutes. The upper clear layer of serum was collected in centrifuge tubes and stored at −80◦C till further uses, after proper labeling and coding.
ELISA Estimation
The serum levels of LIPC (Hepatic Lipase C), TIMP-3 (Tissue inhibitor of metalloproteinases-3), B3GALTL (Beta 3-Glucosyltransferase), IER-3 (Immediate Early Response −3), SLC16A8, (Solute Carrier Family 16 Member 8), ADAMTS9 (ADAM Metallopeptidase With Thrombospondin Type 1 Motif 9), HTRA1 (High-Temperature Requirement A Serine Peptidase 1), and APOE (Apolipoprotein E) proteins were estimated using commercially available kits (Qayee-Bio, China). The experiment was performed as per the manufacturer’s protocol for the estimation of proteins in serum. Experiments were conducted after standardization. Standards were run in duplicates and samples were run in random duplicates. The absorbance reading was taken at 450 nm on an ELISA reader (Biorad, USA). Total protein estimation was performed with 400 times diluted serum samples to normalize the ELISA values.
Estimation of Total Protein
Total protein was estimated using Bradford’s method. Bovine serum albumin was used as standard in these experiments. Bradford reagent (Sigma, USA) and autoclaved water was used in 1:4 dilution and the absorbance was measured at 595nm using ELISA reader (Biorad). Normalization of ELISA counts were carried out by using values obtained from total protein estimation.
PBMC Isolation and DNA Extraction
4 mL blood sample was taken in EDTA vacutainer (BD Biosciences, USA) and RBCs were allowed to settle for 2 hours at room temperature. Upper layer was collected and carefully layered on equal volume of histopaque previously taken in a separate tube. It was subjected to centrifugation at 1500 rpm (REMI, India) for 30 minutes. Three layers were obtained after this procedure. The middle buffy layer was aspirated out and taken in the centrifuge tube. Two washes of 1X PBS were given at 5000rpm for 5 minutes at 4◦C. The PBMC pellet was suspended and stored at −80 0 C for further use. Genomic DNA was extracted using commercially available kits (Qiagen, Germany). UV spectrophotometer (Beckman Coulter) was used to estimate concentration and integrity of the isolated DNA by measuring absorbance at 260nm, after labeling and coding, DNA was stored at −200C till further use.
Analysis of Single Nucleotide Polymorphisms
Single nucleotide polymorphisms were analyzed by TaqMan genotyping assay (ABI, USA). Real-time PCR was carried out to analyze SNPs for eight genes, namely LIPC (rs920915), TIMP-3 (rs5749482), B3GALTL (rs9621532), IER-3 (rs3130783), SLC16A8 (rs8135665), ADAMTS9 (rs6795735), HTRA1 (rs11200638) and APOE (rs4420638). Briefly, PCR conditions included a denaturation step at 95◦C for approximately 10 minutes, an extension step at 95◦C for 15 seconds, and 60◦C for 1 minute. The process was repeated for 40 cycles. The reaction mixture’s total volume was 10 µL, with 20ng as the total concentration of genomic DNA in the TaqMan assay reaction.
Statistical Analysis
Frequencies for studied genotypes have been measured to distribute clinical parameters obtained from OCT image analysis, and their statistical significance has been calculated through the chi-square test. Pearson’s correlation was used to find a relationship between OCT biomarkers and genotypes. Independent Student’s t-test was used to analyze statistical significance of differential expressions between the genetic variants. To establish the correlation between existing AREDS criteria (used for AMD classification) and OCT parameters, we used Pearson's correlation. Diagnostic efficacy and specificity of the OCT parameters to identify AMD patients were calculated through ROC curve and area under ROC (AUROC) curve. All the values were reported with a 95% confidence interval, and p-values ≤ 0.05 were taken to be statistically significant. Statistical analysis was done by using SPSS 22.0 (SPSS, USA). The power analysis was conducted, and its values varied from 0.78 to 0.99 for this study for varying sample sizes from 41 to 53; values were found to be at 95% CI, and p values were statistically significant (p < 0.05).
Results
Relationship Between Genotypic Frequency and Clinical Parameters
For all the eight variants, we analyzed the association of genotype with clinical parameters obtained from OCT. The socio-demographic details of the recruited AMD patients are mentioned in Table 1. For the ADAMTS9 variant, the homozygous T/T genotype association was seen with all the clinical findings. The association of the homozygous C/C genotype was lowest with all the clinical parameters. The number of patients with homozygous A/A genotype in the APOE gene was highest for all clinical findings. For the LIPC variant, homozygous G/G genotype patients had the highest incidence of all clinical findings than homozygous C/C variant and heterozygous C/G variant. LIPC genotypes were found to be significantly associated with intra-retinal fluid, among the other clinical findings (Table 2). For Intra-retinal fluid, the highest number of individuals was homozygous G/G, followed by heterozygous C/G and homozygous C/C. In the case of the HTRA1 variant, patients with the homozygous G/G genotype had the highest incidence of SRF, IRF, and RPE irregularity. Patients with homozygous A/A genotype had the highest incidence of subretinal fibrosis. The incidence of RPED was found to be equal in patients with homozygous A/A and heterozygous A/G genotypes (Table 2). Non-significant variants are shown in the supplementary information (Table S1) Results are graphically represented in the supplementary text. (Figures S1–S8).
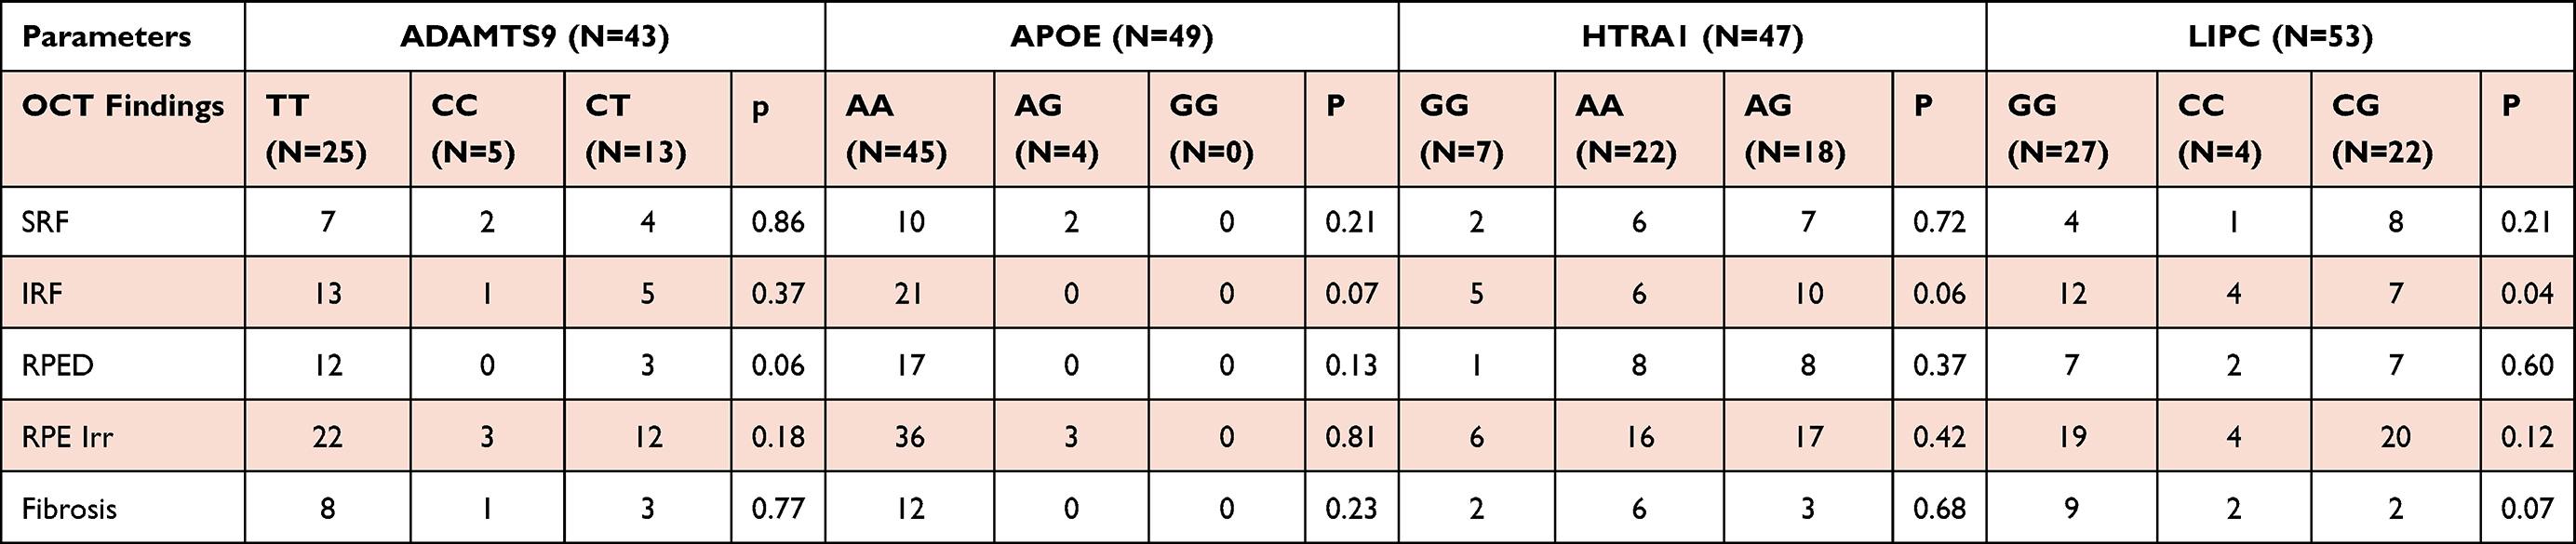 |
Table 2 Association of genotypes of studied SNPs with clinical findings of AMD patients. LIPC (Lipase C) was found to be significantly associated with IRF (intra retinal fluid) |
Association of Genetic Variants with Socio-Demographic Variables
Out of 43 patients, 74.1% of the subject had co-morbidities, and among those with co-morbidities, 59.37%, 25%, and 15.62% had homozygous T/T, heterozygous C/T, and homozygous C/C genotype, respectively, for ADAMTS9 variant. For ApoE variants, out of 49 patients, 75.5% had co-morbidities. Among those with co-morbidities, 45.03% had homozygous A/A genotype, and 3.97% had heterozygous A/G genotype, respectively. Genotype was significantly associated with smoking status (P=0.03) (Table 3). Among variants of B3GALTL, out of 46 individuals, 78.26% had co-morbidities among those with co-morbidities, 68.75%, 34.37%, and 9.37% had homozygous T/T, heterozygous C/T, and homozygous C/C genotypes, respectively. For IER-3- variant, out of 41 patients, 62.79% had co-morbidities among those with co-morbidities, and 88.8% had heterozygous A/G genotype, and 11.11% had homozygous A/A genotype. Co-morbidities were also found to be significantly associated with the IER-3 genotype (P= 0.02). We also looked at the association of SLC16A8 with socio-demographic variables. We found that out of 44 patients, 77.27% had co-morbidities among those with co-morbidities, 55.88%, 38.23%, and 5.88% had homozygous C/C, heterozygous C/T and HomozygousT/T genotypes, respectively. Also, gender was significantly associated with the SLC16A8 genotype (P=0.02). For the HTRA1 variant, out of 46 patients, 78.26% had co-morbidities among those with co-morbidities, 50%, 33%, and 16.66% had homozygous G/G, heterozygous A/G, and homozygous A/A variants, respectively (Table 3). For variants of LIPC, out of 53 patients, 73.58% had co-morbidities; among those with co-morbidities, 51.28%, 43.58%, and 5.1% had homozygous G/G, heterozygous C/G and homozygous C/C variants, respectively. Similarly, for TIMP-3 variants, out of 51 patients, 70.5% had co-morbidities, and among those with co-morbidities, 86.0% had homozygous C/C, and 13.8% had heterozygous G/C genotypes. The association of genotypes and socio-demographic variables is graphically represented in the supplementary text (Figures S9–S16). Additionally, the association of genotype of the variants studied with early, intermediate and advanced AMD is represented graphically in Figures S17 and S18.
 |
Table 3 Association of genotype of studied genetic loci with gender, smoking status, co-morbidities and diagnosis based on AREDS criteria: There was a significant association between genotype and some studied variables. ADAMSTS9 genotype aas associated with AREDS criteria. IER-3 genotype was associated with the co-morbidities, and SLC16A8 genotype was associated with gender in AMD patients |
Protein Expression versus Genotype
We have also investigated the association of protein levels with the difference in genotype. We observed that the protein level was similar among the different genotypes, with a slight difference between protein expression in HTRA1 and LIPC genotypes. Although, the differences were not statistically significant, as seen in Table S2.
Association of Clinical Parameters with AREDS Criteria
Additionally, we have attempted to associate previously mentioned clinical parameters, including SRF, IRF, RPED, RPE irregularity, and fibrosis with prevailing AREDS criteria for AMD patients. The chi-square result (Pearson’s chi-square p= 0.021) has demonstrated a significant association of RPED with AREDS criteria (Table 4), suggesting that the new approach is crucial for AMD patients’ diagnosis. However, the association with other non-significant clinical parameters with AREDS may be due to the study’s inadequate sample size. Additionally, results of area under the receiver operating curve (AUROC), which found to be around 72% (p=0.019) to determine the sensitivity and specificity of the model (Figure 1) with minimum standard error 0.08 and with a close range of 95% confidence intervals (CI 0.562–0.876). Results are suggesting RPED could be a leading parameter for diagnosing AMD cases from the population (Table 4).
 |
Table 4 Association of clinical variants obtained from OCT images and their association with existing AREDS score designated with Pearson’s Chi-square values (p-value). RPED was found to be associated with AREDS score |
Discussion
Many studies on neurodegenerative disorders by our lab has found that various genes are implicated in neurodegenerative conditions like Parkinson’s, ALS and AMD in the Indian population.29–36 Also, we have been exploring various therapeutic strategies for these degenerative conditions.37–39 This investigation is also an attempt to find a missing link between clinical practice and lab findings. The present study aimed to demonstrate morphological deformities (as reflected by high-resolution OCT images) and see if these clinical findings can be associated with AMD’s genetic variants. Genome-wide association studies have identified specific genetic loci that are associated with AMD.12,13,40 A GWA study has identified genes, HTRA1, and CFH as significant contributors to AMD’s risk.41 Another study has found that genetic variants (frequency < 0.1%) of complement factor H (CFH), complement factor I (CFI), and tissue inhibitor of metalloproteinases(TIMPs), including a splice variant in SLC16A8 suggest causal roles for these genes, in AMD. The difference in ethnic backgrounds may also be one factor responsible for AMD pathology. In a study on the Italian population, SNPs in LIPC (Hepatic Lipase), SLC16A8 (Solute carrier family 16 members 8), and TIMP‐3 (Tissue inhibitor of metalloproteinases) were recognized as susceptibility factors responsible for causing AMD.30 Seddon et al have reported that the TT genotype of the LIPC variant was linked to a lower risk of AMD independent of socio-demographic variables like smoking, BMI (Body Mass Index), and a diet rich in lutein.42
OCT imaging has paved the way for better management of AMD and emerged as the gold standard for diagnosing wet AMD besides assessing anti-VEGF treatment responses and evaluating disease progression.43,44 Hence, the present study has been carried out to understand the association of genetic variants and protein expressions with OCT parameters to exhibit the genotype-phenotypic alterations to strengthen further AMD’s diagnostic protocol in clinical setup (no controls included). Karacorlu et al have studied the morphology of Bruch's membrane by using SD-OCT (Spectral Domain Optical Coherence Tomography) of CNV patients in association with anti-VEGF treatment.45 We considered five phenotypic changes: Intra-retinal fluid, Subretinal fluid, RPE irregularity, RPE detachment, and retinal fibrosis and found a significant association of LIPC genotypic variants with intra-retinal fluid (p<0.04).
In addition to genetics, socio-demographic factors like age, sex, weight, occupation, education, food habits, physical activity, night sleep hours, exposure to sunlight, water intake, and co-morbidities, microbiota status etc are believed to be the major risk factors for AMD. As AMD is a degenerative disease associated with ageing, age remains the most important risk factor for AMD incidence. Interestingly, women have also been reported to be at higher risk of developing AMD. Many studies have shown that smoking status confers the risk of development and progression of AMD and other diseases.42–52 We also found the association of smoking status and the number of individuals in different genotype groups of the APOE gene (p<0.03).14 Several studies have shown a positive correlation between smoking and AMD.14,16–19 Myers et al have found that smoking is positively associated with a high risk of converting the early form to moderate form of AMD.47 Another study reported smoking to be associated with the occurrence of AMD.48 For example, Rim et al found that the risk of developing advanced AMD is related to smoking’s current or past status.49 In addition to lifestyle, the co-existence of a diseased state increases the probability of AMD occurrence. Hypertension, cardiovascular abnormalities, and diabetes have also been reported in AMD as a comorbid condition. In the current study, we have found that co-morbidities were significantly associated with genotypic variants of IER-3 (p<0.02). A previous study carried out by Vassilev et al also found an association between AMD, Diabetes, history of eye diseases, and cardiovascular disorders,50 highlighting the importance of environment and history of illness on the pathogenesis of AMD. Environment plays a vital role in people’s adaptation and self-regulation.10 Rohrer et al have shown an association of complement factor products, SNPs smoking, and BMI with AMD in the population of South Carolinians. The study results have also demonstrated that AMD was more common in people of European descent than Americans.51 Additionally, Europeans were found to have a higher risk of developing AMD with more copy numbers of rs3766404 (CFH) and a lower chance with more copy numbers of rs1536304 (VEGFA).
AREDS criteria are used routinely to diagnose AMD, but this study examined the potential association of genotype with AREDS. Interestingly, we have found a significant association between the early stage of AMD and genotypes of APOE (p<0.002). Additionally, we have also demonstrated that the genotypic variation of SLC16A8 (p<0.02) was significantly associated with male AMD patients in the Indian population.
The discovery of biomarkers that postulate AMD’s association with genetic variants may facilitate early AMD diagnostics and therapeutics. Therefore, our analysis of the protein expressions in the AMD patients’ serum has shown a varying degree of expression among genotypes of all studied genes. We did not find a significant correlation between genotype and expression levels for genes, indicating that there may be other genetic factors exerting their pathologic effects. The initiation of disease and its progression could be influenced by a varied degree of genetic penetrance of different gene loci. One of the limitations of this study was the small sample size, but this pilot study has provided the initial data for a large cohort study to strengthen AMD’s better management. Lee et al have shown that previously collected OCT images may be used to generate retinal flow maps from structure images of patients.52 Conclusively, the present study results have suggested that expression of lipid metabolizing proteins (LIPC and APOE), pro-angiogenic protein (ADAMTS9), and Serine protease HTRA1 may be considered to reflect the alterations in OCT image parameters.
Additionally, OCT image parameter SRF has demonstrated the association with APOE, LIPC, and HTRA1genotypes. Similarly, RPED has also been found to be associated with ADAMTS9 levels. But these findings need to be validated on larger sample size by considering population-based genotype susceptibility to redefine the diagnostic criteria of AMD pathology.
Conclusion
Intra-retinal fluid (IRF) was associated significantly with the LIPC genotype (p=0.04). Similarly, smoking status and early AMD were also associated with the APOE genotype (p=0.03). Additionally, IER-3 variants and SLC16A8 genotypes were also found to be associated with co-morbidities (p=0.02) and males (p=0.02), respectively. RPED has shown a significant association with AREDS criteria, which demonstrated an area under AUROC around 72%. In addition to genetic association findings with gender, smoking status and co-morbidities, this pilot study highlights the association of OCT biomarkers with genetic polymorphisms and diagnostic criteria like AREDS in AMD patients. We propose that further Analysis of GWAS using various OCT parameters of AMD patients may help us in identifying disease-modifying genes and aid in developing personalized therapies.
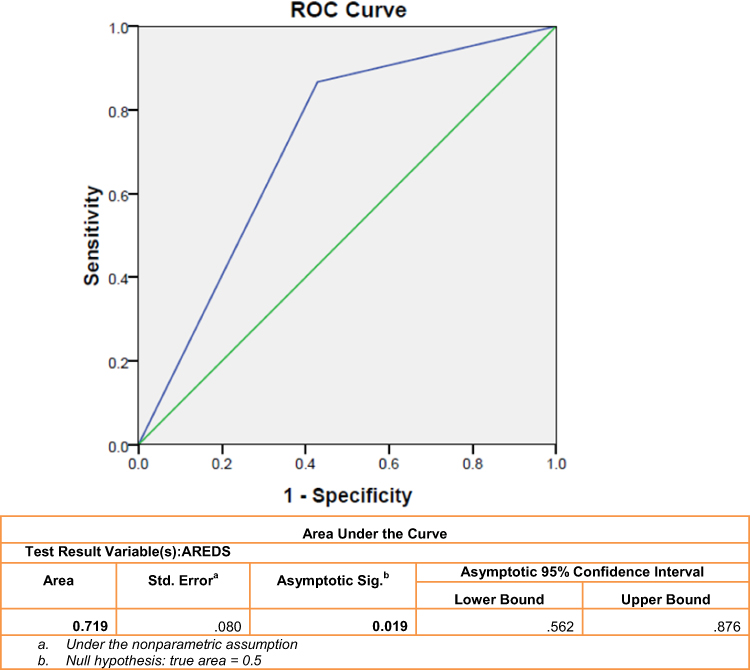 |
Figure 1 Area under ROC (AUROC) to predict AMD cases from the normal population based on the criteria of association between RPED and AREDS. |
Data Sharing Statement
All the relevant data of the manuscript is available with the corresponding author of the manuscript and accessible whenever asked.
Ethical Approval and Consent to Participate
This study received ethical approval from the PGIMER Ethical Committee (No: PGI/IEC/2005-06; dated: 23.07.2013), PGIMER, Chandigarh, India, and followed the provisions of the ethical approval. Participants were recruited only after taking written consent from them.
Consent to Publication
All the authors give consent to publish this manuscript.
Acknowledgment
We acknowledge the participants who were recruited in this study. We also acknowledge Dr Kamal Kishore, Department of Biostatistics, PGIMER, Chandigarh, and Mr Rajesh, Panjab University, Chandigarh, for the statistical analysis of the data.
Author Contributions
All authors made a significant contribution to the work reported, whether that is in the conception, study design, execution, acquisition of data, analysis and interpretation, or in all these areas; took part in drafting, revising or critically reviewing the article; gave final approval of the version to be published; have agreed on the journal to which the article has been submitted; and agree to be accountable for all aspects of the work.
Funding
The study was funded by the Department of Biotechnology, New Delhi, India (No. BT/PR17550/MED/30/1755/2016).
Disclosure
The authors report no conflicts of interest in this work.
References
1. Randolph SA. Age-related macular degeneration. Workplace Health Saf. 2014;62(8):352. doi:10.1177/216507991406200807
2. Wong WL, Su X, Li X, et al. Global prevalence of age-related macular degeneration and disease burden projection for 2020 and 2040: a systematic review and meta-analysis. Lancet Glob Health. 2014;2(2):e106–e116. doi:10.1016/S2214-109X(13)70145-1
3. Zając-Pytrus HM, Pilecka A, Turno-Kręcicka A, et al. The dry form of Age-Related Macular Degeneration (AMD): the current concepts of pathogenesis and prospects for treatment. Adv Clin Exp Med. 2015;24(6):1099–1104. doi:10.17219/acem/27093
4. Baumal CR. Clinical applications of optical coherence tomography. Curr Opin Ophthalmol. 1999;10(3):182–188. doi:10.1097/00055735-199906000-00006
5. Voo I, Mavrofrides EC, Puliafito CA. Clinical applications of optical coherence tomography for the diagnosis and management of macular diseases. Ophthalmol Clin North Am. 2004;17(1):21–31. doi:10.1016/j.ohc.2003.12.002
6. Schmidt‐Erfurth UM, Richard G, Augustin A, et al. Guidance for the treatment of neovascular age‐related macular degeneration. Acta Ophthalmol Scand. 2007;85(5):486–494. doi:10.1111/j.1755-3768.2007.00979.x
7. Spaide RF. Enhanced depth imaging optical coherence tomography of retinal pigment epithelial detachment in age-related macular degeneration. Am J Ophthalmol. 2009;147(4):644–652. doi:10.1016/j.ajo.2008.10.005
8. Penha FM, Rosenfeld PJ, Gregori G, et al. Quantitative imaging of retinal pigment epithelial detachments using spectral-domain optical coherence tomography. Am J Ophthalmol. 2012;153(3):515–523. doi:10.1016/j.ajo.2011.08.031
9. Nowak JZ. Age-related macular degeneration (AMD): pathogenesis and therapy. Pharmacol Rep. 2006;58(3):353.
10. Chakravarthy U, Wong TY, Fletcher A, et al. Clinical risk factors for age-related macular degeneration: a systematic review and meta-analysis. BMC Ophthalmol. 2010;10(1):31. doi:10.1186/1471-2415-10-31
11. Tomany SC, Wang JJ, van Leeuwen R, et al. Risk factors for incident age-related macular degeneration: pooled findings from 3 continents. Ophthalmology. 2004;111(7):1280–1287. doi:10.1016/j.ophtha.2003.11.010
12. Zinkernagel MS, Zysset-Burri DC, Keller I, et al. Association of the intestinal microbiome with the development of neovascular age-related macular degeneration. Sci Rep. 2017;7(1):40826. doi:10.1038/srep40826
13. Zisimopoulos A, Klavdianou O, Theodossiadis P, et al. The role of the microbiome in age-related macular degeneration: a review of the literature. Ophthalmologica. 2021;244(3):173–178. doi:10.1159/000515026
14. Rudnicka AR, Kapetanakis VV, Jarrar Z, et al. Incidence of late-stage age-related macular degeneration in American whites: systematic review and meta-analysis. Am J Ophthalmol. 2015;160(1):85–93. e3. doi:10.1016/j.ajo.2015.04.003
15. Sharma K, Singh R, Sharma SK, et al. Sleeping pattern and activities of daily living modulate protein expression in AMD. PLoS One. 2021;16(6):e0248523. doi:10.1371/journal.pone.0248523
16. Sharma K, Sharma NK, Singh R, et al. Exploring the role of VEGF in Indian age related macular degeneration. Ann Neurosci. 2015;22(4):232–237. doi:10.5214/ans.0972.7531.220408
17. Sharma NK, Sharma K, Singh R, et al. CCL2 single nucleotide polymorphism of rs1024611 implicates prominence of inflammatory cascade by univariate modeling in Indian AMD. PLoS One. 2018;13(4):e0193423. doi:10.1371/journal.pone.0193423
18. Sharma K, Sharma NK, Singh R, et al. Gene networks determine predisposition to AMD. Genomics. 2021;113(1):514–522. doi:10.1016/j.ygeno.2020.09.044
19. Sharma NK, Sharma K, Gupta A, et al. Does toll-like receptor-3 (TLR-3) have any role in Indian AMD phenotype? Mol Cell Biochem. 2014;393(1–2):1–8. doi:10.1007/s11010-014-2040-4
20. Sharma K, Tyagi R, Singh R, et al. Serum levels of TIMP-3, LIPC, IER3, and SLC16A8 in CFH-negative AMD cases. J Cell Biochem. 2017;118(8):2087–2095. doi:10.1002/jcb.25837
21. Rajendran A, Dhoble P, Sundaresan P, et al. Genetic risk factors for late age-related macular degeneration in India. Br J Ophthalmol. 2018;102(9):1213–1217. doi:10.1136/bjophthalmol-2017-311384
22. Kan M, Weng X, Wang T, et al. No evidence of association between variant rs2075650 in lipid metabolism-related locus APOE/TOMM40 and advanced age-related macular degeneration in Han Chinese population. Exp Biol Med. 2015;240(2):230–234. doi:10.1177/1535370214553770
23. Wang Y-F, Han Y, Zhang R, Qin L, Wang MX, Ma L. CETP/LPL/LIPC gene polymorphisms and susceptibility to age-related macular degeneration. Sci Rep. 2015;5(1):1–13.
24. Wang Y, Wang M, Zhang X, et al. The association between LIPC rs493258 polymorphism and the susceptibility to age-related macular degeneration. Int J Environ Res Public Health. 2016;13(10):1022. doi:10.3390/ijerph13101022
25. Qureshi IZ, Ambreen F. Serum APOE, leptin, CFH and HTRA1 levels in Pakistani age related macular degeneration patients. J Pak Med Assoc. 2017;67(6):852–857.
26. Battu P, Sharma K, Rain M, et al. Serum levels of ARMS2, COL8A1, RAD51B, and VEGF and their correlations in age-related macular degeneration. Curr Neurovasc Res. 2021;18(2):181–188. doi:10.2174/1567202618666210531130711
27. Age-Related Eye Disease Study Research Group. Risk factors associated with age-related macular degeneration. A case-control study in the age-related eye disease study: Age-Related Eye Disease Study Report Number 3. Ophthalmology. 2000;107(12):2224–2232. doi:10.1016/s0161-6420(00)00409-7
28. Ritter M, Elledge J, Simader C, et al. Evaluation of optical coherence tomography findings in age-related macular degeneration: a reproducibility study of two independent reading centres. Br J Ophthalmol. 2011;95(3):381–385. doi:10.1136/bjo.2009.175976
29. Sharma NK, Gupta A, Prabhakar S, et al. CC chemokine receptor-3 as new target for age-related macular degeneration. Gene. 2013;523(1):106–111. doi:10.1016/j.gene.2013.03.052
30. Anand A, Gupta PK, Sharma NK, et al. Soluble VEGFR1 (sVEGFR1) as a novel marker of amyotrophic lateral sclerosis (ALS) in the North Indian ALS patients. Eur J Neurol. 2012;19(5):788–792. doi:10.1111/j.1468-1331.2011.03548.x
31. Anand A, Sharma NK, Gupta A, et al. Single nucleotide polymorphisms in MCP-1 and its receptor are associated with the risk of age related macular degeneration. PLoS One. 2012;7(11):e49905. doi:10.1371/journal.pone.0049905
32. Gupta PK, Prabhakar S, Abburi C, Sharma NK, Anand A. Vascular endothelial growth factor-a and chemokine ligand (CCL2) genes are upregulated in peripheral blood mononuclear cells in Indian amyotrophic lateral sclerosis patients. J Neuroinflammation. 2011;8(1):1–6. doi:10.1186/1742-2094-8-1
33. Sharma NK, Gupta A, Prabhakar S, et al. Single nucleotide polymorphism and serum levels of VEGFR2 are associated with age related macular degeneration. Curr Neurovasc Res. 2012;9(4):256–265. doi:10.2174/156720212803530681
34. Sharma NK, Gupta A, Prabhakar S, et al. Association between CFH Y402H polymorphism and age related macular degeneration in North Indian cohort. PLoS One. 2013;8(7):e70193. doi:10.1371/journal.pone.0070193
35. Sharma NK, Prabhakar S, Gupta A, et al. New biomarker for neovascular age-related macular degeneration: eotaxin-2. DNA Cell Biol. 2012;31(11):1618–1627. doi:10.1089/dna.2012.1786
36. Vinish M, Prabhakar S, Khullar M, et al. Genetic screening reveals high frequency of PARK2 mutations and reduced Parkin expression conferring risk for Parkinsonism in North West India. J Neurol Neurosurg Psychiatry. 2010;81(2):166–170. doi:10.1136/jnnp.2008.157255
37. Anand A, Saraf MK, Prabhakar S. Sustained inhibition of brotizolam induced anterograde amnesia by norharmane and retrograde amnesia by l-glutamic acid in mice. Behav Brain Res. 2007;182(1):12–20. doi:10.1016/j.bbr.2007.04.022
38. Singh T, Prabhakar S, Gupta A, et al. Recruitment of stem cells into the injured retina after laser injury. Stem Cells Dev. 2012;21(3):448–454. doi:10.1089/scd.2011.0002
39. Anand A, Saraf MK, Prabhakar S. Antiamnesic effect of B. monniera on L-NNA induced amnesia involves calmodulin. Neurochem Res. 2010;35(8):1172–1181. doi:10.1007/s11064-010-0171-x
40. Yasuda M, Kiyohara Y, Hata Y, et al. Nine-year incidence and risk factors for age-related macular degeneration in a defined Japanese population the Hisayama study. Ophthalmology. 2009;116(11):2135–2140. doi:10.1016/j.ophtha.2009.04.017
41. Horie-Inoue K, Inoue S. Genomic aspects of age-related macular degeneration. Biochem Biophys Res Commun. 2014;452(2):263–275. doi:10.1016/j.bbrc.2014.08.013
42. Seddon JM, Reynolds R, Rosner B. Associations of smoking, body mass index, dietary lutein, and the LIPC gene variant rs10468017 with advanced age-related macular degeneration. Mol Vis. 2010;16:2412.
43. Fung AE, Lalwani GA, Rosenfeld PJ, et al. An optical coherence tomography-guided, variable dosing regimen with intravitreal ranibizumab (Lucentis) for neovascular age-related macular degeneration. Am J Ophthalmol. 2007;143(4):566–583. e2. doi:10.1016/j.ajo.2007.01.028
44. Rosenfeld PJ. Optical coherence tomography and the development of antiangiogenic therapies in neovascular age-related macular degeneration. Invest Ophthalmol Vis Sci. 2016;57(9):OCT14–OCT26. doi:10.1167/iovs.16-19969
45. Karacorlu M, Sayman Muslubas I, Arf S, et al. Membrane patterns in eyes with choroidal neovascularization on optical coherence tomography angiography. Eye. 2019;33(8):1280–1289. doi:10.1038/s41433-019-0415-1
46. Cascella R, Strafella C, Caputo V, et al. Towards the application of precision medicine in age-related macular degeneration. Prog Retin Eye Res. 2018;63:132–146. doi:10.1016/j.preteyeres.2017.11.004
47. Myers CE, Klein BEK, Gangnon R, et al. Cigarette smoking and the natural history of age-related macular degeneration: the Beaver Dam Eye Study. Ophthalmology. 2014;121(10):1949–1955. doi:10.1016/j.ophtha.2014.04.040
48. Rasoulinejad SA, Zarghami A, Hosseini SR, et al. Prevalence of age-related macular degeneration among the elderly. Casp J Intern Med. 2015;6(3):141.
49. Rim TH, Cheng C-Y, Kim DW, et al. A nationwide cohort study of cigarette smoking and risk of neovascular age-related macular degeneration in East Asian men. Br J Ophthalmol. 2017;101(10):1367–1373. doi:10.1136/bjophthalmol-2016-309952
50. Vassilev ZP, Ruigomez A, Soriano-Gabarro M, et al. Diabetes, cardiovascular morbidity, and risk of age-related macular degeneration in a primary care population. Invest Ophthalmol Vis Sci. 2015;56(3):1585–1592. doi:10.1167/iovs.14-16271
51. Rohrer B, Frazer-Abel A, Leonard A, et al. Association of age-related macular degeneration with complement activation products, smoking, and single nucleotide polymorphisms in South Carolinians of European and African descent. Mol Vis. 2019;25:79–92.
52. Lee CS, Tyring AJ, Wu Y, et al. Generating retinal flow maps from structural optical coherence tomography with artificial intelligence. Sci Rep. 2019;9(1):5694. doi:10.1038/s41598-019-42042-y
53. Sharma K, Battu P, Singh R, Sharma SK, Anand A. Modulated anti-VEGF therapy under the influence of lipid metabolizing proteins in Age related macular degeneration: a pilot study. Sci Rep. 2022;12(1):714. doi:10.1038/s41598-021-04269-6
 © 2022 The Author(s). This work is published and licensed by Dove Medical Press Limited. The
full terms of this license are available at https://www.dovepress.com/terms
and incorporate the Creative Commons Attribution
- Non Commercial (unported, 3.0) License.
By accessing the work you hereby accept the Terms. Non-commercial uses of the work are permitted
without any further permission from Dove Medical Press Limited, provided the work is properly
attributed. For permission for commercial use of this work, please see paragraphs 4.2 and 5 of our Terms.
© 2022 The Author(s). This work is published and licensed by Dove Medical Press Limited. The
full terms of this license are available at https://www.dovepress.com/terms
and incorporate the Creative Commons Attribution
- Non Commercial (unported, 3.0) License.
By accessing the work you hereby accept the Terms. Non-commercial uses of the work are permitted
without any further permission from Dove Medical Press Limited, provided the work is properly
attributed. For permission for commercial use of this work, please see paragraphs 4.2 and 5 of our Terms.