Back to Journals » Infection and Drug Resistance » Volume 19
Genotype Complexity Modulates Antimalarial Susceptibility in vitro
Authors Egwu CO ![]() , Ajibaye O
, Ajibaye O ![]() , Bojang F, Mbye H
, Bojang F, Mbye H ![]() , Ntui-Njock VN, Drammeh NF, Oriero EC, Amambua-Ngwa A
, Ntui-Njock VN, Drammeh NF, Oriero EC, Amambua-Ngwa A
Received 6 March 2026
Accepted for publication 11 June 2026
Published 26 June 2026 Volume 2026:19 605901
DOI https://doi.org/10.2147/IDR.S605901
Checked for plagiarism Yes
Review by Single anonymous peer review
Peer reviewer comments 2
Editor who approved publication: Dr Arif Siddiqui
Chinedu Ogbonnia Egwu,1,2,* Olusola Ajibaye,1,3,* Fatoumata Bojang,1 Haddijatou Mbye,1 Vincent Ntui Ntui-Njock,1 Ndey Fatou Drammeh,1 Eniyou Cheryll Oriero,1 Alfred Amambua-Ngwa1,*
1Disease Control and Elimination, Medical Research Council Unit, Banjul, The Gambia; 2Medical Biochemistry Department, College of Medicine, Alex-Ekwueme Federal University Ndufu-Alike, Ikwo, Ebonyi State, Nigeria; 3Department of Biochemistry and Nutrition, Nigerian Institute of Medical Research, Yaba, Lagos, Nigeria
*These authors contributed equally to this work
Correspondence: Chinedu Ogbonnia Egwu, Email [email protected] Alfred Amambua-Ngwa, Email [email protected]
Background: Increased tolerance and resistance to antimalarial drugs is one of the major threats responsible for the stagnation in the fight against malaria. The role of Plasmodium falciparum strain complexity to the overall efficacy of antimalarial drugs in naturally occurring infections is not fully understood.
Objective: This study investigated the impact of mixed infections of resistant and susceptible strains to antimalarials.
Methods: Fifteen Gambian field isolates and two laboratory strains (Dd2 and 3D7) were used for the complexity assays. IC50 and malaria drug survival assay (mDSA) were used to determine the survival and erythrocyte reinvasion rates of parasites following sub-therapeutic exposure to conventional antimalarials (CQ – 200 nM; PPQ – 200 nM, DHA – 24 nM, and LUM – 200 nM). The complexity of infection (COI) in the field isolates was confirmed by McCOIL tool, and the lab strains co-cultured at different proportions (100:0, 75:25, 50:50, 25:75, and 0:100) were exposed to CQ, DHA, and LUM.
Results: Our findings show that the resistant haplotype in a mixed infection drives the drug response through a significant (p < 0.05) shift in the IC50 of drugs. This shift in IC50 was most distinct for chloroquine using mixed infections of 3D7/Dd2. There was high reinvasion after subtherapeutic exposure to conventional antimalarial drugs in the field isolates. Isolates with resistant haplotypes against chloroquine, even in mixtures with susceptible strains, survived more.
Conclusion: Responses under drug pressure are strongly driven by the resistant haplotypes circulating alongside the wild types of Plasmodium falciparum. There is a need for continuous surveillance.
Keywords: mixed infections, drug survival assay, subtherapeutic, resistance, exposure, genotype complexity
Introduction
Malaria remains a global health disease with a heavy burden, especially in Africa. Up until 2015, malaria incidence experienced a significant global decline for almost two decades. However, progress in malaria control has now stalled, due to several factors, including the emergence of resistance to the drugs in parasites and insecticides in mosquitoes. Treatment and chemoprevention with antimalarial drugs are one of the major approaches for malaria control and elimination. Currently, artemisinin combination therapies (ACTs), which include artemisinin derivatives and a long-lasting partner drug, are recommended for the treatment of uncomplicated malaria.1 Similar to chloroquine and sulphadoxine-pyrimethamine, there are worrying signs of local emergence of ART resistance in Africa.2–4
This will be devastating for malaria control and elimination, with fears of increased mortality and reversal of the gains in malaria control in endemic countries. While the emergence of genetic variants countering drug action is the major contributor to resistance, failure of drug treatment could also be attributed to several other factors, including but not limited to incomplete treatment, poor adherence to the regimen, and use of substandard and counterfeit drugs. Put together, these contribute to the evolutionary dynamism that allows malaria parasites to adapt at genetic and metabolic levels, triggering a rapid proliferation of a select resistant population under drug pressure.5 Counterfeit drugs and incomplete treatment expose the malaria parasites to sub-therapeutic doses of active drugs, allowing for escape and adaptation towards clinical resistance. Unfortunately, these are common occurrences in sub-Saharan Africa, where malaria remains most endemic, and drug pressure is the highest from regular and medicinal pharmacopeia-derived agents.6
In areas of high transmission like West Africa, individuals are often infected with more than a single strain of the P. falciparum parasite. The prevalence of mixed infection varies with transmission intensities, although some Eastern African countries with moderate to high transmission infections are highly clonal.7 During mosquitoes’ bites, parasites with multiple haplotypes (complex genotype), including those that are resistant, are transmitted to people, causing multiclonal or polyclonal infection.7,8 Multiclonal infections can lead to variable sensitivities to drugs, which are determined by the genetic background of the infecting clones. Therefore, the presence of both drug-resistant and susceptible strains in different proportions presents a challenge in determining drug efficacy and treatment outcomes, because the overall response is determined by the dynamics of the complexity. As treatment clears susceptible strains, minority resistant strains that are fitter under drug pressure could expand and spread resistant strains.8,9 In The Gambia, where malaria has drastically declined, the national malaria programme is implementing several drug interventions, including, first-line treatment with artemether lumefantrine (AL), focal malaria management with case intervention with dihydroartemisinin piperaquine (DHA/PPQ) and seasonal malaria chemoprevention with sulphadoxine-pyrimethamine/amodiaquine. With resistant genotypes to chloroquine and antifolates still at high prevalence in the population, how this affects therapeutic efficacy is not known. We hypothesise that response to drug in mixed infections will be driven mostly by the resistant variant even at very low relative proportions.
This study aimed to understand the effect of mixed infection on in vitro drug response in lab and field isolates from The Gambia. We also investigated the survival rates and reinvasion of mono or mixed infection of lab and field isolates exposed to subtherapeutic drug doses. We show that mixed infections have a significant impact on drug responses.
Materials and Methods
Mixed Infection
Plasmodium falciparum Isolates
Individuals infected with malaria parasites were recruited following informed consent to join a therapeutic efficacy test by the National Malaria Control Program in The Gambia, West Africa. Following diagnosis with an HRP2-based Rapid diagnostic test, a 2 mL venous blood sample was taken. Each sample was transported to the Medical Research Council Unit, The Gambia (MRCG) malaria labs, where malaria parasite infection and parasitaemia were determined by light microscopy and flow cytometry following Giemsa and SYBR-Green staining, respectively. Blood samples with at least 0.5% parasitaemia were selected for in vitro drug susceptibility testing. Laboratory strains of P. falciparum, 3D7 and Dd2, are routinely maintained in the MRC malaria culture lab. The strains were originally obtained from the Malaria Research and Reference Reagent Resource (MR4) Center.10 Ethical clearance for the study was obtained from the Joint Gambian Government/Medical Research Council Unit, The Gambia Ethics Committee (Project ID/ethics ref: 26260). This study was performed in compliance with the Declaration of Helsinki. A written, informed consent was provided by study participants for the analysis of their samples following ethical approvals from the relevant institutional review boards.
In vitro Drug Inhibition (IC50) Assay
Routine cultures of P. falciparum, 3D7 and Dd2, were carried out in RPMI 1640 medium (Gibco BRL, United Kingdom) supplemented with 15% (vol/vol) normal human serum, 25 mM bicarbonate, 2 mM glutamine, 25 mM HEPES buffer, and 3.6 nM para-aminobenzoic acid. Mixtures of these strains were simulated in vitro by mixing 3D7 and Dd2 strains in various ratios (100:0, 75:25, 50:50, 25:75, and 0:100), creating heterogeneous parasite populations in a 96-well format. For field isolates, whole blood was first processed by removing serum after filtration and then separating white blood cells from infected RBCs (iRBCs) following gradient centrifugation on Histopaque as described by Mbye et al11 iRBCs were washed three times in incomplete RPMI and re-suspended in growth medium. The parasitaemia was checked after SYBR-Green staining and 20 min incubation, using BD LSRFortessa flow cytometer. Isolates with up to 0.5–1% parasitaemia on arrival day were used for the drug survival assay, while those higher were diluted to 1% using uninfected type O-positive (O+) heterologous RBCs (uRBCs) to form 4% haematocrit (HCT) suspension. The isolates were introduced into 96-well plates containing serial dilutions of each drug to form a final 2% HCT. Drug assay plates were incubated in a culture chamber at 37°C with a gas mixture (90% N2, 5% CO2, and 5% O2) for 48 h. Parasite growth was determined following SYBR-Green staining and fluorimetry measures on the Fluoroscan using the green channel at (Ex/Em: 485/538 nm).
Malaria Drug Survival Assay (mDSA)
The therapeutic doses of the antimalarials are usually approximately ˜700 nM for DHA after 2 h, ˜500 nM for PPQ after 6 h, ˜300 nM for LUM after 6 h, and >800 nM for CQ after 2 h.12–16 We therefore exposed the parasites to doses that are clinically subtherapeutic but are 10x IC50 of each drug.
The survival of parasites following sub-therapeutic exposure to conventional antimalarials was determined from post-exposure growth rates and parasite reinvasion after drug removal. The drugs tested included chloroquine (CQ), piperaquine (PPQ), lumefantrine (LUM) and dihydroartemisinin (DHA). Exposure concentrations were: CQ – 200 nM; PPQ – 200 nM, DHA – 24 nM, and LUM – 200 nM, as previously described by Mbye et al.11 To determine the effect of mixed infections, mixtures at 0.5% of 3D7 and Dd2 at 100:0, 75:25, 50:50, 25:75, and 0:100 ratios were also exposed to CQ, DHA, and LUM. The mDSAs were set up using laboratory isolates of >80% rings (in vitro) and field isolates that arrived in the lab the same day from the field after sample collection (ex vivo). The assays were performed in 96-well plates with 100 µL working solution of each drug in triplicates. This was followed by the addition of 100 µL of iRBC suspension (4% HCT) to each well to obtain a final haematocrit of 2% and a parasitaemia of 0.5%. Each assay well was gently mixed and incubated at 37°C under 5% O2, 5% CO2, and 90% N2 gaseous conditions for 48 h. After 48 h time point, the drugs were removed by three washes in incomplete RPMI. The parasites were then cultured further for 48 hours, during which the overall parasitaemia was determined on the 3rd and 4th days by flow cytometry.
For the post-drug exposure reinvasion assay, uRBCs were first stained with cell trace far red (CTFR) as follows: a 1μM solution of CTFR was made by adding 20 μL DMSO to each vial of CTFR, which was then made up into 20 mL of incomplete RPMI. uRBCs were added to this solution to form 2% HCT suspension and incubated at 37°C for 2 hours with shaking. The uRBCs were washed three times, re-suspended with incomplete RPMI, and re-incubated for a further 30 min. Suspensions of CTFR-labelled uRBC (uRBC-CTFR) were reconstituted with the growth medium to achieve a final haematocrit of 2%. To allow reinvasion of uRBCs by parasites after exposure and drug removal, two volumes of uRBC-CTFR were added to one volume of the drug-exposed iRBCs (2:1) and incubated for 48 hours. Aliquots were taken for parasitaemia check after 24 and 48 h, respectively. The aliquots were stained with SYBR-Green as described above and 100,000 RBCs acquired by cytometer, gated for forward and side scatter, red and green channels described in Mbye et al.11
Statistical Analysis
A non-linear regression was done on the percentage inhibition against a range of drug concentrations using the IVART online software to determine the IC50. The IC50s in the different isolate mixtures were compared using the One-way ANOVA. The results were presented as Mean ± SEM from triplicate of the isolates investigated. To calculate the changes in drug response due to the proportions of the mixed infections between the CQ-resistant Dd2 strain and the sensitive 3D7 strain, we used the formula below:


Linear regression was performed on the reinvasion curves to determine their slopes, which were compared at 95% confidence interval. The survival rate was calculated 24 and 48 h after drug removal, that is, at 72-h and 96-h time points in culture, respectively. The calculation was done as follows:

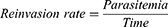
Note: Reinvasion rate = slope of the reinvasion curve (the reinvasion at the two time points – 72 and 96 h after the introduction of uninfected erythrocytes).
Results
Effect of Mixed Infection on Drug Response
Mixed Infection in Lab Isolates
The IC50 of P. falciparum 3D7 to CQ was 13.03 nM (10.80–15.33 nM) in the absence of the Dd2 strain, which had an IC50 of 214.03 nM (152.46–307.87). The IC50 shifted to higher values as Dd2 fraction in the mixture with 3D7 increased (Figure 1A). This change in IC50s was not linear (not proportional) against the fraction of the iRBCs represented by the resistant strains (Table 1). Sensitivity to CQ decreased exponentially with an increase in the fraction of the resistant strain, depicted by the increase in IC50 (Figure 1B). At equal proportion, the increase in IC50 was at least 4 times the base IC50 for the sensitive 3D7 isolate. While 25% of Pf3D7 causes only a 42.30% increase in response (Figure 1C), 25% of PfDd2 causes a decrease in response by 84.09% (Figure 1D) (Slope = 319.00 vs 14.16) (Figure 1).
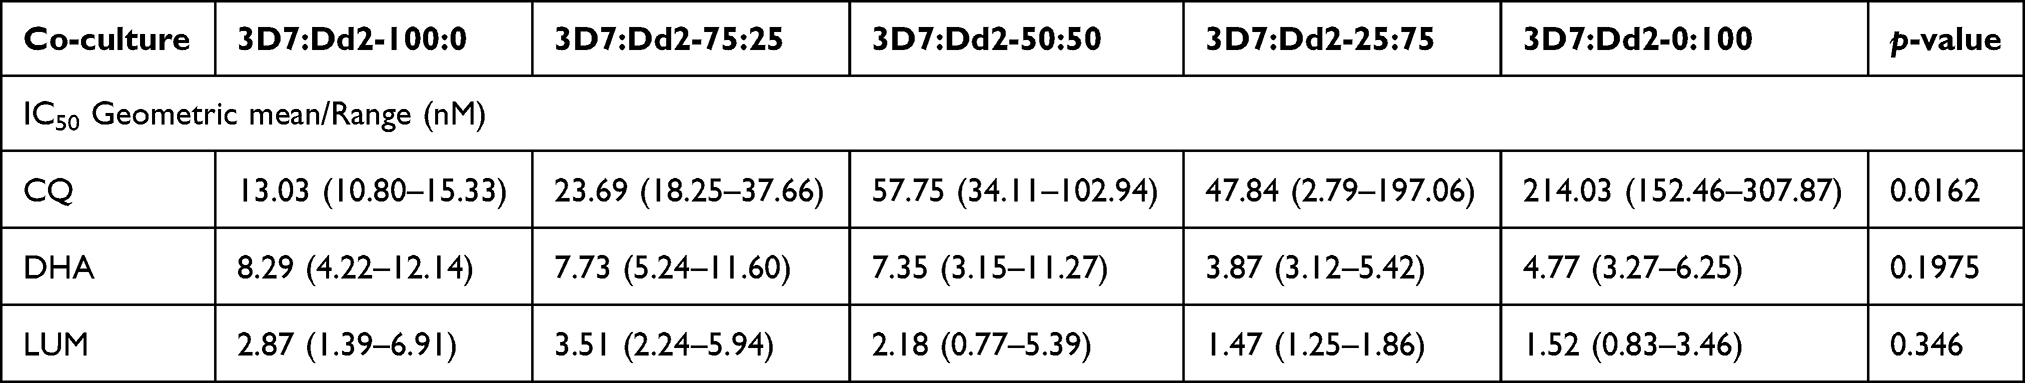 |
Table 1 IC50 of Mixed Cultures |
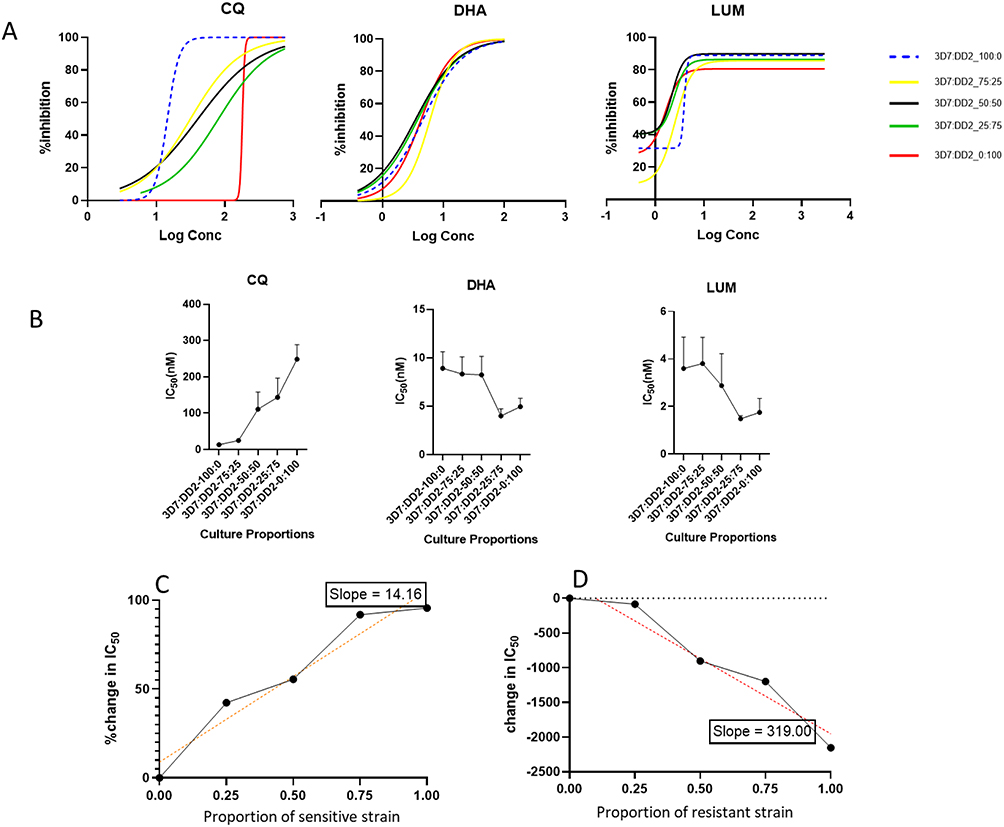 |
Figure 1 Drug response curves from mixtures of drug-resistant and -sensitive parasites (A) showing the shift in the response (IC50) to drugs based on the mixture of CQ-sensitive strain, 3D7 and CQ-resistant strain, Dd2 at varying proportions of 3D7:Dd2 (100:0, 75:25, 50:50, 25:75 and 0:100 respectively), Response under mixed infection (B) showing the response (IC50) to drugs based on the mixture of CQ-sensitive and resistant strains, and Percentage change in response to CQ due to the sensitive strain, 3D7 (C) and due to the resistance strain, Dd2 (D). The slopes of the plots (14.16 vs 319.00) show the extent to which a change in the proportion of the strains affects drug response. |
In one of our studies, we demonstrated that the presence of mutations in the Pfcrt gene (CVMNK and CVIET) can modulate the response to other drugs like DHA.17 More so, Dd2 is associated with MDR1, which affects response to DHA, and all quinolines.
We also investigated the impact of different proportions of Dd2 and 3D7 mixtures on in vitro responses to DHA and LUM. Contrary to responses to CQ, an increase in the Dd2 cellular fraction of the assays changed the IC50s of DHA to lower values, with the response of the 3D7-only assay being twice as higher, geometric mean of 8.29 nM (4.22–12.14 nM) compared to that of the Dd2-only assay 4.77 nM (3.27–6.25n M), although this change was not significant (Table 1). There was a trend towards increased sensitivity with more Dd2 in the cell mixture (Figure 1B). This trend towards increased sensitivity with Dd2, was similar for LUM, with the Dd2-only fraction having a lower, but not significantly different IC50.
Mixed Infection in the Field Isolates
We looked at the presence of mixed infections in some of the Plasmodium field isolates studied using the McCOIL tool. The genomic analysis showed that two of the field isolates (EF_79 and EF_89) are polyclonal (COI = 2) at the Pfcrt locus and one at Pfdhps, indicating mixed infection (Table 2). The majority of the field isolates were monoclonal. All other infections had a single haplotype across all drug resistance loci (Table 2).
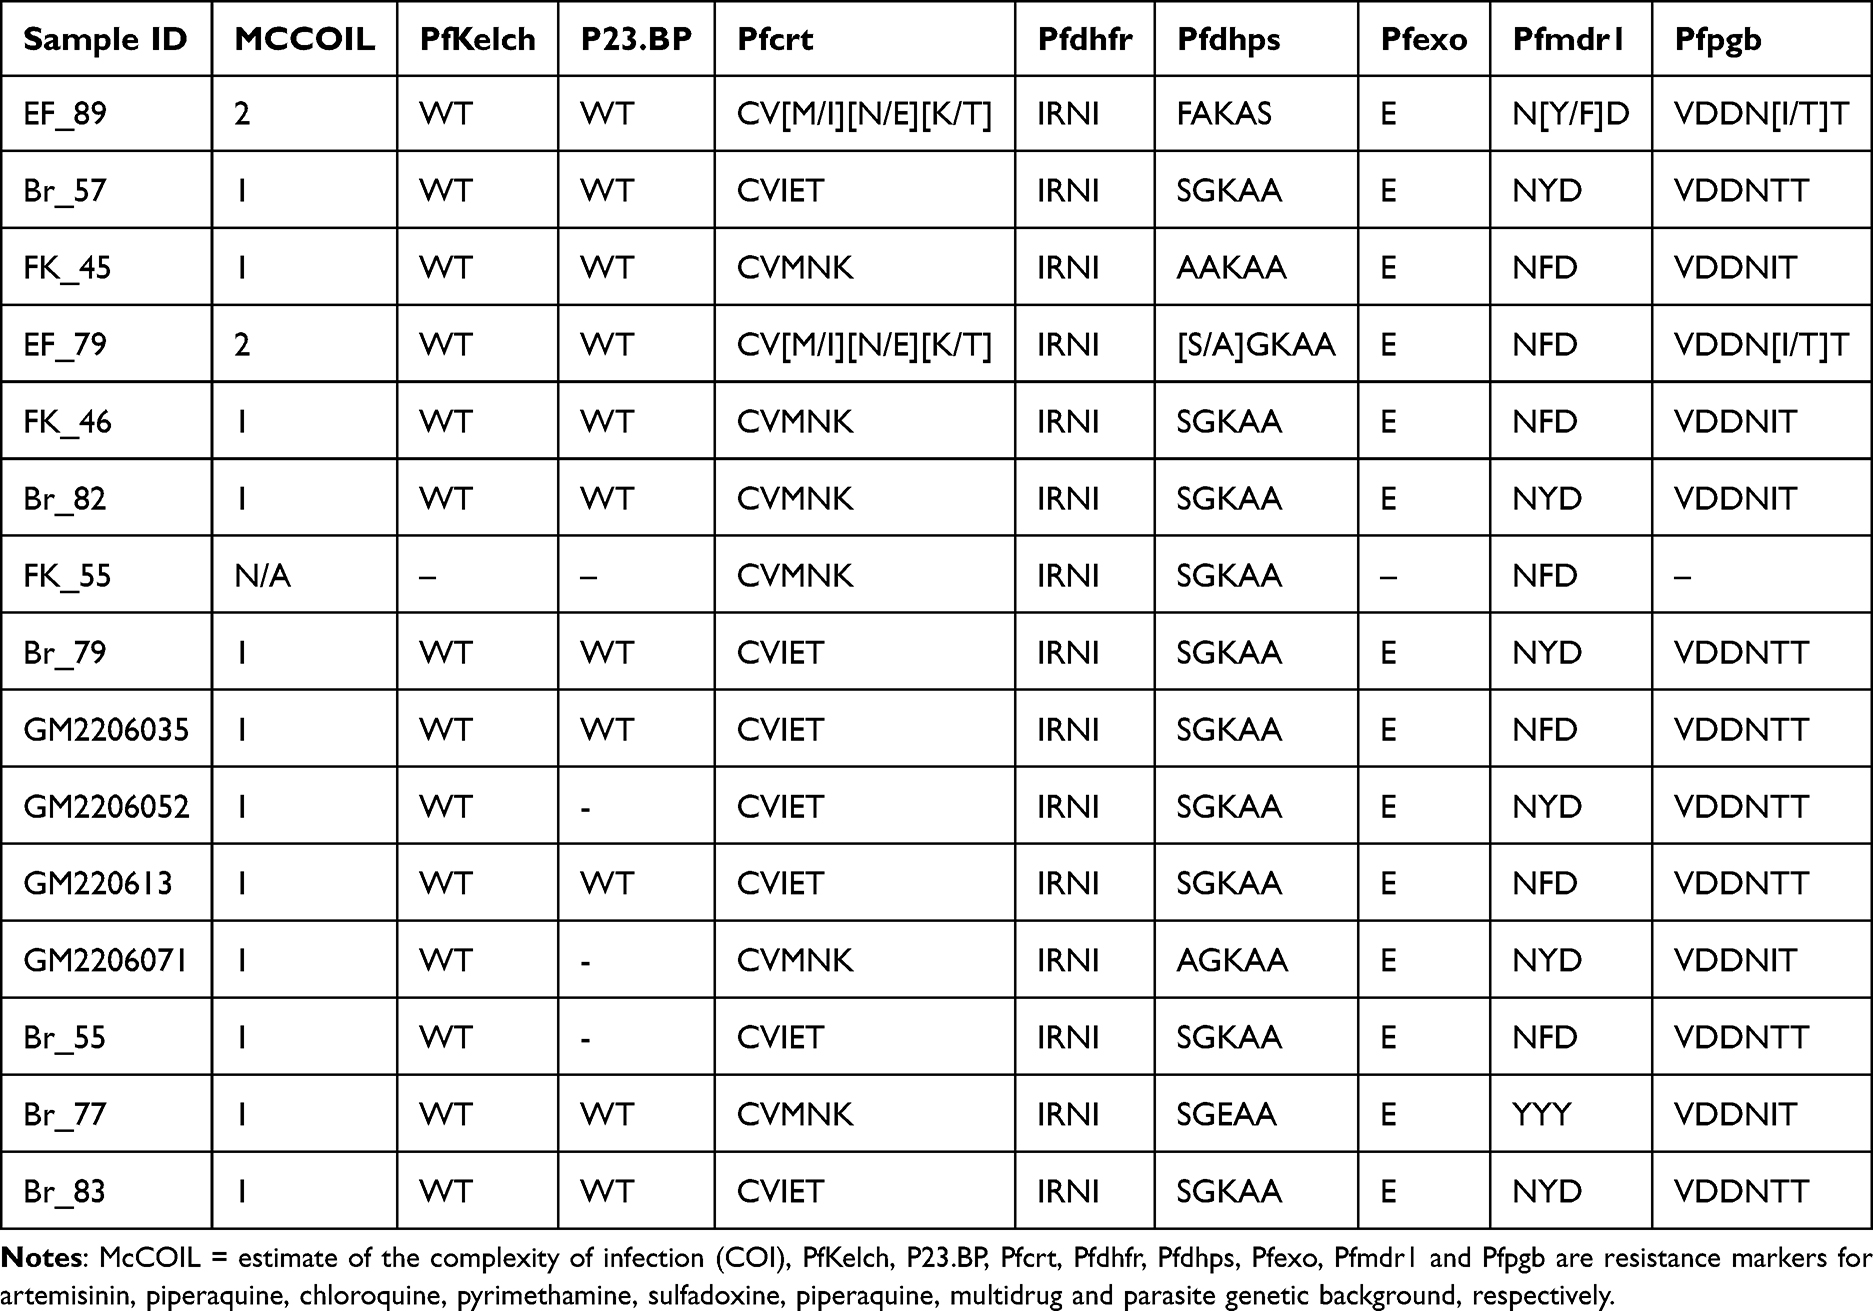 |
Table 2 Genetic Complexity of the Field Isolates |
Effect of Subtherapeutic Exposure to Drug Response
Drug Survival of Lab Isolates
Following 48 hours of exposure to antimalarial drugs, both P. falciparum 3D7 and Dd2 strains were inhibited, down to about 25% survival within 24 hours of drug withdrawal for CQ and DHA (Figure 2A and B). Survival against LUM was lower than 20% for all proportions of both isolates at 24 h post-drug withdrawal (Figure 2C). At 48 hours post-drug withdrawal (96 hours from start of assay, equivalent to two cycles of in vitro growth), both 3D7 and Dd2 were completely inhibited by DHA and LUM. For CQ, parasite revival or survival was observed for all assays where the cell mixture included the resistant Dd2 strain, with the 3D7-only assay inhibited completely by 48 h post-drug withdrawal.
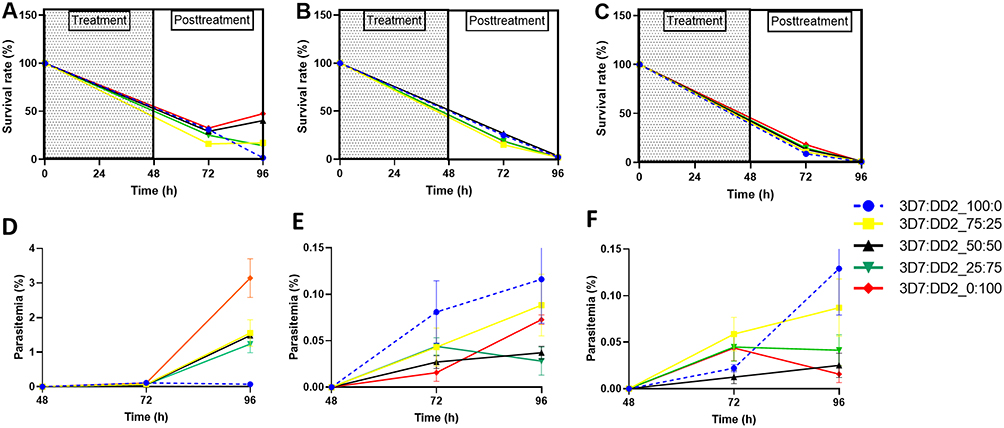 |
Figure 2 Survival under exposure of (A) CQ-200 nM (B) DHA-24 nM and (C) LUM-200 nM, and Reinvasion in mixed infection after exposure to (D) CQ (E) DHA, and (F) LUM. The data represent the mean ± SEM of triplicates from three independent experiments. |
We monitored the rate of reinvasion of uninfected RBCs by lab strains after drug removal, as a surrogate for viability. For CQ, reinvasion parasitaemia was significantly higher in assays that included the resistant Dd2 strain, achieving parasitaemia of 1–2.5% as against complete inhibition for the sensitive 3D7 strain (Figure 2D). In mixed strain assays, a higher proportion of the resistant strain is correlated with higher re-invasion rates as depicted by an increasing slope (100:0 < 0:100 = 0.001521 < 0.06289) (Figure 2D). The final parasitaemia of assays with the resistant strains were significantly non-zero (p < 0.05). Higher viability and re-invasion post-drug exposure were most evident for CQ. Both 3D7 and Dd2 strains were strongly affected by DHA and LUM exposure, with re-invasion parasitaemia of less than 0.2%. At these low levels of viability, the pattern of re-invasion did not correlate with the mixture proportions of strains (Figure 2E and F).
Drug Survival of Field Isolates
We first determined the IC50 of field isolates of four conventional antimalarial drugs (LUM, PPQ, CQ, and DHA) (Table 3). For isolates that carried the CVMNK wildtype haplotype for Pfcrt, the IC50 values against CQ were low. Isolates with the CVIET-resistant haplotype had higher values, while multiclonal isolates with both genotypes had intermediate IC50s. Most isolates were sensitive to LUM, PPQ, and DHA based on the currently accepted cut-off for resistance, except a few outliers.
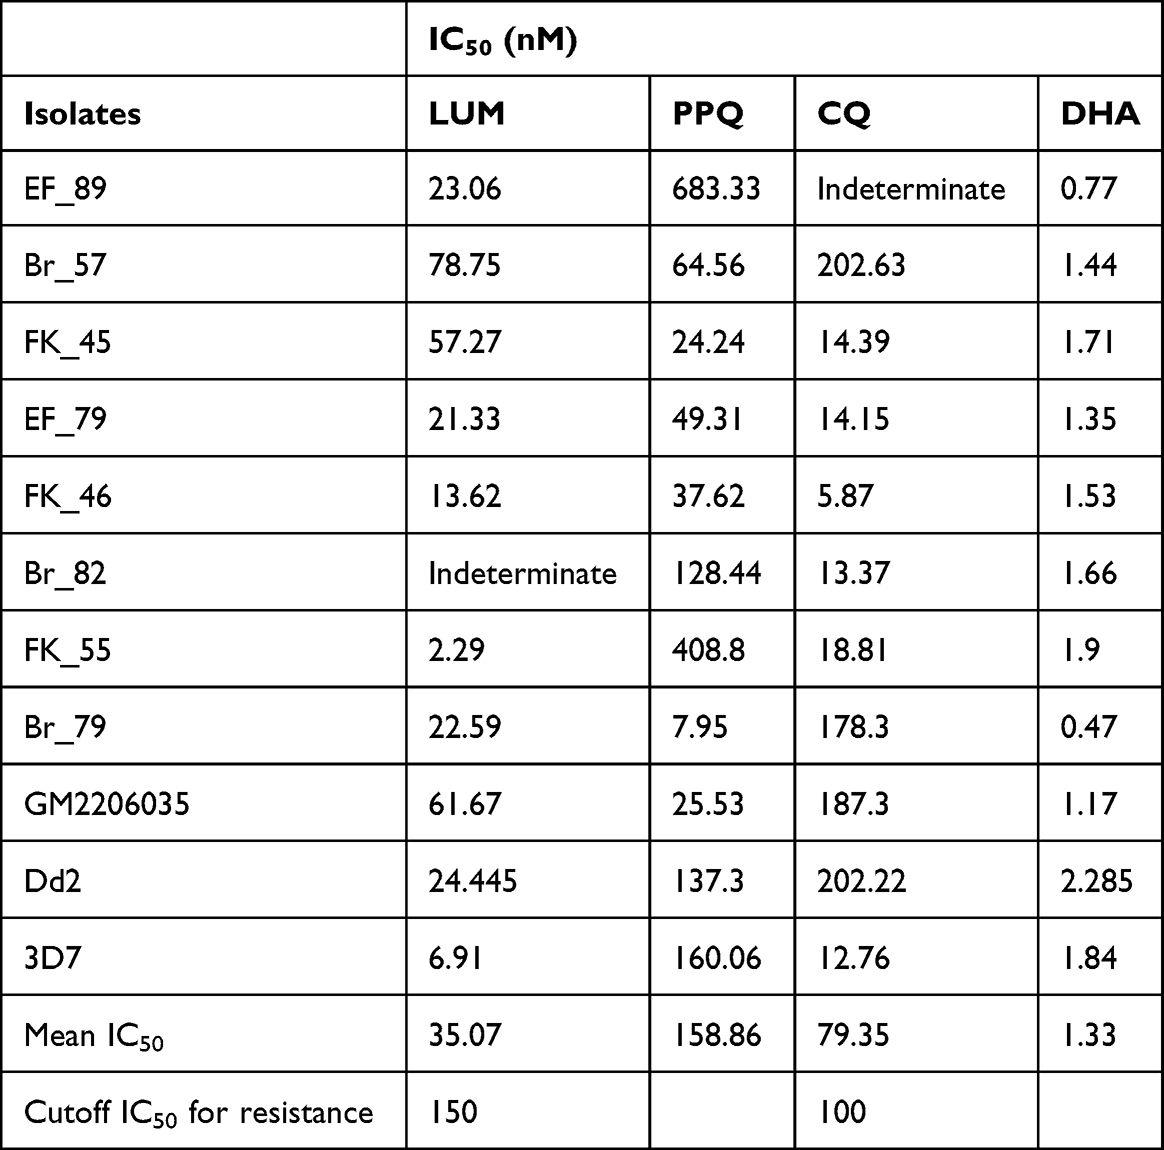 |
Table 3 IC50 of Field Plasmodium Falciparum Isolates from the Gambia |
Following exposure to sub-therapeutic drug doses of CQ, PPQ, DHA, and LUM, respectively, the growth of most isolates was inhibited as depicted by a reduction in survival between time points 0 and 72 (Figure 3A–C). At 96 h, 10 (ten) isolates had over 50% viability following exposure to CQ, 3 (three) to PPQ, 1 (one) to LUM, and 9 (nine) to DHA.
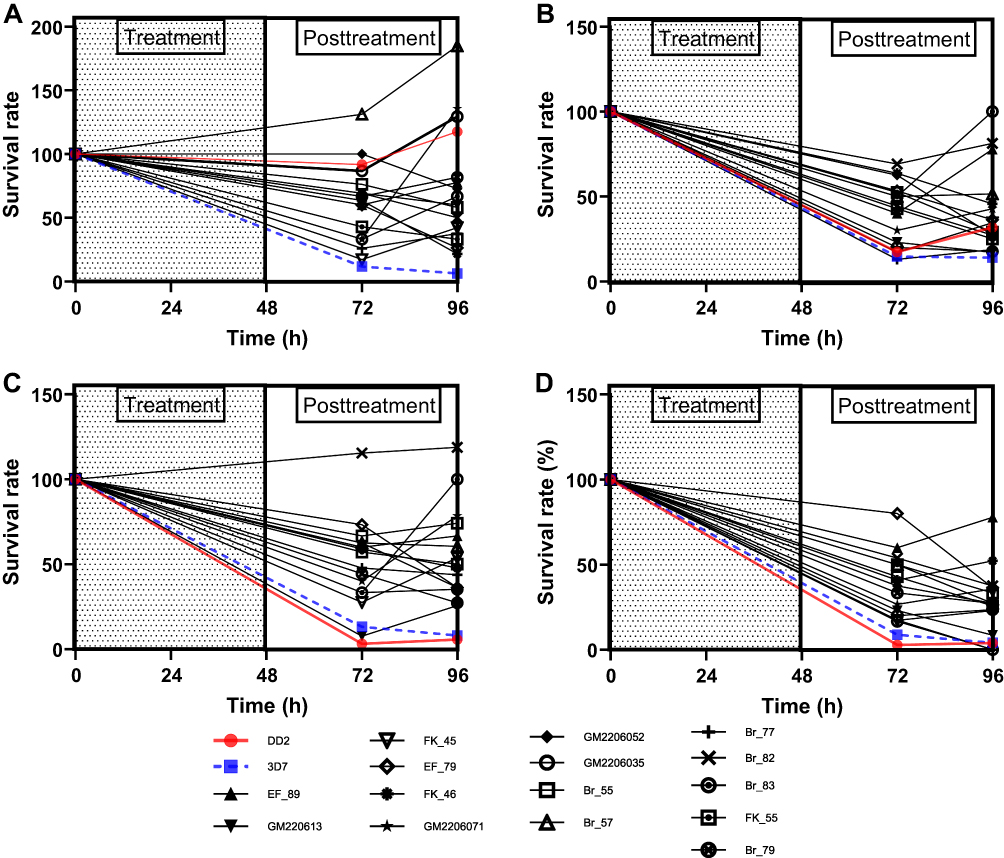 |
Figure 3 Survival rates of field and lab (Dd2 & 3D7) isolates after exposure to (A) Chloroquine (B) Piperaquine (C) Dihydroartemisinin and (D) Lumefantrine. |
For CQ, except for 3D7, almost all the field isolates and Dd2 recrudesced 24 h (time point 72 −96 h) after drug removal, as shown by the increased survival rate of the isolates (Figure 3A). The isolates recrudesce after 24 h of piperaquine (PPQ) removal (Figure 3B). However, some isolates showed persistent growth despite drug exposure as exemplified by isolates Br_57 and Br_82 against CQ and DHA, respectively (Figure 3A and C). Isolate BR_57 was tolerant to CQ, with a high IC50 (202.63 nM) (Table 3), and Pfcrt CVIET haplotype. Isolate BR_82, which had high IC50 values to PPQ and LUM, rebounded to growth at 96 h against PPQ and DHA. The two lab isolates (Dd2 and 3D7) were completely responsive to DHA as shown by a consistent decline in survival rate down to zero (Figure 3C). It was worrisome to observe that after 24 h of drug removal, the majority of the field isolates had increases in survival rates (time point 72–96 h), a characteristic not revealed by the IC50 assay. Isolates like Br_82 showed no response at all to DHA. For lumefantrine (LUM), the lab isolates showed high sensitivity. For the field isolates, after 24 h of drug removal, some of the isolates recrudesced (Figure 3D).
A composite comparison was performed on the field isolates for CQ, PPQ, DHA, and LUM, respectively (Figure 4A–D). A composite comparison of the field isolates (to normalize the individual effects of each field isolate) to the lab isolates showed that the field isolates are marginally more responsive than Dd2 to CQ, with a survival rate less than that of Dd2 (slope = 0.00 vs −0.004135, p < 0.05) (Figure 4A). However, 3D7 was more responsive than the field isolates to CQ (Slope = 0.00 vs 0.09578, p < 0.05) (Figure 4A). For PPQ, the survival was higher in the field isolates than in the lab counterparts (Dd2 and 3D7, 0.00 vs 0.007167 and 0.00 vs 0.02208, respectively) as shown by the higher relative survival rate in Figure 4B. In the case of DHA, comparing the field isolates to the lab isolates showed that the field isolates are less responsive to DHA in comparison to Dd2 and 3D7, respectively (0.00 vs 0.1223 and 0.00 vs 0.05865) (Figure 4C). And lastly for LUM, comparing the field isolates to the lab isolates showed that the field isolates are less responsive than Dd2 and 3D7, respectively (0.00 vs 0.09193 and 0.00 vs 0.06076) (Figure 4D).
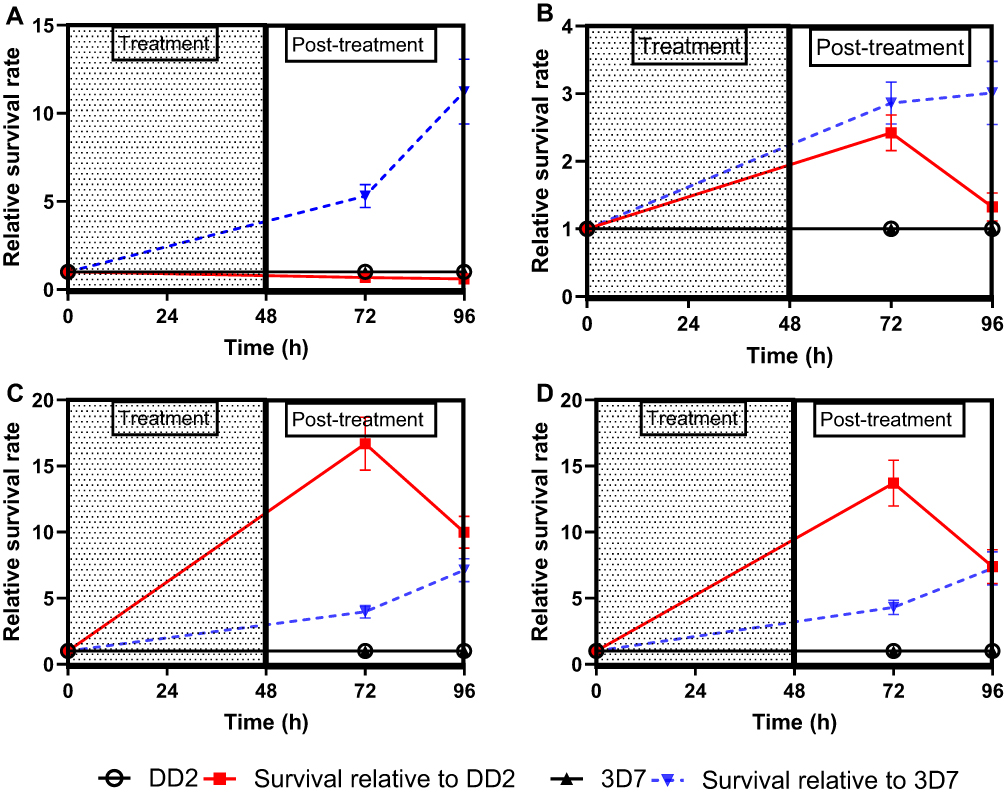 |
Figure 4 Composite survival rate of field isolates relative to lab isolates (Dd2 or 3D7) after exposure to (A) Chloroquine (B) Piperaquine (C) Dihydroartemisinin and (D) Lumefantrine. The data shown here are presented as Mean ± SEM of triplicates of 15 field isolates. The relative survival rate = survival rate of field isolates divided by the survival rate of control lab isolates (Dd2 or 3D7). This plot compares the survival of the Gambian field isolates relative to the lab isolates, 3D7 or Dd2. |
Reinvasion in the Field Isolates
The reinvasion of the parasites was monitored in the uRBC-CTFR introduced at 48 h time point by measuring the parasitemia at 72 h and 96 h time points, respectively, after CQ, PPQ, no- drug (steady state), DHA, and LUM exposure (Figure 5A–E). The slopes of the curves show the degree of invasion. The slope is directly proportional to the rate of reinvasion.
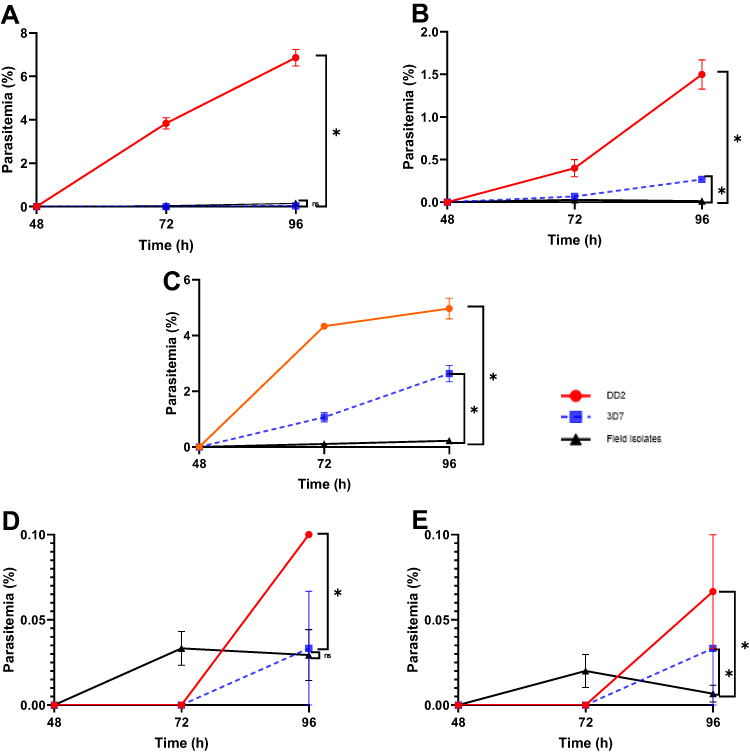 |
Figure 5 Reinvasion rate in field isolate (A) After CQ exposure (B) After PPQ exposure (C) Under steady state (D) After DHA exposure and (E) After LUM exposure. The data represent the Mean ± SEM of triplicates of each isolate. The slope of each graph was calculated after linear regression as %/h, which represents the rate of reinvasion after drug removal and the level of significance at <0.05% calculated using t-test. * = p value < 0.05. Abbreviations: DHA, dihydroartemisinin; LUM, lumefantrine; PPQ, piperaquine; CQ, chloroquine; IC50, 5-% inhibitory concentration; sSA, sub Saharan Africa and mDSA, malaria drug survival assay. |
Upon CQ exposure and removal, the reinvasion was significantly higher in Dd2 than in the field isolates (p < 0.0001), with invasion rates of 0.1431 vs 0.003194%/h. Even though there was no significant difference observed between 3D7 and the field isolates, the rate of invasion of the field isolates was 4 times that of 3D7 (invasion rates 3D7 vs field isolate = 0.000694 vs 0.003194%/h) (Figure 5A).
Field isolates treated with PPQ showed lesser reinvasion than lab isolates (p < 0.0001), where the slopes were 0.03125, 0.005556, and 0.000264%/h for Dd2, 3D7, and field isolates, respectively (Figure 5B).
Under steady state (no drug exposure), the composite field isolates have lower invasion rates than the lab isolates (Figure 5C). In comparison with Dd2, the reinvasion in the field isolate was lower (p < 0.0001) (invasion rate field isolate vs Dd2 = 0.004583 vs 0.1035%/h), while comparing with 3D7, the slope was 0.004583 vs 0.05486%/h (p < 0.0001).
After DHA exposure, the reinvasion was marginally higher in Dd2 than in the field isolates (p < 0.0482) (invasion rate Dd2 vs field isolate = 0.00208 vs 0.000611) while there was no significant difference between 3D7 and the field isolates (p < 0.9105) (invasion rate 3D7 vs field isolate = 0.000694 vs 0.000611) (Figure 5D).
After LUM exposure, the reinvasion was higher in Dd2 than in the field isolates (p = 0.0166) where the invasion rate of Dd2 vs field isolate was 0.001389 vs 0.000139%/h. But in comparison with 3D7, no significant difference was observed (p = 0.2627)- invasion rate (3D7 vs field isolate = 0.000694 vs 0.000139%/h) (Figure 5E).
Discussion
Mixed Infection
In areas of high transmission, individuals are typically infected with multiple P. falciparum genotypes. We therefore investigated the impact of mixed infection on drug response while looking for its presence in field isolates. From the lab isolates, we demonstrated that mixed infection shifts the drug response, and the resistant strain is the major driver of drug response in a mixed population of malaria parasites. This corroborates the findings of Liu et al and Co et al.18,19 Each genotype may have a different growth rate when cultivated, where the most fit strain outgrows others.20 While there was a reduction in CQ response with increasing level of the resistant strain, the reverse was observed for DHA and LUM. Conventionally, the PfDd2 strain is associated with increased pfmdr1 copy numbers, which can reduce the antimalarial drug response. However, there have been reports of inverse response to DHA and LUM.21
We looked for the presence of mixed infection (complexity) in Gambian field isolates using the McCOIL tool. McCOIL is a robust tool for understanding the complexity of infections across transmission settings.22 We detected multiple clones in two isolates, EF_79 and EF_89, each carrying the two Pfcrt haplotypes – CVIET and CVMNK. In one of our studies, we demonstrated that the presence of mutations in the Pfcrt gene (CVMNK and CVIET) can modulate the response to other drugs.17 During mosquito’ bites, parasites with multiple haplotypes (complex genotype), including those that are resistant are transmitted to people, causing multiclonal or polyclonal infection.7,8 These multiclonal infections can lead to variable sensitivities to drugs determined by the genetic background of the infecting clones. The frequency of mixed infection in endemic regions ranges from 30% to 60% and this is often associated with an increase in malaria severity.23,24 This underscores the importance of regularly monitoring the presence of mixed infections and their impact on drug response. Even though we detected mixed infection in the Gambian isolates, the overall IC50 of the isolates, which were generally below the resistance cut-off means that the proportion of the resistant types is still low. However, IC50s are not accurate enough to detect failure in some cases as our findings showed recrudescence of the field isolates after CQ treatment, underscoring the importance of our mDSA. More so, the presence of polyclonal infections with a background resistant haplotype drives drug response. This may explain the continued failure of CQ in malaria treatment in the Gambia.25
Subtherapeutic Drug Exposure
In this work, we used drug concentrations that are 10-fold higher than the median IC50 of the respective drugs obtained from the assessment of field isolates from western Gambia in 2015.25 We chose these 10-fold, which are sub-therapeutic, to mimic what happens in real life where patients are exposed to suboptimal doses of drugs intentionally or unintentionally through practices like the use of counterfeit drugs, incompletion of drug treatment, and other sharp practices common in Africa.26,27 The mDSA measured the survival rate after drug exposure for 48 h and the re-invasion rate (slope) after drug removal. The assay measured the ability of the parasite to survive after a complete cycle (48 h) of drug exposure and the recrudescence of the parasite after drug removal. This assay quantified the viability of the parasites from a direct count of the viable merozoites that emerge from drug-exposed schizonts and invade pre-stained uninfected RBCs by flow cytometry.
Our mDSA showed the Gambian field isolates are less responsive to CQ, with a survival rate and reinvasion higher than the 3D7 control. This finding corroborates the higher IC50 of the Gambian field isolates, which is >100 nM (cutoff for CQ resistance) when compared to 3D7. Unlike other regions in West Africa, even after the withdrawal of CQ in malaria treatment, Mbye et al reported that about 80% of the Gambian isolates still show selection for CQ, carrying Pfcrt haplotypes. This could explain the high IC50 of some Gambian isolates for CQ.11
In the mDSA, response to PPQ was also low. Even though PPQ is not a commonly used antimalarial in sSA, it is important to watch out for the development of resistance to this partner drug for DHA. Mutations to the Pfmdr1 and Pfcrt, which may be conferred by the use of other partner drugs, can lead to reduced sensitivity to PPQ.28,29
LUM showed failure as the field isolates recrudesced after drug withdrawal. In our current study, even though the IC50s (except for one isolate) were generally below the resistance cutoff point (<150 nM), the recrudescence of LUM is in tandem with our earlier report for LUM tolerance in The Gambia between 2012 and 2015.25 ACT resistance emerges on a backbone of known genes, conferring drug resistance, Pfmdr1 and Pfcrt, which could be selected by LUM treatment.
Our finding showed that sublethal exposure of the parasites to the conventional antimalarials leads to recrudescence, giving room for reinvasion.30 The reinvasion of new RBCs by the parasite merozoite is affected by human, environmental, and parasite factors.23 This is a common scenario where some people undermine the recommended dosing of antimalarials, exposing the parasites to sublethal doses with eventual treatment failure.
Study Limitations
We used only lab isolates with known resistance polymorphism to chloroquine only. In future studies, we will use other haplotypes with known resistance to other conventional antimalarials, for instance, DHA, PPQ, and LUM.
Conclusion
Our findings show that there is high reinvasion after subtherapeutic exposure to conventional antimalarial drugs. This trend may be driven by uncharacterized tresistant genetic mechanisms circulating alongside the wild types of Plasmodium falciparum. It becomes imperative to continually monitor the presence of mixed infection to act fast in the policy framework of malaria control. The outcome of this work should be factored in therapeutic efficacy studies to mitigate the impact of minority resistant strains of the parasites. More so, it is important to minimize the subtherapeutic exposure of parasites to drugs via practices such as incomplete drug regimens, use of counterfeits with low active ingredients, and other human activities that increase the risk of low drug exposure.
Acknowledgments
We wish to thank the Wellcome Trust (ISSF3) and African Research Excellence Fund (AREF) for the training fellowship support through which COE was supported.
Disclosure
The authors report no conflicts of interest in this work.
References
1. WHO. Artemisinin resistance and artemisinin-based combination therapy efficacy (Status report -- August 2018); 2018. Available from: https://apps.who.int/iris/bitstream/handle/10665/274362/WHO-CDS-GMP-2018.18-eng.pdf?ua=1.
2. Grandesso F, Hagerman A, Kamara S, et al. Low efficacy of the combination artesunate plus amodiaquine for uncomplicated falciparum malaria among children under 5 years in Kailahun, Sierra Leone. Trop Med Int Health. 2006;11:1017–13. doi:10.1111/j.1365-3156.2006.01655.x
3. Kamau E, et al. K13-propeller polymorphisms in Plasmodium falciparum parasites from sub-Saharan Africa. J Infect Dis. 2014:1–4. doi:10.1093/infdis/jiu608
4. Uwimana A, Legrand E, Stokes BH, et al. Emergence and clonal expansion of in vitro artemisinin-resistant Plasmodium falciparum kelch13 R561H mutant parasites in Rwanda. Nat Med. 2020;26:1602–1608. doi:10.1038/s41591-020-1005-2
5. Hyde JE. Drug-resistant malaria - An insight. FEBS J. 2007;274:4688–4698. doi:10.1111/j.1742-4658.2007.05999.x
6. Conrad MD, Rosenthal PJ. Antimalarial drug resistance in Africa: the calm before the storm? Lancet Infect Dis. 2019;19:e338–e351. doi:10.1016/S1473-3099(19)30261-0
7. Mayxay M, Pukrittayakamee S, Newton PN, White NJ. Mixed-species malaria infections in humans. Trends Parasitol. 2004;20:233–240. doi:10.1016/j.pt.2004.03.006
8. Goodwin J, et al. Persistent and multiclonal malaria parasite dynamics despite extended artemether-lumefantrine treatment in children. Nat Commun. 2024;151(15):1–13.
9. Nkhoma SC, Ahmed AOA, Zaman S, et al. Dissection of haplotype-specific drug response phenotypes in multiclonal malaria isolates. Int J Parasitol Drugs Drug Resist. 2021;15:152–161. doi:10.1016/j.ijpddr.2021.03.001
10. Wu Y, Fairfield AS, Oduola A, Cypess RH; MR4 Scientific Advisory Committee. The Malaria Research and Reference Reagent Resource (MR4) Center–creating African opportunities - PubMed. Afr J Med Med Sci. 2001;30:52–54.
11. Mbye H, Bojang F, Jawara AS, et al. Tolerance of Gambian plasmodium falciparum to dihydroartemisinin and lumefantrine detected by ex vivo parasite survival rate assay. Antimicrob Agents Chemother. 2020;65. doi:10.1128/AAC.00720-20
12. Khanh NX, de Vries PJ, Ha LD, et al. Declining concentrations of dihydroartemisinin in plasma during 5-day oral treatment with artesunate for Falciparum Malaria. Antimicrob Agents Chemother. 1999;43:690. doi:10.1128/AAC.43.3.690
13. Ali S, Najmi MH, Tarning J, Lindegardh N. Pharmacokinetics of artemether and dihydroartemisinin in healthy Pakistani male volunteers treated with artemether-lumefantrine. Malar J. 2010;9:1–7. doi:10.1186/1475-2875-9-275
14. Blessborn D, Kaewkhao N, Tarning J. A high-throughput LC-MS/MS assay for piperaquine from dried blood spots: improving malaria treatment in resource-limited settings. J Mass Spectrom Adv Clin Lab. 2024;31:19–26. doi:10.1016/j.jmsacl.2023.12.004
15. Walker O, Dawodu A, Adeyokunnu A, Salako L, Alvan G. Plasma chloroquine and desethylchloroquine concentrations in children during and after chloroquine treatment for malaria. Br J Clin Pharmacol. 1983;16:701. doi:10.1111/j.1365-2125.1983.tb02244.x
16. Kilonzi M, Minzi O, Mutagonda R, et al. Usefulness of day 7 lumefantrine plasma concentration as a predictor of malaria treatment outcome in under-fives children treated with artemether-lumefantrine in Tanzania. Malar J. 2020;19:1–8. doi:10.1186/s12936-020-3150-y
17. Drammeh NF, Bojang F, Nganyewo NN, et al. Chloroquine resistance transporter drives divergent multilocus drug resistance genetic backgrounds and susceptibility in Gambian Plasmodium falciparum. J Glob Antimicrob Resist. 2026;49:49–56. doi:10.1016/J.JGAR.2026.04.003
18. Co EMA, Dennull RA, Reinbold DD, Waters NC, Johnson JD. Assessment of Malaria in vitro drug combination screening and mixed-strain infections using the Malaria Sybr Green I-based fluorescence assay. Antimicrob Agents Chemother. 2009;53:2557. doi:10.1128/AAC.01370-08
19. Liu S, Mu J, Jiang H, Su XZ. Effects of Plasmodium falciparum mixed infections on in vitro antimalarial drug tests and genotyping. Am J Trop Med Hyg. 2008;79:178. doi:10.4269/ajtmh.2008.79.178
20. Basco LK. Molecular epidemiology of malaria in Cameroon. XX. Experimental studies on various factors of in vitro drug sensitivity assays using fresh isolates of Plasmodium falciparum - PubMed. Am J Trop Med Hyg. 2004;70:474–480. doi:10.4269/ajtmh.2004.70.474
21. Mwai L, Kiara SM, Abdirahman A, et al. In vitro activities of piperaquine, lumefantrine, and dihydroartemisinin in Kenyan Plasmodium falciparum isolates and polymorphisms in pfcrt and pfmdr1. Antimicrob Agents Chemother. 2009;53:5069. doi:10.1128/AAC.00638-09
22. Chang HH, Worby CJ, Yeka A, et al. THE REAL McCOIL: a method for the concurrent estimation of the complexity of infection and SNP allele frequency for malaria parasites. PLoS Comput Biol. 2017;13:e1005348. doi:10.1371/journal.pcbi.1005348
23. Su XZ, Xu F, Stadler RV, Teklemichael AA, Wu J. Malaria: factors affecting disease severity, immune evasion mechanisms, and reversal of immune inhibition to enhance vaccine efficacy. PLOS Pathog. 2025;21:e1012853. doi:10.1371/journal.ppat.1012853
24. Zhu SJ, Hendry JA, Almagro-Garcia J, et al. The origins and relatedness structure of mixed infections vary with local prevalence of P. falciparum malaria. Elife. 2019;8:e40845. doi:10.7554/eLife.40845
25. Amambua-Ngwa A, Okebe J, Mbye H, et al. Sustained ex vivo susceptibility of Plasmodium falciparum to artemisinin derivatives but increasing tolerance to artemisinin combination therapy partner quinolines in The Gambia. Antimicrob Agents Chemother. 2017;61. doi:10.1128/AAC.00759-17
26. Karunamoorthi K. The counterfeit anti-malarial is a crime against humanity: a systematic review of the scientific evidence. Malar J. 2014;13:209. doi:10.1186/1475-2875-13-209
27. Bamikole OJ, Olajide TH, Adedeji BA, et al. Drug use practices and self-treatment for suspected Malaria in Ibadan, Nigeria. Am J Trop Med Hyg. 2023;108:1122. doi:10.4269/ajtmh.22-0489
28. Blasco B, Leroy D, Fidock DA. Antimalarial drug resistance: linking Plasmodium falciparum parasite biology to the clinic. Nature Med. 2017;23:917–928. doi:10.1038/nm.4381
29. Tarama CW, Soré H, Siribié M, et al. Plasmodium falciparum drug resistance-associated mutations in isolates from children living in endemic areas of Burkina Faso. Malar J. 2023;22:1–12. doi:10.1186/s12936-023-04645-9
30. Sisowath C, Ferreira PE, Bustamante LY, et al. The role of pfmdr1 in Plasmodium falciparum tolerance to artemether-lumefantrine in Africa. Trop Med Int Health. 2007;12:736–742. doi:10.1111/j.1365-3156.2007.01843.x
 © 2026 The Author(s). This work is published and licensed by Dove Medical Press Limited. The
full terms of this license are available at https://www.dovepress.com/terms
and incorporate the Creative Commons Attribution
- Non Commercial (unported, 4.0) License.
By accessing the work you hereby accept the Terms. Non-commercial uses of the work are permitted
without any further permission from Dove Medical Press Limited, provided the work is properly
attributed. For permission for commercial use of this work, please see paragraphs 4.2 and 5 of our Terms.
© 2026 The Author(s). This work is published and licensed by Dove Medical Press Limited. The
full terms of this license are available at https://www.dovepress.com/terms
and incorporate the Creative Commons Attribution
- Non Commercial (unported, 4.0) License.
By accessing the work you hereby accept the Terms. Non-commercial uses of the work are permitted
without any further permission from Dove Medical Press Limited, provided the work is properly
attributed. For permission for commercial use of this work, please see paragraphs 4.2 and 5 of our Terms.