Back to Journals » Neuropsychiatric Disease and Treatment » Volume 15
Genetic effects on white matter integrity in drug-naive patients with major depressive disorder: a diffusion tensor imaging study of 17 genetic loci associated with depressive symptoms
Authors Kakeda S, Watanabe K, Katsuki A, Sugimoto K, Ueda I ![]() , Igata N, Kishi T
, Igata N, Kishi T ![]() , Iwata N
, Iwata N ![]() , Abe O
, Abe O ![]() , Yoshimura R
, Yoshimura R ![]() , Korogi Y
, Korogi Y
Received 9 October 2018
Accepted for publication 10 January 2019
Published 29 January 2019 Volume 2019:15 Pages 375—383
DOI https://doi.org/10.2147/NDT.S190268
Checked for plagiarism Yes
Review by Single anonymous peer review
Peer reviewer comments 3
Editor who approved publication: Dr Roger Pinder
Shingo Kakeda,1 Keita Watanabe,1 Asuka Katsuki,2 Koichiro Sugimoto,1 Issei Ueda,1 Natsuki Igata,1 Taro Kishi,3 Nakao Iwata,3 Osamu Abe,4 Reiji Yoshimura,2 Yukunori Korogi1
1Department of Radiology, University of Occupational and Environmental Health, Kitakyushu, Japan; 2Department of Psychiatry, University of Occupational and Environmental Health, Kitakyushu, Japan; 3Department of Psychiatry, Fujita Health University, School of Medicine, Toyoake, Japan; 4Department of Radiology, Graduate School of Medicine, The University of Tokyo, Tokyo, Japan
Background: A genome-wide association study using megadata identified 17 single-nucleotide polymorphisms (SNPs) in candidate genes for major depressive disorder (MDD). These MDD susceptibility polymorphisms may affect white matter (WM) integrity. This study aimed to investigate the relationship between WM alterations and 17 SNPs in candidate genes for MDD in the first depressive episode of drug-naive MDD patients using a tract-based spatial statistics (TBSS) method.
Methods: Thirty-five drug-naive MDD patients with a first depressive episode and 47 age- and sex-matched healthy subjects underwent diffusion tensor imaging scans and genotyping. The genotype–diagnosis interactions related to WM integrity were evaluated using TBSS for the 17 SNPs.
Results: For the anterior thalamic radiation, cingulum, corticospinal tract, inferior fronto-occipital fasciculus, inferior longitudinal fasciculus, superior longitudinal fasciculus, uncinate fasciculus, forceps major, and forceps minor, the genotype effect significantly differed between diagnosis groups (P<0.05, family-wise error corrected) in only one SNP, rs301806, in the arginine–glutamic acid dipeptide (RE) repeats (RERE) gene.
Conclusion: The RERE polymorphism was associated with WM alterations in first-episode and drug-naive MDD patients, which may be at least partially related to the manifestation of MDD. Future studies are needed to explore the gene–environment interactions with regard to individual WM integrity.
Keywords: depressive disorder, single-nucleotide polymorphism, MRI, fractional anisotropy, tract-based spatial statistics, arginine–glutamic acid dipeptide repeats gene
Introduction
White matter (WM) alterations constitute one element of the pathogenesis of major depressive disorder (MDD).1,2 Quantitative measures using diffusion tensor imaging (DTI), including fractional anisotropy (FA) values, are useful markers for WM changes. Recently, tract-based spatial statistics (TBSS) was introduced; TBSS projects FA data on to an average FA tract skeleton before applying voxel-wise cross-subject statistics, which minimizes the effects of misalignment.3 Previous DTI studies using TBSS methods have found alterations, such as reduced FA, in various WM fiber tracts in MDD patients, including the anterior thalamic radiation (ATR),4,5 inferior fronto-occipital fasciculus (IFOF),4,5 uncinate fasciculus (UF),4–6 sagittal stratum,7,8 cingulum,4,7,9 longitudinal fasciculus (LF),4,6,10,11 internal and external capsules,4,7,12 corpus callosum,4,8,10,12 and corona radiata.4,5,7,10–12 These fiber tracts provide important anatomical connectivity or form circuits; therefore, they may be directly relevant to the pathophysiology of MDD.13
Although a meta-analysis of relevant data from primary studies of the genetic epidemiology of major depression has revealed that heritability of MDD is estimated to be 31%–42%,14 extensive heterogeneity and a complex genetic architecture have complicated the efforts to detect associated genetic risk variants. More recently, a genome-wide association study (GWAS) using megadata identified 17 SNPs in candidate genes for MDD.15 Hyde et al presented a complementary approach to collect large-scale genotypic data (75,607 MDD and 231,747 controls), and they identified 17 independent single-nucleotide polymorphisms (SNPs) significantly associated with diagnosis of MDD.15 These SNPs were predicted to be enriched in genes that are expressed in the central nervous system and function in transcriptional regulation related to neurodevelopment.
Several previous magnetic resonance imaging (MRI) studies using TBSS reported a relationship between WM integrity and genetic factors, which included brain-derived neurotrophic factor,16 the serotonin transporter gene SLC6A4,17 the neuronal amino acid transporter gene SLC6A15,18 and methylenetetrahydrofolate reductase/catechol-O-methyltransferase polymorphisms.19 This suggests that WM alterations in MDD patients may be attributable to genetic factors regarding neurodegeneration and brain development. Thus, we hypothesized that these 17 polymorphisms of MDD susceptibility genes and genotype–diagnosis interactions may affect individual WM integrity. To the best of our knowledge, no previous MDD studies have examined neuroimaging changes associated with the 17 SNPs as candidate genes for MDD. Thus, in this study, using TBSS we investigated the relationship between WM alterations and the 17 SNPs as candidate genes for MDD in first depressive episode drug-naive MDD patients.
Materials and methods
Ethics statement
This study was approved by the local ethics committee of the University of Occupational Environmental Health and was conducted in accordance with the Declaration of Helsinki. Written informed consent was obtained from each participant after they were given a detailed description of the study.
Participants
Thirty-five right-handed, drug-naive MDD patients in their first depressive episode were recruited. A psychiatrist (KH, with 7 years of experience in psychiatry), who did not know the serum cortisol level or imaging data for the patients, diagnosed them as having MDD using a structured clinical interview according to the Diagnostic and Statistical Manual of Mental Disorders, 4th Edition, Text Revision (DSM-IV-TR) criteria. The severity of depression was evaluated using the 17-item Hamilton Rating Scale for Depression (HAMD17). Only those with a HAMD17 score ≥14 were eligible for the study. The exclusion criteria included any history of neurological diseases or other physical diseases, or the presence of other disorders (ie, the subjects had no evidence of schizoaffective disorder, bipolar disorder, axis II personality disorders, or mental retardation). The age of the MDD patients ranged from 20 to 67 (mean ± SD 47.1±15.2) years. Eighteen were male and 17 were female.
Thirty-five right-handed, healthy subjects (HS) were recruited via an interview using the structured clinical interview from the DSM-IV-TR. None had a serious medical or neuropsychiatric illness or a family history of major psychiatric illness, and all were matched with the patients in terms of age and sex. The age of the HS ranged from 20 to 65 (mean ± SD 44.1±11.2) years. Twenty-two of the HS were male and 13 were female.
Genotyping
All 70 subjects provided a blood sample. DNA was isolated from peripheral blood mononuclear cells. Genotyping was evaluated by a PCR SNP genotyping system (Life Technologies Japan, Tokyo, Japan). The PCR products were purified enzymatically.
MRI acquisition
All magnetic resonance (MR) examinations were performed using a 3 T MR system (Signa EXCITE 3T; GE Healthcare, Waukesha, WI, USA). Diffusion tensor images were acquired by a single-shot, spin-echo echo-planar sequence (TR/TE=12,000/83.3 ms; 4 mm slice thickness; no gap; field of view=26 cm; number of excitations=1). Diffusion gradients were applied for the three axes simultaneously around the 180-degree pulse (b value=1,000 s/mm2). The diffusion properties were measured in 25 non-collinear directions.
Image processing
The structural distortion of the diffusion-weighted MR images was corrected based on each T2-weighted echo planar image (b=0 s/mm2) using eddy current correction in the Functional MRI of the Brain (FMRIB) Diffusion Toolbox software program (part of the FMRIB Software Library; FSL v5.0.4). Non-brain tissue in each MR image was deleted using the brain extraction tool. The voxel-wise statistical analysis of the DTI data was performed using the TBSS version 1.1 software program. The FA volumes were aligned to a target image as follows: 1) the nonlinear registration of each subject’s FA was applied to the FMRIB58_FA_1 mm standard-space image as the target image; and 2) the target image was affine transformed to 1×1×1 mm MNI 152 (Montreal Neurological Institute, Montreal, Canada) space. A mean FA image was created by averaging the aligned individual FA images and was then thinned to create an FA skeleton representing WM tracts common to all subjects.3 The FA skeleton was thresholded at 0.2 to exclude voxels with low FA values, which are likely to include gray matter or cerebrospinal fluid. Individual FA data were projected on to this FA skeleton. The mean diffusivity (MD), axial diffusivity (AD), and radial diffusivity (RD) were projected on to the mean FA skeleton and also compared between groups.
Statistical analysis
The FA, AD, and RD values were compared between HS and MDD patients using a two-sample t-test. Age and sex were included as covariates of no interest to control for confounding variables. The number of permutations in all voxel-wise analyses was set at 10,000. Values of P<0.05 and >50 voxels indicate a significant difference, and for multiple comparisons at the cluster level, a correlation after family-wise error (FWE) correction was performed with threshold-free cluster enhancement option. The brain region of significant clusters was detected based on the WM tractography atlas of Johns Hopkins University (JHU) and the white matter labels atlas based on International Consortium of Brain Mapping (ICBM)-DTI-81.
The FSL Randomise tool50 was used to perform permutation-based non-parametric inference on the skeletonized FA data at a threshold of 0.2 (TBSS default). The significance level was set at P<0.05 after multiple comparisons correction using threshold-free cluster enhancement,51 an approach that allows the significance of a target voxel to take into account not only the amplitude of the signal (in this case FA) but also the contributions of both the spatial extent and the magnitude of supporting voxels. Age and sex were included as covariates of no interest to control for confounding variables. To assess the main effect of genotype, of diagnostic group, and their interaction on FA, an ANOVA-style design matrix was built with genotype and diagnosis (MDD and HS) as the two independent variables. Mean FA in the largest cluster of each effect was graphically plotted for a visual overview.
The anatomical location of significant clusters was detected using the JHU WM tractography atlas and the ICBM-DTI-81 white matter labels atlas; only clusters with >1% probability were included in the cluster table.
Results
Participants
For the genotyping of 70 subjects (35 MDD and 35 HS), the allele frequencies of 17 SNPs were within the Hardy–Weinberg equilibrium (Table 1). We could not perform direct sequence reads for rs11209948 and rs4543289 because of insufficient volume; therefore, we could not obtain their genotype information. The distributions of genotypes are shown in Table 1.
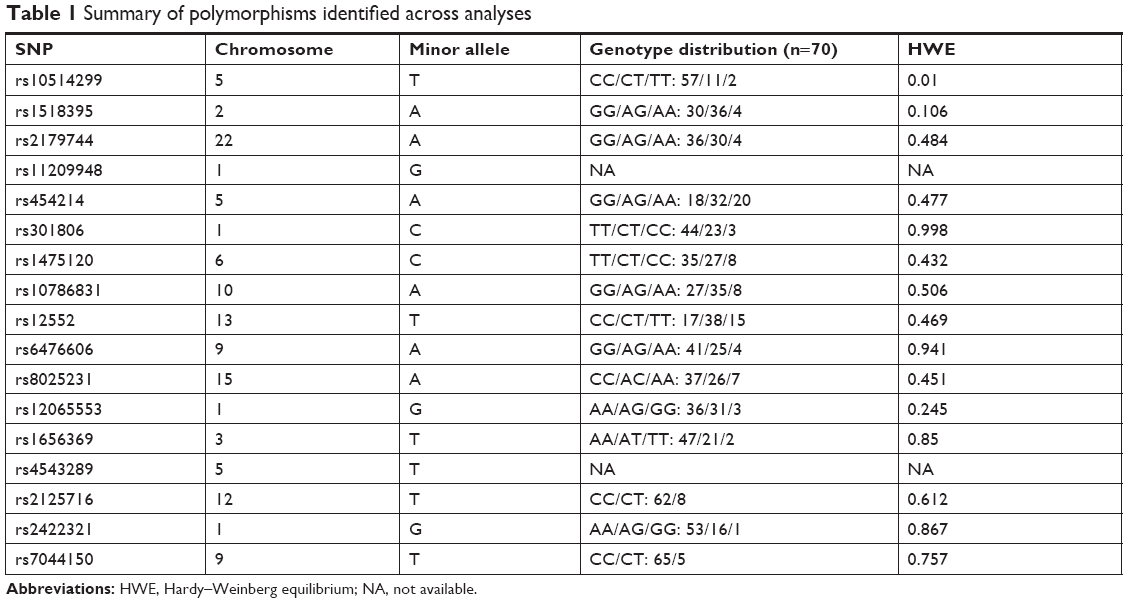 | Table 1 Summary of polymorphisms identified across analyses |
Effect of diagnosis on FA
Irrespective of genotype, significant differences in FA were shown between the HS and MDD patients. Figure 1 demonstrates the spatial brain region distribution, indicating a reduction in FA in the MDD patients compared to the HS. The MDD patients showed significantly reduced FA values (P<0.05 with FWE correction) in the left ATR, IFOF, corticospinal tract (CST), UF, and the forceps minor (Figure 1 and Table 2). For MD, AD, and RD, no significant differences were found.
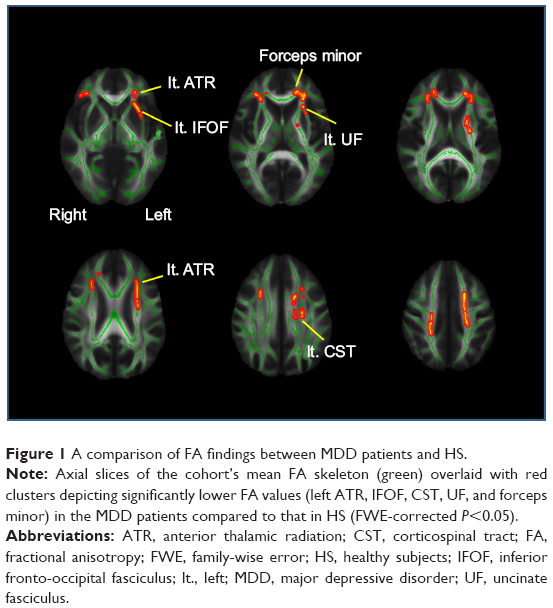 | Figure 1 A comparison of FA findings between MDD patients and HS. |
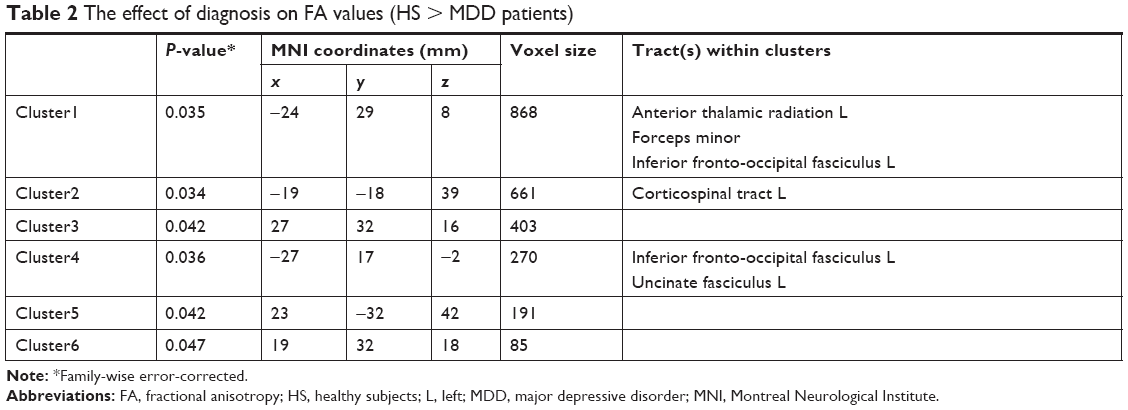 | Table 2 The effect of diagnosis on FA values (HS > MDD patients) |
Effect of genotype on FA
When we tested rs301806, an SNP in the arginine–glutamic acid dipeptide (RE) repeats gene (RERE), across the brains of MDD patients, the T/T individuals showed significantly reduced FA compared to the C-carrier individuals (C/C or C/T) in the bilateral IFOF, bilateral inferior longitudinal fasciculus (ILF), right superior longitudinal fasciculus (SLF), and forceps major (Figure 2 and Table 3). For analysis of the demographic and clinical characteristics of participants with regard to rs301806, an ANOVA was performed to compare the differences in age among four groups (T/T individuals and C-carrier individuals in HS, T/T individuals and C-carrier individuals with MDD). The chi-squared test was used to evaluate the sex differences among the four groups. An unpaired t-test was used to compare the total of the HAMD17 scores between the T/T individuals and C-carrier individuals with MDD and there were no significant differences in terms of age or sex (Table 4).
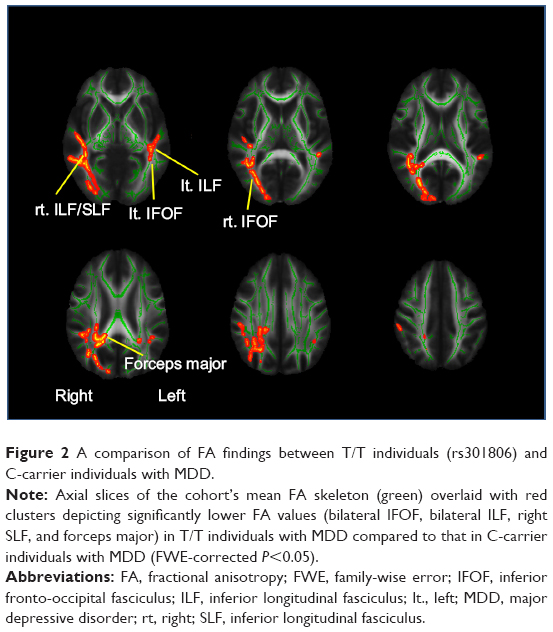 | Figure 2 A comparison of FA findings between T/T individuals (rs301806) and C-carrier individuals with MDD. |
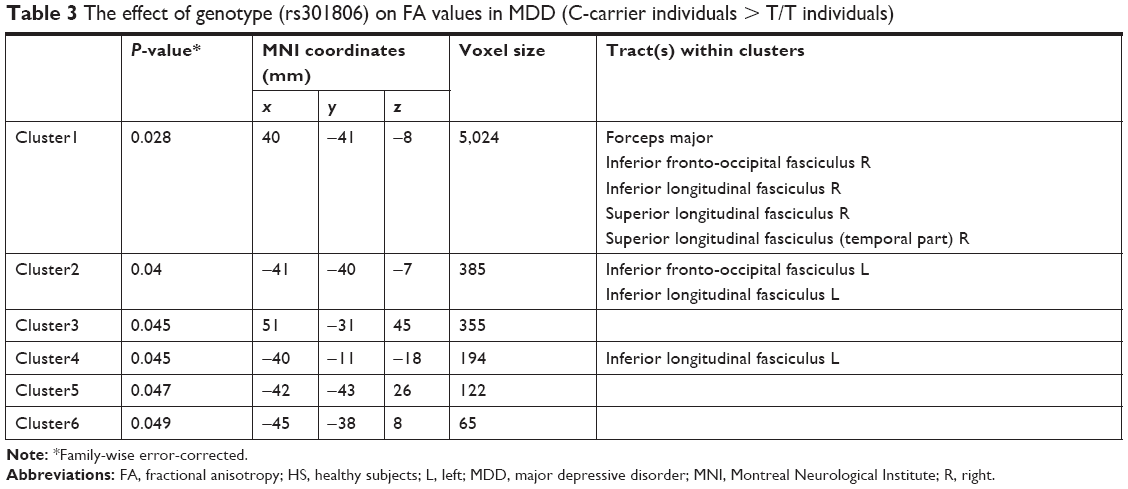 | Table 3 The effect of genotype (rs301806) on FA values in MDD (C-carrier individuals > T/T individuals) |
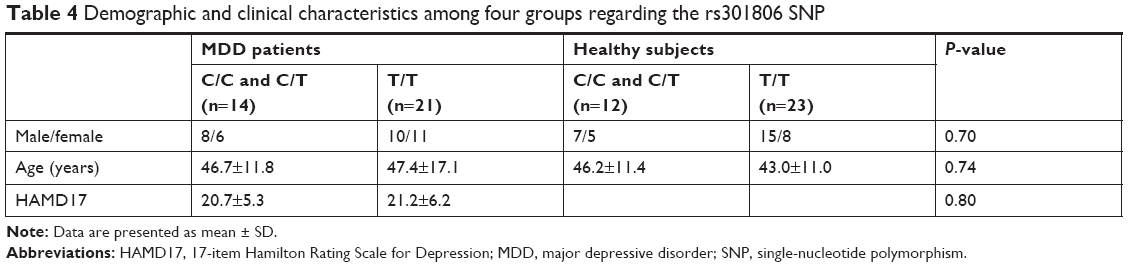 | Table 4 Demographic and clinical characteristics among four groups regarding the rs301806 SNP |
For other SNPs, we found no significant effect of genotype in MDD (P<0.05, FWE-corrected). For all 16 SNPs with genotype information, we found no significant effect of genotype in HS (P<0.05, FWE-corrected).
Genotype–diagnosis interaction on FA
We tested every possible diagnosis-wise comparison, and only for rs301806, an SNP in the RERE gene, the genotype effect differed significantly between diagnosis groups (P<0.05, FWE-corrected) for the left ATR and cingulum, bilateral CST, IFOF, ILF, SLF, UF, forceps major, and forceps minor. In these WM fiber tracts, the genotype–diagnosis interaction showed that the FA reduction in MDD compared to HS was significantly larger in T/T individuals than in C-carrier individuals (P<0.05, FWE-corrected) (Figure 3 and Table 5). For other SNPs, we found no WM fiber tracts where a genotype effect (in any direction) differed significantly between diagnosis groups (P<0.05, FWE-corrected).
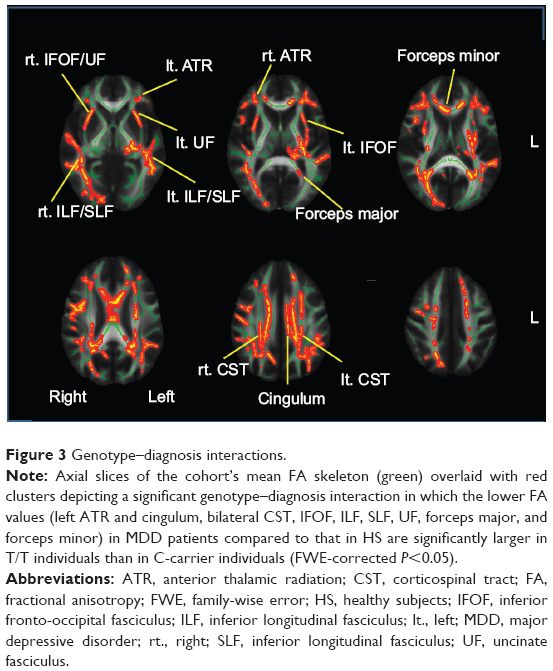 | Figure 3 Genotype–diagnosis interactions. |
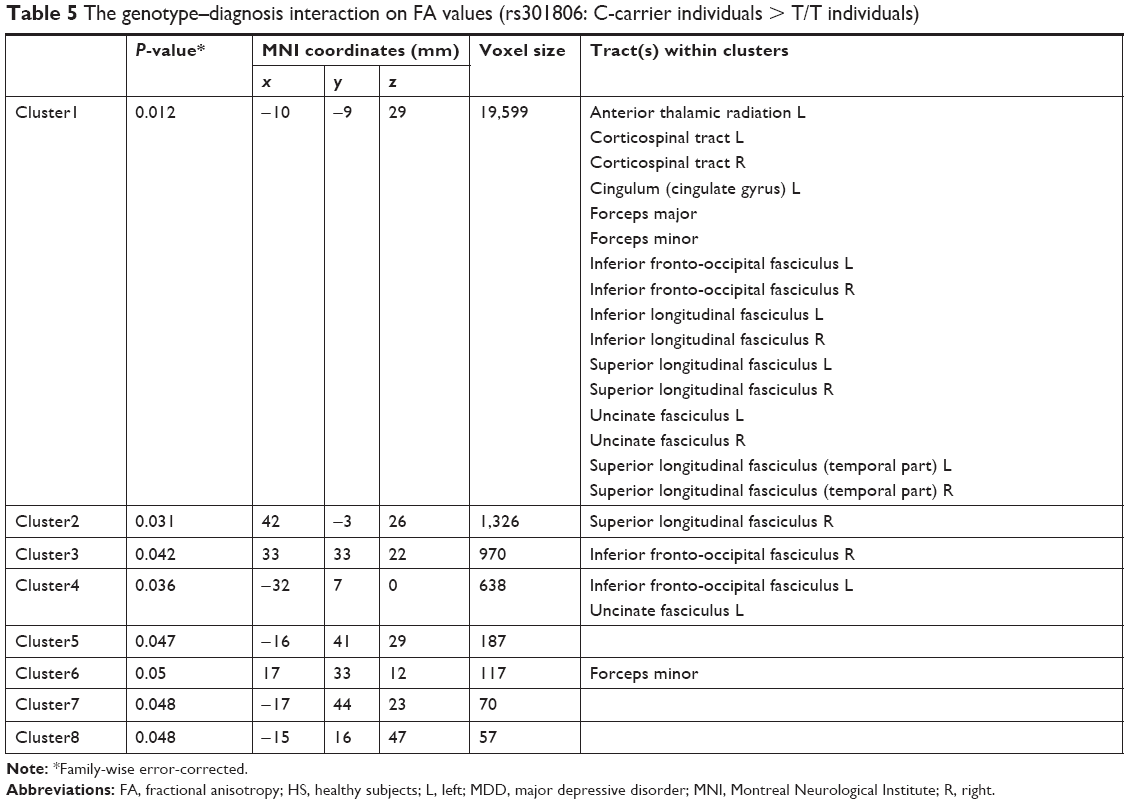 | Table 5 The genotype–diagnosis interaction on FA values (rs301806: C-carrier individuals > T/T individuals) |
Discussion
The SNP rs301806 is found in the RERE gene. The RERE gene is named after the dipeptide repeats found in the carboxyl terminal of RERE. RERE was previously known as Atrophin 2 (ATR2), based on the similarities between RERE and Atrophin 1 (ATR1). To our knowledge, this study provides the first evidence of a relationship between WM integrity and polymorphisms in the RERE gene in MDD patients. Specifically, the significant RERE genotype–diagnosis interaction effects were found in the ATR and cingulum, CST, IFOF, ILF, SLF, UF, forceps major, and forceps minor, suggesting that the RERE genotype affects the FA values in these WM tracts in MDD. The strength of this study lies in the recruitment of the drug-naive MDD patients. Previous studies indicated that alterations in WM integrity may occur during the course of MDD and after treatment.20,21 However, in this study, the WM alterations may be the acute state of MDD and not the effects due to treatment or chronic MDD. Furthermore, for the analyses of the effect of genotype on FA, we investigated the genotype–diagnosis interaction (the difference between MDD patients and HS with T/T vs C-carrier MDD patients and HS), because a genotype comparison in MDD patients and/or a simple genotype–diagnosis comparison may not be sufficient to identify an association between the polymorphism and brain changes in MDD patients.
The role of the RERE gene in brain pathology remains poorly understood. Jordan et al highlighted evidence implicating RERE in various 1p36 chromosome deletion phenotypes.22 The major clinical features of 1p36 deletion syndrome include motor developmental delay, hypotonia, and craniofacial dysmorphisms, such as a large anterior fontanelle, prominent forehead and chin, deep eyes, a flat nasal bridge, maxillary hypoplasia, and ear asymmetry. Thus, RERE appears to be required for normal brain development.23,24
Furthermore, a recent report indicates that RERE and its Drosophila homolog associate with histone methyltransferases to regulate gene expression.25 MDD is a polygenic and multifactorial disease, and gene–environment interactions play a pivotal role in its pathophysiology. Accordingly, a recent hypothesis is that certain environmental factors hijack the brain’s epigenetic machinery and, in combination with genetic predispositions, produce many of the behavioral manifestations of MDD.26,27 Epigenetic machinery comprises three broad umbrella systems: DNA methylation, histone modification, and non-coding RNA-mediated mechanisms. These are meiotically and mitotically heritable changes that are not directly coded in the DNA sequence.28 Thus, RERE may play an important role in the pathophysiology of depression through epigenetic machinery related to histone methyltransferases.
In this study, it is unclear why the polymorphism in the RERE gene was associated with alterations in specific WM tracts in MDD, because RERE is a nuclear receptor coregulator that is widely expressed in the developing central nervous system.29,30 However, our findings are supported by the several studies using DTI in MDD that demonstrated the presence of WM alterations (ie, reduced FA) in the ATR,4,5 IFOF,4,5,31 UF,4–6,31 cingulum,4,7,9 longitudinal fasciculi,4,6,10,11 and forceps major.32 A previous study also suggested that lower FA values in the IFOF may partly contribute to the impairments in memory, executive functioning, and emotional regulation seen in patients with MDD.33 Furthermore, because these fiber tracts form important anatomical connectivity or circuits, they may be directly relevant to the pathophysiology of MDD.13 The IFOF, UF, and ATR may have key roles in frontal–subcortical circuits and frontal–limbic circuits.34 Anatomically, the IFOF, UF, and ATR have a projection into the frontal cortex from the thalamus. The “disconnection” of the frontal–subcortical circuit was considered as one of the pathogenic elements associated with MDD.13 Frontal–limbic circuits are “open” loops incorporated into the functional connectivity between frontal areas (anterior cingulate cortex and orbitofrontal cortex) and other cortex, thalamus, and limbic system areas (amygdala and hippocampus).35 Anatomically, the UF has a projection into the anterior cingulate cortex and orbitofrontal cortex from limbic system areas.36 An association between dysregulation of the frontal–limbic circuits and MDD has been postulated based on functional imaging studies.1,37,38
Reduced FA values are thought to reflect reduced organization of the WM, reduced axonal density, and/or reduced myelination.39,40 In this study, the significant RERE genotype–diagnosis interaction showed that the FA reductions in MDD compared to those in HS were significantly larger in the T/T individuals than in the C-carrier individuals. However, the results from many GWASs imply that specific genetic variants individually make very small contributions to the etiology of MDD.41 Therefore, further studies with large sample sizes are required to prove whether one single risk variant (genetic variation of RERE) has an effect on the pathophysiology of MDD, such as decreased WM integrity. To increase power substantially, it would be useful to conduct analyses using polygenic risk scores, which provide an estimate of the combined effect of a large number of SNPs associated with a trait, each with a very subtle individual effect.42 In this study, the mechanism underlying how the genetic variation of RERE alters pathophysiological brain conditions has not been elucidated. Therefore, further fundamental studies are also required to determine which physiological systems the RERE genotype may particularly be related to in terms of myelination of the WM fiber tracts, to confirm the preliminary findings. Furthermore, in this study, we evaluated only the 17 SNPs as candidate genes for MDD. Many studies have reported new candidate genes for MDD,43–49 in which bioinformatics may provide new channels for examining neuroimaging changes.
Our study had limitations. First, this study was limited by a small sample size, which may have prevented us from detecting other potentially relevant genotypes that influence WM integrity, and may have also led to some of the negative results. However, because many patients were administered antidepressants before the MRI, it may be difficult to recruit first-episode and drug-naive patients with MDD. Second, in this study, we evaluated only people of Japanese background. There has been no GWAS regarding the genetic architecture of MDD in the Japanese population. Moreover, ethnic heterogeneity among the Japanese population has not been proved. Therefore, MDD genetic studies focusing on Japanese ethnicity by GWAS are required to generalize our findings to other ethnic groups.
Conclusion
The RERE polymorphism was associated with WM alterations of the ATR, cingulum, CST, IFOF, ILF, SLF, UF, forceps major, and forceps minor in first-episode and drug-naive MDD patients, which may be at least partially related to the manifestation of MDD. Further studies are required to explain how the RERE genotype results in WM alterations. Furthermore, the effects of one gene may not explain the morphological changes seen in MDD patients and we suggest that, in addition to the effects of the RERE gene polymorphism, gene–environment interactions may exist with regard to the individual brain networks. Future studies are also needed to explore the effects of epigenetic contributions, with the goal of clarifying disease mechanisms.
Acknowledgments
This work was supported by JSPS KAKENHI (grant number JP16H06280), Grant-in-Aid for Scientific Research on Innovative Areas – Platforms for Advanced Technologies and Research Resources “Advanced Bioimaging Support”.
Disclosure
The authors report no conflicts of interest in this work.
References
Drevets WC, Price JL, Furey ML. Brain structural and functional abnormalities in mood disorders: implications for neurocircuitry models of depression. Brain Struct Funct. 2008;213(1–2):93–118. | ||
Taylor WD, Hsu E, Krishnan KR, Macfall JR. Diffusion tensor imaging: background, potential, and utility in psychiatric research. Biol Psychiatry. 2004;55(3):201–207. | ||
Smith SM, Jenkinson M, Johansen-Berg H, et al. Tract-based spatial statistics: voxelwise analysis of multi-subject diffusion data. Neuroimage. 2006;31(4):1487–1505. | ||
Bessette KL, Nave AM, Caprihan A, Stevens MC. White matter abnormalities in adolescents with major depressive disorder. Brain Imaging Behav. 2014;8(4):531–541. | ||
Lagopoulos J, Hermens DF, Hatton SN, et al. Microstructural white matter changes are correlated with the stage of psychiatric illness. Transl Psychiatry. 2013;3(4):e248. | ||
Zuo N, Fang J, Lv X, et al. White matter abnormalities in major depression: a tract-based spatial statistics and rumination study. PLoS One. 2012;7(5):e37561. | ||
Korgaonkar MS, Grieve SM, Koslow SH, Gabrieli JD, Gordon E, Williams LM. Loss of white matter integrity in major depressive disorder: evidence using tract-based spatial statistical analysis of diffusion tensor imaging. Hum Brain Mapp. 2011;32(12):2161–2171. | ||
Kieseppä T, Eerola M, Mäntylä R, et al. Major depressive disorder and white matter abnormalities: a diffusion tensor imaging study with tract-based spatial statistics. J Affect Disord. 2010;120(1–3):240–244. | ||
Henderson SE, Johnson AR, Vallejo AI, Katz L, Wong E, Gabbay V. A preliminary study of white matter in adolescent depression: relationships with illness severity, anhedonia, and irritability. Front Psychiatry. 2013;4:152. | ||
Cole J, Chaddock CA, Farmer AE, et al. White matter abnormalities and illness severity in major depressive disorder. Br J Psychiatry. 2012;201(1):33–39. | ||
Versace A, Almeida JR, Quevedo K, et al. Right orbitofrontal corticolimbic and left corticocortical white matter connectivity differentiate bipolar and unipolar depression. Biol Psychiatry. 2010;68(6):560–567. | ||
Guo WB, Liu F, Xue ZM, et al. Altered white matter integrity in young adults with first-episode, treatment-naive, and treatment-responsive depression. Neurosci Lett. 2012;522(2):139–144. | ||
Sexton CE, Mackay CE, Ebmeier KP. A systematic review of diffusion tensor imaging studies in affective disorders. Biol Psychiatry. 2009;66(9):814–823. | ||
Sullivan PF, Neale MC, Kendler KS. Genetic epidemiology of major depression: review and meta-analysis. Am J Psychiatry. 2000;157(10):1552–1562. | ||
Hyde CL, Nagle MW, Tian C. Identification of 15 genetic loci associated with risk of major depression in individuals of European descent. Nature. 2016;201:6. | ||
Tatham EL, Ramasubbu R, Gaxiola-Valdez I, et al. White matter integrity in major depressive disorder: implications of childhood trauma, 5-HTTLPR and BDNF polymorphisms. Psychiatry Res Neuroimaging. 2016;253:15–25. | ||
Won E, Choi S, Kang J, et al. Association between reduced white matter integrity in the corpus callosum and serotonin transporter gene DNA methylation in medication-naive patients with major depressive disorder. Transl Psychiatry. 2016;6(8):e866. | ||
Choi S, Han KM, Kang J, et al. Effects of a polymorphism of the neuronal amino acid transporter SLC6A15 gene on structural integrity of white matter tracts in major depressive disorder. PLoS One. 2016;11(10):e0164301. | ||
Hayashi K, Yoshimura R, Kakeda S, et al. COMT Val158Met, but not BDNF Val66Met, is associated with white matter abnormalities of the temporal lobe in patients with first-episode, treatment-naïve major depressive disorder: a diffusion tensor imaging study. Neuropsychiatr Dis Treat. 2014;10:1183. | ||
Korgaonkar MS, Williams LM, Song YJ, Usherwood T, Grieve SM. Diffusion tensor imaging predictors of treatment outcomes in major depressive disorder. Br J Psychiatry. 2014;205(4):321–328. | ||
Lyden H, Espinoza RT, Pirnia T, et al. Electroconvulsive therapy mediates neuroplasticity of white matter microstructure in major depression. Transl Psychiatry. 2014;4(4):e380. | ||
Jordan VK, Zaveri HP, Scott DA. 1p36 deletion syndrome: an update. Appl Clin Genet. 2015;8:189. | ||
Zoltewicz JS, Stewart NJ, Leung R, Peterson AS. Atrophin 2 recruits histone deacetylase and is required for the function of multiple signaling centers during mouse embryogenesis. Development. 2004;131(1):3–14. | ||
Kim BJ, Zaveri HP, Shchelochkov OA, et al. An allelic series of mice reveals a role for RERE in the development of multiple organs affected in chromosome 1p36 deletions. PLoS One. 2013;8(2):e57460. | ||
Wang H, Gui H, Rallo MS, Xu Z, Matise MP. Atrophin protein RERE positively regulates Notch targets in the developing vertebrate spinal cord. J Neurochem. 2017;141(3):347–357. | ||
Peter CJ, Akbarian S. Balancing histone methylation activities in psychiatric disorders. Trends Mol Med. 2011;17(7):372–379. | ||
Renthal W, Nestler EJ. Chromatin regulation in drug addiction and depression. Dialogues Clin Neurosci. 2009;11(3):257. | ||
Egger G, Liang G, Aparicio A, Jones PA. Epigenetics in human disease and prospects for epigenetic therapy. Nature. 2004;429(6990):457–463. | ||
Wang L, Tsai CC. Atrophin proteins: an overview of a new class of nuclear receptor corepressors. Nucl Recept Signal. 2008;6(1):e009. | ||
Vilhais-Neto GC, Maruhashi M, Smith KT, et al. Rere controls retinoic acid signalling and somite bilateral symmetry. Nature. 2010;463(7283):953–957. | ||
Liu X, Watanabe K, Kakeda S, et al. Relationship between white matter integrity and serum cortisol levels in drug-naive patients with major depressive disorder: Diffusion tensor imaging study using tract-based spatial statistics. Br J Psychiatry. 2016;208(6):585–590. | ||
Shen X, Reus LM, Cox SR, et al. Subcortical volume and white matter integrity abnormalities in major depressive disorder: findings from UK Biobank imaging data. Sci Rep. 2017;7(1):5547. | ||
Han KM, Choi S, Jung J, et al. Cortical thickness, cortical and subcortical volume, and white matter integrity in patients with their first episode of major depression. J Affect Disord. 2014;155:42–48. | ||
Tekin S, Cummings JL. Frontal-subcortical neuronal circuits and clinical neuropsychiatry: an update. J Psychosom Res. 2002;53(2):647–654. | ||
Bonelli RM, Cummings JL. Frontal-subcortical circuitry and behavior. Dialogues Clin Neurosci. 2007;9(2):141–151. | ||
Kier EL, Staib LH, Davis LM, Bronen RA. MR imaging of the temporal stem: anatomic dissection tractography of the uncinate fasciculus, inferior occipitofrontal fasciculus, and Meyer’s loop of the optic radiation. AJNR Am J Neuroradiol. 2004;25(5):677–691. | ||
Drevets WC. Functional anatomical abnormalities in limbic and prefrontal cortical structures in major depression. Prog Brain Res. 2000;126:413–431. | ||
Wakana S, Jiang H, Nagae-Poetscher LM, van Zijl PC, Mori S. Fiber tract-based atlas of human white matter anatomy. Radiology. 2004;230(1):77–87. | ||
Basser PJ, Pierpaoli C. Microstructural and physiological features of tissues elucidated by quantitative-diffusion-tensor MRI. J Magn Reson B. 1996;111(3):209–219. | ||
Beaulieu C. The basis of anisotropic water diffusion in the nervous system – a technical review. NMR Biomed. 2002;15(7–8):435–455. | ||
Wray NR, Pergadia ML, Blackwood DH, et al. Genome-wide association study of major depressive disorder: new results, meta-analysis, and lessons learned. Mol Psychiatry. 2012;17(1):36–48. | ||
International Schizophrenia Consortium, Purcell SM, Wray NR, et al. Common polygenic variation contributes to risk of schizophrenia and bipolar disorder. Nature. 2009;460(7256):748. | ||
Wray NR, Ripke S, Mattheisen M, et al. Genome-wide association analyses identify 44 risk variants and refine the genetic architecture of major depression. Nat Genet. 2018;50(5):668–681. | ||
Wong ML, Arcos-Burgos M, Liu S, et al. The PHF21B gene is associated with major depression and modulates the stress response. Mol Psychiatry. 2017;22(7):1015–1025. | ||
Yu C, Arcos-Burgos M, Baune BT, et al. Low-frequency and rare variants may contribute to elucidate the genetics of major depressive disorder. Transl Psychiatry. 2018;8(1):70. | ||
Cai N, Bigdeli TB, Kretzschmar W, CONVERGE Consortium. Sparse whole-genome sequencing identifies two loci for major depressive disorder. Nature. 2015;523(7562):588–591. | ||
Amin N, Jovanova O, Adams HHH, et al. Exome-sequencing in a large population-based study reveals a rare Asn396Ser variant in the LIPG gene associated with depressive symptoms. Molecular Psychiatry. 2017;22(4):537–543. | ||
Yu C, Baune BT, Licinio J, Wong ML. A novel strategy for clustering major depression individuals using whole-genome sequencing variant data. Sci Rep. 2017;7(1):44389. | ||
Yu C, Baune BT, Licinio J, Wong ML. Single-nucleotide variant proportion in genes: a new concept to explore major depression based on DNA sequencing data. J Hum Genet. 2017;62(5):577–580. | ||
Anderson MJ, Robinson J. Permutation tests for linear models. Aus N Z J Stat. 2001;43(1):75–88. | ||
Smith SM, Nichols TE. Threshold-free cluster enhancement: addressing problems of smoothing, threshold dependence and localisation in cluster interference. Neuroimage. 2009;44(1):83–98. |
 © 2019 The Author(s). This work is published and licensed by Dove Medical Press Limited. The
full terms of this license are available at https://www.dovepress.com/terms
and incorporate the Creative Commons Attribution
- Non Commercial (unported, 3.0) License.
By accessing the work you hereby accept the Terms. Non-commercial uses of the work are permitted
without any further permission from Dove Medical Press Limited, provided the work is properly
attributed. For permission for commercial use of this work, please see paragraphs 4.2 and 5 of our Terms.
© 2019 The Author(s). This work is published and licensed by Dove Medical Press Limited. The
full terms of this license are available at https://www.dovepress.com/terms
and incorporate the Creative Commons Attribution
- Non Commercial (unported, 3.0) License.
By accessing the work you hereby accept the Terms. Non-commercial uses of the work are permitted
without any further permission from Dove Medical Press Limited, provided the work is properly
attributed. For permission for commercial use of this work, please see paragraphs 4.2 and 5 of our Terms.