Back to Journals » Cancer Management and Research » Volume 12
Gene Expression Signature to Predict Prognosis and Adjuvant Chemosensitivity of Colorectal Cancer Patients
Authors Li J ![]() , Zhang J
, Zhang J ![]() , Hu H
, Hu H ![]() , Cai Y, Ling J, Wu Z, Deng Y
, Cai Y, Ling J, Wu Z, Deng Y ![]()
Received 25 December 2019
Accepted for publication 16 April 2020
Published 11 May 2020 Volume 2020:12 Pages 3301—3310
DOI https://doi.org/10.2147/CMAR.S243490
Checked for plagiarism Yes
Review by Single anonymous peer review
Peer reviewer comments 2
Editor who approved publication: Professor Bilikere Dwarakanath
Jianxia Li,* Jianwei Zhang,* Huabin Hu, Yue Cai, Jiayu Ling, Zehua Wu, Yanhong Deng
Department of Medical Oncology, The Sixth Affiliated Hospital, Sun Yat-Sen University, Guangdong Province Key Laboratory of Colorectal and Pelvic Floor Diseases, Guangzhou, Guangdong 510655, People’s Republic of China
*These authors contributed equally to this work
Correspondence: Yanhong Deng
Email [email protected]
Purpose: Molecular characteristics using gene-expression profiling can undoubtedly improve the prediction of treatment responses, and ultimately, the clinical outcome of cancer patients. We aimed at developing a genetic signature to improve the prediction of chemosensitivity and prognosis of patients with colorectal cancer (CRC).
Patients and Methods: We analyzed microarray data of 32 CRC patients to explore the potential functions and pathways involved in the disease relapse in CRC. Gene expression profiles and clinical follow-up information of GSE39582, GSE17536, and GSE103479 were downloaded from the Gene Expression Omnibus database (GEO) to identify prognostic genes. Eventually, a model of 15-mRNA signature was established, in which its efficacy for predicting chemosensitivity and prognosis was examined.
Results: Based on the proposed model of 15-mRNA signature, the test series patients could be classified into high-risk or low-risk subgroup with significantly different overall survival (OS) rate (hazard ratio [HR]=1.48, 95% confidence interval [CI]=1.30– 1.70, P≤ 0.001). The prognostic value of this 15-mRNA signature was confirmed in another validation series. Further analysis revealed that the prognostic value of this signature was independent of the TNM stage and can predict adjuvant chemosensitivity of patients with early-stage CRC.
Conclusion: We identified a novel 15-mRNA signature in patients with CRC, which could be clinically helpful in the prognosis evaluation and the process of selection of patients with early-stage CRC for undergoing adjuvant chemotherapy.
Keywords: colorectal cancer (CRC), chemosensitivity, survival, a 15-gene signature, prognosis, risk score
Introduction
Colorectal cancer (CRC) is one of the most common types of cancer worldwide.1 Common strategies for CRC management include chemotherapy, radiotherapy, targeted therapy, and surgical resection. Treatment decisions are primarily made based on TNM stage, according to the staging system presented by the American Joint Committee on Cancer (AJCC) or the Union for International Cancer Control (UICC), which is taken as the strongest prognostic parameter in CRC.2–4 In addition to TNM staging, histology differentiation, vascular and nerve invasion have also shown remarkable influences on prognosis to some extent.5–9 Generally, the standard treatment for stage III and stage II with unfavorable prognostic characteristics is surgery in combination with 5-Fluorouracil (5-Fu)-based adjuvant chemotherapy.10 However, prognosis has been variable even for patients with identical TNM stage and prognostic parameters. Therefore, further sensitive indicators should be explored to represent malignant aggressiveness and chemosensitivity as a complementary component to TNM staging.
It has been reported that application of molecular biomarkers may promote the prognostic evaluation and identification of potential high-risk patients. For instance, RAS gene mutation was studied as a prognostic factor in CRC in a number of previous studies.10–12 Additionally, several other prognostic biomarkers for CRC have been tested, studies such as fibroblast growth factor receptor (FGFR), human epidermal growth factor receptor 2 (HER2), epidermal growth factor receptor (EGFR), etc.13–15 However, further potential and valuable molecular biomarkers are essential to improve the clinical outcome of patients with CRC. Several studies have shown that identification and application of integrated genetic profiles may promote prediction of outcomes in cancer patients, as well as being helpful for predicting response or toxicity using various anticancer drugs.16–20 Therefore, searching genetic signatures may be precious for prognosis in the management of CRC.
In the present study, we investigated the genes and functional pathways, which were highly correlated with disease relapse in CRC. In addition, we conducted gene expressions of mRNA profiling on a cohort of 895 patients. By using univariate regression analysis, we identified 15 genes with strong prognostic influence. The prognostic values of these genes and their association with chemosensitivity were then tested and validated.
Patients and Methods
Patients and RNA Profiling
Patients who had undergone curative resection of stage III CRC in the Sixth Affiliated Hospital of Sun Yat-sen University (Guangzhou, China) between 2007 and 2010 were studied, as previously reported.21 This study was approved by the Ethics Committee of the Sixth Affiliated Hospital of Sun Yat-sen University. Predefined inclusion criteria were as follows: 1) histologically proven adenocarcinoma of the colon or rectum, pT1-4N1-2M0; 2) R0 resection (histologically negative margins); 3) fresh frozen tissue of primary lesion available in the tissue bank of the Sixth Affiliated Hospital of Sun Yat-sen University; 4) treatment via adjuvant modified FOLFOX6 or CapeOx; and 5) follow-up showing recurrence or metastasis during 1.5 years (defined as non-responders), or disease-free for at least 3 years (defined as responders). Exclusion criteria included: 1) history of invasive colorectal malignancy or other malignancies; 2) history or family history of familial adenomatous polyposis or hereditary nonpolyposis CRC; or 3) laparoscopic resection of synchronous colorectal malignant lesions.
Total RNA was isolated from frozen samples using the RiboPure™ Kit (Ambion, Austin, TX, USA). Gene expression profiles were detected by using Affymetrix HG-U133 Plus 2.0 GeneChips (Affymetrix Inc., Santa Clara, CA, USA) according to manufacturer’s instructions, as described previously.22
Analysis of Microarray Data and Functional Enrichment Analysis
Raw CEL files were adjusted using robust multichip average (RMA) method implemented in Affy package in R software.23 Probes with absent signal in all samples were removed. Differentially expressed analysis were performed using Limma R package24 and the cut off to determine significantly high or low expression between responders and non-responders was at least two-fold-change and P-value less than 0.05.
Functional enrichment analysis was performed using MsigDB H hallmark gene sets collection and C5 Gene Ontology (GO) gene sets collection.25,26 GO functional annotations provide molecular function of differentially expressed genes (DEGs), biological process, and cellular component. Hallmark pathways represent data related to canonical tumor pathways. DEGs were herein used to calculate P-values and obtain significantly enriched categories by hypergeometric distribution method. P-value <0.001 and Odd Ratio >10 were considered as statistically significant thresholds.
Establishment of a Model of 15-mRNA Signature and its Validation
The associations between the gene expression and patient’s disease-free survival (DFS), relapse-free survival (RFS) or overall survival (OS) were assessed by univariate Cox regression analysis. Prognostic genes that were statistically significant (P<0.05) in no less than two GEO series out of three GEO series were selected to further construct the prognostic model. The risk score was formulated by each of the selected genes, and weighted by their estimated regression coefficients, which obtained by the univariate Cox regression analysis of training set. Using the presented risk score formula, each patient was scored in each class, and then categorized them into high-risk and low-risk groups by using the corresponding median risk score value as a cutoff value.
Statistical Analysis
Survival differences between high-risk group and low-risk group in each dataset were assessed by the Kaplan–Meier estimator, and then compared by using the Log rank test. We used the Cox proportional hazards model to perform univariate and multivariate regression analyses. Other statistical analyses were conducted by using R 3.5.1 software. Statistical significance was set at P-value <0.05.
Results
Identification of DEGs
Herein, RNA isolated from 16 non-responders and 16 responders passed quality control criteria for gene expression analysis. Quality of microarray gene expression data was confirmed as well. Non-hierarchical cluster analysis of samples showed that there was no remarkable distinction between non-responders and responders. In addition, 57 probes denoting 50 DEGs between non-responders and responders were detected with a significant difference. After removing 6 genes on the Y chromosome and the inactivated X chromosome caused by sex imbalance, 25 DEGs were expressed with higher level in non-responders, and 19 DEGs were expressed with higher level in responders. (Figure 1A)
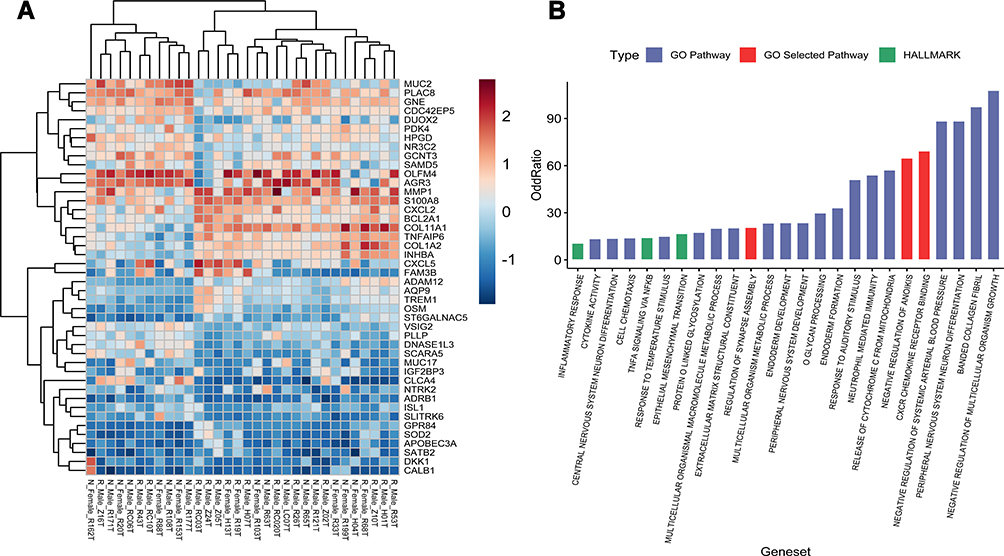 |
Figure 1 Gene expression analysis of 16 non-responders (N) and 16 responders (R). (A) Heatmap of the 44 DEGs between the non-responders and the responders. Upregulation is shown in orange and down-regulation in blue. Names of samples are listed at the bottom. The tree view on the left shows the hierarchical cluster analysis of the genes. The names of genes are listed on the right. (B) Significantly enriched GO and HALLMARK pathways of the DEGs. |
Functional Annotation and Enrichment Analysis
Those significantly dysregulated genes in responders and non-responders were found to be involved in GO annotation terms and Hallmark annotation terms for canonical tumor pathway. In the present research, 25 significantly enriched pathways were achieved, which may participate in cancer metastasis and recurrence (Figure 1B). Eventually, corresponding 110 unique genes from 3 pathways were selected as candidate genes for the following analysis. These pathways were CXCR chemokine receptor (GO:0045236), negative regulation of anoikis (GO:2000811), and regulation of synapse assembly (GO:0051963), consisting of 16, 17, and 79 genes, respectively. Among these 112 genes, PTK2 and NTRK2 were found as duplicated genes involved in both regulation of synapse assembly and negative regulation of anoikis.
Identification of Prognostic Genes from the GEO Database
Each GEO series were independently analyzed by subjecting gene expression data of the above-mentioned candidate genes for analysis by univariate Cox regression analysis. Both DFS/RFS and OS were queried in GSE39582, GSE17536, and GSE103479. In total, 108 genes were analyzed in 3 independent series except for 2 undetected genes (LRRTM3 and LRRC24). As a result, 15 genes that significantly influenced survival in no less than 2 series out of 3 series were selected. Among these genes, positive coefficients indicated that the higher expression levels of 6 genes (SIX4, PIK3CA, ITGB1, ITGA5, DKK1, and CXCL5) were associated with shorter survival, whereas the other 9 genes (WANT5A, PTRH2, NLGN3, LRTM1, EPHB3, EPHB2, CXCL2, CXCL1, and CBLN2) were taken as protective factors of survival into account. The results of Cox regression analysis of 15 genes are illustrated in Figure 2.
 |
Figure 2 The results of univariate Cox regression analysis of 15 selected genes on three public microarray cohorts (GSE39582, GSE17536, and GSE103479). The size of dots represent the HR value of death or disease relapse. The color of the dots denotes the P-value calculated by univariate Cox regression analysis. |
The 15-mRNA Signature and the Patients’ Survival in the Training Set
Risk scores were calculated by summation of the expression levels of these 15-mRNAs, which weighted by their coefficients obtained from the predicted OS of the training set (GSE39582). The risk score was formulated as follows: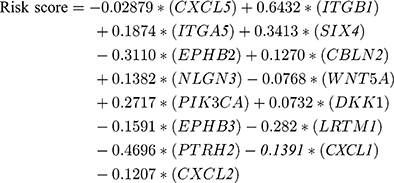
We then scored each patient in training set and rank them according to their risk scores. Patients were classified as high-risk and low-risk using the median risk score as cutoff value. Patient in high-risk group had significantly shorter OS (Log rank test, P<0.001) (Figure 3A) and DFS/RFS (Log rank test, P<0.001) in the training set. The risks of 15-mRNAs were also significant when they were evaluated as a continuous variable in univariate regression analyses of OS (HR=1.48, 95% CI=1.30–1.70, P≤0.001), and DFS/RFS (HR=1.49, 95% CI=1.31–1.70, P<0.001).
 |
Figure 3 The Kaplan–Meier method was used to estimate the OS of patients in the training set using the 15-mRNA signature. (A) The Kaplan–Meier curves for patients in GSE39582 microarray cohort (N = 562); (B) The Kaplan–Meier curves for patients in GSE39582 microarray cohort (N = 562), which stratified by metastasis status. The tick marks on the Kaplan–Meier curves represent the censored subjects. The differences between the two curves were compared by the two-sided Log rank test. |
It is noteworthy that the TNM stage is a well-known prognostic factor for CRC. We herein assessed the prognostic value of the risk score in patients in early stage (stage I–III) and metastatic (stage IV) CRC patients separately. As a result, the risk score was found as a significant prognostic factor independent of metastasis status. There were 502 patients in early stage and 60 metastatic CRC patients. For patients in early stage, those patients with high-risk score had significantly shorter OS (Log rank test, P=0.015) (Figure 3B). For metastatic CRC patients, those cases with high-risk score had remarkably shorter OS (Log rank test, P=0.004) (Figure 3B).
Validation of the 15-mRNA Signature for Predicting Patients’ Survival
To confirm our findings, 15-mRNA signature was validated in two microarray cohorts, GSE17536 and GSE103479, with participation of 332 patients. Using the presented risk formula and median cutoff value, we classified GSE17536 and GSE103479 into high-risk group and low-risk group based on their median risk score, respectively. Patients in the high-risk group had significantly shorter OS (Log rank test, P=0.0014) (Figure 4A) and shorter DFS/RFS (Log rank test, P<0.0001). We also assessed the prognostic value of the risk score in patients in early stage and metastasis CRC patients separately. As a result, the risk score was noted as a significant prognostic value independent of metastasis status. There were 293 patients in early stage and 39 metastasis CRC patients. For patients in early stage, those cases with high-risk scores had significantly shorter OS (Log rank test, P=0.011) (Figure 4B). For metastasis CRC patients, those cases with high-risk score had significantly shorter OS (Log rank test, P=0.007) (Figure 4B)
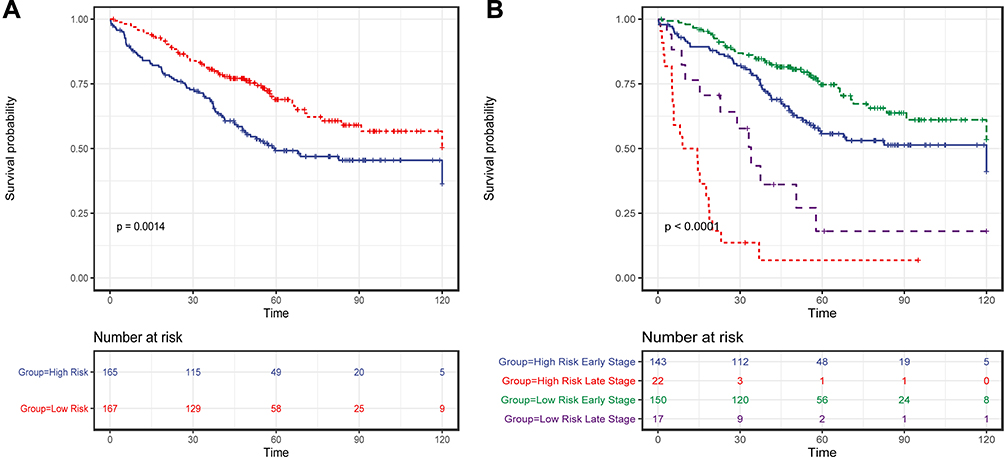 |
Figure 4 The Kaplan–Meier method was used to estimate the OS of patients in the validation set using the 15-mRNA signature. (A) The Kaplan–Meier curves for validation of patients in two microarray cohorts of GSE17536 and GSE103479 (N = 332); (B) The Kaplan–Meier curves for validation of patients in two microarray cohorts of GSE17536 and GSE103479 (N = 332), which is stratified by metastasis status; The tick marks on the Kaplan–Meier curves represent the censored subjects. The differences between the two curves were compared by the two-sided Log rank test. |
Prognostic Value of the 15-mRNA Signature and Adjuvant Chemotherapy of CRC Patients in Stage I-III
To indicate whether the proposed model has a prognostic value for CRC patients in stages I–III who received adjuvant chemotherapy after surgery, we integrated CRC patients in stages I–III with GES39852, GSE17536, and GSE103479, consisting of 792 patients, of which data of adjuvant chemotherapy existed for 694 patients. Patients who received adjuvant chemotherapy had significantly longer OS than those who did not receive adjuvant chemotherapy as expected (Log rank test, P=0.005). Using the presented risk formula and median cutoff value, we classified patients into high-risk and low-risk groups based on their median risk score, respectively. In the low-risk group (N=353), patients who underwent adjuvant chemotherapy had significantly longer OS than others (Log rank test, P<0.001), whereas in the high-risk group (N=341), the OS was not remarkable in patients who underwent adjuvant chemotherapy (Log rank test, P=0.213) (Figure 5A).
 |
Figure 5 Chemotherapy-related prognostic value of 15-mRNA signature in CRC patients. (A) The Kaplan–Meier method was used to estimate the OS of integrated early-stage cohort (N=694) using the 15-mRNA signature, stratified by adjuvant chemotherapy status; (B) Multivariate Cox proportional hazards regression analysis of CRC patients in stages I–III (N=417). Multivariables included the risk score, age at the time of diagnosis, sex, T stage, N stage, anatomical location of primary tumor, adjuvant chemotherapy and mutation status in KRAS and BRAF genes. Risk score, T stage, N stage were taken as continuous variables into account, while other factors were as categorical variables. Solid tetragonums represent the HR of death, and open-ended horizontal lines represent 95% CIs. All P-values were calculated by using Cox regression analysis. |
To further investigate the difference in prognosis between the high-risk and low-risk groups, a multivariate Cox regression analysis was used in 417 CRC patients in stages I-III from GSE39582, since it had the most complete clinical data. This analysis included patients who were in the early stages with the inclusion of age, sex, adjuvant chemotherapy, T stage, N stage, location of primary tumor, and mutation status of KRAS and BRAF genes as covariates. We found that the risk score of 15-mRNA (HR=1.27, 95% CI=1.04–1.55, P=0.020) remained as an independent prognostic factor for predicting OS (Figure 5B). We then stratified patients with respect to risk score, and multivariable Cox regression analysis was used for the high-risk and low-risk groups to further investigate the difference in prognosis. For patients in the low-risk group who did not undergo adjuvant chemotherapy (HR=0.24, 95% CI=0.09–0.59, P=0.002), advanced T stage (HR=2.19, 95% CI=1.30–3.69, P=0.003) caused significantly lower OS rates (Figure 6A), while for patients in the high-risk group, no significant prognostic factor was noted except for N stage (HR=1.46, 95% CI=1.06–2.00, P=0.019) (Figure 6B). These results suggested that patients with a low-risk score were recommended to receive adjuvant chemotherapy. However, patients with a high-risk score did not benefit from the adjuvant chemotherapy regimen. For such patients, adjuvant chemotherapy regimen should be enhanced or modified, and further stringent follow-up is essential.
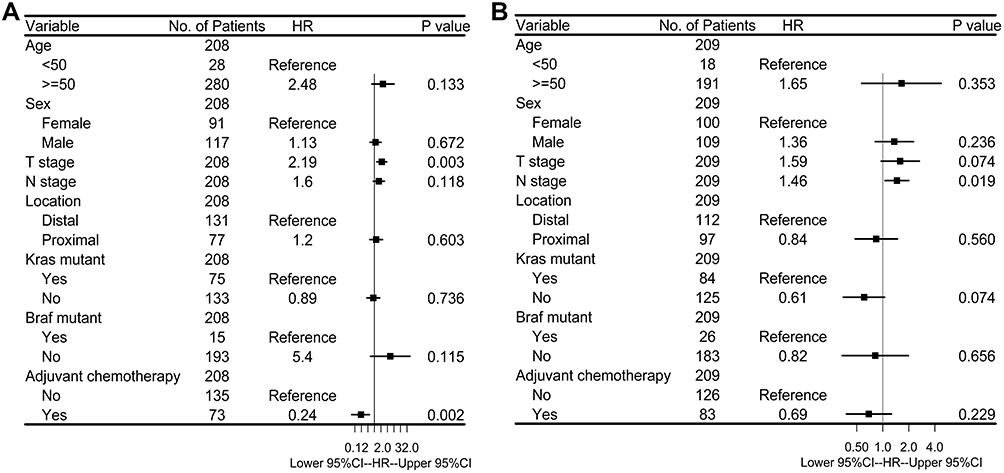 |
Figure 6 (A) Multivariate Cox proportional hazards regression analysis of low-risk CRC patients in stages I–III (N=208). (B) Multivariate Cox proportional hazards regression analysis of high-risk CRC patients in stages I–III (N=209). Multivariables included age at the time of diagnosis, sex, T stage, N stage, anatomical location of primary tumor, adjuvant chemotherapy and mutation status in KRAS and BRAF genes. T stage, N stage were taken as continuous variables into account, while other factors were as categorical variables. Solid tetragonums represent the HR of death, and open-ended horizontal lines represent 95% CIs. All P-values were calculated by using Cox regression analysis. |
Discussion
Currently, clinical and pathological features may be insufficient to truly predict survival outcomes, whereas genetic approaches have been demonstrated to be effective for this purpose. In the current research, we applied univariate Cox regression analyses on microarray data to screen potential genes with strong prognostic values, and attempted to establish a prognostic and chemo-benefit predicted model with these genes.
To identify prognostic genes, a microarray analysis was carried out on 32 CRC patients. It was revealed that recurrence or resistance after adjuvant chemotherapy of CRC was associated with dysregulated genes involving in several pathways, including CXCR chemokine receptor, negative regulation of anoikis and regulation of synapse assembly. The CXCR chemokine receptor consists of genes interacting selectively and non-covalently with a chemokine receptor in the CXCR family. Studies reported that upregulated expression of genes involved in CXCR family play a role in either promotion or inhibition of cancer cells, in addition to drug resistance.27–29 The negative regulation of anoikis consists of genes involved in any process that stops, prevents, or reduces the frequency, rate, or extent of anoikis, and that is a process, in which cells are triggered to die when those are separated from their surrounding matrix and neighboring cells. Resistance to anoikis is taken as a critical contributor into account to tumor invasion and metastasis.30,31 Synapse is a structure that permits a cell to pass an electrical or chemical signal to another effector cell. Recent studies found that specific synapses play essential role in tumorigenesis of glioma32,33 and brain metastasis from breast cancer.34 What’s more, actin remodeling at the cancer cell side of immunological synapses are emerging as an important mechanism of tumor immune evasion.35 These findings reveal a potential relevant between synaptic communication and tumor with potential clinical implications. However, this aspect requires further study.
We then focused on identification of key genes involved in the above-mentioned three pathways. A prognostic model was established consisting of 15 genes with strong prognostic effects. To date, a number of studies reported the effects of single genes involved in the model on tumors, such as WNT5A, DKK1, EPBH2, SIX4, ITGB1, PIK3CA, CXCL5, and CXCL2.36–43 However, the majority of these studies did not assess the molecular mechanisms involved in the regulation of gene expression. Additionally, a number of genes have not been studied on tumors, such as NLGN3, PTRH2, CBLN2, LRTM1. After establishing a predictive model using the aforementioned genes, survival analysis of the risk score was undertaken. It was noted that patients with a low-risk score had significantly longer OS in the training set and validation set. The risk score was also found to be significant prognostic factor independent of metastasis status. Since the tumor tissue samples of the initial explorational cohort were collected before adjuvant chemotherapy and grouped according to the recurrence and metastasis events found in the follow-up, the molecular difference between them may arise from tumor malignancy, or the chemosensitivity of tumor to 5-FU, or both.
Moreover, 5-Fu-based adjuvant chemotherapy after resection is a standard treatment for CRC patients in early stage. Several studies demonstrated the advantage of predicting 5-Fu-based chemotherapy based on gene expression data, and showed its great potential in clinical application.44,45 In this study, we noted that patients in the low-risk group had a favorable response to adjuvant chemotherapy, whereas those in the high-risk group did not benefit from adjuvant chemotherapy. These results indicated that the proposed classifier may be clinically applicable for the selection of CRC patients in the early stages to undergo adjuvant chemotherapy. Patients in the low-risk group are encouraged to undergo 5-Fu-based adjuvant chemotherapy to prolong OS, while patients in the high-risk group may require an enhanced chemotherapy regimens or other alternative chemotherapy regimens.
Compared with prognostic models developed in other studies, the innovation of the model presented in this study lies in the function-based gene selection and multi-pathways combinatorial modeling. Another valuable feature is that the proposed model is not only a prognostic model, but can also be served to reflect the significance of chemotherapy in early-stage CRC.
However, similar to other expression-based classifiers, there is a limitation in clinical use of different qualitative- and quantitative-based methods. Although all the data used in this study were normalized by using the RMA method, detection platforms were not identically the same, highlighting the necessity of further validations in the next prospective studies. Additionally, the co-effects of pathways on tumors should be explored, and the relevant mechanisms need to be studied as the majority of studies investigated the association between single-pathway and tumor biological behaviors. The combined effects and cross-talk of interconnected pathways in tumors may be precious for guiding future cancer-based researches.
Conclusion
In conclusion, we utilized a large amount of transcriptome data to identify a prognostic 15-mRNA signature of CRC patients. Our results showed that the 15-mRNA signature might be an effective prognostic biomarker of CRC. We hope that the prognostic significance of the 15-mRNA signature may be clinically applicable for the selection of CRC patients in the early stages of the disease to undergo adjuvant chemotherapy. Future research should concentrate on the validation of our findings in planned clinical trials, and present the role of these genes in biological behavior of tumors and drug resistance.
Abbreviations
AJCC, American Joint Committee on Cancer; CRC, colorectal cancer; CXCR, chemokine (C-X-C motif) receptor; DEGs, differentially expressed genes; DFS, disease-free survival; EGFR, epidermal growth factor receptor; FGFR, fibroblast growth factor receptor; 5-Fu, 5-Fluorouracil; GO, Gene Ontology; HER2, human epidermal growth factor receptor 2; HR, hazard ratio; OS, overall survival; RFS, relapse-free survival; RMA, robust multichip average; UICC, Union for International Cancer Control.
Data Sharing Statement
The microarray data of 32 patients that supported the findings of this study are available from the corresponding author upon request. Public data can be found online at the GEO database (accession nos. GSE39582, GSE17536, and GSE103479).
Ethics and Consent Statement
This study was approved by the Ethics Committee of the Sixth Affiliated Hospital of Sun Yat-sen University, and all patients provided written informed consent in according with the Declaration of Helsinki.
Acknowledgments
This study was supported by the National Natural Science Foundation of China [grant number 81974369]; Science and Technology Planning Project of Guangdong Province [grant number 2017B030308006]; Key Technologies Research and Development Program of Guangzhou [grant number 201704020144].
Disclosure
The authors declare that there are no conflicts of interest in this work.
References
1. Siegel RL, Miller KD, Jemal A. Cancer statistics, 2019. CA Cancer J Clin. 2019;69(1):7–34. doi:10.3322/caac.21551
2. Edge SB, Compton CC. The American joint committee on cancer: the 7th edition of the AJCC cancer staging manual and the future of TNM. Ann Surg Oncol. 2010;17(6):1471–1474. doi:10.1245/s10434-010-0985-4
3. Nagtegaal ID, Tot T, Jayne DG, et al. Lymph nodes, tumor deposits, and TNM: are we getting better? J clin oncol. 2011;29(18):2487–2492. doi:10.1200/JCO.2011.34.6429
4. Benson AB
5. Liebig C, Ayala G, Wilks J, et al. Perineural invasion is an independent predictor of outcome in colorectal cancer. J clin oncol. 2009;27(31):5131–5137. doi:10.1200/JCO.2009.22.4949
6. Knijn N, van Exsel UEM, de Noo ME, Nagtegaal ID. The value of intramural vascular invasion in colorectal cancer - a systematic review and meta-analysis. Histopathology. 2018;72(5):721–728. doi:10.1111/his.13404
7. Compton CC. Colorectal Carcinoma: diagnostic, prognostic, and molecular features. Mod Pathol. 2003;16(4):376–388. doi:10.1097/01.MP.0000062859.46942.93
8. Kermanshahi TR, Magge D, Choudry H, et al. Mucinous and signet ring cell differentiation affect patterns of metastasis in colorectal carcinoma and influence survival. Int J Surg Pathol. 2017;25(2):108–117. doi:10.1177/1066896916664990
9. Huang Q, Qin H, Xiao J, et al. Association of tumor differentiation and prognosis in patients with rectal cancer undergoing neoadjuvant chemoradiation therapy. Gastroenterol Rep. 2019;7(4):283–290. doi:10.1093/gastro/goy045
10. Wang J, Shen J, Huang C, Cao M, Shen L. Clinicopathological significance of BRAF(V600E) mutation in colorectal cancer: an updated meta-analysis. J Cancer. 2019;10(10):2332–2341. doi:10.7150/jca.30789
11. Ahn TS, Jeong D, Son MW, et al. The BRAF mutation is associated with the prognosis in colorectal cancer. J Cancer Res Clin Oncol. 2014;140(11):1863–1871. doi:10.1007/s00432-014-1735-y
12. Zlobec I, Bihl MP, Schwarb H, Terracciano L, Lugli A. Clinicopathological and protein characterization of BRAF- and K-RAS-mutated colorectal cancer and implications for prognosis. Int j Cancer. 2010;127(2):367–380. doi:10.1002/ijc.25042
13. Sepulveda AR, Hamilton SR, Allegra CJ, et al. Molecular biomarkers for the evaluation of colorectal cancer: guideline from the American society for clinical pathology, college of American pathologists, association for molecular pathology, and American society of clinical oncology. J Mol Diagn. 2017;19(2):187–225. doi:10.1016/j.jmoldx.2016.11.001
14. Bae JM, Wen X, Kim TS, et al. Fibroblast growth factor receptor 1 (FGFR1) amplification detected by droplet digital polymerase chain reaction (ddPCR) is a prognostic factor in colorectal cancers. Cancer Res Treat. 2019;52(1):74.
15. Takegawa N, Yonesaka K. HER2 as an emerging oncotarget for colorectal cancer treatment after failure of anti-epidermal growth factor receptor therapy. Clin Colorectal Cancer. 2017;16(4):247–251. doi:10.1016/j.clcc.2017.03.001
16. Zhang JX, Song W, Chen ZH, et al. Prognostic and predictive value of a microRNA signature in stage II colon cancer: a microRNA expression analysis. Lancet Oncol. 2013;14(13):1295–1306. doi:10.1016/S1470-2045(13)70491-1
17. Cantini L, Isella C, Petti C, et al. MicroRNA-mRNA interactions underlying colorectal cancer molecular subtypes. Nat Commun. 2015;6(1):8878. doi:10.1038/ncomms9878
18. Fennell L, Dumenil T, Wockner L, et al. Integrative genome-scale DNA methylation analysis of a large and unselected cohort reveals five distinct subtypes of colorectal adenocarcinomas. Cell Mol Gastroenterol Hepatol. 2019;8(2):269–290. doi:10.1016/j.jcmgh.2019.04.002
19. Guinney J, Dienstmann R, Wang X, et al. The consensus molecular subtypes of colorectal cancer. Nat Med. 2015;21(11):1350–1356. doi:10.1038/nm.3967
20. Del Rio M, Molina F, Bascoul-Mollevi C, et al. Gene expression signature in advanced colorectal cancer patients select drugs and response for the use of leucovorin, fluorouracil, and irinotecan. J clin oncol. 2007;25(7):773–780. doi:10.1200/JCO.2006.07.4187
21. Dou R, Deng Y, Huang L, et al. Multi-microarray identifies lower AQP9 expression in adjuvant chemotherapy nonresponders with stage III colorectal cancer. Cancer Lett. 2013;336(1):106–113. doi:10.1016/j.canlet.2013.04.017
22. Irizarry RA, Bolstad BM, Collin F, Cope LM, Hobbs B, Speed TP. Summaries of Affymetrix GeneChip probe level data. Nucleic Acids Res. 2003;31(4):e15. doi:10.1093/nar/gng015
23. Gautier L, Cope L, Bolstad BM, Irizarry RA. affy--analysis of Affymetrix GeneChip data at the probe level. Bioinformatics. 2004;20(3):307–15. doi:10.1093/bioinformatics/btg405
24. Ritchie ME, Phipson B, Wu D, et al. limma powers differential expression analyses for RNA-sequencing and microarray studies. Nucleic Acids Res. 2015;43(7):e47. doi:10.1093/nar/gkv007
25. Liberzon A, Subramanian A, Pinchback R, Thorvaldsdottir H, Tamayo P, Mesirov JP. Molecular signatures database (MSigDB) 3.0. Bioinformatics. 2011;27(12):1739–1740. doi:10.1093/bioinformatics/btr260
26. Liberzon A, Birger C, Thorvaldsdottir H, Ghandi M, Mesirov JP, Tamayo P. The molecular signatures database (MSigDB) hallmark gene set collection. Cell Systems. 2015;1(6):417–425. doi:10.1016/j.cels.2015.12.004
27. Cabrero-de Las Heras S, Martinez-Balibrea E. CXC family of chemokines as prognostic or predictive biomarkers and possible drug targets in colorectal cancer. World j Gastroenterol. 2018;24(42):4738–4749. doi:10.3748/wjg.v24.i42.4738
28. D’Alterio C, Avallone A, Tatangelo F, et al. A prognostic model comprising pT stage, N status, and the chemokine receptors CXCR4 and CXCR7 powerfully predicts outcome in neoadjuvant resistant rectal cancer patients. Int j Cancer. 2014;135(2):379–390. doi:10.1002/ijc.28689
29. Verbeke H, Struyf S, Laureys G, Van Damme J. The expression and role of CXC chemokines in colorectal cancer. Cytokine Growth Factor Rev. 2011;22(5–6):345–358. doi:10.1016/j.cytogfr.2011.09.002
30. Paoli P, Giannoni E, Chiarugi P. Anoikis molecular pathways and its role in cancer progression. Biochim Biophys Acta. 2013;1833(12):3481–3498. doi:10.1016/j.bbamcr.2013.06.026
31. Cao Z, Livas T, Kyprianou N. Anoikis and EMT: lethal “Liaisons” during cancer progression. Crit Rev Oncog. 2016;21(3–4):155–168. doi:10.1615/CritRevOncog.2016016955
32. Venkatesh HS, Morishita W, Geraghty AC, et al. Electrical and synaptic integration of glioma into neural circuits. Nature. 2019;573(7775):539–545. doi:10.1038/s41586-019-1563-y
33. Venkataramani V, Tanev DI, Strahle C, et al. Glutamatergic synaptic input to glioma cells drives brain tumour progression. Nature. 2019;573(7775):532–538. doi:10.1038/s41586-019-1564-x
34. Zeng Q, Michael IP, Zhang P, et al. Synaptic proximity enables NMDAR signalling to promote brain metastasis. Nature. 2019;573(7775):526–531. doi:10.1038/s41586-019-1576-6
35. Wurzer H, Hoffmann C, Al Absi A, Thomas C. Actin cytoskeleton straddling the immunological synapse between cytotoxic lymphocytes and cancer cells. Cells. 2019;8(5):463. doi:10.3390/cells8050463
36. Bakker ER, Das AM, Helvensteijn W, et al. Wnt5a promotes human colon cancer cell migration and invasion but does not augment intestinal tumorigenesis in Apc1638N mice. Carcinogenesis. 2013;34(11):2629–2638. doi:10.1093/carcin/bgt215
37. Li G, Hu F, Luo X, Hu J, Feng Y. SIX4 promotes metastasis via activation of the PI3K-AKT pathway in colorectal cancer. PeerJ. 2017;5:e3394. doi:10.7717/peerj.3394
38. Zhou F, Huang X, Zhang Z, et al. Functional polymorphisms of ITGB1 are associated with clinical outcome of Chinese patients with resected colorectal cancer. Cancer Chemother Pharmacol. 2015;75(6):1207–1215. doi:10.1007/s00280-015-2745-4
39. Jang BG, Kim HS, Chang WY, Bae JM, Kang GH. Prognostic significance of EPHB2 expression in colorectal cancer progression. J Pathol Transl Med. 2018;52(5):298–306. doi:10.4132/jptm.2018.06.29
40. Viana Lde S, Affonso RJ
41. Chen MC, Baskaran R, Lee NH, et al. CXCL2/CXCR2 axis induces cancer stem cell characteristics in CPT-11-resistant LoVo colon cancer cells via Galphai-2 and Galphaq/11. J Cell Physiol. 2019;234(7):11822–11834. doi:10.1002/jcp.27891
42. Hu B, Fan H, Lv X, Chen S, Shao Z. Prognostic significance of CXCL5 expression in cancer patients: a meta-analysis. Cancer Cell Int. 2018;18(1):68. doi:10.1186/s12935-018-0562-7
43. Liu Z, Sun B, Qi L, et al. Dickkopf-1 expression is down-regulated during the colorectal adenoma-carcinoma sequence and correlates with reduced microvessel density and VEGF expression. Histopathology. 2015;67(2):158–166. doi:10.1111/his.12474
44. Cao B, Luo L, Feng L, et al. A network-based predictive gene-expression signature for adjuvant chemotherapy benefit in stage II colorectal cancer. BMC Cancer. 2017;17(1):844. doi:10.1186/s12885-017-3821-4
45. Gao S, Tibiche C, Zou J, et al. Identification and construction of combinatory cancer hallmark-based gene signature sets to predict recurrence and chemotherapy benefit in stage II colorectal cancer. JAMA oncol. 2016;2(1):37–45. doi:10.1001/jamaoncol.2015.3413
 © 2020 The Author(s). This work is published and licensed by Dove Medical Press Limited. The
full terms of this license are available at https://www.dovepress.com/terms
and incorporate the Creative Commons Attribution
- Non Commercial (unported, 3.0) License.
By accessing the work you hereby accept the Terms. Non-commercial uses of the work are permitted
without any further permission from Dove Medical Press Limited, provided the work is properly
attributed. For permission for commercial use of this work, please see paragraphs 4.2 and 5 of our Terms.
© 2020 The Author(s). This work is published and licensed by Dove Medical Press Limited. The
full terms of this license are available at https://www.dovepress.com/terms
and incorporate the Creative Commons Attribution
- Non Commercial (unported, 3.0) License.
By accessing the work you hereby accept the Terms. Non-commercial uses of the work are permitted
without any further permission from Dove Medical Press Limited, provided the work is properly
attributed. For permission for commercial use of this work, please see paragraphs 4.2 and 5 of our Terms.