")
Back to Journals » OncoTargets and Therapy » Volume 13
Gene Expression Along with Genomic Copy Number Variation and Mutational Analysis Were Used to Develop a 9-Gene Signature for Estimating Prognosis of COAD
Authors Lu Y, Wu S, Cui C, Yu M, Wang S, Yue Y, Liu M, Sun Z
Received 2 April 2020
Accepted for publication 19 August 2020
Published 14 October 2020 Volume 2020:13 Pages 10393—10408
DOI https://doi.org/10.2147/OTT.S255590
Checked for plagiarism Yes
Review by Single anonymous peer review
Peer reviewer comments 2
Editor who approved publication: Dr Federico Perche
Yiping Lu, Si Wu, Changwan Cui, Miao Yu, Shuang Wang, Yuanyi Yue, Miao Liu, Zhengrong Sun
BioBank, The Affiliated Shengjing Hospital, China Medical University, Shenyang, Liaoning 110004, People’s Republic of China
Correspondence: Zhengrong Sun
BioBank, The Affiliated Shengjing Hospital, China Medical University, Shenyang, Liaoning 110004, People’s Republic of China
Tel/ Fax +86-24-83283768
Email [email protected]
Purpose: This study aims to systematically analyze multi-omics data to explore new prognosis biomarkers in colon adenocarcinoma (COAD).
Materials and Methods: Multi-omics data of COAD and clinical information were obtained from The Cancer Genome Atlas (TCGA). Univariate Cox analysis was used to select genes which significantly related to the overall survival. GISTIC 2.0 software was used to identify significant amplification or deletion. Mutsig 2.0 software was used to identify significant mutation genes. The 9-gene signature was screened by random forest algorithm and Cox regression analysis. GSE17538 dataset was used as an external dataset to verify the predictive ability of 9-gene signature. qPCR was used to detect the expression of 9 genes in clinical specimens.
Results: A total of 71 candidate genes are obtained by integrating genomic variation, mutation and prognostic data. Then, 9-gene signature was established, which includes HOXD12, RNF25, CBLN3, DOCK3, DNAJB13, PYGO2, CTNNA1, PTPRK, and NAT1. The 9-gene signature is an independent prognostic risk factor for COAD patients. In addition, the signature shows good predicting performance and clinical practicality in training set, testing set and external verification set. The results of qPCR based on clinical samples showed that the expression of HOXD12, RNF25, CBLN3, DOCK3, DNAJB13, and PYGO2 was increased in colon cancer tissues and the expression of CTNNA1, PTPRK, NAT1 was decreased in colon cancer tissues.
Conclusion: In this study, 9-gene signature is constructed as a new prognostic marker to predict the survival of COAD patients.
Keywords: COAD, multi-omics, 9-gene signature, prognosis biomarkers
Introduction
Colon adenocarcinoma (COAD) is a common malignant tumor of the digestive system. It is the fourth leading cause of cancer-related death in the world.1,2 Although much progress has been made in surgical and complementary therapy of COAD in recent years, the prognosis of patients with COAD is still poor.3 The main reason is that the pathogenesis of COAD is complex. Most patients are in the advanced stage at the time of diagnosis, losing the opportunity of surgical treatment.4 Therefore, in-depth research on COAD prognostic markers and potential drug targets to provide new means of diagnosis and treatment will greatly improve patients’ chances of survival.
The formation and development of COAD are accompanied by complex and varied genetic molecular mechanisms. COADs with the same pathological characteristics may have different molecular pathogenesis. The prognosis of patients is also quite different from each other. Therefore, molecular markers show potential value in COAD diagnosis and prognosis. A variety of markers have been used to screen and diagnose COAD. For example, the level of carcinoembryonic antigen is closely related to lymph node metastasis and tumor stage in cancer. It can be used as a screening marker for COAD patients.5 Epidermal growth factor receptor (EGFR) and vascular endothelial growth factor (VEGF) are significantly correlated with KI-67 and prognosis in COAD.6 In addition, as far as miRNA biomarkers are concerned, the combination of miR-378, miR-199a and miR-92a in plasma is considered as an effective way to distinguish COAD cases from normal controls.7 However, these indicators are not suitable for clinical practice because of their low specificity and lack of clinical evidence. Therefore, there is an urgent need to accurately classify COAD patients and explore its molecular mechanism in depth to screen specific molecular markers. This requires a broader understanding of the heterogeneity of genome and transcriptome level.
There had been plenty of previous studies trying to screen and construct a prognostic marker model for colon cancer. Smith et al8 identified a metastasis gene expression profile derived from experiment to predict colon cancer recurrence and death. Gao et al9 constructed cancer hallmark-based gene signature to predict recurrence and chemotherapy benefit of colorectal cancer patients. In addition, some recent studies have shown that VEGF could be used as a prognostic indicator, but cannot predict the response of advanced CRC to VEGF targeted therapy.10,11 In addition, CEA level is an independent prognostic factor for colon cancer, and can be used with TNM staging of colon cancer.12,13 As far as miRNA prognosis signatures are concerned, Rong et al identified 6-miRNA signature to predict overall survival;14 another study constructed 4 lncRNA-miRNA prognostic signature for stage II colon cancer patients by integrating miRNA and lncRNA data15. However, no studies construct colon cancer prognostic signature using multiple omics data.
The study establishes 9-gene signature by integrating genomic copy number variation, mutation and prognostic data. It has stable robustness in internal and external validation sets. Moreover, 9-gene signature is found to be involved in the important pathway and independent prognostic risk factors in COAD patients. In conclusion, the 9-gene signature constructed in this study can be used as a potential target for COAD treatment.
Materials and Methods
Data Acquisition and Processing
Level-3 RNA-sequencing data, the clinicopathological、 SNP 、 copy number segments and survival data of patients with COAD were downloaded from the UCSC Xena browser (https://xenabrowser.net/). The mutation Annotation Format (MAF) is downloaded from GDC client. The GSE17538 expression profile data and clinical follow-up information are downloaded from the GEO database. The samples of TCGA are randomly divided into two groups. The TCGA training set contains 226 samples and the test set contains 227 samples. As an external validation set, the GSE17538 data set contains a total of 244 samples, including 6 mouse samples, while among the 238 human samples, 38 samples recorded the survival status of NA, and finally used for follow-up analysis.
Univariate Cox Proportional Risk Regression Analysis
As Guo, J et al16 univariate Cox proportional risk regression analysis is performed for each gene in this paper. The genes significantly related to the overall survival (OS) of patients in the training cohort are identified. p < 0.05 is selected as the threshold.
Copy Number Variation Data Analysis
GISTIC is widely used to detect both broad and focal (potentially overlapping) recurring events. GISTIC 2.017 software is used to identify the genes with significant amplification or deletion, with parameter thresholds of amplification, and deletion length greater than 0.1 and p<0.05.
Gene Mutation Analysis
Mutsig 2.0 software is used to identify significant mutation genes in the maf file of TCGA mutation data. The threshold is p < 0.05.
Construction of Prognostic Gene Signature
In this study, prognostic genes with copy number amplification/deletion and mutation are selected. Random survival forest algorithm is used to sequence the importance of common genes.18,19 The number of Monte Carlo iterations is set to 100 and the number of steps forward is set to 5. The genes with relative importance greater than 0.4 are identified as feature genes. Multivariate Cox regression analysis is further carried out to construct the following risk scoring model: RiskScore = ∑Expk * eHRk k=2. In the model, N represents the number of prognostic genes. Expk represents the expression value of prognostic genes. eHRk represents the estimated regression coefficient of genes in the multivariate Cox regression analysis.
Functional Enrichment Analysis
Gene Ontology (GO) and Kyoto Encyclopedia of Genes and Genomes (KEGG) pathway enrichment analysis is performed using the R package clusterprofiler20 to identify over-represented GO terms in KEGG pathway and three categories (biological processes, molecular function and cellular component). For this analysis, a false discovery rate (FDR) <0 0.05 is considered to denote statistical significance.
Gene Set Enrichment Analysis (GSEA)
GSEA is performed by the JAVA program (http://software.broadinstitute.org/gsea/downloads.jsp) using the MSigDB C2 Canonical pathways gene set collection, which contains 1320 gene sets. Gene sets with a FDR value less than 0.05 after performing 1000 permutations are considered to be significantly enriched.
Quantitative PCR (qPCR)
Twenty specimens were obtained from colon cancer patients which had undergone surgery. Normal tissues were mean paired with tumor biopsies from the same patient. Among the 20 patients, 10 patients were in stage 1, 6 patients were in stage 2, and 4 patients were in stage 3. None of these patients had undergone any therapy include chemotherapy or radiotherapy before surgery. We got the informed consent of every patient, and was approved by The Human Ethics Review Committee of the Shengjing hospital of China Medical University. This study is in accordance with the Declaration of Helsinki and got written informed consent from patients. And, this is a retrospective analysis, and has not been obtained prospectively and consecutively. Total RNA was extracted using TRIzol reagent (Invitrogen, Carlsbad, CA, USA) following the manufacturer’s instructions. Complementary DNA (cDNA) was synthesized from high-quality total RNA using PrimeScript™ RT Master Mix (No. RR036A, Takara Bio USA, Mountain View, CA, USA). Real-time qPCR was performed to validate gene expression using Power SYBR™ Green PCR Master Mix (No. A25742, Thermo Fisher Scientific, Waltham, MA, USA) on the 7900HT Fast Real-Time PCR System (Applied Biosystems, Foster City, CA, USA). Relative expression was calculated based on 2-ΔΔCt method.
Statistical Analysis
A Kaplan-Meier (KM) curve is drawn when using the median risk score in each dataset as a cutoff to compare the survival risk between high-risk and low-risk groups. Multivariate Cox regression analysis is performed to test whether genetic markers are independent prognostic factors. Significance is defined as P < 0.05. All of these analyses are carried out in R 3.4.3.
Results
Preliminary Analysis of Multi-Omics Data to Obtain Prognostic Genes
Preprocessing Data Statistics
The specific distribution of including variables is shown in Table 1. Univariate cox analysis was used to identify 1639 prognostic genes with p < 0.05 in TCGA training set (Supplement Table 1). The information of the top 20 genes of the 1639 genes is shown in Table 2.
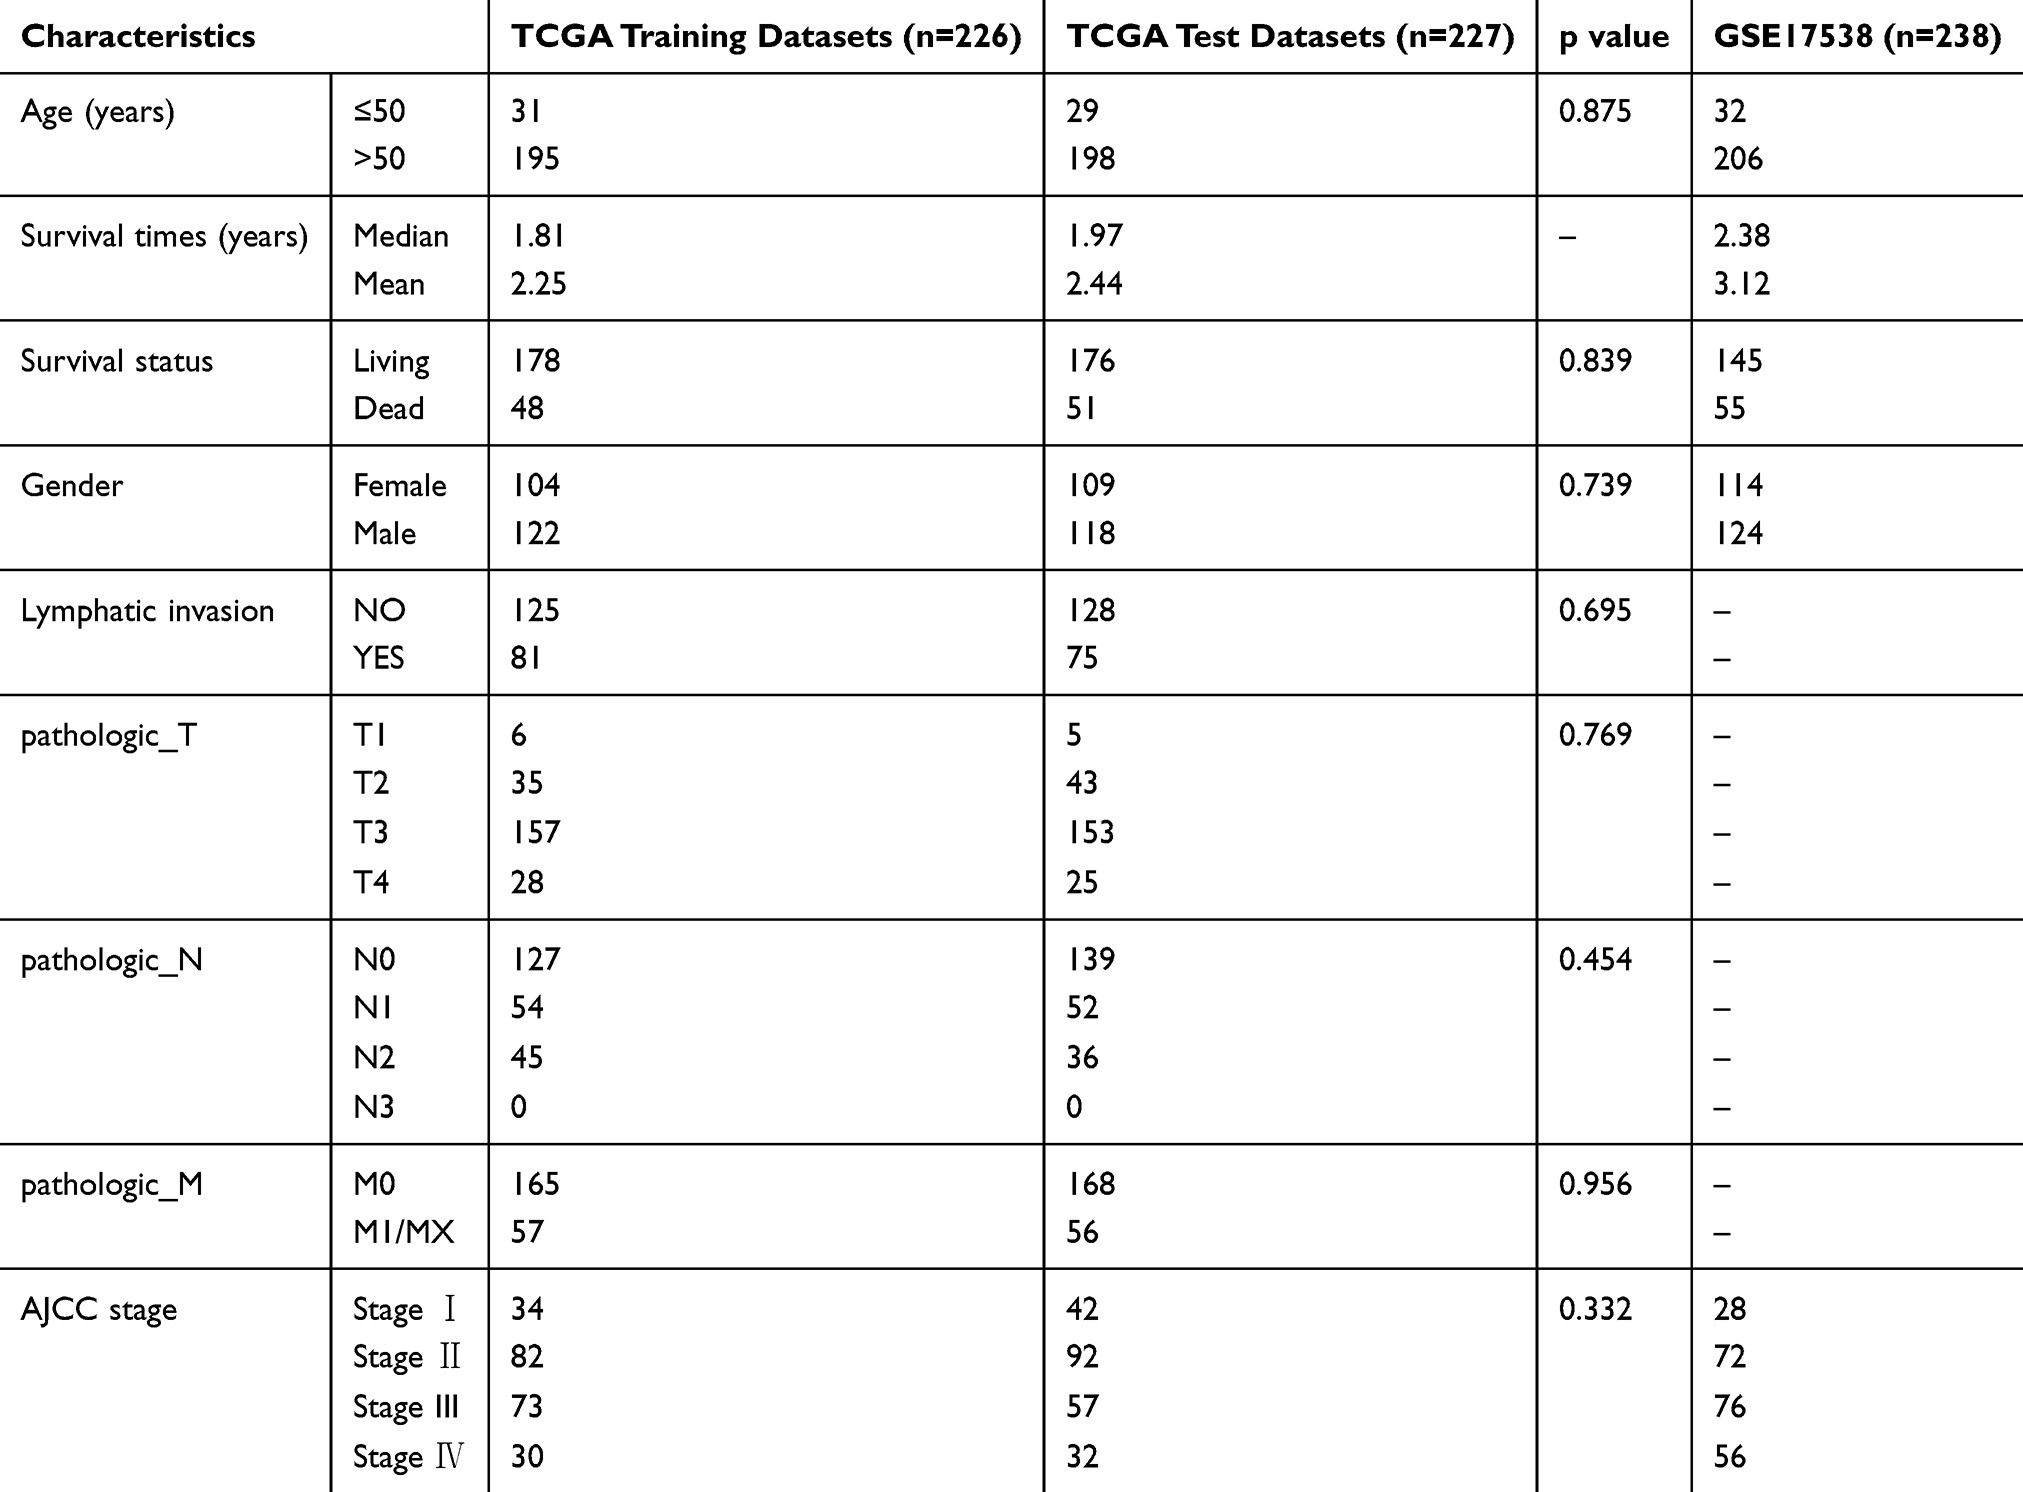 |
Table 1 Clinical Information Statistics |
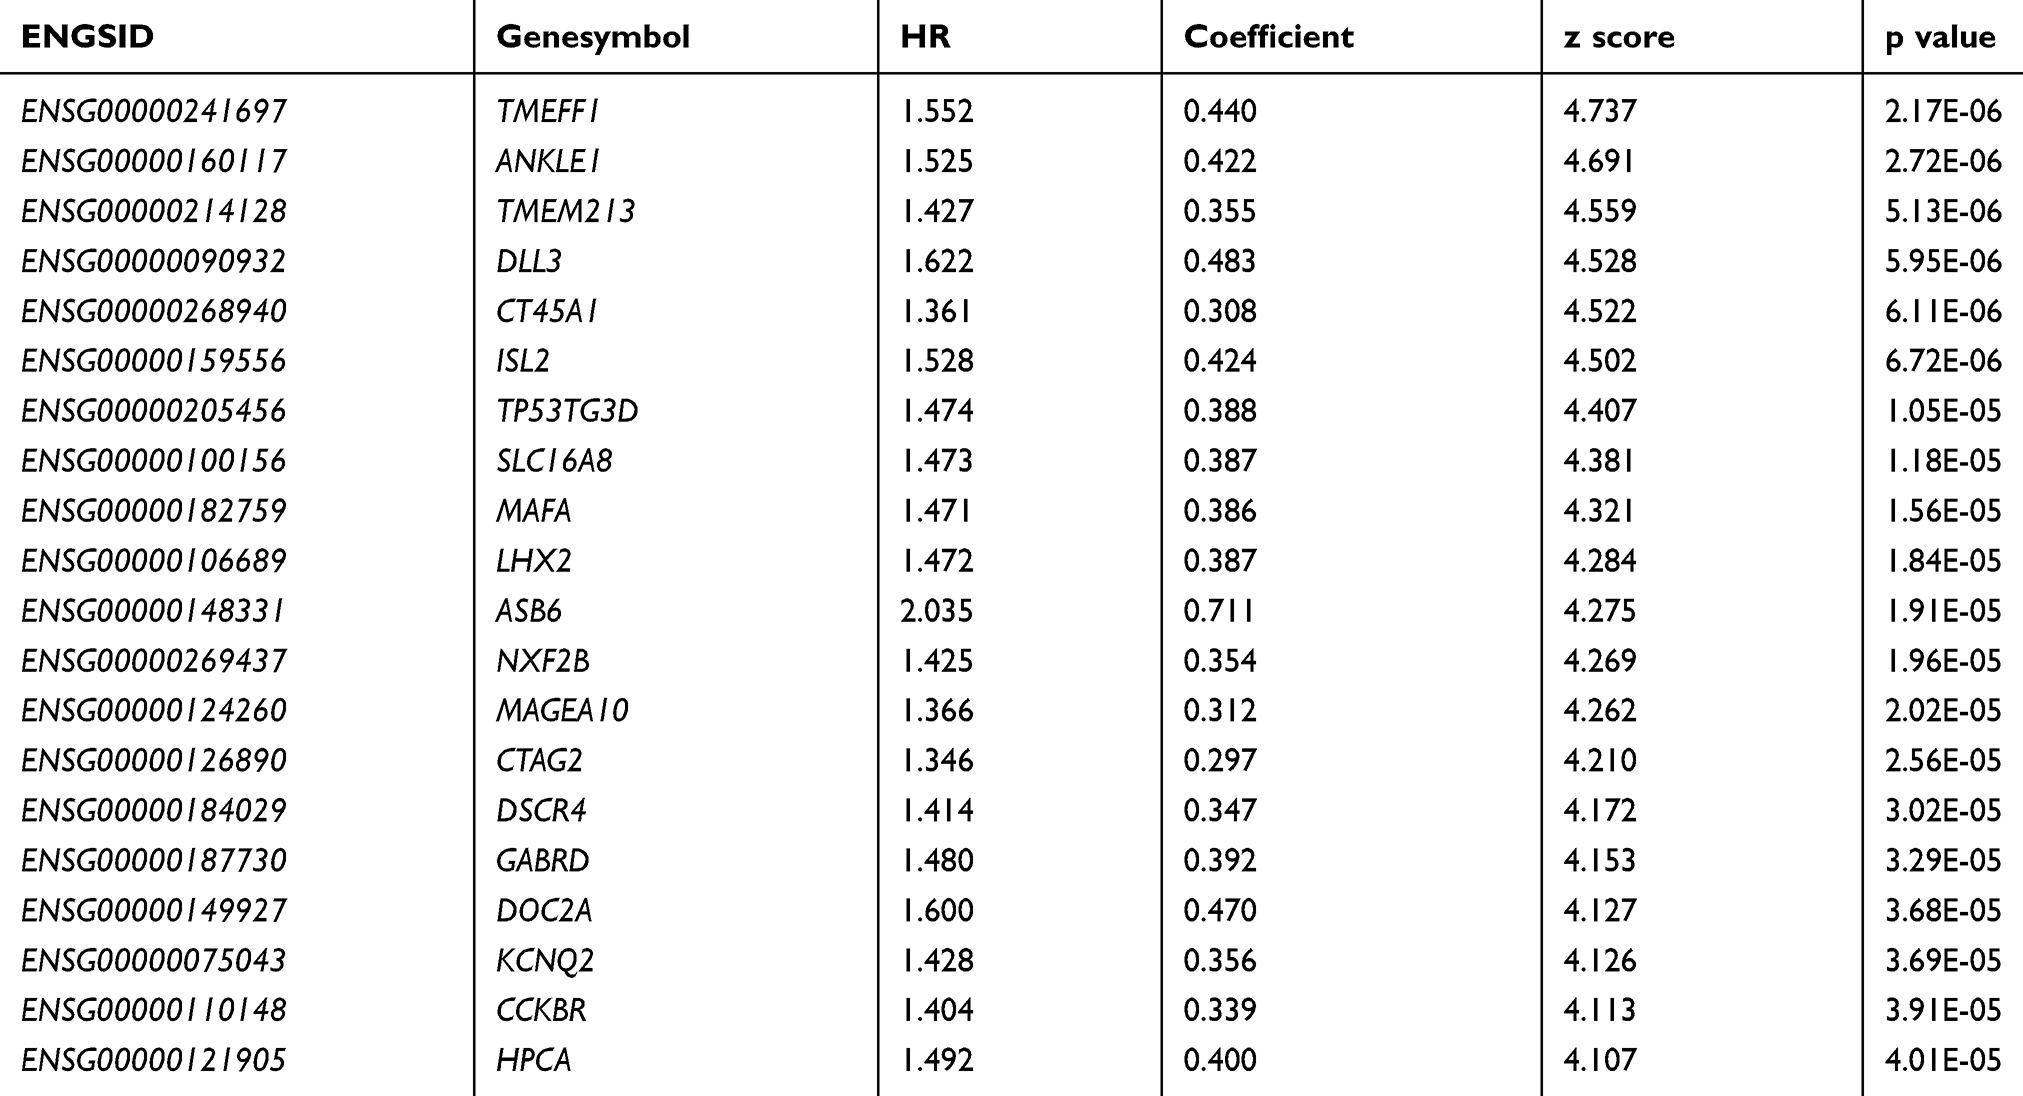 |
Table 2 Information on Top20 Prognosis-Related Genes |
Identification of 398 Genes with Copy Number Variation
The parameter threshold is a fragment with an amplification or deletion length greater than 0.1 and p < 0.05. Figure 1A shows a significantly amplified fragment in the COAD genome. Supplement Table 2 records the genes that have been significantly amplified on each fragment. For example, CCND2 significantly amplifies on the 12p13.32 fragment (q value = 1.38E-07). CCND3 significantly amplifies on the 6p21.1 fragment (q value = 0.0002804). VEGFA significantly amplifies on the 6p21.1 fragment (q value = 0.0002804). A total of 137 genes are amplified. Figure 1B shows fragments with significant deletions in the COAD genome. Supplement Table 3 records the genes that have significant deletion on each fragment. For example, RBFOX1 has significantly deletion on the 16p13.3 fragment (q value = 4.02E-44). SMAD4 has significant deletion on the 18q21.2 fragment (q value = 9.94E-15). APC has significant deletion on the 5q22.2 fragment (q value = 1.48E-05). A total of 261 genes have deletion.
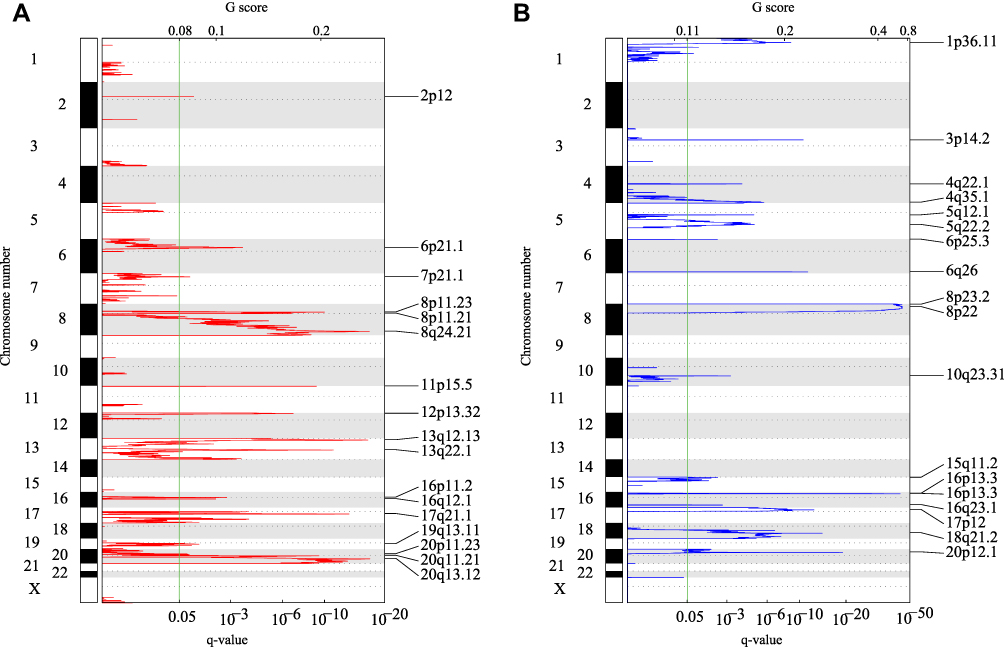 |
Figure 1 (A) Fragments with significant amplification in the COAD genome. (B) Fragments with significant deletion in the COAD genome. q represents the long arm of the chromosome, p represents the broken arm. |
Identification of 486 Mutant Genes
A total of 486 genes with significant mutation frequency are obtained with a threshold of p<0.05. Figure 2 shows the distribution of synonymous mutations, missense mutations, frame insertion or deletion, frame movement, nonsense mutations, cleavage sites and other non-synonymous mutations of 50 significant genes in TCGA COAD cohort. Among the identified 486 genes, some genes are closely related to the occurrence and development of cancer, such as KRAS, TP53, APC, PIK3CA, and FBXW7. By integrating copy number mutant genes and mutant genes, we identified 839 common genes, which are involved in tumor-related pathways and biological functions (Supplementary Figure 1).
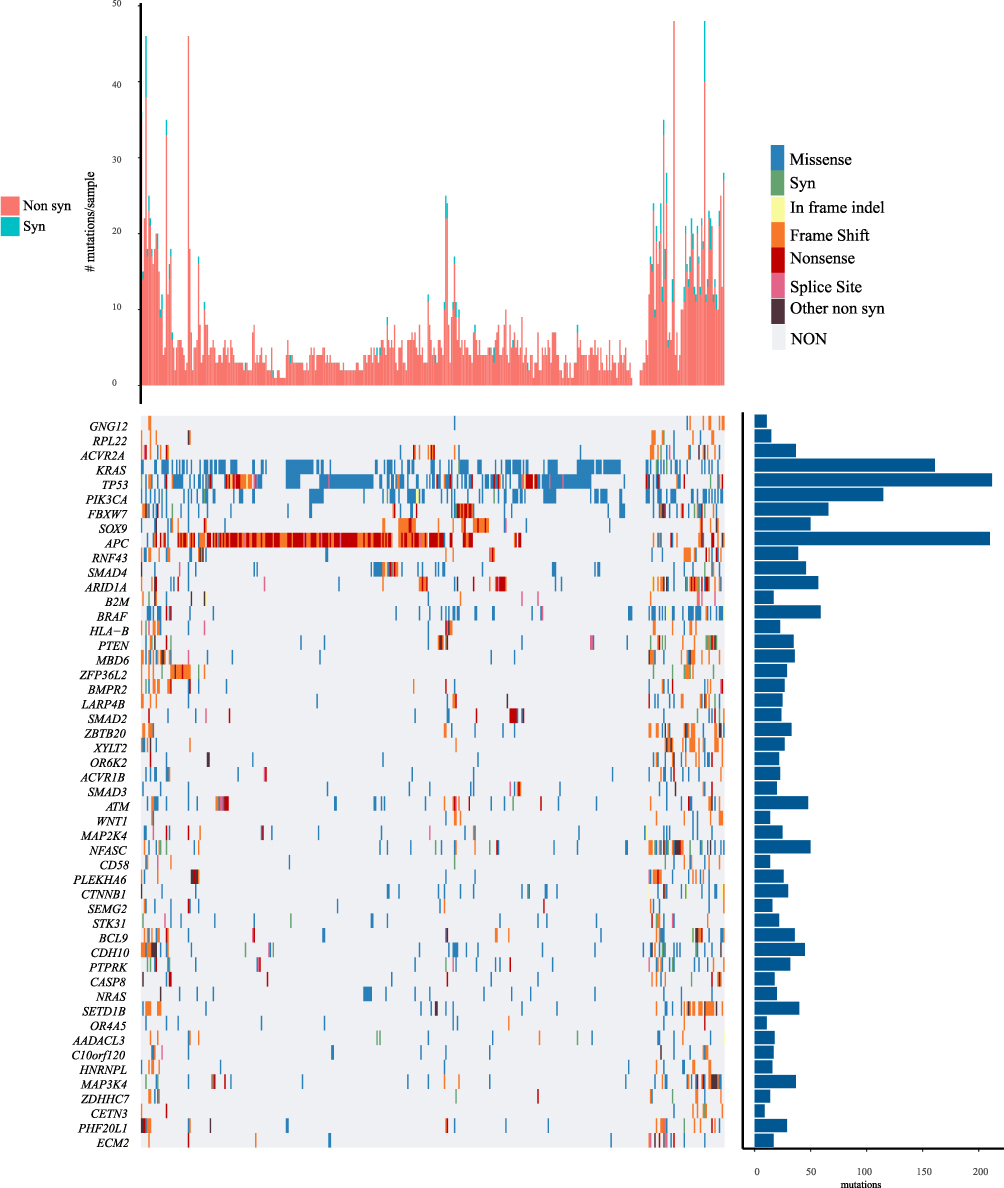 |
Figure 2 Distribution of top 50 genes with the most significant P value in COAD patients. The column chart on the top shows the total number of synonymous and non-synonymous mutations in 50 genes per patient. The column chart on the right shows the number of samples in which 50 genes have mutations in all samples. |
Identification of 9 Hub Genes Using Random Forest Algorithm
Among the 1639 candidate prognostic genes, 71 genes are identified to have copy number variation and mutation. The importance of prognostic genes is sequenced using R package random survival forest. Parameters are nrep = 100 and nstep = 5, which represent the number of Monte Carlo iterations is 100 and the number of steps forward is 5 (11), respectively. Genes with relative importance greater than 0.3 are identified as the final signature. Figure 3A shows the relationship between error rate and the number of classification trees. Figure 3B shows the importance sequencing of the first 9 genes out-of-bag.
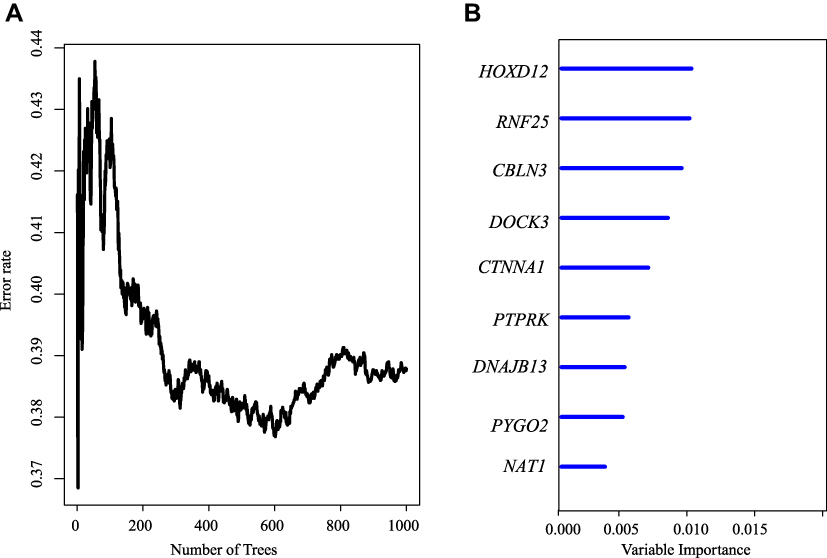 |
Figure 3 (A) Relationship between error rate and number of classification trees. The axe means number of trees. (B) Importance sequencing of the first five genes out-of-bag. The axe means variable importance. |
Establishing 9-Gene Signature to Divide Samples in TCGA Training Cohort
As for the identified 9-gene signature, the importance and relative importance of HR, Z score, p value, and out-of-bag for the univariate regression of the 9 genes are shown in Table 3. Then, the 9-gene signature is established using multivariate COX analysis. The signature is as follows (Supplement Table 4):
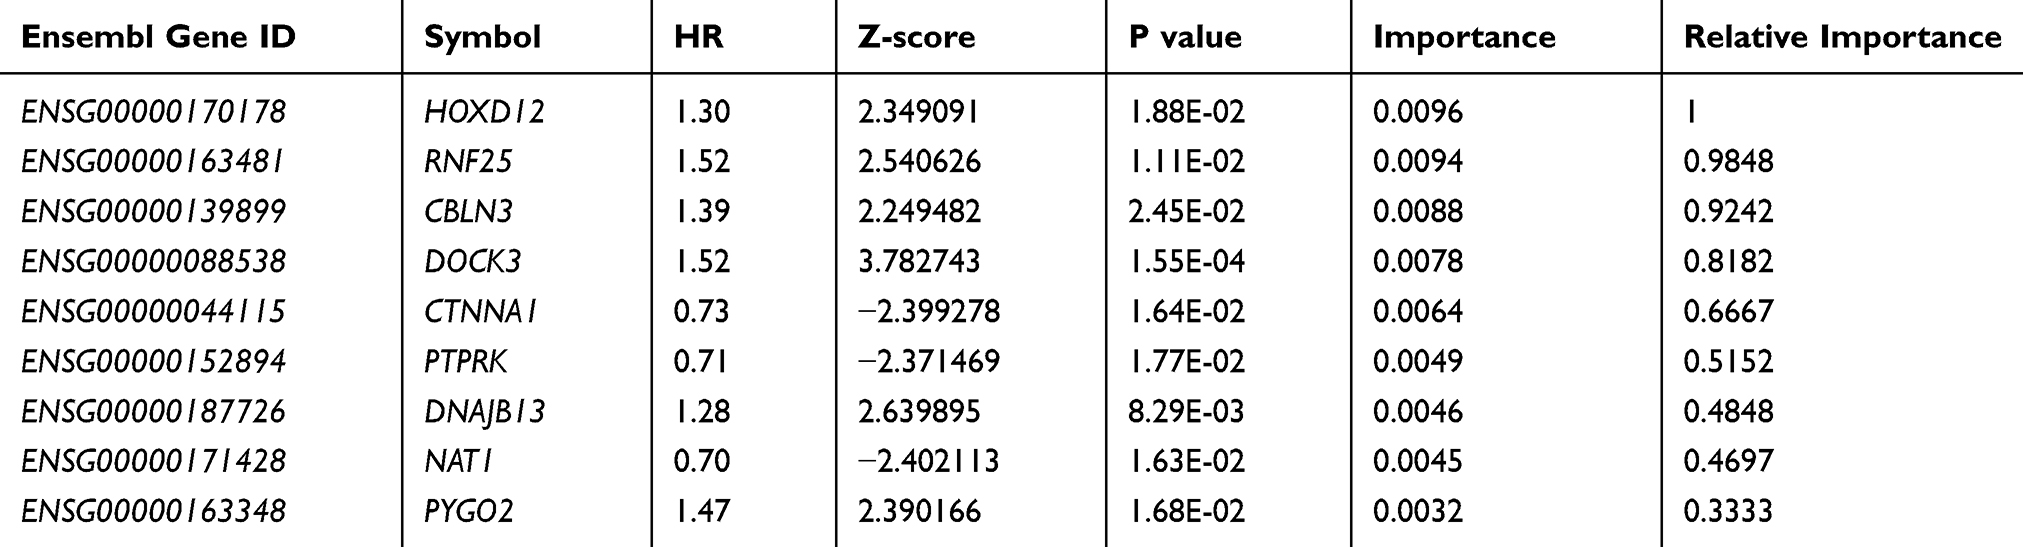 |
Table 3 9- Genes Significantly Associated with the Overall Survival in the Training Dataset |
Risk6 = 0.2929859 * HOXD12 + 0.1081464 * RNF25 + 0.06077754 * CBLN3 + 0.312247 * DOCK3 – 0.1765895 * CTNNA1 – 0.3442616 * PTPRK + 0.1121588 * DNAJB13 – 0.3093265 * NAT1 + 0.2425542 * PYGO2
The scoring formula for each sample is the addition of the above gene expression value * ordinal number. Then the sample score median −0.1002146 is selected as cutoff to divide samples into high-risk group and low-risk group. Figure 4 shows the classification effect in the TCGA training set. In Figure 4A, 113 patients are divided into the low-risk group and 113 patients are divided into the high-risk group. There are significant differences between the two groups. log-rank p=1.288372e-05. Figure 4B shows the ROC curve, where 5-year AUC is 0.76. Figure 4C shows that as the patient’s risk score increases, the patient’s survival time decreases. According to the expression changes of 9-gene signature, HOXD12, RNF25, CBLN3, DOCK3, DNAJB13, and PYGO2 are identified as risk factors, with high expression associated with high risk. CTNNA1, PTPRK, and NAT1 are identified as protective factors, with high expression associated with low risk.
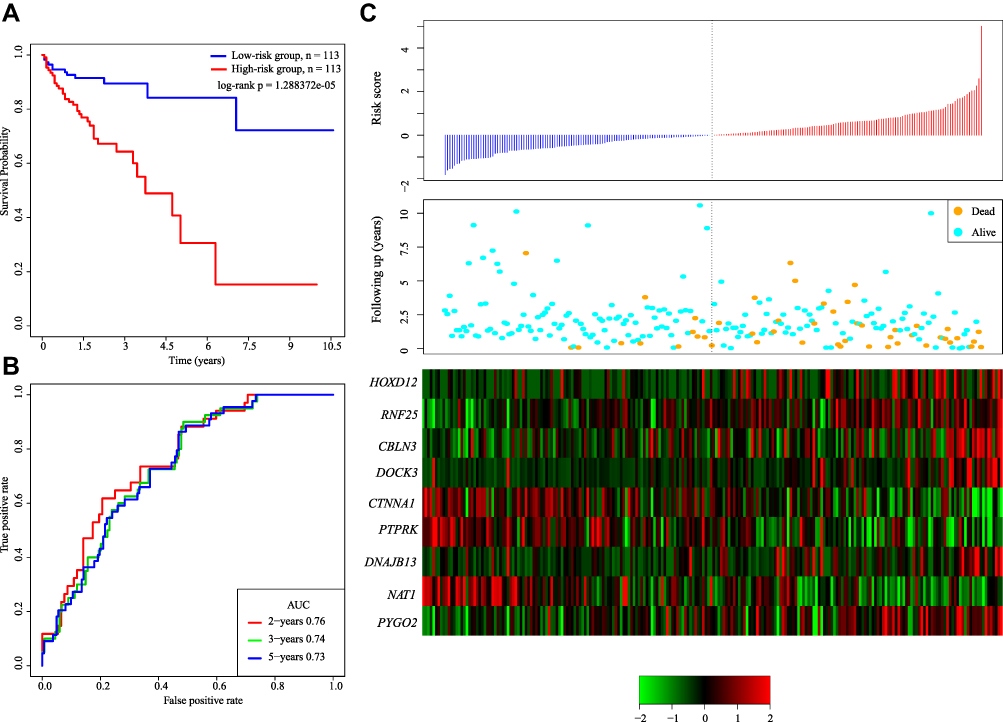 |
Figure 4 (A) KM survival curve of 9-gene signature distribution in TCGA training set. (B) ROC curve and AUC of 9-gene signature classification. (C) Risk score, survival time, survival status and expression of 9 genes in TCGA training set. |
Robustness Detection of 9-Gene Signature in TCGA Testing Cohort
In order to determine the robustness of the model, the same model and the same cutoff are used as the TCGA training set, which is verified in the TCGA testing set as well. In Figure 5A, 101 patients are divided into the low-risk group and 126 patients are divided into the high-risk group. There are significant differences between the two groups (log-rank p= 0.006360314). Figure 5B shows the 5-year ROC was 0.64. Figure 5C produces results similar to those of the TCGA training set. The survival time of death samples decreases significantly as the risk score increases.
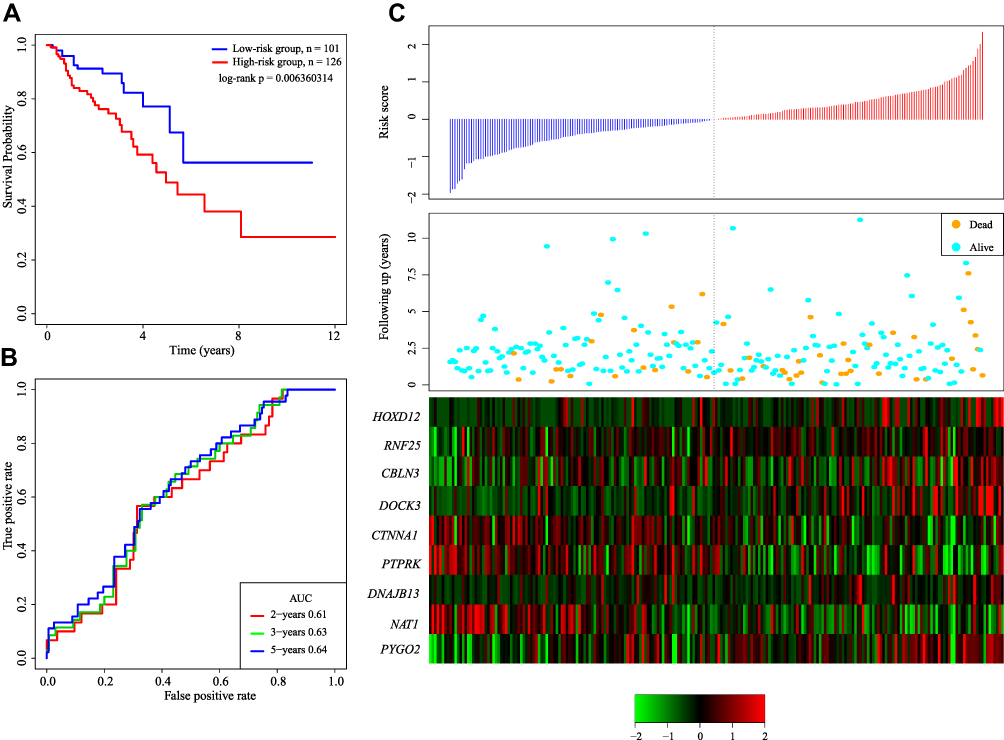 |
Figure 5 (A) KM survival curve of 9-gene signature distribution in TCGA testing set. (B) ROC curve and AUC of 9-gene signature classification. (C) Risk score, survival time, survival status and expression of 9 genes in TCGA training set. |
Validation of 9-Gene Signature in External Cohorts
External independent dataset GSE17538, GSE39582 and GSE24551 were used to determine the stable performance in predicting the prognosis. In Figure 6A, 79 patients are divided into the low-risk group and 121 patients are divided into the high-risk group. There are significant differences between the two groups (log-rank p= 0.027). Figure 6B shows the ROC curve with an average 5-year AUC is 0.60. Figure 6C shows that as the patient’s risk score increases, the patient’s survival time decreases. In the GSE39582 and GSE24551 cohorts, we found that the 9-gene signature can still significantly divide the two data sets into high and low-risk groups significantly. Among them, the 1-year AUC of GSE39582 is 0.68, and the 5-year AUC of GSE24551 is 0.63. Our research confirmed that our model has stable prediction performance and robustness on different platforms, and the external verification of multiple data sets minimizes the statistical deviation (Supplementary Figure 2).
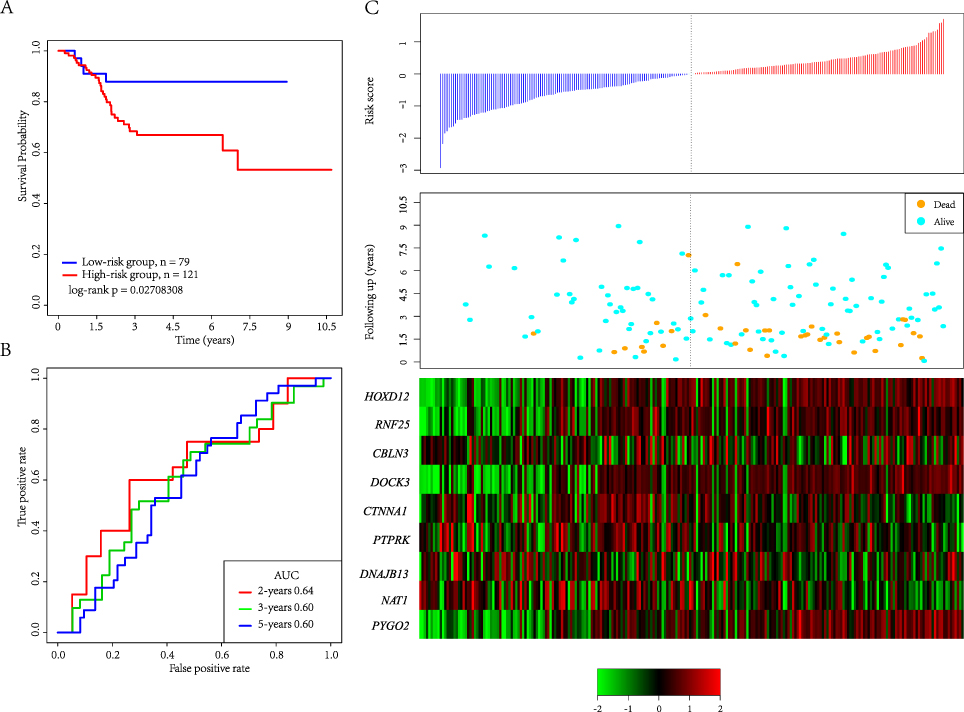 |
Figure 6 (A) KM survival curve of 9-gene signature distribution in GSE17538. (B) ROC curve and AUC of 9-gene signature classification. (C) Risk score, survival time, survival status and expression of 9 genes in GSE17538. |
Univariate and Multivariate Cox Regression Analysis
In order to identify the prognostic independence of 9-gene signature, univariate and multivariate COX regression were analyzed in TCGA training and testing cohort (Table 4). It showed that high-risk score (HR= 3.05, 95% CI = 1.36–6.84, p= 0.007), age >50 (HR= 1.04, 95% CI = 1.007–1.07, p= 0.016), AJCC Stage III/IV (HR= 37.58, 95% CI = 1.42–990.93, p= 0.030) were independent risk factors in multivariable cox analysis.
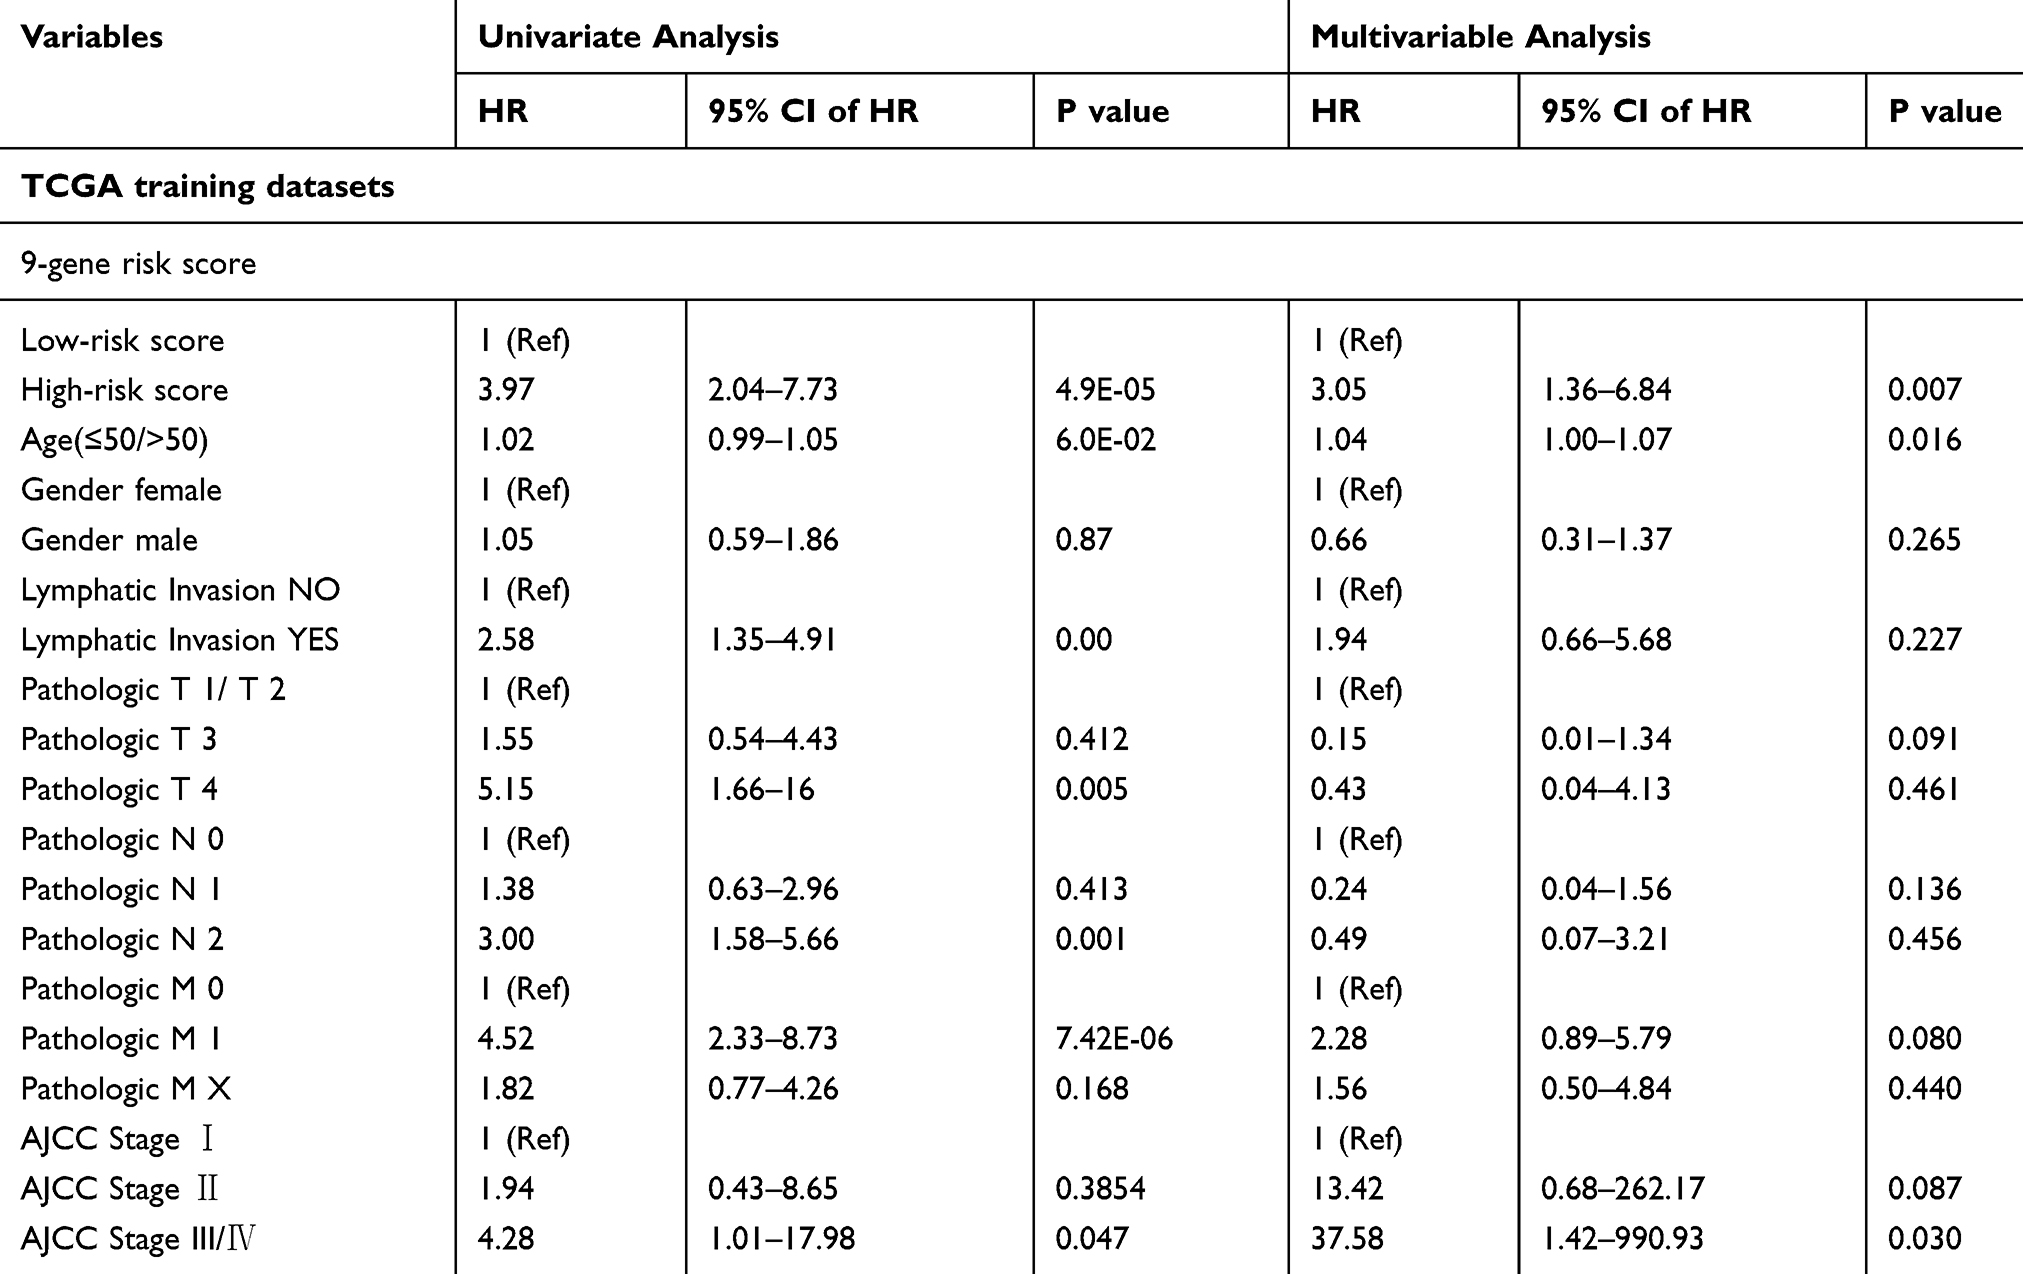 |
Table 4 Univariate and Multivariate Cox Regression Analyses |
We performed KM curve of different stages in the training cohort, and found that our model can significantly divide Stage II and Stage III patients into high- and low-risk groups, but no significance was found in Stage II and Stage IV because of a small number of samples (Supplementary Figure 3)
Analysis of Pathways Enriched in High-Risk and Low-Risk Groups Using GSEA
In TCGA training data set, GSEA is used to analyze the pathways enriched in high-risk and low-risk groups (Table 5). Due to the large number of KEGG pathways included in the analysis, and the FDR q values are not significant, so here we choose the first four results with the most significant p value to plot. As shown in Figure 7, KEGG ERBB SIGNALING PATHWAY, KEGG COLORECTAL CANCER, KEGG p53 SIGNALING PATHWAY, and KEGG TGF BETA SIGNALING PATHWAY, which are significantly enriched in both high-risk and low-risk groups, are closely related to the occurrence, development and metastasis of COAD (Figure 7).
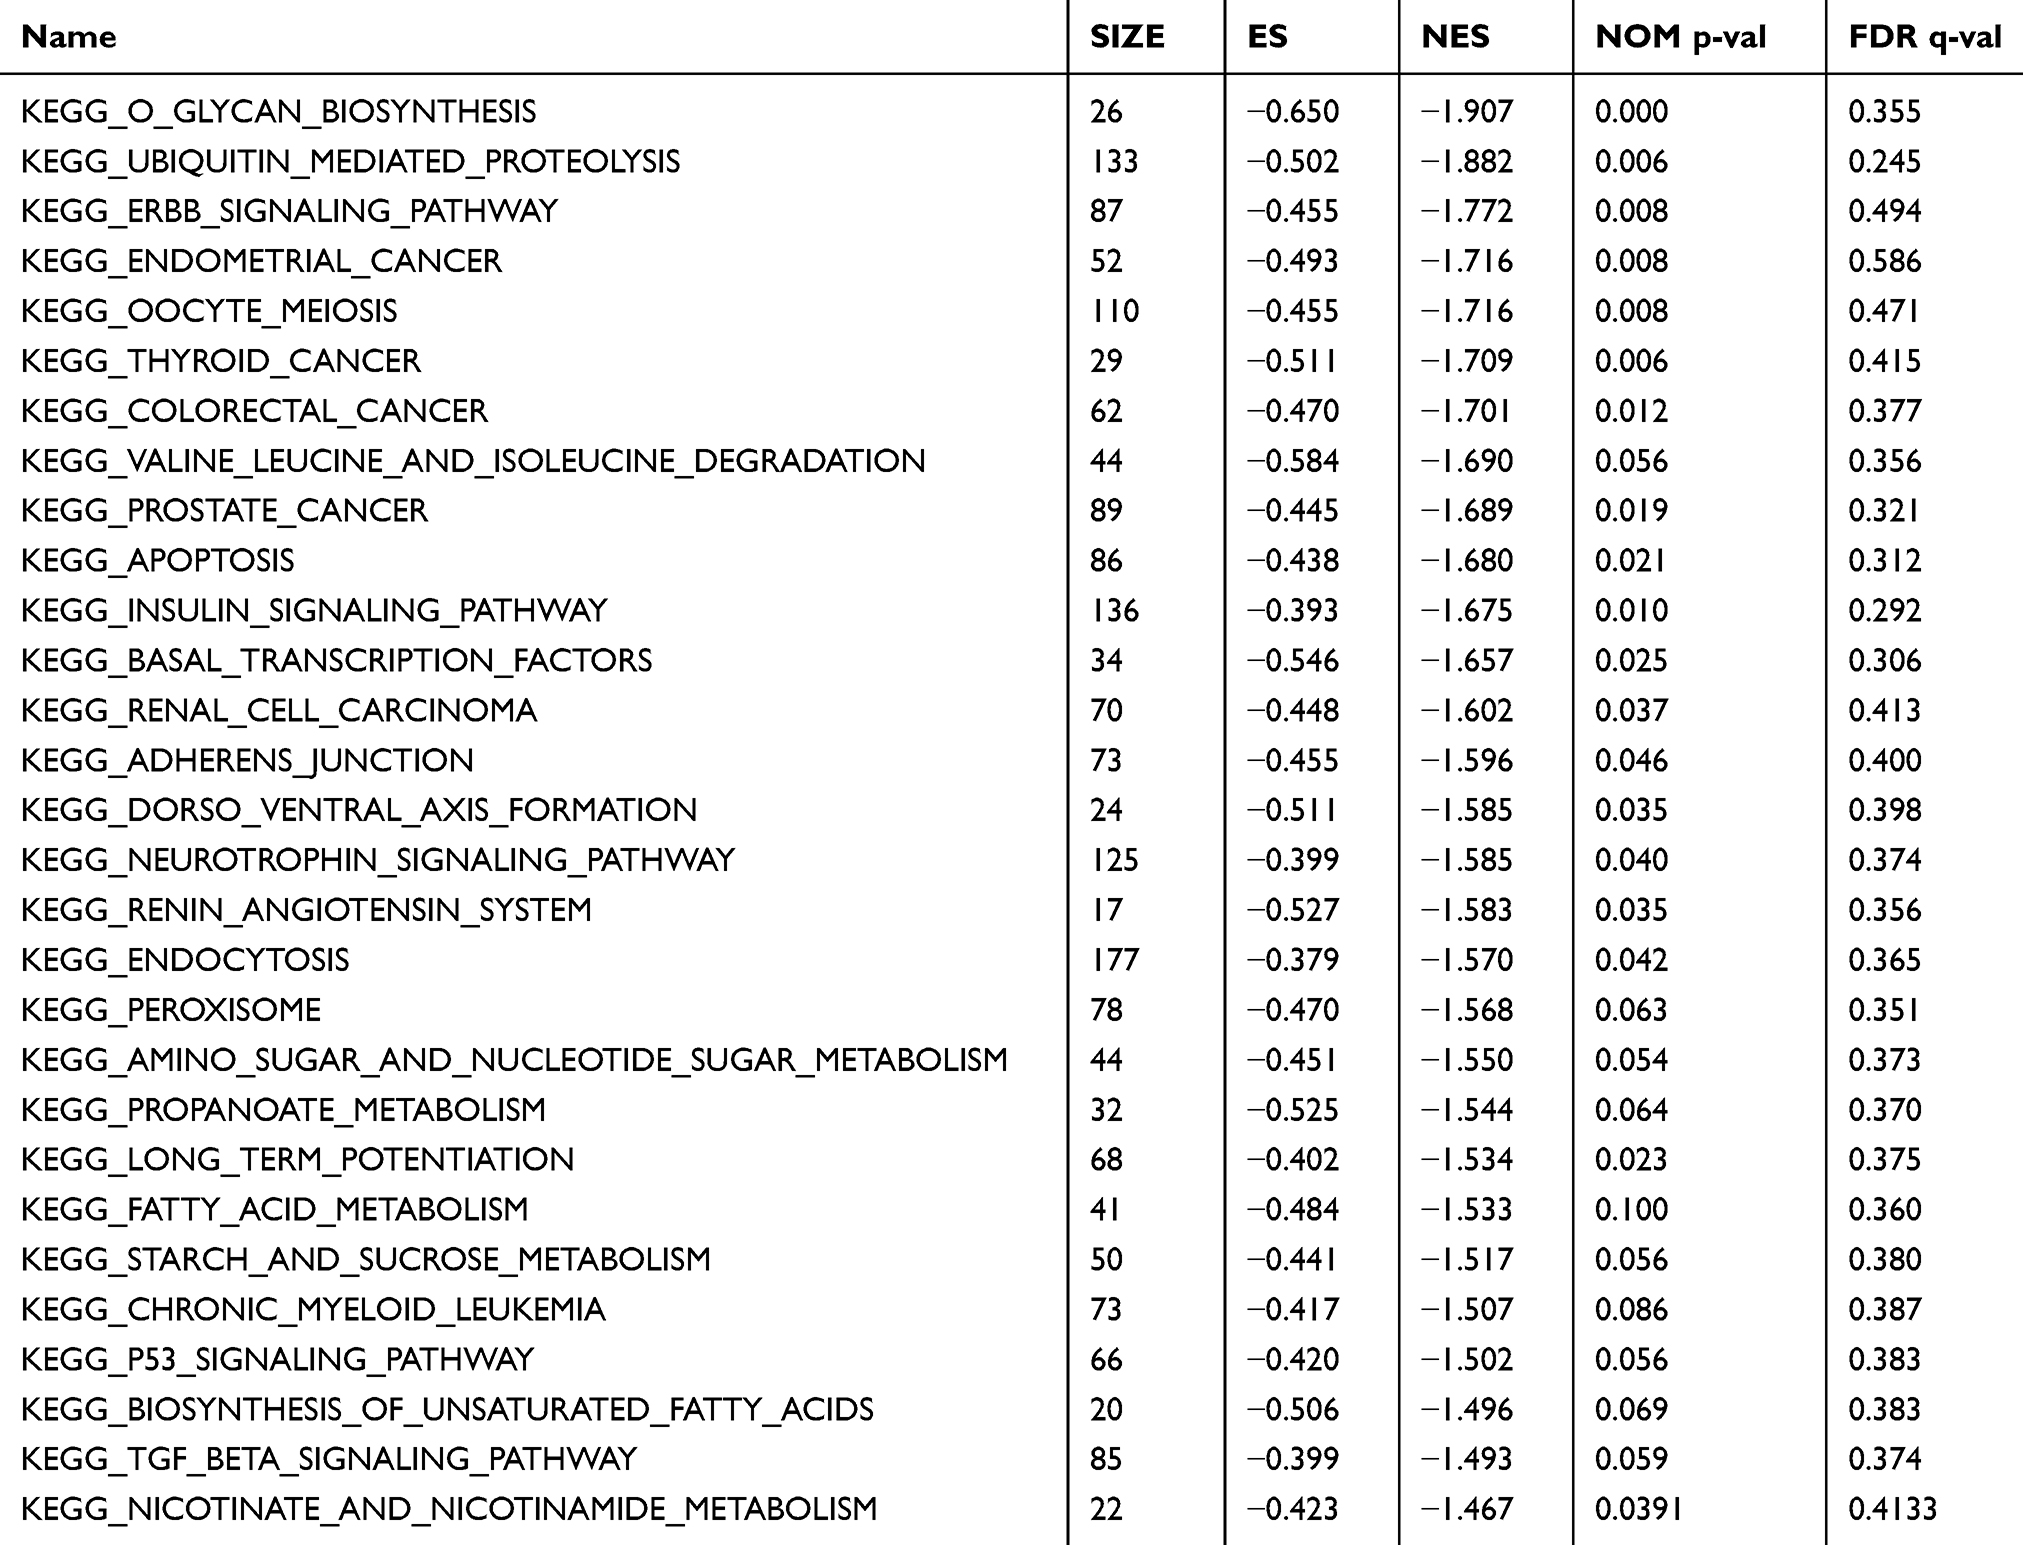 |
Table 5 GSEA Analysis of 9-Gene Signature |
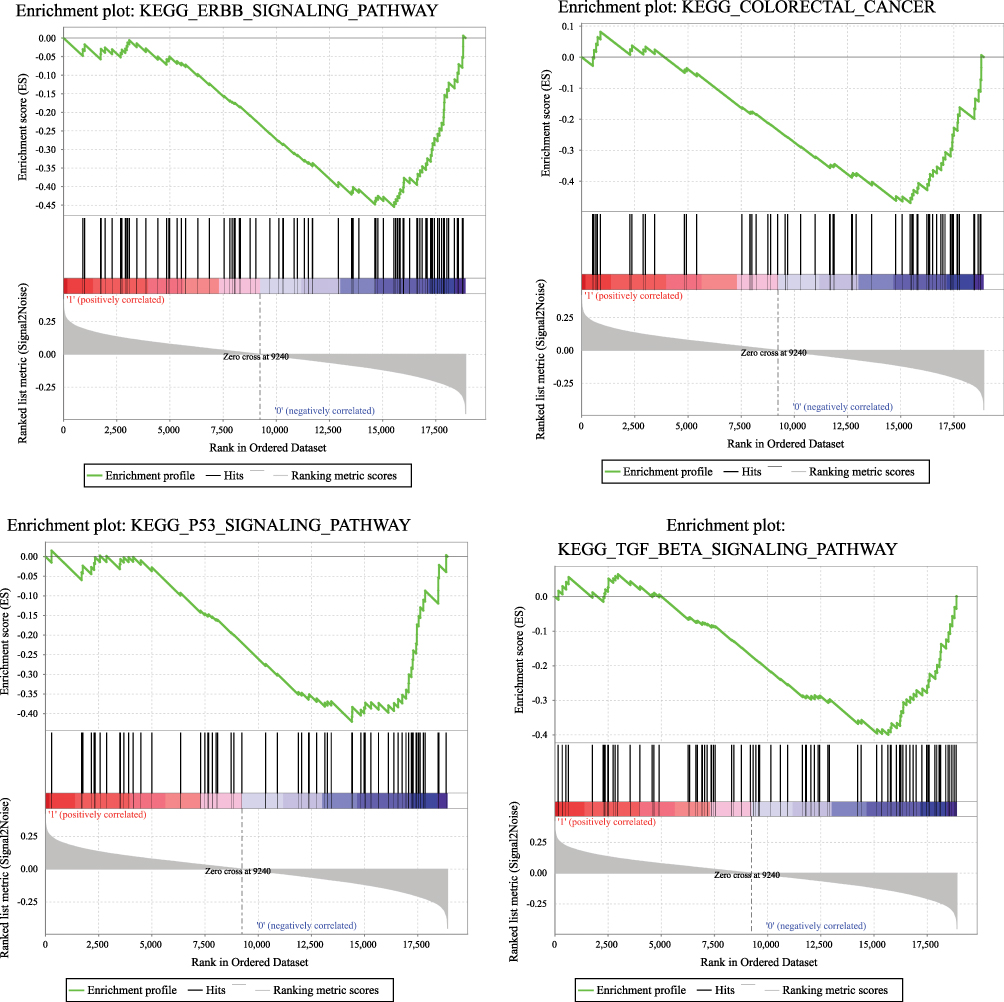 |
Figure 7 Pathways enriched in high-risk and low-risk groups obtained by 9-gene signature. |
Comparison with Other Prognostic Signature
In order to validate the superiority of our model, we found two published prognostic signature of colorectal cancer to make comparison, such as Zuo21 and Kim.22 To make it comparable, we used the corresponding genes in these two signatures. The risk score of each sample in TCGA was calculated using the same method, and the ROC and KM curve of each signature was evaluated. According to the median risk score value, the sample was divided into Risk-H and Risk-L groups, and the difference of prognosis between the two groups was calculated (Figure 8A and B). We further analyzed the restricted mean survival curves of these signatures, we can see that our model has the highest C-index (0.72), which has more advantages in the long-term survival prediction (Figure 8C).
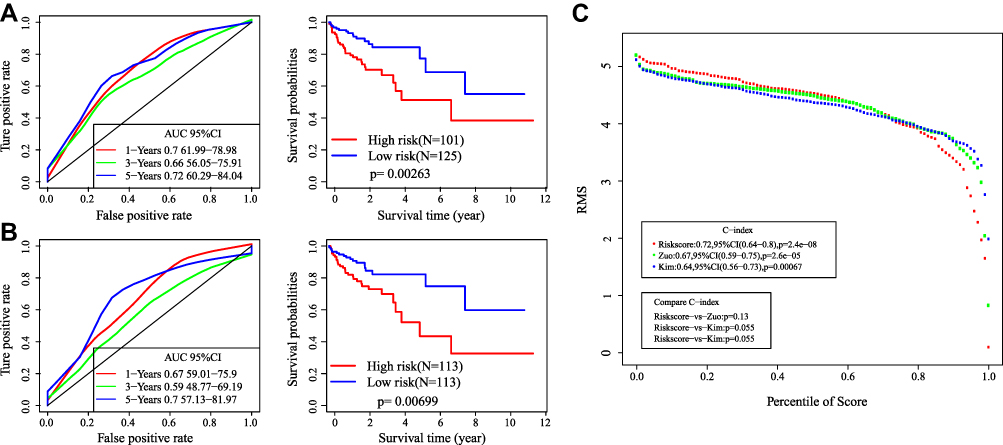 |
Figure 8 Comparative analysis of 9-gene signature and others. (A) The AUC and KM curves of Zuo’s model. (B) The AUC and KM curves of Kim’s model. (C) RMS curves and C-index of three signatures. |
Data Analysis Flowchart
In order to make the reader easier to understand, we have drawn a flowchart for the data analysis part of the paper (Figure 9).
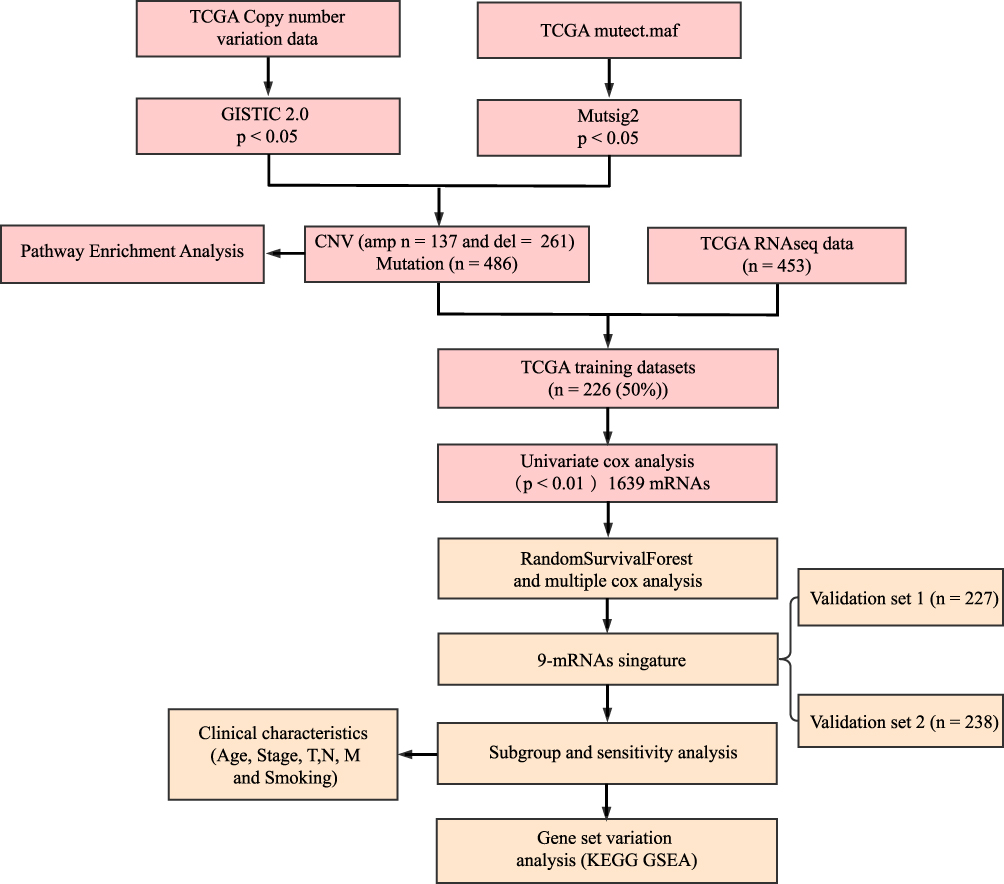 |
Figure 9 Data analysis flowchart. |
Expression Levels of 9 Genes
Based on the bioinformatics analysis results, the expression of 9 genes was verified in twenty normal tissues and colon cancer tissues. The results in Figure 10 showed that the mRNA expression of HOXD12, RNF25, CBLN3, DOCK3, DNAJB13, and PYGO2 were increased in colon cancer tissues and the mRNA expression of CTNNA1, PTPRK, NAT1were decreased in colon cancer tissues (p<0.05). It was consistent with that analyzed using bioinformatic analysis.
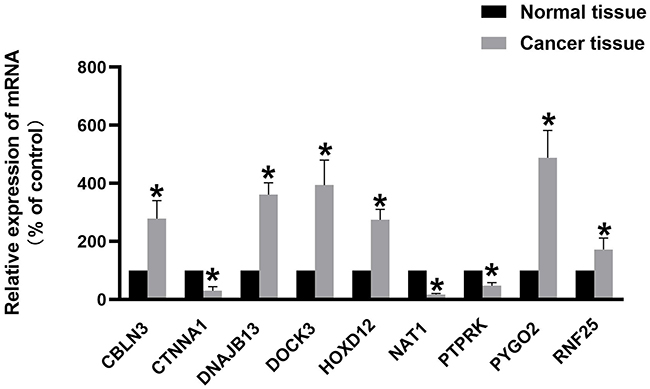 |
Figure 10 Expression levels of 9 genes quantified using qPCR in twenty paired normal tissues and colon cancer tissues. *P<0.05. |
Discussion
Colon adenocarcinoma (COAD) is a highly heterogeneous disease. Its occurrence and development process changes with the change of genetic and epigenetic factors.23 Therefore, COAD patients with the same pathological features may have different prognostic and therapeutic response to certain drugs. Screening prognostic molecular markers that fully reflect the biological characteristics of COAD is greatly significant for individualized treatment. Several recent studies have shown that genomics, epigenomics and transcriptomics play a vital role in tumor development and progression, helping predict the prognosis of patients.24,25 Therefore, multi-omics studies can help determine tumor heterogeneity and screen therapeutic targets and tumor biomarkers, which have greater advantages.26 The study screens and identifies 9-gene signature associated with COAD prognosis by analyzing multi-omics data, including transcriptome data, copying number variation data and mutation data. The 9-gene signature established by screening has strong robustness and stable prediction performance in both internal verification set and external verification set. It enables stable prediction performance in data sets of different platforms. In addition, the clinical information in TCGA and GSE19234 are analyzed systematically by COX regression. The results show that 9-gene signature is an independent prognostic factor, which maintains stable clinical independence under the influence of many clinical factors, including training set, TCGA internal verification set and GSE19234 external verification set.
Several studies have shown that multi-omics have been used in clinical prediction of prognosis and therapeutic responses. To be more specific, Oncotype DX used for breast cancer recurrence score contains 21 genes.27,28 Another Mammaprint™, which contains 70 genes, is used to assess the risk of metastasis in breast cancer.29,30 In the study of COAD, ColoPrint, which contains 18 genes, is used to predict the risk of prognosis and recurrence in patients.31–33 These results show that great potential of multi-omics screening in clinical application through gene expression profile. In this study, the AUC of 9-gene signature screened by multi-omics in the training set and validation set for five years is more than 0.64, which is more effective in predicting the prognosis of patients. Furthermore, the multi-omics in this study contains only 9 genes, making it easier to apply clinically.
In 9-gene signature identified and verified by multi-omics data, HOXD12, RNF25, CBLN3, DOCK3, DNAJB13, and PYGO2 are risk factors, and CTNNA1, PTPRK, NAT1 are protective factors. Consistently, our results based on clinical samples showed the mRNA expression of HOXD12, RNF25, CBLN3, DOCK3, DNAJB13, and PYGO2 were increased and the mRNA expression of CTNNA1, PTPRK, NAT1were decreased in colon cancer tissues. These results suggested these 9-genes may play an important role in the progression of COAD. There have been reported that HOXD12 has high expression in progesterone receptor positive breast cancer tissues.34 RNF25 is an E3 ubiquitin ligase. Studies have confirmed that RNF25 promotes gefitinib resistance by mediating crosstalk between the mediated NF-κB and ERK pathways.35 DOCK3 is shown to be involved in regulating tumor cell metastasis.36,37 PYG02 is closely related to the prognosis of glioma, esophageal squamous cell carcinoma, hepatocellular carcinoma and other tumors.38–40 CTNNA1 is closely related to the prognosis of invasive breast cancer and renal cell carcinoma.41,42 PTPRK is a marker of breast cancer.43 NAT1 is significantly correlated with the increase of the overall survival time of breast cancer patients.44 In brief, these genes are closely related to the prognosis of tumors. In addition, CBLN3 and DNAJB13 have not been reported to be associated with tumors. They are found to be prognostic markers of COAD for the first time in this study. In addition, GSEA enrichment analysis results also show that 9-gene signature is closely related to the progression and metastasis of COAD. Examples include KEGG ERBB SIGNALING PATHWAY, KEGG COLORECTAL CANCER, KEGG p53 SIGNALING PATHWAY, and KEGG TGF BETA SIGNALING PATHWAY. The above results show that the model has potential clinical application value and can provide potential drug targets for patients with COAD.
Although this study screens and verifies the potential prognostic markers of COAD based on large sample multi-omics data, this study still has some limitations. The conclusions of this study are mainly based on bioinformatics analysis, which still need to be further verified by experiments in vitro and in vivo. In addition, all the samples involved in this study are retrospective studies. The clinical application still requires comprehensive and in-depth research. Finally, because our study based on public cohorts, there are also have limitations such as the therapeutic effects of these patients, which are not found in the original research.
To sum up, our research results indicate that the 9 gene prognostic signature is a reliable tool for predicting the OS of COAD patients.
Funding
This work was supported by 345 Talent Project of Shengjing hospital of China Medical University.
Disclosure
The authors report no conflicts of interest for this work.
References
1. Favoriti P, Carbone G, Greco M, Pirozzi F, Pirozzi RE, Corcione F. Worldwide burden of colorectal cancer: a review. Updates Surg. 2016;68(1):7–11. doi:10.1007/s13304-016-0359-y
2. Siegel RL, Miller KD, Fedewa SA, et al. Colorectal cancer statistics, 2017. CA Cancer J Clin. 2017;67(3):177–193. doi:10.3322/caac.21395
3. Banerjee A, Pathak S, Subramanium VD, Murugesan GD, Verma RS, Verma RS. Strategies for targeted drug delivery in treatment of colon cancer: current trends and future perspectives. Drug Discov Today. 2017;22(8):1224–1232. doi:10.1016/j.drudis.2017.05.006
4. Brown KGM, Solomon MJ. Progress and future direction in the management of advanced colorectal cancer. Br J Surg. 2018;105(6):615–617. doi:10.1002/bjs.10759
5. Herzig DO, Tsikitis VL. Molecular markers for colon diagnosis, prognosis and targeted therapy. J Surg Oncol. 2015;111(1):96–102. doi:10.1002/jso.23806
6. Grady WM, Pritchard CC. Molecular alterations and biomarkers in colorectal cancer. Toxicol Pathol. 2014;42(1):124–139. doi:10.1177/0192623313505155
7. Weng W, Feng J, Qin H, Ma Y, Goel A. An update on miRNAs as biological and clinical determinants in colorectal cancer: a bench-to-bedside approach. Future Oncol. 2015;11(12):1791–1808. doi:10.2217/fon.15.83
8. Smith JJ, Deane NG, Wu F, et al. Experimentally derived metastasis gene expression profile predicts recurrence and death in patients with colon cancer. Gastroenterology. 2010;138(3):958–968. doi:10.1053/j.gastro.2009.11.005
9. Gao S, Tibiche C, Zou J, et al. Identification and construction of combinatory cancer hallmark-based gene signature sets to predict recurrence and chemotherapy benefit in stage II colorectal cancer. JAMA Oncol. 2016;2(1):37–45. doi:10.1001/jamaoncol.2015.3413
10. Jubb AM, Harris AL. Biomarkers to predict the clinical efficacy of bevacizumab in cancer. Lancet Oncol. 2010;11(12):1172–1183. doi:10.1016/S1470-2045(10)70232-1
11. Luo H-Y, Xu R-H. Predictive and prognostic biomarkers with therapeutic targets in advanced colorectal cancer. World j Gastroenterol. 2014;20(14):3858–3874. doi:10.3748/wjg.v20.i14.3858
12. Thirunavukarasu P, Talati C, Munjal S, Attwood K, Edge SB, Francescutti V. Effect of incorporation of pretreatment serum carcinoembryonic antigen levels into AJCC staging for colon cancer on 5-year survival. JAMA Surg. 2015;150(8):747–755. doi:10.1001/jamasurg.2015.0871
13. Thirunavukarasu P, Sukumar S, Sathaiah M, et al. C-stage in colon cancer: implications of carcinoembryonic antigen biomarker in staging, prognosis, and management. J Natl Cancer Inst. 2011;103(8):689–697. doi:10.1093/jnci/djr078
14. Rong Z, Rong Y, Li Y, et al. Development of a novel six-miRNA-based model to predict overall survival among colon adenocarcinoma patients. Front Oncol. 2020;10:26. doi:10.3389/fonc.2020.00026
15. Wang X-J, Zeng B, Lin S, Chen M, Chi P. An integrated miRNA-lncRNA signature predicts the survival of stage II colon cancer. Ann Clin Lab Sci. 2019;49(6):730–739.
16. Guo J-C, Wu Y, Chen Y, et al. Protein-coding genes combined with long noncoding RNA as a novel transcriptome molecular staging model to predict the survival of patients with esophageal squamous cell carcinoma. Cancer Commun. 2018;38(1):4. doi:10.1186/s40880-018-0277-0
17. Mermel CH, Schumacher SE, Hill B, Meyerson ML, Beroukhim R, Getz G. GISTIC2.0 facilitates sensitive and confident localization of the targets of focal somatic copy-number alteration in human cancers. Genome Biol. 2011;12(4):R41. doi:10.1186/gb-2011-12-4-r41
18. Taylor JMG. Random survival forests. J Thoracic Oncol. 2011;6(12):1974–1975. doi:10.1097/JTO.0b013e318233d835
19. Meng J, Li P, Zhang Q, Yang Z, Fu S. A four-long non-coding RNA signature in predicting breast cancer survival. J Exp Clin Cancer Res. 2014;33(1):84. doi:10.1186/s13046-014-0084-7
20. Yu G, Wang L-G, Han Y, He Q-Y. clusterProfiler: an R package for comparing biological themes among gene clusters. OMICS. 2012;16(5):284–287. doi:10.1089/omi.2011.0118
21. Zuo S, Dai G, Ren X. Identification of a 6-gene signature predicting prognosis for colorectal cancer. Cancer Cell Int. 2019;19(1):6. doi:10.1186/s12935-018-0724-7
22. Kim S-K, Kim S-Y, Kim CW, et al. A prognostic index based on an eleven gene signature to predict systemic recurrences in colorectal cancer. Exp Mol Med. 2019;51(10):10. doi:10.1038/s12276-019-0319-y
23. Punt CJ, Koopman M, Vermeulen L. From tumour heterogeneity to advances in precision treatment of colorectal cancer. Nat Rev Clin Oncol. 2017;14(4):235–246. doi:10.1038/nrclinonc.2016.171
24. Kandoth C, McLellan MD, Vandin F, et al. Mutational landscape and significance across 12 major cancer types. Nature. 2013;502(7471):333–339. doi:10.1038/nature12634
25. Wrzeszczynski KO, Varadan V, Byrnes J, et al. Identification of tumor suppressors and oncogenes from genomic and epigenetic features in ovarian cancer. PLoS One. 2011;6(12):e28503. doi:10.1371/journal.pone.0028503
26. Xia Q, Li Z, Zheng J, et al. Identification of novel biomarkers for hepatocellular carcinoma using transcriptome analysis. J Cell Physiol. 2019;234(4):4851–4863. doi:10.1002/jcp.27283
27. Xin L, Liu YH, Martin TA, Jiang WG. The era of multigene panels comes? The clinical utility of oncotype DX and MammaPrint. World J Oncol. 2017;8(2):34–40. doi:10.14740/wjon1019w
28. Cobleigh MA, Tabesh B, Bitterman P, et al. Tumor gene expression and prognosis in breast cancer patients with 10 or more positive lymph nodes. Clin Cancer Res. 2005;11(24 Pt 1):8623–8631. doi:10.1158/1078-0432.CCR-05-0735
29. Mook S, Schmidt MK, Weigelt B, et al. The 70-gene prognosis signature predicts early metastasis in breast cancer patients between 55 and 70 years of age. Ann Oncol. 2010;21(4):717–722. doi:10.1093/annonc/mdp388
30. Glas AM, Floore A, Delahaye LJ, et al. Converting a breast cancer microarray signature into a high-throughput diagnostic test. BMC Genomics. 2006;7(1):278. doi:10.1186/1471-2164-7-278
31. Salazar R, Roepman P, Capella G, et al. Gene expression signature to improve prognosis prediction of stage II and III colorectal cancer. J clin oncol. 2011;29(1):17–24. doi:10.1200/JCO.2010.30.1077
32. Maak M, Simon I, Nitsche U, et al. Independent validation of a prognostic genomic signature (ColoPrint) for patients with stage II colon cancer. Ann Surg. 2013;257(6):1053–1058. doi:10.1097/SLA.0b013e31827c1180
33. Kopetz S, Tabernero J, Rosenberg R, et al. Genomic classifier ColoPrint predicts recurrence in stage II colorectal cancer patients more accurately than clinical factors. Oncologist. 2015;20(2):127–133. doi:10.1634/theoncologist.2014-0325
34. Makiyama K, Hamada J-I, Takada M, et al. Aberrant expression of HOX genes in human invasive breast carcinoma. Oncol Rep. 2005;13(4):673.
35. Cho JH, You YM, Il YY, et al. RNF25 promotes gefitinib resistance in EGFR-mutant NSCLC cells by inducing NF-κB-mediated ERK reactivation. Cell Death Dis. 2018;9(6):587. doi:10.1038/s41419-018-0651-5
36. Cui HY, Wang SJ, Miao JY, et al. CD147 regulates cancer migration via direct interaction with Annexin A2 and DOCK3-β-catenin-WAVE2 signaling. Oncotarget. 2016;7(5):5613–5629. doi:10.18632/oncotarget.6723
37. Zhu X, Gao G, Chu K, et al. Inhibition of RAC1-GEF DOCK3 by miR-512-3p contributes to suppression of metastasis in non-small cell lung cancer. Int J Biochem Cell Biol. 2015;61:103–114. doi:10.1016/j.biocel.2015.02.005
38. Zhou C, Zhang Y, Dai J, et al. Pygo2 functions as a prognostic factor for glioma due to its up-regulation of H3K4me3 and promotion of MLL1/MLL2 complex recruitment. Sci Rep. 2016;6(1):22066. doi:10.1038/srep22066
39. Moghbeli M, Sadrizadeh A, Forghanifard MM, Mozaffari HM, Golmakani E, Abbaszadegan MR. Role of Msi1 and PYGO2 in esophageal squamous cell carcinoma depth of invasion. J Cell Commun Signal. 2016;10(1):49–53. doi:10.1007/s12079-015-0314-6
40. Zhang S, Li J, He F, Wang XM. Abnormal nuclear expression of Pygopus-2 in human primary hepatocellular carcinoma correlates with a poor prognosis. Histopathology. 2015;67(2):176–184. doi:10.1111/his.12637
41. Yoshida R, Kimura N, Harada Y, Ohuchi N. The loss of E-cadherin, alpha- and beta-catenin expression is associated with metastasis and poor prognosis in invasive breast cancer. Int J Oncol. 2001;18(3):513–520.
42. Aaltomaa S, Lipponen P, Kärjä V, Lundstedt S, Lappi J, Kosma VM. The expression and prognostic value of alpha-, beta- and gamma-catenins in renal cell carcinoma. Anticancer Res. 2012;24(4):2407–2413.
43. Sun PH, Ye L, Mason MD, Jiang WG. Protein tyrosine phosphatase kappa (PTPRK) is a negative regulator of adhesion and invasion of breast cancer cells, and associates with poor prognosis of breast cancer. J Cancer Res Clin Oncol. 2013;139(7):1129–1139. doi:10.1007/s00432-013-1421-5
44. Endo Y, Yamashita H, Takahashi S, et al. Immunohistochemical determination of the miR-1290 target arylamine N-acetyltransferase 1 (NAT1) as a prognostic biomarker in breast cancer. BMC Cancer. 2014;14(1):990. doi:10.1186/1471-2407-14-990
 © 2020 The Author(s). This work is published and licensed by Dove Medical Press Limited. The full terms of this license are available at https://www.dovepress.com/terms.php and incorporate the Creative Commons Attribution - Non Commercial (unported, v3.0) License.
By accessing the work you hereby accept the Terms. Non-commercial uses of the work are permitted without any further permission from Dove Medical Press Limited, provided the work is properly attributed. For permission for commercial use of this work, please see paragraphs 4.2 and 5 of our Terms.
© 2020 The Author(s). This work is published and licensed by Dove Medical Press Limited. The full terms of this license are available at https://www.dovepress.com/terms.php and incorporate the Creative Commons Attribution - Non Commercial (unported, v3.0) License.
By accessing the work you hereby accept the Terms. Non-commercial uses of the work are permitted without any further permission from Dove Medical Press Limited, provided the work is properly attributed. For permission for commercial use of this work, please see paragraphs 4.2 and 5 of our Terms.