Back to Journals » International Journal of Nanomedicine » Volume 14
Functionalization Of T Lymphocytes With Citrate-Coated Superparamagnetic Iron Oxide Nanoparticles For Magnetically Controlled Immune Therapy
Authors Mühlberger M, Janko C ![]() , Unterweger H
, Unterweger H ![]() , Friedrich RP
, Friedrich RP ![]() , Friedrich B, Band J, Cebulla N, Alexiou C
, Friedrich B, Band J, Cebulla N, Alexiou C ![]() , Dudziak D, Lee G, Tietze R
, Dudziak D, Lee G, Tietze R
Received 6 June 2019
Accepted for publication 3 September 2019
Published 24 October 2019 Volume 2019:14 Pages 8421—8432
DOI https://doi.org/10.2147/IJN.S218488
Checked for plagiarism Yes
Review by Single anonymous peer review
Peer reviewer comments 2
Editor who approved publication: Prof. Dr. Anderson Oliveira Lobo
Supplementary video 2 of ID 218488
Views: 147
Marina Mühlberger,1,2 Christina Janko,1 Harald Unterweger,1 Ralf P Friedrich,1 Bernhard Friedrich,1 Julia Band,1 Nadine Cebulla,1 Christoph Alexiou,1 Diana Dudziak,3 Geoffrey Lee,2 Rainer Tietze1
1Department of Otorhinolaryngology, Head and Neck Surgery, Section of Experimental Oncology and Nanomedicine (SEON), Else Kröner-Fresenius-Stiftung-Professorship, Universitätsklinikum Erlangen, Erlangen, Germany; 2Department of Chemistry and Pharmacy, Division of Pharmaceutics, Friedrich-Alexander-Universität Erlangen-Nürnberg, Erlangen, Germany; 3Department of Dermatology, Laboratory of Dendritic Cell Biology, Universitätsklinikum Erlangen, Erlangen, Germany
Correspondence: Rainer Tietze
Section of Experimental Oncology and Nanomedicine, ENT Department, Universitätsklinikum Erlangen, Glückstr. 10a, Erlangen 91054, Germany
Tel +49 9131 8533142
Fax +49 9131 8534828
Email [email protected]
Purpose: Immune activation with T cell tumor infiltration is beneficial for the prognosis of patients suffering from solid cancer. Depending on their immune status, solid tumors can be immunologically classified into three groups: “hot” tumors are infiltrated with T lymphocytes, “cold” tumors are not infiltrated and “immune excluded” tumors are only infiltrated in the peripheral tumor tissue. Checkpoint inhibitors provide new therapeutic options for “hot” tumors by triggering the immune response of T cells. In order to enable this for cold tumors as well, T cells must be enriched in the tumor. Therefore, we use the principle of magnetic targeting to guide T cells loaded with citrate-coated superparamagnetic iron oxide nanoparticles (SPIONCitrate) to the tumor by an externally applied magnetic field.
Methods: SPIONCitrate were produced by alkaline coprecipitation of iron(II) and iron(III) chloride and in situ coating with sodium citrate. The concentration-dependent cytocompatibility of the particles was determined by flow cytometry and blood stability assays. Atomic emission spectroscopy was used for the quantification of the particle uptake into T lymphocytes. The attractability of the loaded cells was observed by live-cell imaging in the presence of an externally applied magnetic field.
Results: SPIONCitrate displayed good cytocompatibility to T cells and did not show any sign of aggregation in blood. Finally, SPIONCitrate-loaded T cells were strongly attracted by a small external magnet.
Conclusion: T cells can be “magnetized” by incorporation of SPIONCitrate for magnetic targeting. The production of the particle-cell hybrid system is straightforward, as the loading process only requires basic laboratory devices and the loading efficiency is sufficient for cells being magnetically controllable. For these reasons, SPIONCitrate are potential suitable candidates for magnetic T cell targeting.
Keywords: magnetic targeting, biocompatibility, immunoaffinity chromatography, cold tumor, T cell
Introduction
According to World Health Organization (WHO) data, in 2018, cancer was the second leading cause of death with about 10 million deaths worldwide. In addition, there were over 18 million new cases of cancer in 2018.1 Solid tumors are responsible for more than 90% of all tumor diseases. For the prognosis of these patients, tumor-infiltrating lymphocytes (TILs) play an important role.2–5 The number of TILs has a large influence on the patient's outcome, since T lymphocytes are responsible for the immune activation against the tumor.6–8 Depending on the amount and localization of TILs, solid tumors can be immunologically divided into “hot”, “immune excluded” and “cold” tumors.9 “Hot” means that the tumor is infiltrated by T lymphocytes, but does not necessarily trigger an immune response. In “immune excluded” tumors, T cells only penetrate into peripheral tissue. “Cold” tumors are not infiltrated by the immune system at all due to various mechanisms. In the case of hot tumors, immune checkpoint inhibitors such as nivolumab and ipilimumab are able to trigger an activation of the T cell immune response in the infiltrated tumor by blocking inhibitory signals of the tumor towards T cells.10,11 However, this type of therapy only works if there is a sufficient number of T lymphocytes in the tumor, which is not the case for cold tumors. In order to achieve the transfer from cold to hot, T lymphocytes must be accumulated in the tumor area.12 One possibility is the use of a bispecific antibody that simultaneously binds to T lymphocytes and to specific sites on the tumor.13 However, this system has some disadvantages since bispecific antibodies are cost-intensive and interact very selectively.14 In addition, there is a risk that the extracellularly bound antibodies may cause adverse immune reactions.15 To overcome these challenges, the magnetic cell trafficking method could be more widely applicable. The superparamagnetic properties of the superparamagnetic iron oxide nanoparticles (SPIONs) are used to magnetically attract cells loaded with these SPIONs comparable to magnetic drug targeting.16–18 The cells are loaded with biocompatible SPIONs, purified, applied to the desired site and concentrated in this area with an external magnetic field.19–21 Hence, with this method, various cell types such as stem cells, T cells or dendritic cells can be functionalized and applied to any tumor with an accessible blood supply.22,23
In a preliminary study, we recently demonstrated the feasibility to load T cells with SPIONs and to attract them with an external magnetic field.24 The SPIONs used, however, were either too cytotoxic or coated with bovine serum albumin, which would lead to immune reactions in humans. Human serum albumin was also used instead to prevent immune reactions, but this led to insufficient particle uptake into the cells. With regard to future in vivo application in animals or humans, SPIONs therefore have to be coated with a cyto- and immunocompatible layer. Additionally, the cellular loading of the particles must be adequate and the particles need a sufficiently high magnetic susceptibility. Moreover, after loading, it is necessary to be able to separate cells and excess SPIONs from each other. Particle stability in the blood is also important to avoid thromboembolic events caused by particle agglomeration of released particles during future in vivo application. These are the reasons why for this work, we used SPIONs coated in situ with citrate (SPIONCitrate). The particles were physicochemically characterized and tested in vitro for blood stability and cell toxicity in T lymphocytes. Subsequently, the particle uptake into T cells was investigated and quantified. Finally, the magnetizability of the system consisting of T cells loaded with SPIONCitrate was tested and visualized.
Materials And Methods
Materials
Sodium citrate dihydrate, iron(II) chloride tetrahydrate and iron(III) chloride hexahydrate were supplied by Merck (Darmstadt, Germany), ammonia solution 25%, acetone, methanol, nitric acid 65%, ethylenediaminetetraacetic acid disodium salt dihydrate (EDTA), D(+)-biotin, crystal violet (C.I. 42555), citric acid monohydrate and di-sodium hydrogen phosphate by Carl Roth (Karlsruhe, Germany). Penicillin/streptomycin solution (5000 U/mL), GlutaMAX supplement, Hoechst 33342 (Hoe), Annexin A5 FITC conjugate (AxV), DiIC1(5) (1,1′-dimethyl-3,3,3′,3′-tetramethylindodicarbocyanine iodide, DiI), dimethyl sulfoxide (DMSO), Zeba Spin desalting columns (0.5 mL, MWCO 7 kDa) and EZ-Link Sulfo-NHS-LC-Desthiobiotin (no weigh format) were obtained from Thermo Fisher Scientific (Waltham, MA, USA). Phosphate-buffered saline (PBS), propidium iodide (PI), 2ʹ,7ʹ-dichlorofluorescin diacetate (DCFH-DA) and Lucifer Yellow CH dipotassium salt (LY) were purchased from Sigma-Aldrich (Taufkirchen, Germany), Ringer's solution from Fresenius Kabi (Bad Homburg, Germany). Dulbecco's modified Eagle`s medium (DMEM) and fetal calf serum (FCS) were provided by Biochrom (Berlin, Germany), Minisart NML syringe filters (0.2 µm pore size) by Sartorius (Goettingen, Germany). Purified anti-mouse CD90.2 (Thy-1.2) antibody (clone 53-2.1) was obtained from BioLegend (San Diego, CA, USA), x-well slides (2 wells on glass, detachable) from Sarstedt (Nuembrecht, Germany), block magnet Q-19-13-06-LN from supermagnete Webcraft (Gottmadingen, Germany). Fab-TACS Gravity columns with adapter and flow restrictor were used from IBA's Fab-TACS Gravity Kit (Goettingen, Germany). The water used for all experiments came from a Siemens Ultra Clear system (Evoqua Water Technologies, Guenzburg, Germany).
Nanoparticle Synthesis
SPIONCitrate were synthesized according to a modified protocol of Elbialy et al.25 Iron(II) chloride and iron(III) chloride were dissolved in water in a molar ratio of 1:2 and stirred under an argon atmosphere to prevent oxidation. Iron oxide was precipitated by the addition of ammonia solution 25%. After 10 mins, 1 M sodium citrate solution was added and the mixture stirred for 30 mins at 90 °C. To remove excess sodium citrate, the cooled SPIONs were washed with acetone five times and then dried under vacuum at room temperature. For application, the dry stored particles were dissolved in water and filtered sterile through a 0.2 μm-pore diameter syringe filter.
Nanoparticle Characterization
Iron Quantification
For determination of the iron concentration, atomic emission spectroscopy (AES) was used with an Agilent 4200 MP-AES (Agilent Technologies, Santa Clara, CA, USA). A commercially available iron solution (1000 mg/L, Bernd Kraft, Duisburg, Germany) served as an external standard. Samples were dissolved with nitric acid 65% at 95 °C and diluted with water. The analysis was performed using independent triplicates.
Particle Size
Dynamic light scattering (DLS) was performed with a Zetasizer Nano ZS (Malvern Panalytical, Almelo, Netherlands) to determine the hydrodynamic particle size at 25 °C in water (refractive index 1.33, viscosity 0.8872 mPa·s) and in DMEM cell culture medium, supplemented with 10% fetal calf serum (FCS), 1% L-glutamine and 1% penicillin/streptomycin solution (refractive index 1.335, viscosity 1.1100 mPa·s). The measurements were done in triplicate at an iron concentration of 50 µg/mL.
In addition, images of the particles were taken with a Zeiss Auriga scanning electron microscope (SEM) (Carl Zeiss, Oberkochen, Germany) with an acceleration voltage of 1.5 kV.
Zeta Potential
The Zetasizer Nano ZS was also used to check the particles' aqueous zeta potential with 78.5 as the dielectric constant. Measurements were done in triplicate at an iron concentration of 50 µg/mL and pH 6.6.
Magnetic Susceptibility
As an indicator for the SPIONs' magnetizability, the magnetic susceptibility at an iron concentration of 1 mg/mL was measured with a MS2G magnetic susceptibility meter (Bartington Instruments, Oxfordshire, UK).
Blood Stability
The stability of the nanoparticles in blood was tested in freshly drawn human whole blood stabilized with EDTA or citrate according to the protocol published by Lugert et al.26 Blood (200 µL) was incubated with 100 µL SPIONs (2 mg iron/mL) for 45 mins. Water served as a negative control, and SPIONs with a coating of lauric acid and aminated human serum albumin served as a positive control.24 Two microliters of each sample were streaked on a glass slide and microscoped using a Zeiss Axio Observer Z1 microscope (Carl Zeiss, Jena, Germany). The use of human material (blood) was approved by the local ethics committee at Universitätsklinikum Erlangen (reference no. 257-14 B) and written informed consent was obtained from voluntary donors.
Cell Culture
The cell line EL4 (ATCC TIB-39) consisted of T lymphocytes from mouse lymphoma and was non-adherent. Cells were cultured in DMEM supplemented with 10% FCS, 1% L-glutamine and 1% penicillin/streptomycin solution at 37 °C in humidified 5% CO2 atmosphere. Cells were passaged twice a week. The MUSE Cell Analyzer (Merck, Darmstadt, Germany) was used to determine cell count and viability.
Cell Toxicity
Flow cytometry was used to examine possible toxic effects of SPIONCitrate on cell viability.27 For this purpose, 5×10⁴ cells in 1 mL medium were seeded in triplicate in 24-well plates and incubated with SPIONs at iron concentrations of 25, 50, 75 or 100 µg/mL or the same volume water as a control. Immediately after seeding as well as after incubation for 24 and 48 hrs, a sample of 50 µL was taken from each well and stained with a mixture containing 1 µL/mL Hoechst 33342 (Hoe, 10 mg/mL), 2 µL/mL Annexin A5 FITC conjugate (AxV), 66.7 ng/mL propidium iodide (PI) and 0.4 µL/mL DiIC1(5) (1,1′-dimethyl-3,3,3′,3′-tetramethylindodicarbocyanine iodide, DiI, 10 µM) in Ringer's solution. Hoe was used to identify cells by staining their nucleus, and DiI staining was done additionally to determine the integrity of the mitochondrial membrane potential. With AxV and PI, apoptotic and necrotic cells were detected. After 20 mins of incubation at 4 °C under light protection, fluorescence was measured with a Gallios flow cytometer and analyzed with Kaluza 1.2 Analysis Software (Beckman Coulter Life Sciences, Indianapolis, IN, USA).
A 2′,7′-dichlorofluorescin diacetate (DCFH-DA) assay was performed to check whether reactive oxygen species (ROS), e.g. by lipid peroxidation, were a cause of particle toxicity. The EL4 cells were stained with 40 µM DCFH-DA in phosphate-buffered saline (PBS) with 5% FCS for 5 mins under light protection, washed with medium and then resuspended in medium at a concentration of 2×10⁵ cells/mL. In triplicate, 180 µL cell suspension was seeded in a 96-well plate and mixed with 20 µL water, 1 mM hydrogen peroxide or SPIONCitrate at iron concentrations of 25, 50, 75 or 100 µg/mL. Immediately after seeding as well as after incubation for 6, 24 and 48 hrs, a sample of 50 µL was taken from each well and stained with a mixture containing 66.7 ng/mL PI and 0.4 µL/mL DiI (10 µM) in Ringer's solution. After 30 mins of incubation at 37 °C under light protection, fluorescence was measured with a Gallios flow cytometer and analyzed with Kaluza 1.2 Analysis Software.
Cellular Uptake Of SPIONCitrate
Three methods were combined to obtain information about the particle uptake into the cells: analysis of the cell granularity, staining with Lucifer Yellow (LY) and spectroscopical quantification of iron content.
Cell Granularity
As part of the cell viability test via flow cytometry as described above, the values of the side scatter (SSc) were obtained as a parameter for cell granularity which gets altered by adhesion or internalization of SPIONs.28
Lucifer Yellow Staining
For estimating whether particles were adsorbed to the cell surface or internalized into the cell, staining with Lucifer Yellow, a membrane-impermeable fluorescent dye that gets co-ingested with particles, was done.29,30 Under light protection, 5×10⁴ cells in 1 mL medium containing 2 µg LY were seeded in triplicate in 24-well plates and incubated with SPIONs at iron concentrations of 25, 50, 75 or 100 µg/mL or the same volume water as a control. Immediately after seeding as well as after incubation for 24 and 48 hrs, a sample of 50 µL was taken from each well and stained with a mixture containing 1 µL/mL Hoe (10 mg/mL) and 0.4 µL/mL DiI (10 µM) in Ringer's solution. After 20 mins of incubation at 4 °C under light protection, fluorescence was measured with a Gallios flow cytometer and analyzed with Kaluza 1.2 Analysis Software.
Quantification Of Iron Content
For quantification of particle uptake into cells, 107 cells were seeded in 20 mL medium in a T75 cell culture flask and incubated for 24 hrs with SPIONCitrate at iron concentrations of 50, 75 or 100 µg/mL or the same volume of water as a control. After incubation, loaded cells had to be separated from excess nanoparticles by means of a specifically developed and recently published immunoaffinity chromatographic method.31 In short, a Fab-TACS Gravity column was prepared and loaded with the desthiobiotinylated anti-mouse CD90.2 antibody. The SPION/cell suspension was transferred to the column and allowed to run through completely allowing the cells to bind to the antibody. After washing with 37 °C warm PBS with 2% FCS and 0.5 mM EDTA, cells were eluted in two steps with 37 °C warm 10 mM biotin in DMEM cell culture medium. The eluted cells in biotin solution were centrifuged for 5 mins at 300 RCF, the supernatant was removed and the cells were resuspended in fresh medium. Cell count of the purified loaded cells was determined by MUSE Cell Analyzer. The volume corresponding to 5×10⁵ cells was taken in triplicate from each sample. By centrifugation at 300 RCF for 5 mins, a cell pellet was formed and washed twice with PBS. The purified pellet was dried for 30 mins at 95 °C and lyzed with nitric acid 65% at 95 °C. After diluting the samples with water, the iron content was measured by AES with an Agilent 4200 MP-AES using a commercially available iron solution (1000 mg/L, Bernd Kraft, Duisburg, Germany) as an external standard.
Magnetizability Of SPIONCitrate-Loaded EL4 Cells
The feasibility to control SPIONCitrate-loaded T cells using a magnetic field was investigated in two experiments.
2×10⁷ Cells were seeded in 40 mL medium in a T150 cell culture flask and incubated for 24 hrs with SPIONCitrate at an iron concentration of 75 µg/mL. The same volume of water served as a negative control. After incubation, 107 loaded cells were separated from excess nanoparticles by means of the previously described immunoaffinity chromatographic method.
Incubation On Magnetic Plate
Each 5×10⁶ cells of purified, unwashed and control cells were stained with 10 µL 0.5% crystal violet solution. After incubation at 37 °C for 10 mins, cells were washed with PBS with 2% FCS and 0.5 mM EDTA and resuspended in 500 µL medium. The cell suspensions were each transferred to one well of a 24-well plate and incubated for 48 hrs on top of a plate similar to a 96-well plate containing 0.5 T magnets as shown in Figure 7. The magnet's magnetic flux density was determined by measuring n = 12 magnets with a Hall effect magnetometer (FM302 with AS-NTM, Projekt Elektronik Mess- und Regelungstechnik, Berlin, Germany).
Video Of Magnetic Attraction
Each 5×10⁵ cells of purified, unwashed and control cells were transferred to one well of a two-well chamber on a glass slide at a total volume of 500 µL. The slide was placed under an Axio Observer Z.1 microscope (Carl Zeiss, Jena, Germany). A lengthwise magnetized block magnet was placed in the second well and cells were filmed at 10× magnification at the edge of the two-well barrier.
Statistical Analysis
For data shown in Figures 3–5, single-factor ANOVA analysis was performed in MS Excel (Microsoft, Redmond, WA, USA). Significant results (p < 0.05) were further processed with the Scheffé test as a post hoc test. In Figures 3–5, asterisks were used to mark statistical significance between control and treatment groups. Further results between treatment groups can be found in supplementary information S1.
For Figure 6, an unpaired Student's t-test in MS Excel was used for statistical analysis. Degree signs were used to mark statistical significance levels between control and treatment groups (°p < 0.05, °°p < 0.005), number signs between treatment groups (#p < 0.05, ##p < 0.005).
Results And Discussion
Nanoparticle Synthesis And Characterization
The hydrodynamic diameter, the zeta potential, the magnetic susceptibility and the blood stability were used for the characterization of SPIONCitrate.
Physicochemical Properties
In water, the particles had a mean hydrodynamic diameter of 58 nm measured as Z-average and a corresponding PDI of 0.149. In cell culture medium as used for experiments, the mean diameter increased to 430 ± 44 nm due to colloidal instability and thus agglomeration.
A SEM image of the particles is shown in Figure 1.
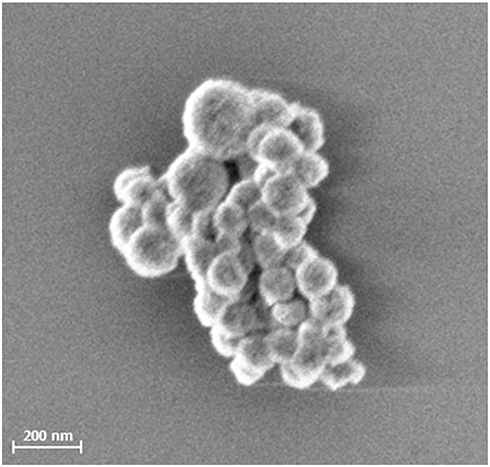 |
Figure 1 SEM picture of SPIONCitrate. The picture of freeze-dried SPIONCitrate was taken with a Zeiss Auriga SEM (Carl Zeiss, Oberkochen, Germany) with an acceleration voltage of 1.5 kV. Abbreviations: SPION, superparamagnetic iron oxide nanoparticle; SEM, scanning electron microscope. |
The zeta potential of the particles in water at pH 6.6 was −48.5 ± 0.5 mV. It was not possible to determine the zeta potential in the cell culture medium since the measured values corresponded to the values of the pure medium. This was a consequence of the high salt content of the medium and the resulting high conductivity.
The magnetic susceptibility served as a parameter for particles' magnetizability. The particles were diluted to an iron concentration of 1 mg/mL and had a magnetic susceptibility of 4.08×10⁻³. The original publication by Elbialy et al used a ratio 5:6 of iron(II) chloride to iron(III) chloride.22 This ratio resulted in a magnetic susceptibility of 3.20×10⁻³. In order to achieve higher magnetic susceptibility and thus better magnetizability of SPIONCitrate, we changed the ratio to 1:2.
Blood Stability
Since the stability of the nanoparticles in the blood is an important factor for future in vivo application, it was investigated after a protocol published by Lugert et al and Poller et al.26,32 We used freshly drawn human blood, which was stabilized against coagulation with citrate or EDTA. Water served as a negative control, and SPIONs coated with lauric acid and aminated human serum albumin served as a positive control. As shown in Figure 2
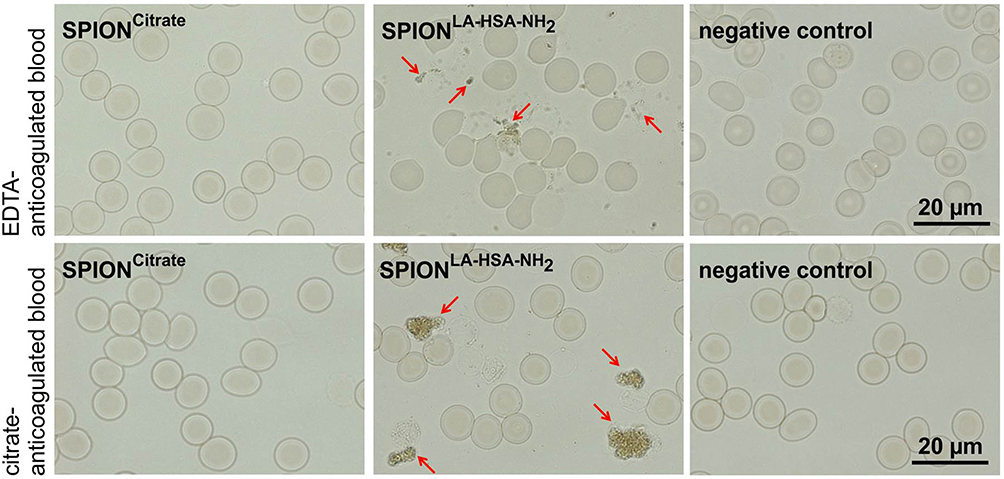 |
Figure 2 Stability of SPIONCitrate in blood. SPIONCitrate (left) and water used as negative control (right) were stable in EDTA (upper row) and citrate (lower row) anticoagulated blood. Contrary to the aminated particles used as positive control (middle), which aggregated (marked by arrows), SPIONCitrate did not show agglomeration. Abbreviations: EDTA, ethylenediaminetetraacetic acid; SPION, superparamagnetic iron oxide nanoparticle |
Toxicity
The MTT test is often used to examine cytotoxic effects.33 Due to the dark color of the nanoparticles, it was not possible to investigate the toxic effects of the SPIONs to the cells with common photometric assays such as the MTT test.34 Therefore, the influence of the particles on cell viability and proliferation at various particle concentrations (25 to 100 µg Fe/mL) was analyzed by flow cytometry according to a protocol of Munoz et al.27 The cells were stained with Hoe, AxV, PI and DiI and their fluorescence was measured by flow cytometry. Due to the cell nuclei staining by Hoe, the aggregated SPIONs within the medium were excluded from analysis, so that only cells were investigated. As shown in Figure 3, AxV and PI were used to differentiate between viable (AxV-PI-, green), early apoptotic (AxV+PI-, blue) and late apoptotic/necrotic (PI+, red) cells.
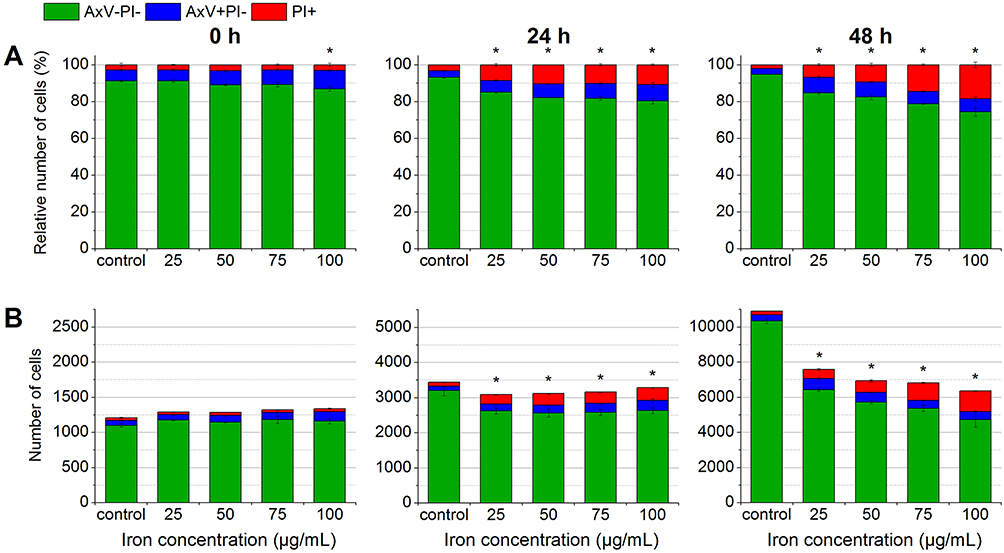 |
Figure 3 Determination of biocompatibility by flow cytometry. In the beginning, after 24 hrs and after 48 hrs of the incubation of EL4 cells with SPIONCitrate, cells were stained with Hoe to exclude excess particles from analysis and with AxV and PI for detection of apoptotic (AxV+PI-, blue) and necrotic (PI+, red) cells. The results were displayed as percentage of cell count (A) and as relative cell count (B). The experiment was performed in triplicate in at least three independent experiments. The mean values with standard deviations are shown. Numeric data for this figure can be found in supplementary information S2. Significance of viable cells (AxV-PI-) compared to control is represented by asterisks. Abbreviations: AxV, Annexin A5 FITC conjugate; Hoe, Hoechst 33342; PI, propidium iodide; SPION, superparamagnetic iron oxide nanoparticle. |
After 24 hrs, low toxic effects were observed at all particle concentrations. The viability only decreased from 86.8% to 80.3% at the highest concentration of 100 µg Fe/mL. At 48 hrs, the toxic effects of the particles increased further. However, the percentage of viable cells was still above 70% at all concentrations. In subsequent experiments, we used a particle concentration of 75 µg Fe/mL, since at this concentration, the viability of the cells stayed above 80% after 24 hrs of incubation and only slightly decreased to around 80% after 48 hrs.
In the observed time frame, cell proliferation of EL4 control cells was linear and tripled every 24 hrs. In contrast, cell proliferation of SPION-treated cells was slightly impaired after 24 hrs. After 48 hrs, the effect of SPIONs on cell proliferation became more obvious. The amount of cells in SPION-treated samples was significantly lower than in the control samples. Moreover, the decrease in cell numbers was clearly dose-dependent, reducing the cell number to around 6200 events at the highest SPION concentration compared to approximately 12,000 events in the control sample.
In summary, SPIONCitrate were clearly less cytotoxic than the previously used lauric acid–coated SPIONs and were tolerated at least as well as the lauric acid–coated SPIONs with additional albumin coating.24
As a possible cause for the slight toxicity of SPIONCitrate, the formation of reactive oxygen species, e.g. by lipid peroxidation, was investigated using a DCFH-DA assay.35 The non-fluorescent DCFH-DA passes through the cell membrane. The two acetate groups are cleaved off by intracellular esterases so that the dye can no longer pass through the cell membrane. In the presence of ROS, dichlorofluorescin (DCFH) is oxidized to strongly fluorescent dichlorofluorescein (DCF) whose fluorescence can be measured with the flow cytometer.36,37
As shown in Figure 4, water was used as a negative control and 1 mM hydrogen peroxide as a ROS-inducing positive control. Immediately after addition to the cell suspension, the hydrogen peroxide controls showed a strong DCF fluorescence which indicated ROS-stressed cells. After 6, 24 and 48 hrs of incubation, no viable cells were detectable anymore. In contrast, the water controls and different SPIONCitrate concentrations did not show a significant increase in the proportion of ROS-stressed cells. Therefore, the generation of reactive oxygen species as a cause for the toxicity of the particles can be eliminated.
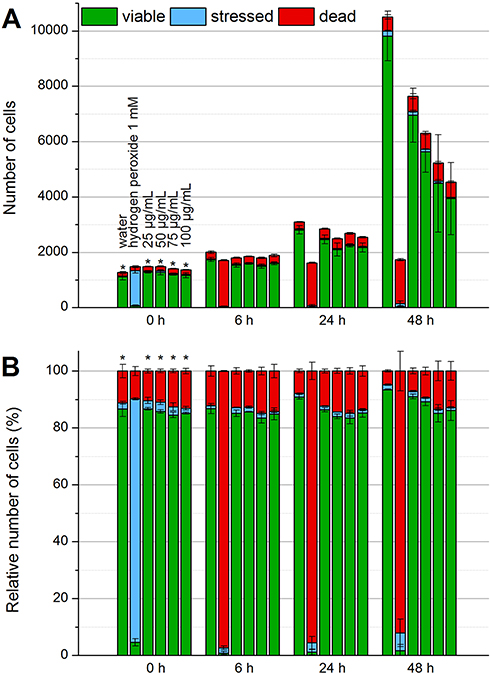 |
Figure 4 Detection of formation of reactive oxygen species by flow cytometry. To check whether SPIONCitrate leads to the formation of ROS, the EL4 cells were stained with DCFH-DA. When ROS is generated, DCFH is oxidized to DCF, which has a strong fluorescent effect. In the beginning, after 6 hrs, 24 hrs and after 48 hrs of incubation with SPIONCitrate, cells were additionally stained with DiI and PI for detection of viable cells. The results were displayed as relative cell count (A) and as percentage of cell count (B). The experiment was performed in triplicate in at least two independent experiments. The mean values with standard deviations are shown. Significance of stressed cells compared to hydrogen peroxide 1 mM is represented by asterisks. Abbreviations: DCF, dichlorofluorescein; DCFH, dichlorofluorescin; DCFH-DA, 2′,7′-dichlorofluorescin diacetate; DiI, DiIC1(5) (1,1′-dimethyl-3,3,3′,3′-tetramethylindodicarbocyanine iodide); PI, propidium iodide; ROS, reactive oxygen species; SPION, superparamagnetic iron oxide nanoparticle. |
Cellular Uptake Of SPIONCitrate
Flow Cytometry
In order to obtain information about the uptake of SPIONCitrate into the cells or their adhesion to the cell surface, we first evaluated the side scatter values obtained during the flow cytometry toxicity measurements. The side scatter provides information about the cellular granularity, which increases in the case of particle uptake or adsorption.28 As shown in Figure 5A, the intensity of the side scatter already increased depending on the concentration in the first 5 mins after the addition of the particles to the cells (0 hr, white). At an iron concentration of 75 µg/mL and 24 hrs of incubation, the side scatter intensity roughly doubled compared to the control samples. After 48 hrs, the SPION-treated cells showed a slight decrease in their side scatter intensity compared to the 24-hr values, indicating a possible exocytosis of particles or/and a division of the cellular particle load during cell division.
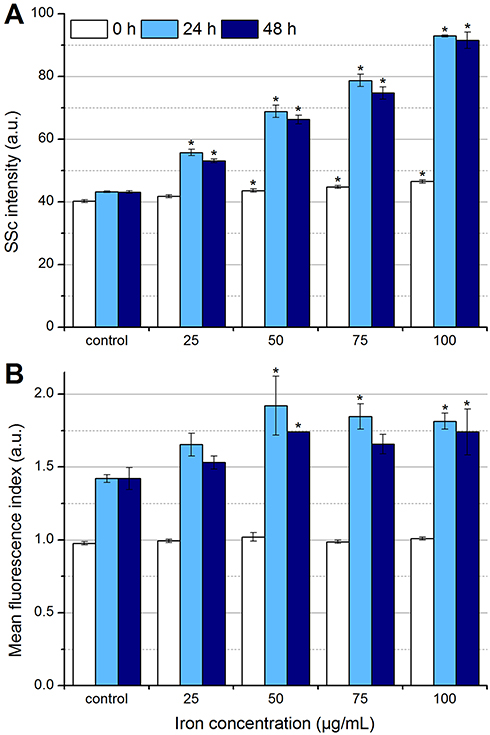 |
Figure 5 Determination of particle uptake and/or adhesion by flow cytometry. In the beginning, after 24 hrs and after 48 hrs of the incubation of EL4 cells with SPIONCitrate, cells were stained with Hoe to exclude excess particles from analysis and with DiI to detect viable cells with intact mitochondrial membrane potential. (A) Side scatter values of viable cells were analyzed for changes in cell granularity, which occurred with uptake and adhesion of particles. (B) The fluorescent dye LY was added to the cell culture medium before incubation of cells with nanoparticles. During particle uptake into the cell, LY was co-ingested and hence served as a parameter for particle uptake. The experiments shown in this figure were performed in triplicate in at least three independent experiments. The mean values with standard deviations are shown. Significance of treated cells compared to control at the same time point is represented by asterisks. Abbreviations: DiI, DiIC1(5) (1,1′-dimethyl-3,3,3′,3′-tetramethylindodicarbocyanine iodide); Hoe, Hoechst 33342; LY, Lucifer Yellow; SSc, side scatter; SPION, superparamagnetic iron oxide nanoparticle. |
Since the side scatter analysis provided no information about whether the SPIONs were absorbed into the cells or only adhered to the cell surface, staining with the fluorescent dye Lucifer Yellow was performed.29 The cells were incubated in medium containing LY with particles at different iron concentrations (0–100 µg/mL) for 24 and 48 hrs. If particles are incorporated into cells, LY is simultaneously co-ingested, resulting in an increase of fluorescence which can be measured by flow cytometry.30 To analyze the LY fluorescence intensity by flow cytometry, the cells were stained with Hoe and DiI after 0, 24 and 48 hrs to allow the gating of viable cells (Hoe+DiI+) only. As shown in Figure 5B, increased fluorescence was observed after 24 hrs and also after 48 hrs at all iron concentrations. In addition to the measured LY fluorescence in control samples, which is due to a general uptake by ubiquitous endocytosis, the incubation with SPION concentrations ≤ 50 µg Fe/mL led to a further concentration-dependent increase of the LY fluorescence.38 At concentrations above 50 µg Fe/mL, the fluorescence intensity did not increase further, indicating the achievement of a maximal loading capacity, a quenching of the fluorescence by the internalized particles or the masking by extracellular membrane-bound particles. However, the incorporation of LY into the cells was significantly higher in the presence of particles compared to control samples, indicating a cellular uptake mechanism for SPIONs and consequently the existence of intracellular SPIONs. However, the existence of strongly membrane-bound SPIONs could not be completely ruled out.
The combined evaluation of the side scatter and LY staining data suggested that the particles were both incorporated into the cells and adsorbed to the cell surface. Based on the toxicity tests, the incubation time was fixed to 24 hrs, since 48 hrs of incubation led to lower granularity and LY fluorescence as well as a higher number of necrotic cells.
Quantification Of Iron Content
In order to be able to reliably control SPION-loaded cells by a magnetic field, it is necessary to sufficiently load the cells with particles. The amount of cellular and strongly cell membrane-bound particles was particularly relevant, as slightly adhered particles could be easily removed by various factors such as shear stress, washing or diffusion. To quantify the average iron content per cell, EL4 cells were incubated for 24 hrs with SPIONs at an iron concentration of 75 µg/mL and purified using a self-developed immunoaffinity chromatographic method mentioned above. Subsequently, 5×10⁶ cells were washed and centrifuged before the cell pellets were dried, lyzed with HNO3 65%, diluted with water and the iron content measured by AES. As shown in Figure 6, the particle-free control cells contained an average of 0.12 ± 0.10 pg iron per cell, the unwashed loaded cells 2.11 ± 0.45 pg iron per cell, as excess SPIONs were also measured. After purification, the loaded cells contained 1.02 ± 0.17 pg iron per cell, which was comparable with values already obtained in other studies.39–41
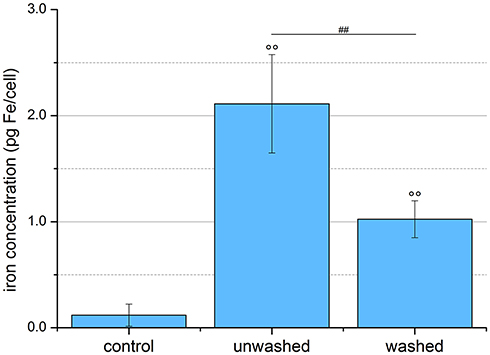 |
Figure 6 Quantification of SPION uptake into cells. EL4 cells were incubated for 24 hrs with SPIONCitrate at an iron concentration of 75 µg/mL. Cell pellets of purified, unwashed and control cells were counted, lyzed and their iron content measured by AES. The purification process led to a significantly lower amount of iron in the pellet of the washed cells, but these, like the unwashed cells, still contained significantly more iron than the control cells. The experiment shown in this figure was performed in six independent experiments. The mean values with standard deviations are shown. Significances of treated cells compared to control are represented by degree signs (°°p < 0.005), significance of purified cells compared to unwashed cells is represented by number signs (##p < 0.005). Abbreviations: AES, atomic emission spectroscopy; SPION, superparamagnetic iron oxide nanoparticle. |
Theoretically, methods such as electroporation or transfection reagents like lipofectamine could be used to increase the transport of the particles into the cell and achieve higher values. However, these methods would have a negative effect on cell viability and are therefore not suitable for patient-specific application.42–44
Magnetizability Of SPIONCitrate-Loaded EL4 Cells
Two different experiments were performed to check whether the cells loaded with SPIONCitrate can be magnetically controlled.
The first was based on SPIONCitrate-loaded cells stained with crystal violet and incubation on a magnetic plate, whereas the second experiment used live cell imaging to prove the magnetic attraction of cells.
As shown in Figure 7, purified, unwashed and control cells were incubated in a 24-well plate for 48 hrs on top of a 96-well plate supplemented with small magnets. Each well of the 24-well plate was placed on four magnets of the magnetic plate. Every magnet had a magnetic flux density of 499.6 ± 6.2 mT directly on its surface. This value was determined by measuring n = 12 magnets with a Hall effect magnetometer (FM302 with AS-NTM, Projekt Elektronik Mess- und Regelungstechnik, Berlin, Germany). To visualize where the cells sediment in the well, they were stained with crystal violet. Due to faint light conditions and surface reflections, the 24-well plate was carefully removed from the magnet plate after the 48 hrs-incubation period and photographed on an LED light plate (slimlite LED, Kaiser Fototechnik, Buchen, Germany). The particle-free control cells showed sedimentation of the cells over the entire well with a tendency towards the middle of the well. In contrast, the purified as well as the unwashed loaded cells sedimented mainly in the area of the four magnets, which proves the magnetizability of the SPION-loaded cells and attraction by external magnets.
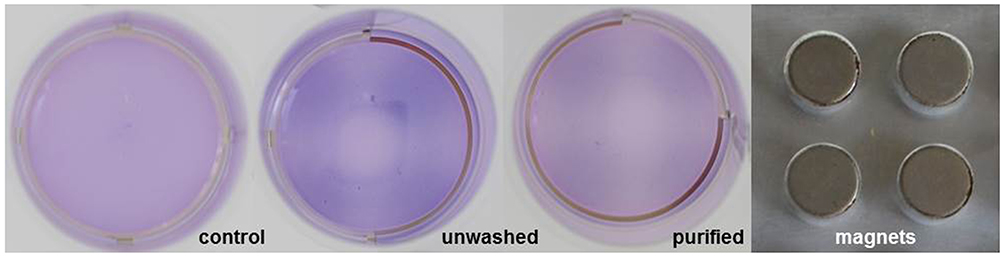 |
Figure 7 Visualization of magnetic attractability of SPIONCitrate-loaded cells. EL4 cells were incubated for 24 hrs with SPIONCitrate at an iron concentration of 75 µg/mL. Subsequently, purified, unwashed and control cells were stained with crystal violet and incubated for 48 hrs on a magnetic plate (approx. 0.5 T). Loaded cells, whether washed or not, preferably sedimented in the area of the magnets. Abbreviation: SPION, superparamagnetic iron oxide nanoparticle. |
In order to observe and quantify the attraction of the loaded cells to a magnet more closely, the process was filmed under a microscope at 10× magnification. Supplementary Video 1 shows purified EL4 cells incubated with SPIONCitrate at an iron concentration of 75 µg/mL. Without the presence of a magnet, the cells were almost stationary. In Supplementary Video 2, a longitudinally magnetized block magnet was placed in the second chamber, as can be seen from the juddering of the video image. With the Hall effect magnetometer, a magnetic flux density of about 240 mT could be measured at the separating barrier of the two chambers on the side of the cells. In the presence of the magnet, the majority of the cells were immediately attracted in the direction of the magnetic field gradient. There were several reasons why the cells had different velocities. Firstly, the microscopic films were performed by focusing on the slide`s surface, since more cells can be observed in that plane due to cell sedimentation. However, sedimentation to the surface leads to cellular adhesion and friction, inhibiting the efficiency of the magnetic attraction. Secondly, a homogeneous loading of cells with SPIONs was not possible. Hence, cells with a high SPION load could be attracted better and faster than cells with lower SPION loading. Finally, the strength of the magnetic field itself decreased with increasing distance, so that the acceleration and speed of the cells depended on the distance to the magnet. The software “Tracker Video Analysis and Modeling Tool” was used to randomly determine the speed of the respective cells at various points in the video. The velocity of the fastest cell examined was about 400 µm/s.
Our video recordings confirmed that it was well possible to load T cells with SPIONCitrate without external intervention so that they could be controlled by means of a magnetic field.
Due to its simplicity and cell compatibility, this method of magnetically controlling T cells could also be used in the future to extend CAR T cell therapy to solid tumors. Previously approved CAR T cell preparations such as Kymriah or Yescarta only target blood cancer and are administered systemically with up to 600 million cells, which can lead to severe side effects such as a cytokine storm.45 If the CAR T cells were loaded with SPIONs, solid tumors could be treated locally with a reduced amount of cells, resulting in an extremely efficient therapy with fewer side effects.46
Conclusion
In this study, we succeeded in developing a system of T cells loaded with superparamagnetic iron oxide nanoparticles, which can be controlled by an external magnet. SPIONCitrate proved to be highly cytocompatible and also stable in blood. The nanoparticles were sufficiently absorbed into EL4 cells without external intervention, and the cell/SPION suspension could be easily purified from excess SPIONs by an immunoaffinity chromatographic method.
This study creates a good starting point for the translation of the methods to ex vivo applications and finally to magnetically controlled immune therapy using SPION-loaded primary T cells.
Acknowledgments
This study was supported by the Emerging Fields Initiative BIG-THERA of the Friedrich-Alexander-Universität Erlangen-Nürnberg (FAU), by the Deutsche Forschungsgemeinschaft (SPP1681: Grant Numbers: AL 552/5-3), Forschungsstiftung Medizin am Universitätsklinikum Erlangen and the Manfred-Roth-Stiftung, Fürth, Germany. The authors also acknowledge the support by Deutsche Forschungsgemeinschaft and FAU within the funding program of Open Access Publishing.
Disclosure
The authors report no conflicts of interest in this work.
References
1. World Health Organization International Agency for Research on Cancer. Fact sheets: world. 2018. Available from: http://gco.iarc.fr/today/data/factsheets/populations/900-world-fact-sheets.pdf.
2. Galon J, Costes A, Sanchez-Cabo F, et al. Type, density, and location of immune cells within human colorectal tumors predict clinical outcome. Science. 2006;313(5795):1960–1964. doi:10.1126/science.1129139
3. Jass JR. Lymphocytic infiltration and survival in rectal cancer. J Clin Pathol. 1986;39(6):585–589. doi:10.1136/jcp.39.6.585
4. Hwang WT, Adams SF, Tahirovic E, Hagemann IS, Coukos G. Prognostic significance of tumor-infiltrating T cells in ovarian cancer: a meta-analysis. Gynecol Oncol. 2012;124(2):192–198. doi:10.1016/j.ygyno.2011.09.039
5. Fridman WH, Pages F, Sautes-Fridman C, Galon J. The immune contexture in human tumours: impact on clinical outcome. Nat Rev Cancer. 2012;12(4):298–306. doi:10.1038/nrc3245
6. Galon J, Angell Helen K, Bedognetti D, Marincola Francesco M. The continuum of cancer immunosurveillance: prognostic, predictive, and mechanistic signatures. Immunity. 2013;39(1):11–26. doi:10.1016/j.immuni.2013.07.008
7. Gajewski TF, Schreiber H, Fu Y-X. Innate and adaptive immune cells in the tumor microenvironment. Nat Immunol. 2013;14(10):1014–1022. doi:10.1038/ni.2703
8. Lanitis E, Dangaj D, Irving M, Coukos G. Mechanisms regulating T-cell infiltration and activity in solid tumors. Ann Oncol. 2017;28(suppl_12):xii18–xii32. doi:10.1093/annonc/mdx075
9. Kather JN, Suarez-Carmona M, Charoentong P, et al. Topography of cancer-associated immune cells in human solid tumors. eLife. 2018;7:e36967. doi:10.7554/eLife.42270
10. Carreau NA, Pavlick AC. Nivolumab and ipilimumab: immunotherapy for treatment of malignant melanoma. Future Oncol. 2019;15(4):349–358. doi:10.2217/fon-2018-0607
11. Saruwatari K, Sato R, Nakane S, et al. The risks and benefits of immune checkpoint blockade in anti-AChR antibody-seropositive non-small cell lung cancer patients. Cancers. 2019;11(2):140. doi:10.3390/cancers11020140
12. van der Woude LL, Gorris MAJ, Halilovic A, Figdor CG, de Vries IJM. Migrating into the tumor: a roadmap for T cells. Trends Cancer. 2017;3(11):797–808. doi:10.1016/j.trecan.2017.09.006
13. Baeuerle PA, Reinhardt C. Bispecific T-cell engaging antibodies for cancer therapy. Cancer Res. 2009;69(12):4941. doi:10.1158/0008-5472.CAN-08-3660
14. Staton T. Amgen slaps record-breaking $178K price on rare leukemia drug Blincyto. 2014. Available from: https://www.fiercepharma.com/marketing/amgen-slaps-record-breaking-178k-price-on-rare-leukemia-drug-blincyto.
15. Amann M, D’Argouges S, Lorenczewski G, et al. Antitumor activity of an EpCAM/CD3-bispecific BiTE antibody during long-term treatment of mice in the absence of T-cell anergy and sustained cytokine release. J Immunother. 2009;32(5):452–464. doi:10.1097/CJI.0b013e3181a1c097
16. Bean CP, Livingston JD. Superparamagnetism. J Appl Phys. 1959;30(4):S120–S129. doi:10.1063/1.2185850
17. Wahajuddin AS. Superparamagnetic iron oxide nanoparticles: magnetic nanoplatforms as drug carriers. Int J Nanomedicine. 2012;7:3445–3471. doi:10.2147/IJN.S30320
18. Tietze R, Lyer S, Durr S, et al. Efficient drug-delivery using magnetic nanoparticles–biodistribution and therapeutic effects in tumour bearing rabbits. Nanomedicine. 2013;9(7):961–971. doi:10.1016/j.nano.2013.05.001
19. Vanecek V, Zablotskii V, Forostyak S, et al. Highly efficient magnetic targeting of mesenchymal stem cells in spinal cord injury. Int J Nanomedicine. 2012;7:3719–3730. doi:10.2147/IJN.S32824
20. Chen J, Huang N, Ma B, et al. Guidance of stem cells to a target destination in vivo by magnetic nanoparticles in a magnetic field. ACS Appl Mater Interfaces. 2013;5(13):5976–5985. doi:10.1021/am400249n
21. Cores J, Caranasos TG, Cheng K. Magnetically targeted stem cell delivery for regenerative medicine. J Funct Biomater. 2015;6(3):526–546. doi:10.3390/jfb6030526
22. Goya GF, Marcos-Campos I, Fernandez-Pacheco R, et al. Dendritic cell uptake of iron-based magnetic nanoparticles. Cell Biol Int. 2008;32(8):1001–1005. doi:10.1016/j.cellbi.2008.04.001
23. Zhang Q, Wei W, Wang P, et al. Biomimetic magnetosomes as versatile artificial antigen-presenting cells to potentiate T-cell-based anticancer therapy. ACS Nano. 2017;11(11):10724–10732. doi:10.1021/acsnano.7b04955
24. Mühlberger M, Janko C, Unterweger H, et al. Functionalization of T lymphocytes for magnetically controlled immune therapy: selection of suitable superparamagnetic iron oxide nanoparticles. J Magn Magn Mater. 2019;473:61–67. doi:10.1016/j.jmmm.2018.10.022
25. Elbialy NS, Fathy MM, Khalil WM. Doxorubicin loaded magnetic gold nanoparticles for in vivo targeted drug delivery. Int J Pharm. 2015;490(1–2):190–199. doi:10.1016/j.ijpharm.2015.05.032
26. Lugert S, Unterweger H, Muhlberger M, et al. Cellular effects of paclitaxel-loaded iron oxide nanoparticles on breast cancer using different 2D and 3D cell culture models. Int J Nanomedicine. 2019;14:161–180. doi:10.2147/IJN.S187886
27. Munoz LE, Maueroder C, Chaurio R, Berens C, Herrmann M, Janko C. Colourful death: six-parameter classification of cell death by flow cytometry–dead cells tell tales. Autoimmunity. 2013;46(5):336–341. doi:10.3109/08916934.2012.755960
28. Friedrich RP, Janko C, Poettler M, et al. Flow cytometry for intracellular SPION quantification: specificity and sensitivity in comparison with spectroscopic methods. Int J Nanomedicine. 2015;10:4185–4201. doi:10.2147/IJN.S82714
29. Hanani M. Lucifer yellow - an angel rather than the devil. J Cell Mol Med. 2012;16(1):22–31. doi:10.1111/j.1582-4934.2011.01378.x
30. Swanson JA, Yirinec BD, Silverstein SC. Phorbol esters and horseradish peroxidase stimulate pinocytosis and redirect the flow of pinocytosed fluid in macrophages. J Cell Biol. 1985;100(3):851–859. doi:10.1083/jcb.100.3.851
31. Mühlberger M, Janko C, Unterweger H, et al. Non-magnetic chromatographic separation of colloidally metastable superparamagnetic iron oxide nanoparticles and suspension cells. J Chromatogr B. 2019;1122–1123:83–89. doi:10.1016/j.jchromb.2019.05.033
32. Poller JM, Zaloga J, Schreiber E, et al. Selection of potential iron oxide nanoparticles for breast cancer treatment based on in vitro cytotoxicity and cellular uptake. Int J Nanomedicine. 2017;12:3207–3220. doi:10.2147/IJN.S132369
33. Mosmann T. Rapid colorimetric assay for cellular growth and survival: application to proliferation and cytotoxicity assays. J Immunol Methods. 1983;65(1–2):55–63. doi:10.1016/0022-1759(83)90303-4
34. Bahring F, Schlenk F, Wotschadlo J, et al. Suitability of Viability Assays for Testing Biological Effects of Coated Superparamagnetic Nanoparticles. IEEE Transactions on Magnetics. 2013;49(1):383–388.
35. Mühleisen L, Alev M, Unterweger H, et al. Analysis of hypericin-mediated effects and implications for targeted photodynamic therapy. Int J Mol Sci. 2017;18(7):1388. doi:10.3390/ijms18071388
36. Wang H, Joseph JA. Quantifying cellular oxidative stress by dichlorofluorescein assay using microplate reader. Free Radic Biol Med. 1999;27(5–6):612–616. doi:10.1016/S0891-5849(99)00107-0
37. Foucaud L, Wilson MR, Brown DM, Stone V. Measurement of reactive species production by nanoparticles prepared in biologically relevant media. Toxicol Lett. 2007;174(1–3):1–9. doi:10.1016/j.toxlet.2007.08.001
38. Marsh M, McMahon HT. The structural era of endocytosis. Science. 1999;285(5425):215. doi:10.1126/science.285.5425.215
39. Beer AJ, Holzapfel K, Neudorfer J, et al. Visualization of antigen-specific human cytotoxic T lymphocytes labeled with superparamagnetic iron-oxide particles. Eur Radiol. 2008;18(6):1087–1095. doi:10.1007/s00330-008-0874-4
40. Liu L, Ye Q, Wu Y, et al. Tracking T-cells in vivo with a new nano-sized MRI contrast agent. Nanomedicine. 2012;8(8):1345–1354. doi:10.1016/j.nano.2012.02.017
41. Garden OA, Reynolds PR, Yates J, et al. A rapid method for labelling CD4+ T cells with ultrasmall paramagnetic iron oxide nanoparticles for magnetic resonance imaging that preserves proliferative, regulatory and migratory behaviour in vitro. J Immunol Methods. 2006;314(1–2):123–133. doi:10.1016/j.jim.2006.06.010
42. Zhao X, Su H, Yin G, Liu X, Liu Z, Suo X. High transfection efficiency of porcine peripheral blood T cells via nucleofection. Vet Immunol Immunopathol. 2011;144(3–4):179–186. doi:10.1016/j.vetimm.2011.10.003
43. Ebert O, Finke S, Salahi A, et al. Lymphocyte apoptosis: induction by gene transfer techniques. Gene Ther. 1997;4:296. doi:10.1038/sj.gt.3300394
44. Chicaybam L, Sodre AL, Curzio BA, Bonamino MH. An efficient low cost method for gene transfer to T lymphocytes. PLoS One. 2013;8(3):e60298–e60298. doi:10.1371/journal.pone.0060298
45. Vairy S, Garcia JL, Teira P, Bittencourt H. CTL019 (tisagenlecleucel): CAR-T therapy for relapsed and refractory B-cell acute lymphoblastic leukemia. Drug Des Devel Ther. 2018;12:3885–3898. doi:10.2147/DDDT.S138765
46. Yu S, Li A, Liu Q, et al. Chimeric antigen receptor T cells: a novel therapy for solid tumors. J Hematol Oncol. 2017;10(1):78. doi:10.1186/s13045-017-0444-9
 © 2019 The Author(s). This work is published and licensed by Dove Medical Press Limited. The
full terms of this license are available at https://www.dovepress.com/terms
and incorporate the Creative Commons Attribution
- Non Commercial (unported, 3.0) License.
By accessing the work you hereby accept the Terms. Non-commercial uses of the work are permitted
without any further permission from Dove Medical Press Limited, provided the work is properly
attributed. For permission for commercial use of this work, please see paragraphs 4.2 and 5 of our Terms.
© 2019 The Author(s). This work is published and licensed by Dove Medical Press Limited. The
full terms of this license are available at https://www.dovepress.com/terms
and incorporate the Creative Commons Attribution
- Non Commercial (unported, 3.0) License.
By accessing the work you hereby accept the Terms. Non-commercial uses of the work are permitted
without any further permission from Dove Medical Press Limited, provided the work is properly
attributed. For permission for commercial use of this work, please see paragraphs 4.2 and 5 of our Terms.