Back to Journals » Nature and Science of Sleep » Volume 13
Functional MRI Correlates of Sleep Quality in HIV
Authors Venkataraman A ![]() , Zhuang Y
, Zhuang Y ![]() , Marsella J, Tivarus ME, Qiu X, Wang L, Zhong J, Schifitto G
, Marsella J, Tivarus ME, Qiu X, Wang L, Zhong J, Schifitto G
Received 14 November 2020
Accepted for publication 19 January 2021
Published 2 March 2021 Volume 2021:13 Pages 291—301
DOI https://doi.org/10.2147/NSS.S291544
Checked for plagiarism Yes
Review by Single anonymous peer review
Peer reviewer comments 2
Editor who approved publication: Dr Steven Shea
Arun Venkataraman,1 Yuchuan Zhuang,2 Jennifer Marsella,3 Madalina E Tivarus,4,5 Xing Qiu,6 Lu Wang,6 Jianhui Zhong,1,4 Giovanni Schifitto3,4
1Department of Physics and Astronomy, University of Rochester, Rochester, NY, USA; 2Department of Electrical and Computer Engineering, University of Rochester, Rochester, NY, USA; 3Department of Neurology, University of Rochester Medical Center, Rochester, NY, USA; 4Department of Imaging Sciences, University of Rochester Medical Center, Rochester, NY, USA; 5Department of Neuroscience, University of Rochester Medical Center, Rochester, NY, USA; 6Department of Biostatistics and Computational Biology, University of Rochester, Rochester, NY, USA
Correspondence: Arun Venkataraman Email [email protected]
Objective: To examine resting-state functional MRI (rs-fMRI) networks related to sleep in the context of HIV infection.
Methods: rs-fMRI data were collected in 40 HIV-infected (HIV+) individuals at baseline (treatment-naive), 12 week (post-treatment) and one year timepoints. A group of 50 age-matched HIV-negative (HIV-) individuals were also imaged at baseline and one year timepoints. The Pittsburgh Sleep Quality Index (PSQI) questionnaire was administered at all timepoints. Using group independent component analysis (ICA), maps of functional networks were generated from fMRI data; from these, sleep-related networks were selected. A generalized linear model (GLM) was used to analyze if these networks were significantly associated with the PSQI score, and if this relationship was influenced by HIV status/treatment or timepoint.
Results: HIV+ individuals had significantly lower PSQI score after treatment (p=0.022). Networks extracted from group ICA analysis included the anterior and posterior default mode network (DMN), central executive network (CEN), bilateral frontoparietal networks (FPNs), and the anterior cingulate cortex salience network (ACC SN). We found the posterior DMN, right FPN, and ACC SN GLMs showed significantly higher goodness-of-fit after incorporating PSQI data (p = 0.0204, 0.044, 0.044, respectively). Furthermore, the correlation between ACC SN and posterior DMN connectivity was significantly decreased in the HIV+ cohort.
Conclusion: Functional networks such as the DMN, FPN, CEN, and ACC SN are altered in poor sleep, as measured by the PSQI score. Furthermore, the relationship between these networks and PSQI is different in the HIV+ and HIV- populations.
Keywords: HIV, fMRI, sleep quality, functional connectivity
Introduction
Sleep abnormalities are one of the most frequent complaints reported by human immunodeficiency virus (HIV)-infected individuals.1,2 Rubenstein and Selwyn3 found that 73% of their HIV-infected cohort had some form of sleep disturbance and 100% of those subjects with cognitive impairment suffered from insomnia. These findings might suggest that there is some interaction between cognitive changes and sleep disturbance in HIV-infected subjects, which has been seen in normal populations after sleep deprivation.4,5 Low et al6 suggested that duration of HIV infection was associated with sleep disturbance severity and prevalence, based on findings from a meta-analysis. This implies a cumulative effect of HIV-associated chronic CNS inflammation arising from the Central Nervous System (CNS) viral reservoir which persists despite combined antiretroviral therapy (cART) well-controlled systemic viremia. In addition, sleep has been found to be disrupted in HIV even after controlling for mood, which suggests the sleep disturbances are not only secondary to neuropsychiatric conditions.7 Therefore, the understanding of the interaction between HIV and sleep disturbances remains to be better defined.
HIV-infected individuals are subject to sleep disorders as well as related changes to sleep architecture. The most common sleep disorders in HIV-infected individuals are insomnia and obstructive sleep apnea.8,9 The latter is thought to be caused by cART-related lipodystrophy and HIV-related inflammation. In terms of sleep architecture, HIV-positive individuals show more slow-wave sleep later in the night compared to healthy controls.10 It has further been found that sleep quality, as measured by the Pittsburgh Sleep Quality Index (PSQI) and Epworth Sleepiness Scale (ESS), is not related to viral load, CD4+ cell count, or medication,11 although there have been relationships between individual medications such as efavirenz and insomnia in HIV.12–14 Based on this data, the pathogenesis of sleep disruption in HIV is probably multifactorial, and prior studies have not addressed the interplay between treatment effect and disease progression.
In patients with insomnia and sleep-deprivation, changes in sleeping patterns are correlated with functional MRI (fMRI) changes in brain regions and networks associated with attention and working memory (frontoparietal network, FPN),15 attention (executive control network, ECN),16 and the Default Mode Network (DMN).17 Functional connectivity (FC) between the thalamus and cortical regions tends to decrease following sleep deprivation.18 In addition, insomnia has been shown to decrease FC within the DMN19 and decrease activation of the thalamus.20 To our knowledge, there are no previous studies linking fMRI networks and sleep quality in the HIV-infected population. However, it has been noted that changes in functional connectivity are seen when switching cART medications,21 especially in the attention networks. Furthermore, patients with HIV-associated cognitive impairment show remodeling of the DMN.22 Despite the lack of previous publications studying fMRI connectivity in sleep in HIV-infected individuals, we see that similar networks are altered in other dimensions of HIV (eg, cognition), and thus it can be expected that these networks may also be implicated in sleep disturbances in this population.
In this study, we analyze the resting-state functional connectivity (FC) of various brain networks to understand changes in networks associated with sleep quality in HIV. We hypothesize that HIV-infected individuals have unique changes to functional networks that are not seen in the HIV-negative population.
Methods
Subjects
A total of 40 HIV-infected (HIV+) individuals and 50 age-matched HIV-negative (HIV-) controls were enrolled at baseline and used for analysis. As part of a study to understand neurologic changes with cART treatment, HIV+ subjects were recruited from local infectious disease and specialized HIV clinics, while HIV- subjects were recruited from the community at large. Inclusion criteria included age over 18, being cART-naïve, HIV-1 infection documented by HIV test or 2 HIV-1 plasma RNA values >2000 copies/mL at a CLIA certified lab, for the HIV+ population, or negative HIV test within 6 months of enrollment for HIV- and undetectable HIV plasma RNA at screening. Notably, there were no sleep criteria that had to be met for enrollment. Exclusion criteria included dementia, premorbid/comorbid psychiatric disorders, chronic seizures, head trauma, brain infection (other than HIV infection), neoplasm, and active drug abuse. Consent was obtained from all subjects prior to study commencement; all subjects were informed about the purpose of the study and the study was conducted in accordance with the Declaration of Helsinki. All consent forms and data storage plans were approved by the University of Rochester Institutional Review Board. Data from HIV+ individuals were acquired at three visits: baseline, 12 weeks, and 1 year; data from HIV- individuals were acquired at each of these visits except for 12 weeks. After the baseline assessment, all HIV+ subjects were started on cART. Two analyses were conducted: short-term and long-term follow-up. The short-term analysis consisted of HIV+ subjects scanned at baseline and 12-week visits and HIV- subjects at baseline. The main purpose of this analysis was to quantify short-term cART treatment effect, if any. The long-term analysis consisted of HIV+ subjects scanned at 12 weeks (used as baseline of cART treated patients) or baseline for HIV- subjects and one year timepoints for all subjects. It should be noted that these groups included different individuals due to patient dropout. This analysis was used to quantify the longitudinal characteristics of sleep and networks in cART treated patients. Tables 1 and 2 describe the demographics for each of the short- and long-term analyses, respectively.
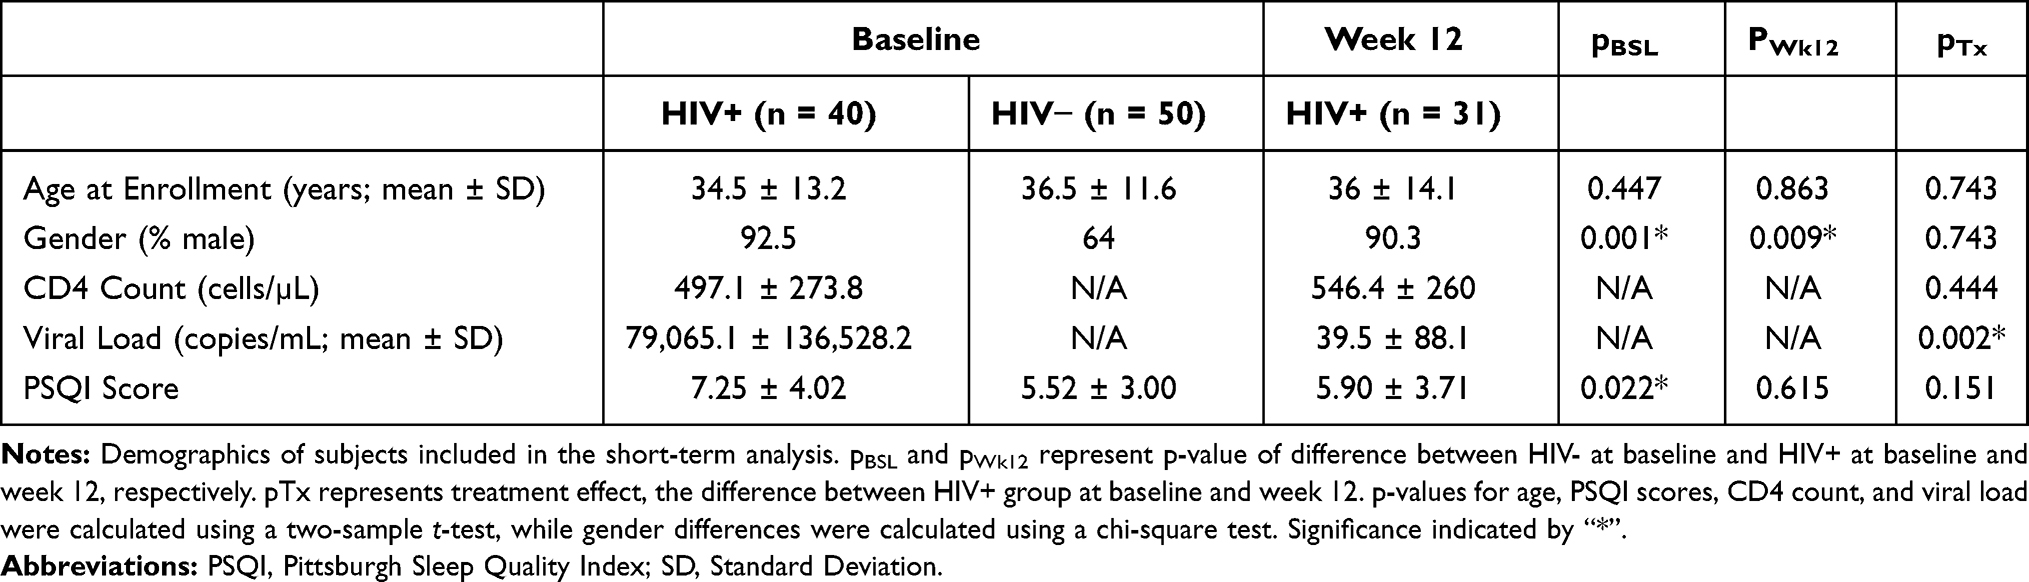 |
Table 1 Short-Term Analysis Demographics |
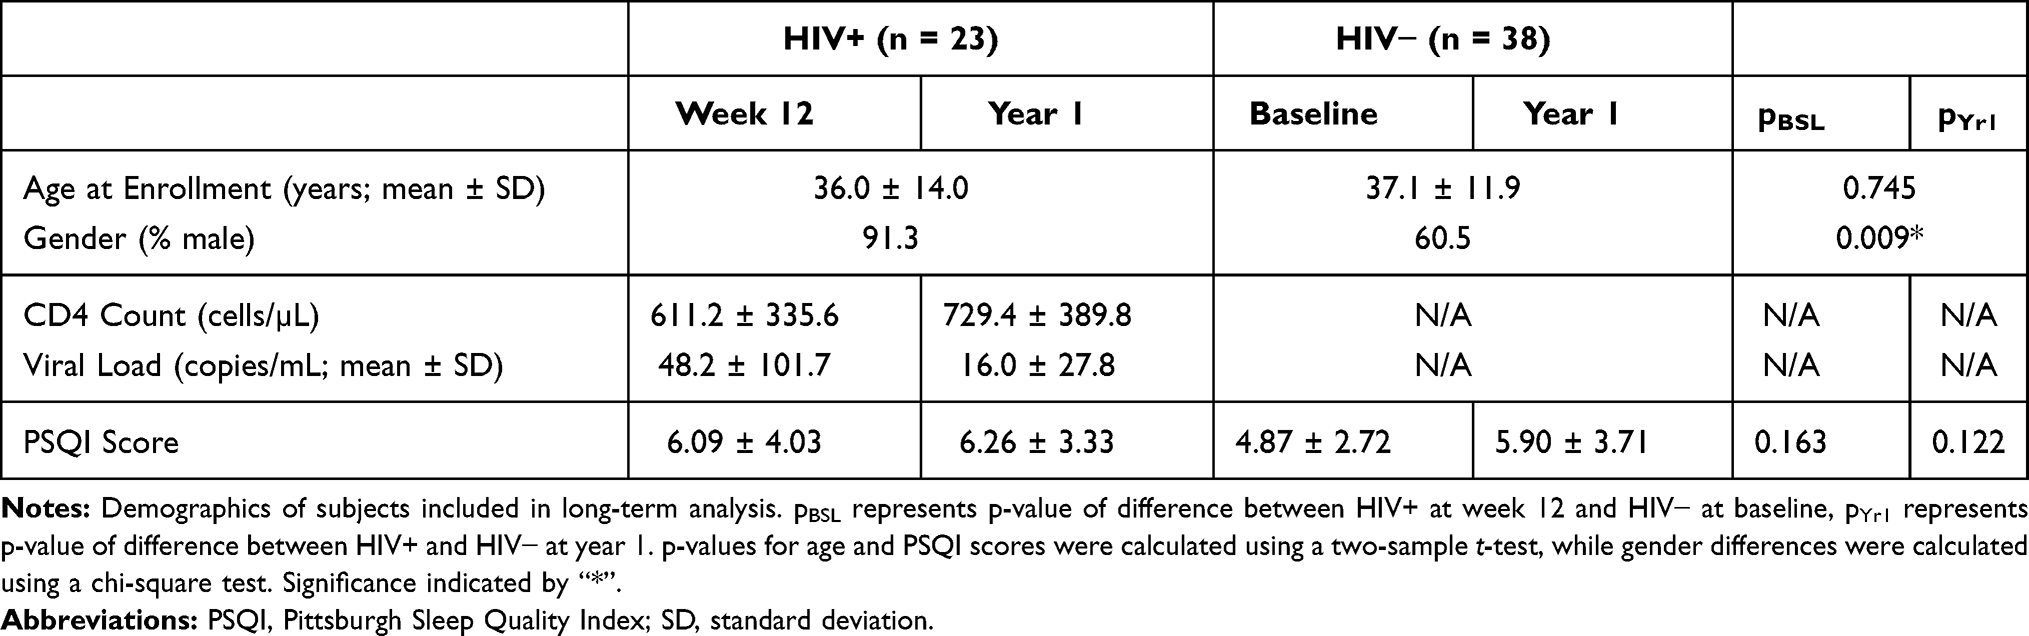 |
Table 2 Long-Term Analysis Demographics |
Sleep Quality Assessment
All subjects underwent a sleep quality assessment using a self-report questionnaire, the Pittsburgh Sleep Quality Index (PSQI).23 PSQI scores range from 0 to 21 and a lower PSQI score represents better sleep quality; generally, a cut-off PSQI global score >5 is used to define a poor sleeper group, while those with a PSQI score ≤5 are defined as good sleepers. The cut-off score of 5 was chosen based on Buysse et al,23 who found a sensitivity of 89.6% and specificity of 86.5% for identifying cases with sleep disorder using such cut-off. The PSQI questionnaire was completed at every time point.
MRI Image Acquisition
MRI data were acquired on a 3T Siemens MAGNETOM Trio MRI scanner equipped with a 32-channel head coil. T1-weighted images were acquired with a 3D magnetization-prepared rapid acquisition gradient echo sequence (MPRAGE, TR/TI/TE = 2530/1100/3.44 ms, voxel size = 1x1x1 mm3, flip angle = 78°, bandwidth = 190 Hz/pixel). Resting-state functional MRI (rs-fMRI) was acquired using a GE-EPI sequence (TR/TE = 2000/30 ms, flip angle = 90°, voxel size = 4x4x4 mm3; matrix size = 64x64, 30 axial slices, volumes = 150). During the entire 5 minutes resting-state fMRI scan, participants were instructed to keep their eyes open and avoid falling asleep.
Image Processing
For resting-state fMRI processing, the first six volumes acquired to allow for stabilization of the magnetization were discarded. Standard pre-processing steps were performed using FSL (FMRIB’s Software Library) FEAT tool,24 including slice timing correction, head motion correction, co-registration to subject’s T1-weighted image, non-linear normalization to an MNI space template, spatial smoothing with Gaussian kernel (full-width half-maximum; FWHM= 4mm), detrending, and band-pass filtering (0.01Hz to 0.08Hz). Nuisance covariates were regressed out including 6 head motion parameters, signals from white matter and CSF. Motion parameters calculated in FEAT were analyzed to determine any group differences in absolute- the amount of subject motion compared to the first brain volume, and relative- the amount of subject motion compared to the previous volume, motion. After pre-processing, the Group independent component analysis (ICA) of fMRI Toolbox (GIFT, http://mialab.mrn.org/software/gift/index.html) was used to produce t-score maps reflecting functional maps of 30 components, selected as the lowest number that allowed identification of components representing both the anterior and posterior DMNs. Networks were identified by visual inspection and further Dice coefficient quantification of each component map with a standard template.25 The Dice coefficient describes the proportion of overlapping voxels between the component map and a standard template, with scores ranging from 0 (no overlap) to 1 (identical maps, perfect overlap).
Statistics
Each of the components from group ICA analysis was assigned into a generalized linear model (GLM) using the FSL GLM tool.26 Using FSL randomise,27,28 the GLM model quantified the slope between the ICA map value and PSQI score over all voxels and reported the p-value of this correlation after 500 permutations and multiple comparison correction. Multiple comparison correction was done by controlling the family-wise error rate described in previous work.29 Voxels of significance were intrinsically clustered using threshold-free cluster enhancement (TFCE) in FSL randomise tool. ROIs were derived from the p-value maps by thresholding at p < 0.05. These regions signified areas where the ICA-derived t-score and PSQI scores were significantly related; these regions were used for the remaining analysis.
After fitting the initial GLM, we sought to assess treatment effects and cohort difference using a linear model for the short- and long-term data that included correction for age and sex, as well as assessment of visit and cohort effect (only in the long-term model). For the short-term analysis, since the HIV- group does not have a 12-week timepoint, we assessed the linear model fMRI~PSQI+Age+Sex at each time point for each cohort. For the long-term analysis, we used a mixed-effects model; the 12-week visit was used as the new baseline for the HIV+ cohort. To assess whether the mixed-effects model was significant we used a log-ratio test (LRT) to quantify goodness of model fit. Our base model consisted of fitting the fMRI t-score as a function of age and gender with a random effect of the HIV-status on the intercept (Equation 1). We also fit two more comprehensive models: the first, mainly exploring sleep effects, had the same structure as the base model, but also had factors to account for the interaction between the PSQI score and HIV-status as well as the random effect of HIV-status on PSQI score (Equation 2), the second model mainly assessed the added influence of timepoint, which has the features of the sleep effect model with added covariates of visit, interaction of visit with HIV-status, and random effects of HIV-status on visit (Equation 3).

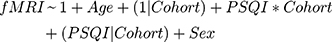
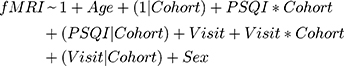
Here, “*” indicates an interaction and (x|y) represents the random effects of y on x; (1|x) represents the random effects of the y-intercept on x. P-values were calculated from the LRT using a chi-square statistic with degrees of freedom equal to the number of fixed parameters added from the base model. All reported p-values are corrected for multiple comparisons using the false discovery rate (FDR) correction.
Results
PSQI Scores in HIV
In the short-term data (Table 1), PSQI scores in the HIV+ group were significantly higher than in the HIV- group at the baseline timepoint; however, after treatment, this group difference was not significant. At baseline, 25 out of 40 (62.5%) in HIV+ and 22 out of 50 (44%) in HIV- scored >5 at the PSQI, indicating poor sleep quality. At 12 weeks, 11 out of 31 subjects (35.4%) of HIV+ group had poor sleep, which is significantly different from the HIV+ at baseline (χ2 = 5.1, p = 0.024). For the long-term analysis, where the HIV+ week 12 timepoint was treated as a new baseline, no significant difference was seen in PSQI score at the new baseline or 1 year between HIV+ and HIV- groups.
Head Motion Analysis
There was no significant difference in either absolute or relative head motion between cohorts at any timepoint.
Functional Networks Related to PSQI Scores
Figure 1 shows maps of networks that demonstrated a significant correlation between the ICA map and the PSQI score based on data from the entire cohort. Since the ICA separates components without a priori information, a single network may be split into multiple components, as is seen with the default mode network (DMN) and frontoparietal network (FPN). DMN 1 reflects the posterior regions of the DMN (precuneus network), which we can see with the high Dice coefficients in the dorsal DMN and precuneus, while DMN 2 reflects the anterior portion (medial prefrontal cortex; mPFC) and connection to the FPN, which are reflected in the high dorsal DMN Dice coefficient with a lower precuneus Dice coefficient. In DMN1 the ROI found to be significantly related to PSQI score was located in the precuneus. Therefore, the FC between the precuneus and DMN1 is significantly related to PSQI score. Other networks that were found to be related to the PSQI score include the central executive network (CEN), which showed a high Dice coefficient with the anterior salience network and left/right executive control networks. The FPNs showed high Dice coefficient with the ipsilateral executive control network, which makes sense, as the FPN and executive control network both involve regions of frontal and parietal activation. The anterior cingulate cortex salience network (ACC SN) showed high overlap with the DMN, as there is medial frontal cortex activation in both networks; we further see that our ACC SN matches ACC SN as shown in previous literature.30 Locations and coordinates of significant ROIs from GLM analysis are given in Table 3.
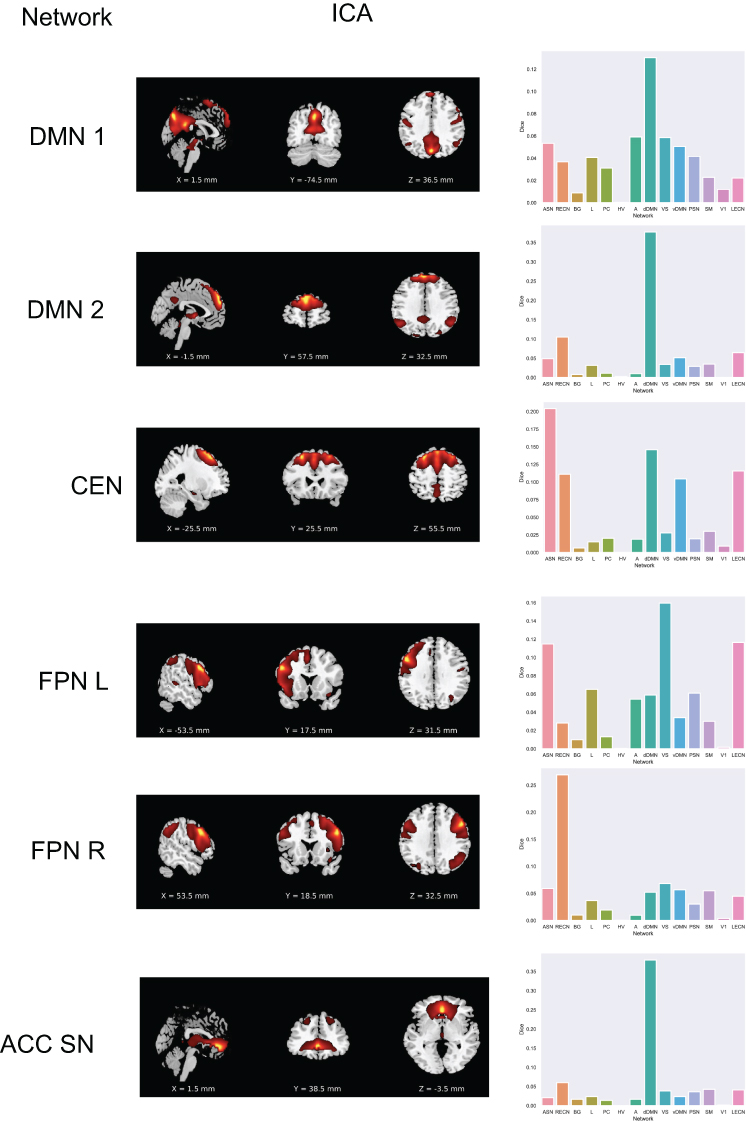 |
Figure 1 ICA networks (left column) and corresponding ROIs (right column) of networks found to be significantly correlated with PSQI score. ROIs are regions demonstrating significant relationship between ICA t-score and PSQI score. Abbreviations: DMN, default mode network; CEN, central executive network; FPN, frontoparietal network; ACC SN, anterior cingulate cortex salience network; ICA, independent component analysis; ROI, region of interest; ASN, anterior salience network; RECN, right executive control network; BG, basal ganglia; L, language network; PC, precuneus network; HV, high visual network; A, auditory network; dDMN, dorsal DMN; VS, visuospatial network; vDMN, vental DMN; PSN, posterior salience network; SM, sensorimotor network; V1, primary visual network; LECN, left executive control network. |
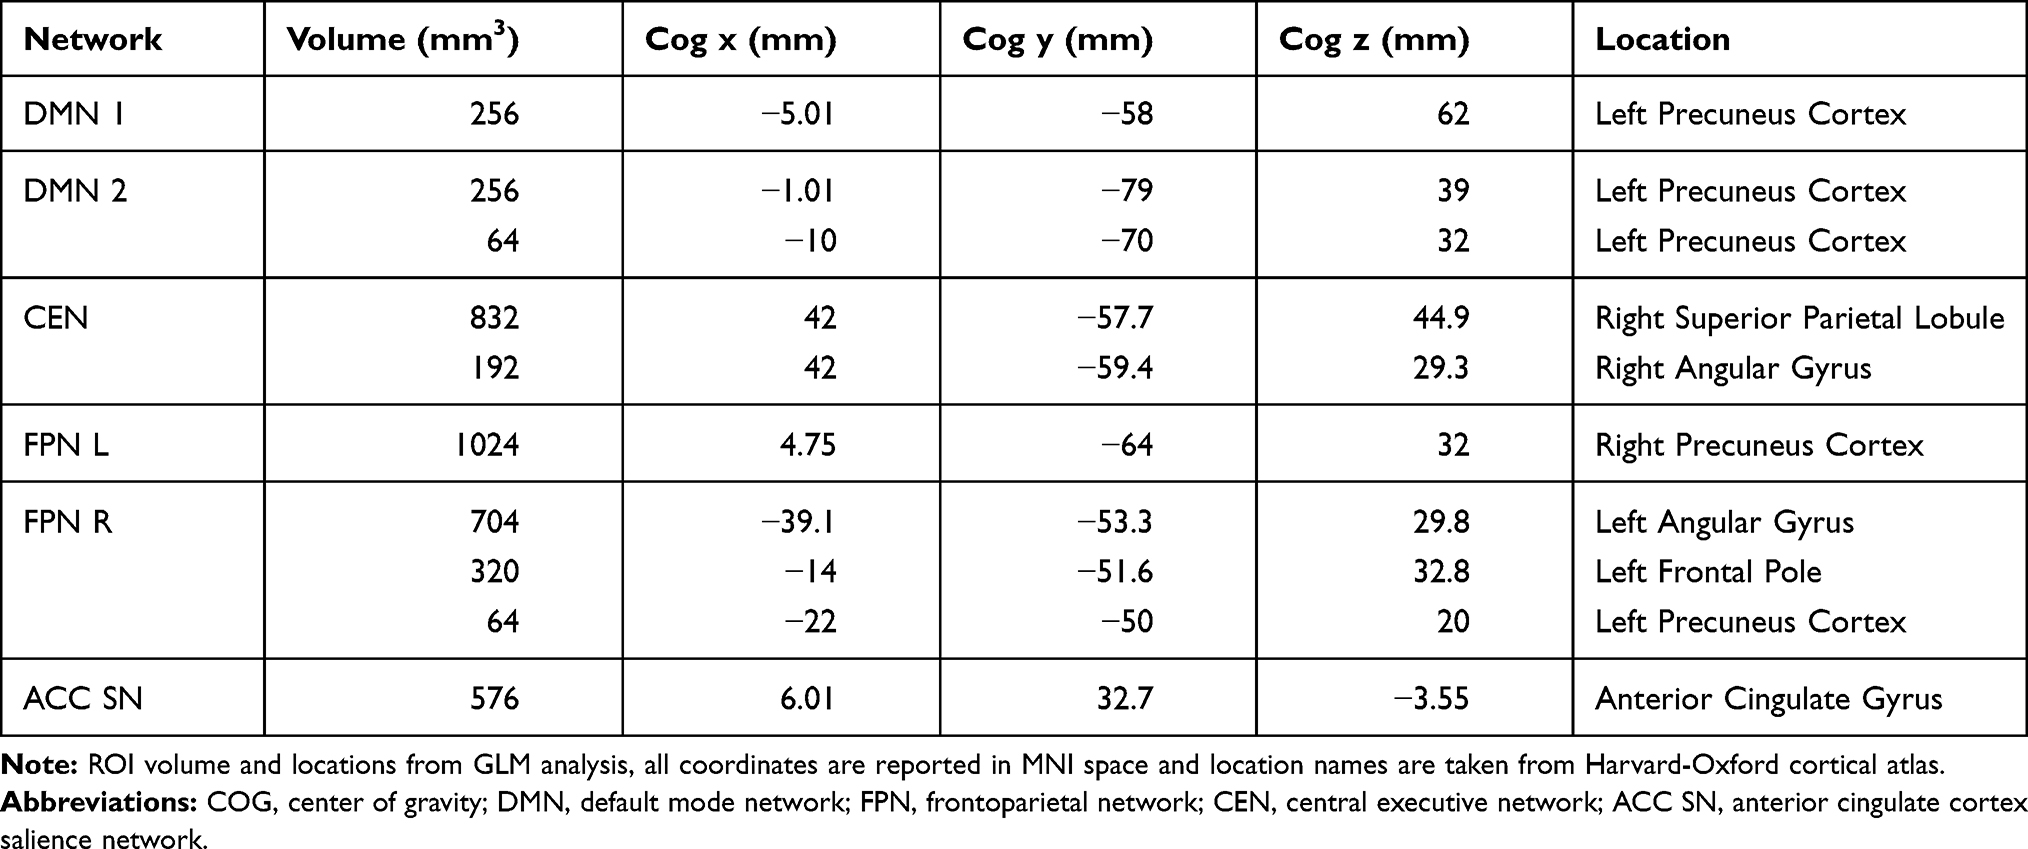 |
Table 3 GLM-Derived ROI Volumes and Positions |
Short-Term Functional Correlates of PSQI Score
Figure 2 shows the results of the GLM in the short-term analysis. All significant relationships also meet Cohen’s criteria for “meaningful” correlations with r > 0.3.31
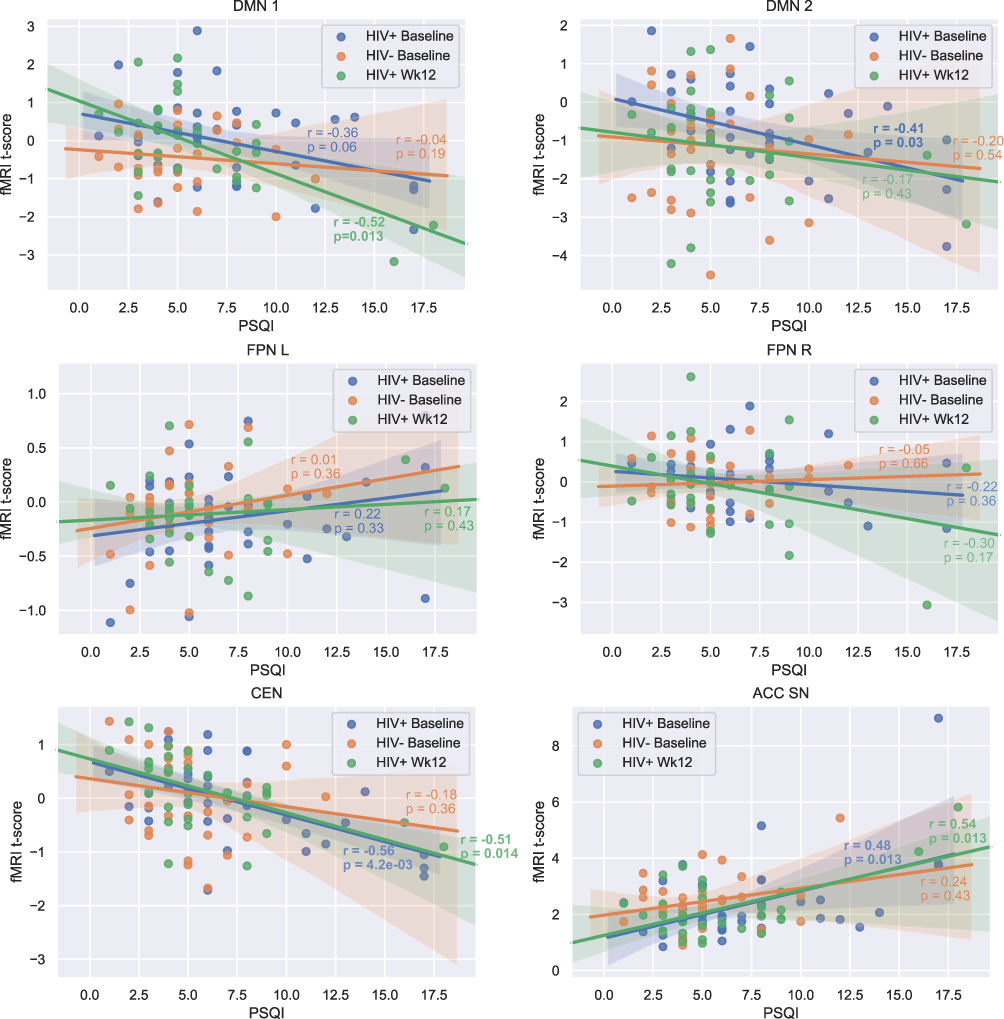 |
Figure 2 Results from linear model after age and gender correction, r represents partial correlation coefficient between PSQI and fMRI t-score, p-values represent significance of PSQI slope coefficient. All p-values have been corrected for multiple comparisons. In all graphs, blue represents HIV+ baseline group, orange represents the HIV− baseline, and green represents the HIV+ group at 12 weeks (“Wk12”). Abbreviations: DMN, default mode network; CEN, central executive network; FPN, frontoparietal network; ACC SN, anterior cingulate cortex salience network; PSQI, Pittsburgh Sleep Quality Index. |
DMN Connectivity
In the posterior DMN 1, we see that the HIV+ group has a significant negative relationship between the PSQI score and fMRI t-score at 12 weeks that is not seen in the HIV- or HIV+ groups at baseline. This suggests that there is stronger FC between the posterior DMN and the precuneus and may reflect worsened sleep quality (eg, higher PSQI) in HIV+ individuals even after treatment. In DMN 2, which incorporates the FPN and mPFC, there is a significant negative relationship between the PSQI score and fMRI t-score in the HIV+ baseline group. These results suggest that FC of separate regions in the DMN are uniquely associated with sleep changes depending on HIV status and treatment.
FPN Connectivity
In the FPN, the same relationship holds bilaterally: there are no significant relationships in either group at any of the timepoints. However, there is an opposite trend of slopes in the HIV+ data in the left and right FPN, the slope is positive in the L FPN and negative in the R FPN, suggesting the possibility that there are subtle alterations specific to each side of the FPN in HIV.
CEN Connectivity
The CEN shows a similar pattern to the DMN 1 component, suggesting that decreased FC between the CEN and parietal lobe in HIV+ individuals is tied to worsened sleep quality at the 12-week timepoint. In addition, this relationship is seen in the baseline of the HIV+ data, which suggests that this relationship is not a treatment effect.
ACC SN Connectivity
In the ACC SN, the HIV+ group had a significant positive relationship, suggesting that increased FC within the ACC SN with the anterior cingulate is related to worsened sleep quality only in HIV+ individuals.
Long-Term Functional Correlates of PSQI Scores
Table 4 outlines the LRT results from the mixed-effects linear models used to assess the relationship between PSQI score and FC. Only the PSQI model added additional information to the model fitting (second column in table). Figure 2 shows plots for the PSQI model for the networks with significant LRT results.
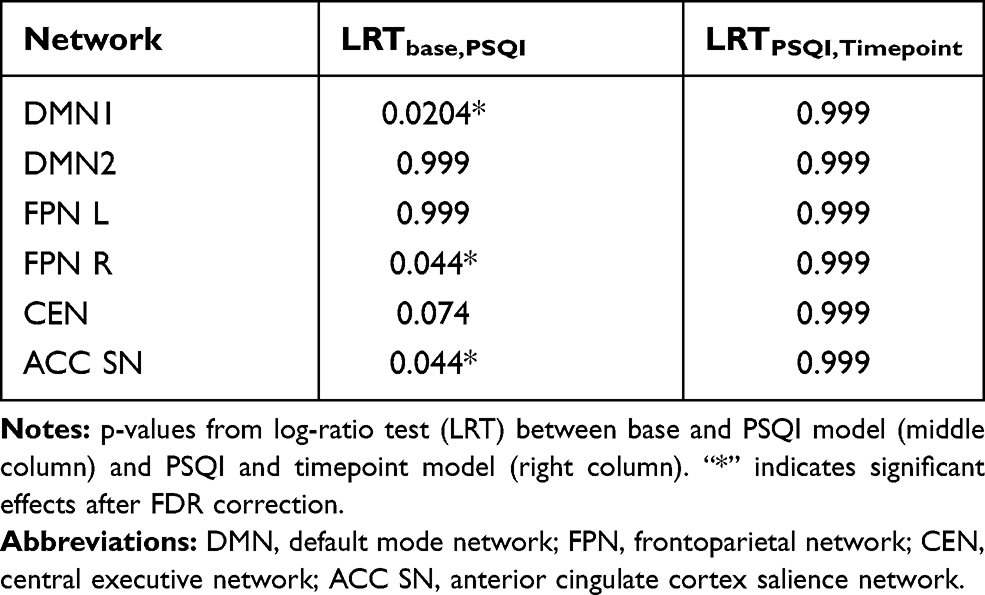 |
Table 4 Log-Ratio Test Results from GLM Fitting |
DMN Connectivity
The long-term analysis revealed significant changes in the DMN 1 network, but not DMN 2. In Figure 3, we see that the relationship between the PSQI score and fMRI t-score is more negative in the HIV+ group. This is similar to what is seen in Figure 2, in the HIV+ group at the 12-week timepoint.
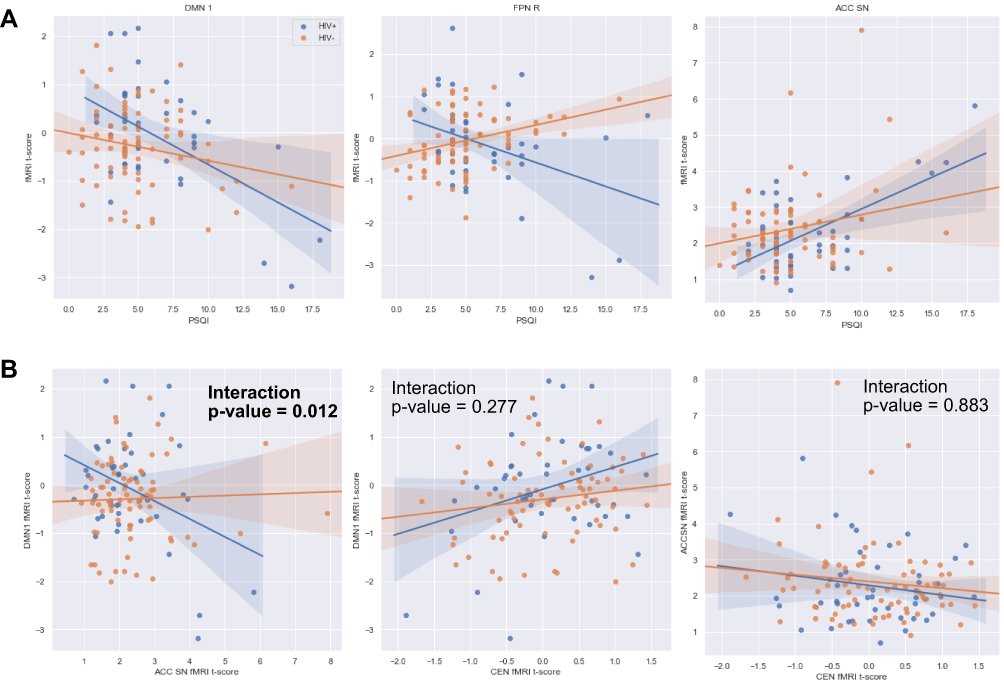 |
Figure 3 (A) Results of mixed effects model with population estimates of fMRI t-score based on the PSQI score in HIV− (orange) and HIV+ (blue) populations in DMN1 (left), right FPN (middle), and ACC SN (right). (B) Results of ANCOVA comparing relationship between ACC SN, CEN, and DMN1 fMRI values between cohorts. Abbreviations: DMN, default mode network; FPN, frontoparietal network; ACC SN, anterior cingulate cortex salience network; PSQI, Pittsburgh Sleep Quality Index. |
FPN Connectivity
FPN connectivity results depended on which side of the FPN was probed. In the left FPN, neither model improved predictions significantly compared to the base model. However, in the right FPN, there was a significant improvement using the PSQI model. In Figure 3, we see that the relationship between the PSQI score and fMRI t-score was inversely related between the HIV+ and HIV- populations. An increase in PSQI score was related to increased t-score of this network in HIV-, but decreased t-score in the HIV+ population.
CEN Connectivity
There is no significant long-term effect captured in the linear model for this network.
ACC SN Connectivity
There was a model improvement in the PSQI model compared to the base model in the ACC SN. In Figure 3, we see that the slope of the HIV- cohort is very close to zero, while the HIV+ cohort has a more positive slope. Furthermore, we found that there is a relationship between increased ACC SN fMRI t-score and decreased fMRI t-score in DMN1 only in the HIV+ group (Figure 3B), this was not seen in the interaction terms involving the CEN.
Discussion
In this study, we evaluated the relationship between the PSQI score, reflective of sleep quality, and functional MRI networks in HIV+ and HIV- subjects. Our results suggest that there are a variety of functional network changes that correlate with the PSQI score, some of which are uniquely altered in the HIV+ population. These networks include the posterior DMN, right FPN, and ACC SN. FC of other networks, such as the anterior DMN, left FPN, and ACC SN were correlated with PSQI score in both HIV+ and HIV- populations and may reflect shared processes in sleep disturbances in the two groups.
cART Treatment Effect
We found that cART was associated with better sleep in the HIV+ population. In the short-term analysis, it is important to interpret the fMRI results in the context of this result. Changes in the correlation between PSQI and FC suggest that sleep quality is correlated to FC of these networks even after accounting for treatment effect; these changes are potentially due to underlying pathological processes not addressed by treatment. For the long-term analysis, statistics are not confounded by treatment effect. This is validated by the observation that there were no significant group differences in PSQI scores at the 12 week and one year timepoints.
Anterior vs Posterior DMN
The DMN is defined by the medial prefrontal cortex and anterior cingulate cortex (ACC) in the anterior section and the precuneus and posterior cingulate cortex (PCC) in the posterior section. Previous literature suggests that midline regions such as the precuneus32 and PCC33 serve as functional hubs of the DMN, combining information from various areas of the DMN. Based on the fMRI ICA maps, DMN 1 we presented here represents the posterior portion of the DMN (eg, “hub” network), while DMN 2 represents the anterior DMN.
The precuneus is thought to be uniquely affected in HIV, previous studies have shown severity of depression, which potentially affects sleep, is related to precuneus volume.34 Our findings are consistent with previous literature that found that there is increased connectivity between the precuneus and DMN is correlated with rest.32 This relationship is strengthened in the HIV+ group, potentially reflecting the need for increased FC between the precuneus and posterior DMN to maintain sleep quality after HIV infection.
Unlike posterior DMN connectivity, anterior DMN connectivity to the precuneus did not show a significant cohort effect in the long term-analysis. In the short-term analysis, there are changes consistent with a treatment effect, signified by diminishing correlation and lack of significance at 12 weeks. A limitation of the study is that time of day of imaging was not controlled, and difference in FC could be affected by varying times of imaging sessions, especially in regard to the DMN.35 Further study should focus on if HIV treatment affects precuneus-anterior DMN FC. Overall, we saw that the DMN “hub” network was uniquely related to PSQI score in HIV, while the precuneus-anterior DMN connection was related to PSQI score independent of HIV status; this suggests that the DMN hub network is uniquely altered in HIV infection.
FPN Laterality and the PSQI Score
None of the correlations in the FPN met the criteria for meaningful correlation in the short-term model. In the long-term model, the PSQI model was significantly improved after accounting for the PSQI score and the interaction between the PSQI score and cohort. The HIV+ cohort had a negative slope between the PSQI score and fMRI t-score, which was reversed in HIV-. In primary insomnia, the right FPN FC is seen to decrease without changes to the contralateral FPN.15 This suggests that sleep changes in HIV share similar characteristics to those seen in primary insomnia. In addition, at low PSQI scores, the HIV+ subjects have higher FC of this network; therefore, they may require higher right parietal-FPN FC to maintain adequate sleep quality.
Central Executive and Salience Networks
The SN is thought to facilitate switching between the DMN and CEN.36,37 The CEN itself plays an important role in high-level functions such as working memory and problem-solving. Functional disruption of the CEN is seen in patients with obstructive sleep apnea and is related to cognitive impairment in these patients.38 Our results, along with a decreased slope in the DMN in the HIV+ group, suggest that there may be more switching between the DMN and CEN associated with sleep disturbances. In the HIV+ cohort, this switching may lead to functional disturbances in the DMN. Figure 3B further shows that these two networks are related, consistent with this hypothesis, with a significant interaction term signifying the effect is different in HIV+ and HIV- populations. Our data also suggest that the relationship between the DMN and ACC SN is selectively involved in pathology.
Limitations
The PSQI was used to evaluate sleep quality, however, this is a subjective self-reported questionnaire that has validity with clinical sleep evaluations, but not necessarily with objective sleep measures like polysomnography or actigraphy.39 As a result, the PSQI may not correlate with true sleep time. Additionally, the PSQI may overestimate difficulty falling asleep, potentially due to insomnia or restless leg syndrome, and under-recognized fragmented sleep, potentially due to obstructive sleep apnea. Although questions within the PSQI may be more likely in certain sleep disorders, such as snoring in obstructive sleep apnea, these individual components are not diagnostic for these various sleep disorders, which may have different effects on FC. Lastly, the traditional PSQI cut-off score is >5 to indicate poor sleepers, yet this cut-off score has not been validated in those with HIV, and higher cut-off scores may be more appropriate for this population.
The sample size used in our study was limited by considerations such as patient dropout. This is especially evident in the long-term analysis, where we incorporated data from 23 HIV+ subjects and 38 HIV- subjects. Future studies should expand these analytical methods and sleep analysis to larger cohorts. However, despite the relatively small sample size, we believe our results are robust, as shown by correlation coefficients of >0.3 for short-term analysis, and significance of our random-effects model and ANCOVA for long-term analysis.
This study utilized rs-fMRI measurements to study FC when there is no explicit task to focus on. While this use of rs-fMRI acquisition allows for collection of various networks, it does not tell us how FC changes in response to specific activities or thought processes, which may also be related to sleep disturbances. Previous studies have found changes in frontotemporal/hippocampal connectivity in patients with primary insomnia.40,41 These types of networks that are responsive to stimuli were not tested in our study.
Conclusion
Our rs-fMRI study showed that there are functional networks that are altered in subjects with poor sleep, measured by the PSQI score, seen only in the HIV+ cohorts. We found that FC in the posterior DMN, right FPN, and ACC SN was significantly different between the cohorts, both in short- and long-term analyses. This alteration pattern suggests that there is increased switching away from the DMN, mediated by the ACC SN. Future studies should control the time of day when the scan is acquired, use task-based fMRI to see if there are any activity-dependent changes to functional networks, and further explore the properties of DMN-CEN network switching mediated by the ACC SN. In addition, objective measures of sleep such as polysomnography and actigraphy will be invaluable to understanding the nature of sleep alterations.
Acknowledgments
We would like to acknowledge the subjects that took part in this study. In addition, we acknowledge Dr. Raffaele Ferri (Oasi Research Institute IRCCS, Troina, Italy) for providing comments and feedback in developing this manuscript. We would like to acknowledge Alicia Tyrell for import and indexing of data in data structures. We also acknowledge Jill Guary and Teresa Oh for facilitating patient visits and logistical support. Funding for this study came from NIH grants R01 MH099921, R01MH118020, R01 AG054328.
Disclosure
The authors report no conflicts of interest for this work.
References
1. daCosta DiBonaventura M, Gupta S, Cho M, et al. The association of HIV/AIDS treatment side effects with health status, work productivity, and resource use. AIDS Care. 2012;24(6):744–755. doi:10.1080/09540121.2011.630363
2. Rogers BG, Bainter SA, Smith-Alvarez R, et al. Insomnia, health, and health-related quality of life in an urban clinic sample of people living with HIV/AIDS. Behav Sleep Med. 2020:1–17. doi:10.1080/15402002.2020.1803871.
3. Rubinstein ML, Selwyn PA. High prevalence of insomnia in an outpatient population with HIV infection. J Acquir Immune Defic Syndr Hum Retrovirol. 1998;19(3):260–265. doi:10.1097/00042560-199811010-00008
4. Nir Y, Andrillon T, Marmelshtein A, et al. Selective neuronal lapses precede human cognitive lapses following sleep deprivation. Nat Med. 2017;23(12):1474–1480. doi:10.1038/nm.4433
5. Siclari F, Tononi G. Local aspects of sleep and wakefulness. Curr Opin Neurobiol. 2017;44:222–227. doi:10.1016/j.conb.2017.05.008
6. Low Y, Goforth H, Preud’homme X, et al. Insomnia in HIV-infected patients: pathophysiologic implications. AIDS Rev. 2014;16(1):3–13.
7. Franzen PL, Buysse DJ. Sleep disturbances and depression: risk relationships for subsequent depression and therapeutic implications. Dialogues Clin Neurosci. 2008;10(4):473–481.
8. Taibi DM. Sleep disturbances in persons living with HIV. J Assoc Nurses AIDS Care. 2013;24(1 Suppl):S72–85. doi:10.1016/j.jana.2012.10.006
9. Gamaldo CE, Spira AP, Hock RS, et al. Sleep, function and HIV: a multi-method assessment. AIDS Behav. 2013;17(8):2808–2815. doi:10.1007/s10461-012-0401-0
10. White JL, Darko DF, Brown SJ, et al. Early central nervous system response to HIV infection: sleep distortion and cognitive-motor decrements. AIDS. 1995;9(9):1043–1050. doi:10.1097/00002030-199509000-00009
11. Wibbeler T, Reichelt D, Husstedt IW, et al. Sleepiness and sleep quality in patients with HIV infection. J Psychosom Res. 2012;72(6):439–442. doi:10.1016/j.jpsychores.2012.03.003
12. Gallego L, Barreiro P, Del Rio R, et al. Analyzing sleep abnormalities in HIV-infected patients treated with Efavirenz. Clin Infect Dis. 2004;38(3):430–432. doi:10.1086/380791
13. Moyle G, Fletcher C, Brown H, et al. Changes in sleep quality and brain wave patterns following initiation of an efavirenz-containing triple antiretroviral regimen. HIV Med. 2006;7(4):243–247. doi:10.1111/j.1468-1293.2006.00363.x
14. Nunez M, Gonzalez de Requena D, Gallego L, et al. Higher efavirenz plasma levels correlate with development of insomnia. JAIDS. 2001;28(4):399–400. doi:10.1097/00126334-200112010-00015
15. Li S, Tian J, Li M, et al. Altered resting state connectivity in right side frontoparietal network in primary insomnia patients. Eur Radiol. 2018;28(2):664–672. doi:10.1007/s00330-017-5012-8
16. Liu H, Wang D, Li Y, et al. Examination of daytime sleepiness and cognitive performance testing in patients with primary insomnia. PLoS One. 2014;9(6):e100965. doi:10.1371/journal.pone.0100965
17. Krause AJ, Simon EB, Mander BA, et al. The sleep-deprived human brain. Nat Rev Neurosci. 2017;18(7):404–418. doi:10.1038/nrn.2017.55
18. Shao Y, Wang L, Ye E, et al. Decreased thalamocortical functional connectivity after 36 hours of total sleep deprivation: evidence from resting state FMRI. PLoS One. 2013;8(10):e78830. doi:10.1371/journal.pone.0078830
19. Lee YG, Kim S, Kim N, et al. Changes in subcortical resting-state functional connectivity in patients with psychophysiological insomnia after cognitive-behavioral therapy: changes in resting-state FC after CBT for insomnia patients. Neuroimage Clin. 2018;17:115–123. doi:10.1016/j.nicl.2017.10.013
20. Liu CH, Liu CZ, Zhang J, et al. Reduced spontaneous neuronal activity in the insular cortex and thalamus in healthy adults with insomnia symptoms. Brain Res. 2016;1648(Pt A):317–324. doi:10.1016/j.brainres.2016.07.024
21. Toniolo S, Cercignani M, Mora-Peris B, et al. Changes in functional connectivity in people with HIV switching antiretroviral therapy. J Neurovirol. 2020;26(5):754–763. doi:10.1007/s13365-020-00853-0
22. Abidin AZ, Schifitto G, Schifitto G, Wismüller A. Detecting cognitive impairment in HIV-infected individuals using mutual connectivity analysis of resting state functional MRI. J Neurovirol. 2020;26(2):188–200. doi:10.1007/s13365-019-00823-1
23. Buysse DJ, Reynolds CF
24. Woolrich MW, Ripley BD, Brady M, et al. Temporal autocorrelation in univariate linear modeling of FMRI data. Neuroimage. 2001;14(6):1370–1386. doi:10.1006/nimg.2001.0931
25. Laird AR, Eickhoff SB, Fox PM, et al. The BrainMap strategy for standardization, sharing, and meta-analysis of neuroimaging data. BMC Res Notes. 2011;4(1):349. doi:10.1186/1756-0500-4-349
26. Jenkinson M, Beckmann CF, Behrens TEJ, et al. FSL. Neuroimage. 2012;62(2):782–790. doi:10.1016/j.neuroimage.2011.09.015
27. Anderson MJ, Robinson J. Permutation tests for linear models. Aust N Z J Stat. 2001;43(1):75–88. doi:10.1111/1467-842X.00156
28. Winkler AM, Ridgway GR, Webster MA, et al. Permutation inference for the general linear model. Neuroimage. 2014;92:381–397. doi:10.1016/j.neuroimage.2014.01.060
29. Holmes AP, Blair RC, Watson JD, et al. Nonparametric analysis of statistic images from functional mapping experiments. J Cereb Blood Flow Metab. 1996;16(1):7–22. doi:10.1097/00004647-199601000-00002
30. Doll A, Holzel BK, Boucard CC, et al. Mindfulness is associated with intrinsic functional connectivity between default mode and salience networks. Front Hum Neurosci. 2015;9:461. doi:10.3389/fnhum.2015.00461
31. Cohen J. Statistical Power Analysis for the Behavioral Sciences. Taylor & Francis; 2013.
32. Utevsky AV, Smith DV, Huettel SA. Precuneus is a functional core of the default-mode network. J Neurosci. 2014;34(3):932–940. doi:10.1523/JNEUROSCI.4227-13.2014
33. Andrews-Hanna JR, Reidler JS, Sepulcre J, et al. Functional-anatomic fractionation of the brain’s default network. Neuron. 2010;65(4):550–562. doi:10.1016/j.neuron.2010.02.005
34. Zahr NM, Pohl KM, Pfefferbaum A, et al. Dissociable contributions of precuneus and cerebellum to subjective and objective neuropathy in HIV. J Neuroimmune Pharmacol. 2019;14(3):436–447. doi:10.1007/s11481-019-09837-2
35. Fafrowicz M, Bohaterewicz B, Ceglarek A, et al. Beyond the low frequency fluctuations: morning and evening differences in human brain. Front Hum Neurosci. 2019;13:288. doi:10.3389/fnhum.2019.00288
36. Menon V, Uddin LQ. Saliency, switching, attention and control: a network model of insula function. Brain Struct Funct. 2010;214(5–6):655–667. doi:10.1007/s00429-010-0262-0
37. Goulden N, Khusnulina A, Davis NJ, et al. The salience network is responsible for switching between the default mode network and the central executive network: replication from DCM. Neuroimage. 2014;99:180–190. doi:10.1016/j.neuroimage.2014.05.052
38. Zhang Q, Qin W, He X, et al. Functional disconnection of the right anterior insula in obstructive sleep apnea. Sleep Med. 2015;16(9):1062–1070. doi:10.1016/j.sleep.2015.04.018
39. Lee KA, Gay C, Portillo CJ, et al. Types of sleep problems in adults living with HIV/AIDS. J Clin Sleep Med. 2012;8(1):67–75. doi:10.5664/jcsm.1666
40. Li Y, Liu L, Wang E, et al. Abnormal neural network of primary insomnia: evidence from spatial working memory task fMRI. Eur Neurol. 2016;75(1–2):48–57. doi:10.1159/000443372
41. Son YD, Kang JM, Cho SJ, et al. fMRI brain activation in patients with insomnia disorder during a working memory task. Sleep Breath. 2018;22(2):487–493. doi:10.1007/s11325-017-1575-5
 © 2021 The Author(s). This work is published and licensed by Dove Medical Press Limited. The
full terms of this license are available at https://www.dovepress.com/terms
and incorporate the Creative Commons Attribution
- Non Commercial (unported, 3.0) License.
By accessing the work you hereby accept the Terms. Non-commercial uses of the work are permitted
without any further permission from Dove Medical Press Limited, provided the work is properly
attributed. For permission for commercial use of this work, please see paragraphs 4.2 and 5 of our Terms.
© 2021 The Author(s). This work is published and licensed by Dove Medical Press Limited. The
full terms of this license are available at https://www.dovepress.com/terms
and incorporate the Creative Commons Attribution
- Non Commercial (unported, 3.0) License.
By accessing the work you hereby accept the Terms. Non-commercial uses of the work are permitted
without any further permission from Dove Medical Press Limited, provided the work is properly
attributed. For permission for commercial use of this work, please see paragraphs 4.2 and 5 of our Terms.