Back to Journals » Neuropsychiatric Disease and Treatment » Volume 11
Functional connectivity of paired default mode network subregions in primary insomnia
Authors Nie X, Shao Y ![]() , Liu S, Li H
, Liu S, Li H ![]() , Wan A, Nie S, Peng D, Dai X
, Wan A, Nie S, Peng D, Dai X
Received 27 August 2015
Accepted for publication 13 October 2015
Published 16 December 2015 Volume 2015:11 Pages 3085—3093
DOI https://doi.org/10.2147/NDT.S95224
Checked for plagiarism Yes
Review by Single anonymous peer review
Peer reviewer comments 3
Editor who approved publication: Professor Wai Kwong Tang
Xiao Nie,1,* Yi Shao,2,* Si-yu Liu,3 Hai-jun Li,1 Ai-lan Wan,4 Si Nie,1 De-chang Peng,1 Xi-jian Dai1,5
1Department of Radiology, The First Affiliated Hospital of Nanchang University, Nangchang, Jiangxi, People’s Republic of China; 2Department of Ophthalmology,The First Affiliated Hospital of Nanchang University, Nangchang, Jiangxi, People’s Republic of China; 3Medical College of Nanchang University, Nangchang, Jiangxi, People’s Republic of China; 4Department of Psychosomatic Medicine, The First Affiliated Hospital of Nanchang University, Nangchang, Jiangxi, People’s Republic of China; 5Brain Cognition and Brain Disease Institute, Shenzhen Institutes of Advanced Technology, Chinese Academy of Sciences, Shenzhen, People’s Republic of China
*These authors contributed equally to this work
Objective: The aim of this study is to explore the resting-state functional connectivity (FC) differences between the paired default mode network (DMN) subregions in patients with primary insomnia (PIs).
Methods: Forty-two PIs and forty-two age- and sex-matched good sleepers (GSs) were recruited. All subjects underwent the resting-state functional magnetic resonance imaging scans. The seed-based region-to-region FC method was used to evaluate the abnormal connectivity within the DMN subregions between the PIs and the GSs. Pearson correlation analysis was used to investigate the relationships between the abnormal FC strength within the paired DMN subregions and the clinical features in PIs.
Results: Compared with the GSs, the PIs showed higher Pittsburgh Sleep Quality Index score, Hamilton Anxiety Rating Scale score, Hamilton Depression Rating Scale score, Self-Rating Depression Scale score, Self Rating Anxiety Scale score, Self-Rating Scale of Sleep score, and Profile of Mood States score (P<0.001). Compared with the GSs, the PIs showed significant decreased region-to-region FC between the medial prefrontal cortex and the right medial temporal lobe (t=-2.275, P=0.026), and between the left medial temporal lobe and the left inferior parietal cortices (t=-3.32, P=0.001). The abnormal FC strengths between the DMN subregions did not correlate with the clinical features.
Conclusion: PIs showed disrupted FC within the DMN subregions.
Keywords: insomnia, functional connectivity, default mode network, functional magnetic resonance imaging, resting-state, blood oxygenation level dependent
Introduction
Primary insomnia (PI), one of the most prevalent health complaints worldwide, characterized by difficulties in initiating or maintaining sleep, or non-restorative sleep in the absence of any related medical or psychiatric condition, has been associated with cognitive deficits, including the attention, memory, decision making, and executive function.1,2 In spite of a recent increase in the neuroimaging research into the PI, it has yet to establish a consistent conclusion about its neuropathology,3 especially the structural studies of the brain volume alterations.4–10 On the functional imaging aspects, the studies are too few and diverse in methodology to yield any general conclusions. Altena et al concluded that patients with PI (PIs) are cognitively compromised, as shown by hypoactivation in the left prefrontal cortex and left inferior frontal gyrus during task performance.11 Drummond et al12 further investigated the cognitive impairments in the PIs, they found less activation in the thalamus, fronto-parietal cortex, and cerebellum, and these brain regions normally associated with the working memory and the motor and visual processing during the cognitive tasks compared with the good sleepers (GSs).12 Previous study found that the aberrant activation of the insula, which integrates temporal and bodily states, in arousal networks may underlie the misperception of sleep quality and subjective distress in insomnia.13 Our previous study found that both female and male PIs showed different regional homogeneity in the temporal cortex, cingulate cortex, cerebellum, and frontal gyrus.2 Although these studies provided insights into the neural events occurring in the PIs, there was far less evidence for the neuromechanism changes.
It is proposed that the resting-state functional magnetic resonance imaging (rs-fMRI), one of the hot areas in neuroimaging and one that is suitable for the mechanism research of central nervous system, can detect the spontaneous neuronal activity of the human brain and provide new insights into the pathophysiology of disease, because of its advantages in not requiring exposure to radioactive tracers, accurate positioning, and ease of combining functional imaging with structural imaging. Functional connectivity (FC) that is an important part of the rs-fMRI has been widely used as a technique for unbiased analysis of the brain’s functional connectome.14,15 Previous studies demonstrated that the PIs relative to the GSs showed reduced FC between the left orbitofrontal cortex and the left caudate head,16 and between the parietal lobe and the frontal lobe.17 Huang et al found decreased FC mainly between the amygdala and the insula, striatum, and thalamus, and increased FC mainly between the amygdala and the premotor cortex and sensorimotor cortex in the PIs compared with the GSs.18
The “default-mode network” (DMN) is an organized functional network of several brain regions. Anatomically, the DMN spans the bilateral inferior parietal cortices (IPC), posterior cingulate cortex, precuneus, medial prefrontal cortex (MPFC), retrosplenial cortex, and parts of the hippocampal formation and medial temporal lobe (MTL).19,20 Recent researches have suggested that the DMN might be associated with the collection and evaluation of information,21 self-referential mental activity,22 extraction of episodic memory,23 emotion and anxiety,24,25 mind wandering or daydreaming,26 and autobiographical memory retrieval and envisioning the future when individuals are not focusing on the external environment.27–29 More and more researches have been devoted to exploring the DMN changes in various kinds of diseases, including the sleep deprivation,30,31 cognitive impairment,32 and autism.33 However, far less is still known about the effect of PIs on the intrinsic DMN node connectivity. In this study, we examined the FC changes of the paired DMN subregions in the PIs using the seed-based region-to-region FC method to explore its possible neural mechanisms.
Materials and methods
Forty-two PIs (15 males and 27 females; mean age: 49.24±12.26) who had sleep onset and/or maintenance insomnia were recruited from the Psychiatry Department of our Hospital, and forty-two GSs (18 males and 24 females; mean age: 49.14±10.20) who were age, sex, and education status-matched to the PIs were recruited from the community via a newspaper advertisement. Twenty-three PIs (seven males and 16 females) were not the first-time visitors and had taken hypnotic medications or psychoactive medications before, the other nineteen PIs (eight males and eleven females) were first-time visitors and had never taken medications before. The medication history duration was from 1 month to 5 years. Before the tests, the PIs were asked to stop taking any medications for at least 2 weeks before the data collection and for the duration of the study; however, three PIs only stopped taking agents 2–4 days before the test.
The PIs met the following criteria as in our previous study where the regional homogeneity results of a group of 24 PIs from the 42 PIs in our study were reported:2 conformity to the pertinent diagnostic criteria as defined by the International Classification of Sleep Disorder-2,34 higher duration of insomnia than 2 months, higher score of Pittsburgh Sleep Quality Index (PSQI) than 5, a sleep diary for at least 2 weeks’ duration, and right-handedness. All GSs met the following criteria: a good sleeping habit and good sleep onset and/or maintenance, a regular dietary habit, no consumption of any stimulants, medications, tea or coffee for at least 3 months before the study, lower score of PSQI than five, and lower score of Hamilton Depression Rating Scale (HAMD) and Hamilton Anxiety Rating Scale (HAMA) scores <7.
The exclusion criteria for both groups comprised pathological brain MRI findings, inborn or other acquired diseases, any foreign implants in the body, present, or past psychiatric or central nervous system disorders, substance dependency or substance abuse (including heroin, nicotine, or alcohol addiction for GSs), foreign implants in the body, any history of swing shift, shift work, sleep complaints or other sleep disorder, including the hypersomnia, parasomnia, sleep-related breathing disorder, sleep-related movement disorder, or circadian rhythm sleep disorder.
Research design and procedures
An experienced psychiatrist evaluated the PIs with the Diagnostic and Statistical Manual of Mental Disorders, version 4 (DSM-IV)35 for the life history of psychiatric disorders, as well as an unstructured clinical interview for the history of medical and sleep disorders. To evaluate the sleep status, the PIs were asked to wear a Fitbit Flex tracker (http://help.fitbit.com) for two consecutive nights and the GSs for 1 week. During the time, the total sleep time, sleep onset latency, sleep efficiency, and number of awakenings were recorded.
The volunteers were instructed to wear black blinders and sponge earplugs, and fix the head, to avoid audiovisual stimulus during the rs-fMRI scans. They were told to relax and not to think of anything, and not to fall asleep in particular. A simple questionnaire was administered immediately after the scans to determine whether the subjects were awake during the session. The data of the subjects who were asleep during the scans were excluded. This study was approved by The Human Research Ethics Committee of our Hospital. All volunteers participated voluntarily and were informed of the purposes, methods, and the potential risks, and all signed an informed consent form.
Questionnaires
All volunteers were asked to complete a number of questionnaires, including the PSQI,36 Insomnia Severity Index,37 HAMD,38 HAMA,39 Self-Rating Depression Scale,40 Self Rating Anxiety Scale,41 Self-Rating Scale of Sleep, and Profile of Mood States.42,43
MRI parameters
MRI scanning was performed on a 3-Tesla MR scanner (Trio, Siemens, Erlangen, Germany). High-resolution T1-weighted images were acquired with a three-dimensional spoiled gradient-recalled sequence in an sagittal orientation: 176 images (repetition time =1,900 ms, echo time =2.26 ms, thickness =1.0 mm, gap =0.5 mm, acquisition matrix =256×256, field of view =250 mm ×250 mm, flip angle =9°) were obtained. Finally, an 8-minute rs-fMRI scan was obtained with eyes closed. A total of 240 functional images (repetition time =2,000 ms, echo time =30 ms, thickness =4.0 mm, gap =1.2 mm, acquisition matrix =64×64, flip angle =90°, field of view =220 mm ×220 mm, 29 axial slices with Gradient-Recalled Echo-Planar Imaging pulse sequence) covering the whole brain were obtained.
Data preprocessing
Functional data were checked by MRIcro software (www.MRIcro.com) to exclude the defective data. The first ten time points of the functional images were discarded due to the possible instability of the initial MRI signal and the participants’ adaptation to the scanning environment. On the basis of MATLAB2010a (Mathworks, Natick, MA, USA), the rest of the data pre-processing was performed by the DPARSFA (http://rfmri.org/DPARSF) software, including digital imaging and communications in medicine form transformation, slice timing, head-motion correction, spatial normalization, and smooth with a Gaussian kernel of 6×6×6 mm3 full-width at half-maximum. The participants who had more than 1.5 mm maximum translation in x, y, or z and 1.5° of motion rotation were rejected. The Friston six head-motion parameters were used to regress out head-motion effects based on recent work, showing that higher-order models were more effective in removing head-motion effects.44,45 Linear regression was also applied to remove other sources of spurious covariates along with their temporal derivatives, including the signal from a ventricular regions of interest, and the signal from a region centered in white matter.27 Of note, the global signal was not regressed out in the present data, as in our previous studies,2,46,47 for the reason that there is still a controversy concerning removing the global signal in the preprocessing of resting-state data.27,48 After the head-motion correction, the align fMRI images were spatially normalized to the Montreal Neurological Institute space and re-sampled at a resolution of 3 mm ×3 mm ×3 mm. After the pre-processing, the time series for each voxel was linearly detrended and filtered (bandpass 0.01–0.08 Hz) to reduce the low-frequency drift, high-frequency physiological respiratory and cardiac noise.49
Definition of DMN seed regions
According to the previous studies,50–52 we defined the eight canonical core regions within the DMN: posterior cingulate cortex, MPFC, bilateral hippocampal formation, bilateral MTL, and bilateral IPC (Table 1, Figure 1). The average time courses of these eight regions were defined by placing spherical seeds (r=6 mm) and then extracted from each subject.
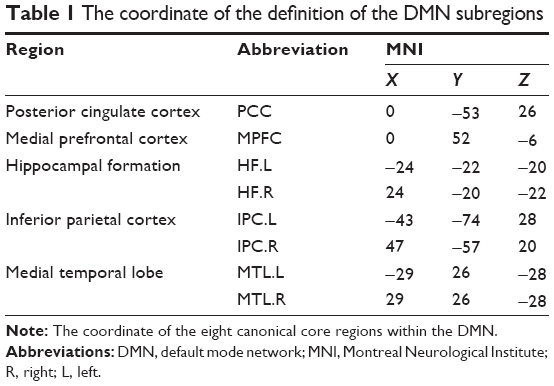 | Table 1 The coordinate of the definition of the DMN subregions |
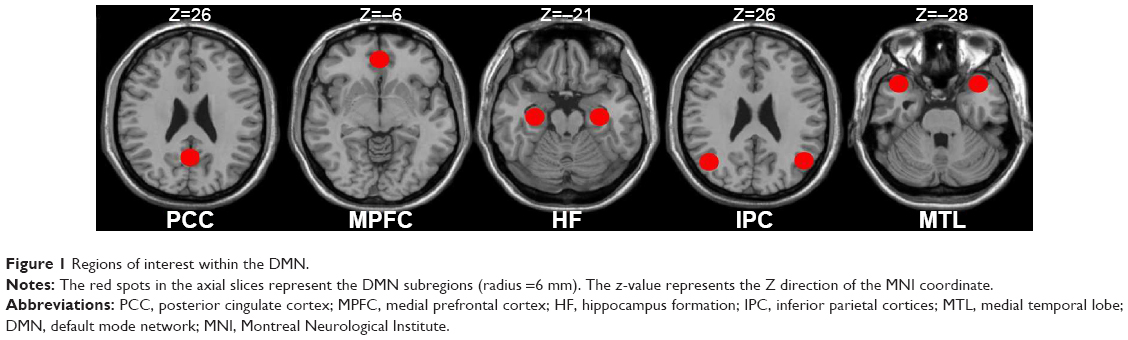 | Figure 1 Regions of interest within the DMN. |
FC analysis
For each subject, a correlation map was produced by computing the correlation coefficient (r score) between each pair of the DMN regions, totally yielding the 28 paired connectivity. Correlation coefficients were then converted to z-values using Fisher’s r-to-z transform to standardize the statistic analysis because the correlation coefficient r is not normally distributed.
Correlation analysis
To investigate the relationships between the clinical measures and the FC strength of the region-to-region within the DMN in PIs, the z-values of the temporal correlation coefficients of the different paired connectivity between the PIs and the GSs were correlated with the clinical questionnaires using the Pearson correlation analysis. The threshold was set at a significance level of P<0.05.
Statistical analysis
For the clinical measures, two-sample Student’s t-test (homoscedasticity) and Mann–Whitney U-test (heteroscedasticity) were used for the continuous data. All the results are quoted as two-tailed P-values. P<0.05 was considered as statistically significant. All the statistical analyses were performed using IBM SPSS version 21.0 statistical software.
Within each group, a random-effect one-sample t-test was performed on the individual z-value maps of the 28 pairs of DMN subregions. A corrected significance level of P<0.05, using an false-positive adjustment, was performed for the multiple comparison corrections.53,54 The two-sample t-test was performed on the individual z-value maps of the 28 pairs of DMN subregions to determine the FC differences between the PIs and the GSs with the age, sex, and education as covariates. A corrected significance level of individual voxel P<0.05, using the false-positive adjustment, was used to determine the statistical significance.
Results
Demographic and clinical questionnaires
Demographic and clinical questionnaires of each group are summarized in Table 2. No significant differences were found in age (t=−0.996; P=0.322), sex (χ2=0.645; P=0.422), and education (t=−0.408; P=0.684) between the PIs and the GSs (P>0.05). Compared with the GSs, the PIs showed higher PSQI score (P<0.001), shorter total sleep time (P<0.001) and lower sleep efficiency (P<0.001), had worse subjective sleep estimate as measured by the Self-Rating Scale of Sleep (P<0.001), and demonstrated disturbed mood state as measured by the HAMA (P<0.001), HAMD (P<0.001), Self Rating Anxiety Scale (P<0.001), Self-Rating Depression Scale (P<0.001), and Profile of Mood States (P<0.001). The Fitbit Flex tracker found that the no significant difference in the total sleep time (P=0.862) between the PIs and the GSs, but the PIs showed lower sleep efficiency (P<0.001), longer sleep onset latency (P<0.001), and more number of awakenings (P<0.001) compared with the GSs.
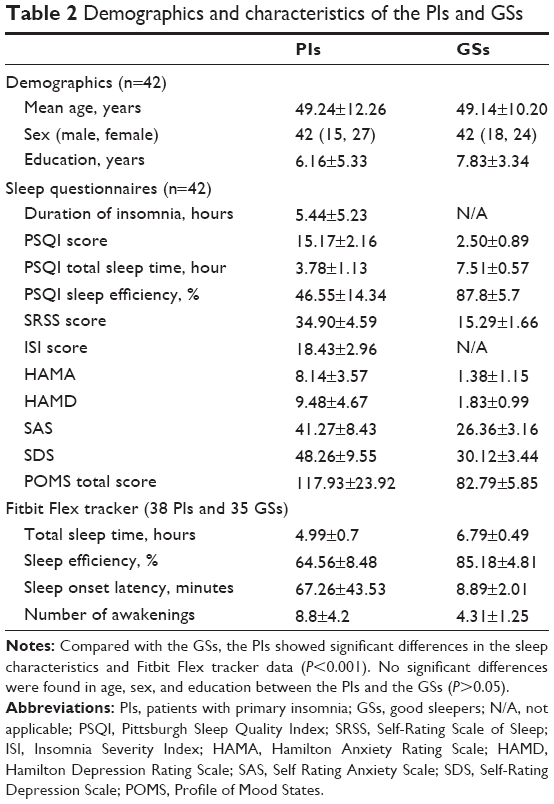 | Table 2 Demographics and characteristics of the PIs and GSs |
FC results
Figure 2 shows the FC results of the 28 pairs of DMN subregions in the PIs and the GSs, respectively. In each group, all these DMN regions were strongly connected to each other. Compared with the GSs, the PIs demonstrated two significant decreased FC regions, that is, between the MPFC and the right MTL (MTL.R) (t=−2.275, P=0.026), and between the left MTL (MTL.L) and the left IPC (IPC.L) (t=−3.32, P=0.001) (Figure 3). No other region-to-region connectivities were found.
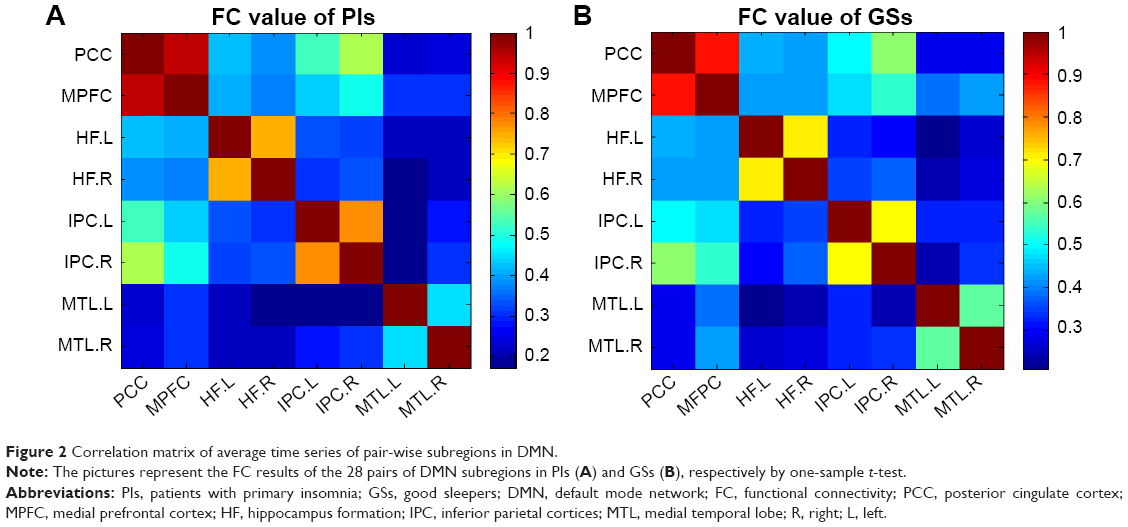 | Figure 2 Correlation matrix of average time series of pair-wise subregions in DMN. |
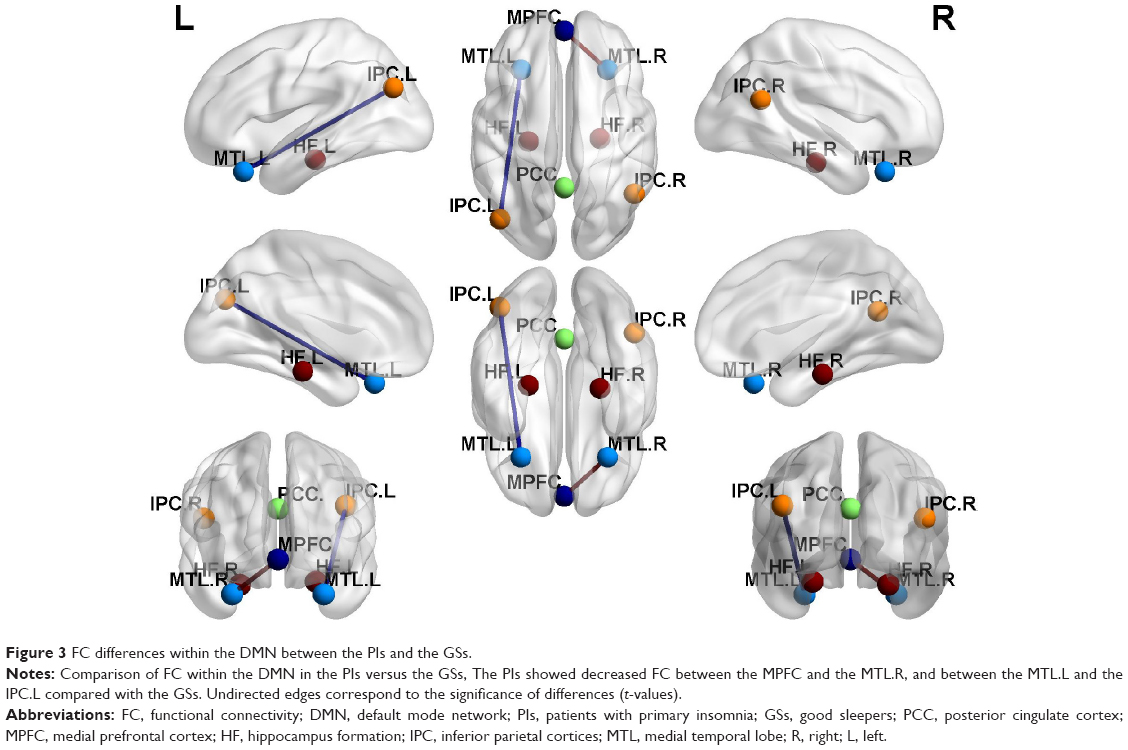 | Figure 3 FC differences within the DMN between the PIs and the GSs. |
No correlation results
There were no significant correlations between the region-to-region FC strength within the DMN and the clinical questionnaires (P>0.05).
Discussion
To the best of our knowledge, this study was the first to use the region-to-region FC method to investigate the FC differences of the DMN subregions, so as to better understand the underlying neural mechanisms of the PIs. Fortunately, in the present study we found that the PIs showed decreased FC between the MPFC and the right MTL, and between the left MTL and the left IPC compared with the GSs. Although no significant correlations were found between the abnormal paired FC subregions and the clinical measurements, the PIs showed more negative emotions compared with the GSs.
Recent researches indicate that the prefrontal cortex is particularly sensitive to the sleep, and has a major role in mediating sleep physiology.55–57 Several neuropsychological studies have revealed that the PIs had impaired performance in tests involving the prefrontal cortex.58,59 The MPFC, as a core region of the DMN, associated with the social cognitive processes, is related to decision making and self-regulations.60,61 Koenigs et al found that the focal injuries to the left DMPFC are associated with the sleep initiation and maintenance.62 Joo et al found that the PIs showed significant decreased gray matter volume in the MPFC compared with the GSs.10 Our previous study found that male PIs showed lower regional homogeneity in the MPFC compared with male GSs.2 These studies demonstrated that the PIs had a disturbed function and structure in the MPFC.
The MTL, which consists of several critical memory-related structures, including the hippocampus, amygdala, cingulate gyrus, and the surrounding hippocampal areas (such as the entorhinal, perirhinal, and parahippocampal cortices),63 was associated with a variety of sensory information integration. The MTL is considered as a sensitive predictor for conversion to Alzheimer’s disease.64–66 Nofzinger et al reported that the PIs have a smaller reduction in relative metabolism from wakefulness to non-rapid eye movement sleep in the hippocampus, parahippocampal, and amygdaloid.67 Our previous study found that the PIs showed lower regional homogeneity area in the MTL.2 These studies demonstrated that the PIs had a functional disorder in the MTL. Furthermore, previous studies showed that the MTL (entorhinal cortex, parahippocampal cortex, and perirhinal cortex), connected via the medial dorsal nucleus of the thalamus to the medial, orbital, and lateral prefrontal cortex, which is essential to the declarative memory.68–70 Therefore, we speculated that the decreased FC between the MPFC and the right MTL in our study may be associated with the cognitive deficits in PIs.
The IPC, a large and heterogeneous region, is obligatorily or unintentionally engaged in the recall, consolidation, and retrieval of episodic memory information,71–73 as well as being implicated in diverse cognitive operations74 that include bodily awareness,75 generating a sense of personal responsibility,76 and moral decision making,77 action, language, and mathematical problem solving.78,79 Chee and Chuah found that the sleep deprivation reduced IPL deactivation during a visual short-term memory task.80 Horovitz et al revealed reductions in the IPC-MPFC FC during deep sleep and after partial sleep deprivation.81,82 De Havas et al also found that the IPC node of the DMN was consistently impaired and might represent an early marker for the effects of 24-hour sleep deprivation, as well as serving as an indicator of hitherto-unexplored behavioral impairments.83 Gao et al found acute sleep deprivation showed decreased amplitude of low frequency fluctuation in the IPC.84 A previous regional homogeneity study found little decreased spontaneous brain activity in the IPC in patients with obstructive sleep apnea.85 Our previous sleep deprivation study found that a total of 72 hours sleep deprivation disturbed the spontaneous activity of the IPC area and its connectivity pattern with other DMN subregions.30 These studies showed consistent evidence that the IPC had abnormal spontaneous activity and connectivity pattern in the sleep disorders.
Recent studies suggest a role of DMN parietal regions during retrieval of information, which in concert with the medial temporal structures.86 Meanwhile, Tessitore et al revealed that the reduced FC between the MTL and the IPC may play a role in the development of cognitive decline in the Parkinson’s disease, and the functional abnormalities precede the structural abnormalities.87 In this study, our findings demonstrated that the PIs compared with the GSs had decreased FC between the MPFC and the right MTL, and between the left MTL and the left IPC. These abnormal connectivities may be a potential functional basis of the emotional, memory, and cognitive decline in the PIs. Although no significant correlations were found between the abnormal paired FC subregions and the clinical measurements, these findings demonstrated the FC impairment of the intrinsic DMN subregions and help us know more about the underlying mechanism of the PIs.
Conclusion
Using the resting-state seed-based FC method, we found decreased region-to-region FC between the MPFC and the right MTL, and between the left MTL and the left IPC. These findings will help us insight into a deeper understanding of the neural mechanism of the PIs. However, there are several limitations that should be paid attention to. First, a larger sample size should be studied. Second, future studies should go beyond examining limited DMN to make a comprehensive analysis. Third, some PIs were selected without reference to the polysomnogram, although all PIs were asked to wear a Fitbit Flex tracker to monitor their sleep quality.
Acknowledgments
This work was supported by Jiangxi Provincial Department of Science and Technology Support Program (grant No 20132BBG70061, and No 20141BBG70026), Jiangxi Provincial Department of Natural Science Foundation Project (grant No 20132BAB205100), and National Natural Science Foundation of China (grant No 81560285).
Disclosure
The authors report no conflicts of interest in this work.
References
Riemann D, Spiegelhalder K, Feige B, et al. The hyperarousal model of insomnia: a review of the concept and its evidence. Sleep Med Rev. 2010;14(1):19–31. | ||
Dai XJ, Peng DC, Gong HH, et al. Altered intrinsic regional brain spontaneous activity and subjective sleep quality in patients with chronic primary insomnia: a resting-state fMRI study. Neuropsychiatr Dis Treat. 2014;10:2163–2175. | ||
O’Byrne JN, Berman Rosa M, Gouin JP, et al. Neuroimaging findings in primary insomnia. Pathol Biol. 2014;62(5):262–269. | ||
Riemann D, Voderholzer U, Spiegelhalder K, et al. Chronic insomnia and MRI-measured hippocampal volumes: a pilot study. Sleep. 2007;30(8):955–958. | ||
Winkelman JW, Benson KL, Buxton OM, et al. Lack of hippocampal volume differences in primary insomnia and good sleeper controls: an MRI volumetric study at 3 Tesla. Sleep Med. 2010;11(6):576–582. | ||
Winkelman JW, Plante DT, Schoerning L, et al. Increased rostral anterior cingulate cortex volume in chronic primary insomnia. Sleep. 2013;36(7):991–998. | ||
Noh HJ, Joo EY, Kim ST, et al. The relationship between hippocampal volume and cognition in patients with chronic primary insomnia. J Clin Neurol. 2012;8(2):130–138. | ||
Spiegelhalder K, Regen W, Baglioni C, et al. Insomnia does not appear to be associated with substantial structural brain changes. Sleep. 2013;36(5):731–737. | ||
Altena E, Vrenken H, Van Der Werf YD, van den Heuvel OA, Van Someren EJ. Reduced orbitofrontal and parietal gray matter in chronic insomnia: a voxel-based morphometric study. Biol Psychiatry. 2010;67(2):182–185. | ||
Joo EY, Noh HJ, Kim JS, et al. Brain gray matter deficits in patients with chronic primary insomnia. Sleep. 2013;36(7):999–1007. | ||
Altena E, Van Der Werf YD, Sanz-Arigita EJ, et al. Prefrontal hypoactivation and recovery in insomnia. Sleep. 2008;31(9):1271–1276. | ||
Drummond SP, Walker M, Almklov E, Campos M, Anderson DE, Straus LD. Neural correlates of working memory performance in primary insomnia. Sleep. 2013;36(9):1307–1316. | ||
Chen MC, Chang C, Glover GH, et al. Increased insula coactivation with salience networks in insomnia. Biol Psychol. 2014;97:1–8. | ||
Friston KJ. Functional and effective connectivity: a review. Brain Connect. 2011;1(1):13–36. | ||
Van Dijk KR, Hedden T, Venkataraman A, Evans KC, Lazar SW, Buckner RL. Intrinsic functional connectivity as a tool for human connectomics: theory, properties, and optimization. J Neurophysiol. 2010;103(1):297–221. | ||
Stoffers D, Altena E, van der Werf YD, et al. The caudate: a key node in the neuronal network imbalance of insomnia? Brain. 2014;137(Pt2):610–620. | ||
Li Y, Wang E, Zhang H, et al. Functional connectivity changes between parietal and prefrontal cortices in primary insomnia patients: evidence from resting-state fMRI. Eur J Med Res. 2014;19:32. | ||
Huang Z, Liang P, Jia X, et al. Abnormal amygdala connectivity in patients with primary insomnia: evidence from resting state fMRI. Eur J Radiol. 2012;81(6):1288–1295. | ||
Buckner RL, Andrews-Hanna JR, Schacter DL. The brain’s default network anatomy, function, and relevance to disease. Ann NY Acad Sci. 2008;1124:1–1138. | ||
Fox MD, Raichle ME. Spontaneous fluctuations in brain activity observed with functional magnetic resonance imaging. Nat Rev Neurosci. 2007;8(9):700–711. | ||
Gusnard DA, Raichle ME, Raichle ME. Searching for a baseline: functional imaging and the resting human brain. Nat Rev Neurosci. 2001;2(10):685–694. | ||
Gusnard DA, Akbudak E, Shulman GL, Raichle ME. Medial prefrontal cortex and self-referential mental activity: relation to a default mode of brain function. Proc Natl Acad Sci. 2001;98(7):4259–4264. | ||
Cabeza R, Dolcos F, Graham R, Nyberg L. Similarities and differences in the neural correlates of episodic memory retrieval and working memory. Neuroimage. 2002;16(2):317–330. | ||
Simpson JR Jr, Drevets WC, Snyder AZ, Gusnard DA, Raichle ME. Emotion-induced changes in human medial prefrontal cortex: II. During anticipatory anxiety. Proc Natl Acad Sci. 2001;98(2):688–693. | ||
Simpson JR Jr, Snyder AZ, Gusnard DA, Raichle ME. Emotion-induced changes in human medial prefrontal cortex: I. During cognitive task performance. Proc Natl Acad Sci. 2001;98(2):683–687. | ||
Mason MF, Norton MI, Van Horn JD, Wegner DM, Grafton ST, Macrae CN. Wandering minds: the default network and stimulus-independent thought. Science. 2007;315(5810):393–395. | ||
Fox MD, Snyder AZ, Vincent JL, et al. The human brain is intrinsically organized into dynamic, anticorrelated functional networks. Proc Natl Acad Sci. 2005;102(27):9673–9678. | ||
Raichle ME. The restless brain. Brain Connect. 2011;1(1):3–12. | ||
Uddin LQ, Kelly AM, Biswal BB, Castellanos FX, Milham MP. Functional connectivity of default mode network components: correlation, anticorrelation, and causality. Hum Brain Mapp. 2009;30(2):625–637. | ||
Dai XJ, Liu CL, Gong HH, et al. Long-term sleep deprivation decreases the default spontaneous activity and connectivity pattern in healthy male subjects: a resting-state fMRI study. Neuropsychiatr Dis Treat. 2015;11:761–772. | ||
Gujar N, Yoo SS, Hu P, Walker MP. The unrested resting brain: sleep deprivation alters activity within the default-mode network. J Cogn Neurosci. 2010;22(8):1637–1648. | ||
Yan H, Zhang Y, Chen H, Wang Y, Liu Y. Altered effective connectivity of the default mode network in resting-state amnestic type mild cognitive impairment. J Int Neuropsychol Soc. 2013;19(4):400–409. | ||
Murdaugh DL, Shinkareva SV, Deshpande HR, Wang J, Pennick MR, Kana RK. Differential deactivation during mentalizing and classification of autism based on default mode network connectivity. PLoS One. 2012;7(11):e50064. | ||
Edinger JD, Bonnet MH, Bootzin RR, et al. Derivation of research diagnostic criteria for insomnia: report of an American Academy of Sleep Medicine Work Group. Sleep. 2004;27(8):1567–1596. | ||
American Psychiatric Association (APA). Diagnostic and Statistical Manual of Mental Disorders, 4th edn–text revision (DSM-IV-TR). Washington, DC: American Psychiatric Association; 2000. | ||
Buysse DJ, Reynolds CF 3rd, Monk TH, Berman SR, Kupfer DJ. The Pittsburgh Sleep Quality Index: a new instrument for psychiatric practice and research. Psychiatry Res. 1989;28(2):193–213. | ||
Bastien CH, Vallières A, Morin CM. Validation of the insomnia severity index as an outcome measure for insomnia research. Sleep Med. 2001;2(4):297–307. | ||
Hamilton M. A rating scale for depression. J Neurol Neurosurg Psychiatry. 1960;23(1):56–62. | ||
Hamilton M. The assessment of anxiety states by rating. Br J Med Psychol. 1959;32(1):50–55. | ||
Zung WW. A self-rating depression scale. Arch Gen Psychiatry. 1965;12(1):63–70. | ||
Zung WW. A rating instrument for anxiety disorders. Psychosomatics. 1971;12(6):371–379. | ||
McNair DM, Lorr M, Droppleman LM. Manual for the Profile of Mood States. San Diego, CA: Educational and Industrial Testing Services; 1971. | ||
McNair DM, Lorr M, Droppleman LF. EdITS Manual for the Profile of Mood States. San Diego, CA: EdITS Educational and Industrial Testing Service; 1992. | ||
Satterthwaite TD, Elliott MA, Gerraty RT, et al. An improved framework for confound regression and filtering for control of motion artifact in the preprocessing of resting-state functional connectivity data. Neuroimage. 2013;64:240–256. | ||
Yan CG, Cheung B, Kelly C, et al. A Comprehensive assessment of regional variation in the impact of head micromovements on functional connectomics. Neuroimage. 2013;76:183–201. | ||
Li HJ, Dai XJ, Gong HH, et al. Aberrant spontaneous low-frequency brain activity in male patients with severe obstructive sleep apnea revealed by resting-state functional MRI. Neuropsychiatr Dis Treat. 2015;11:207–214. | ||
Huang X, Zhong YL, Zeng XJ, et al. Disturbed spontaneous brain activity pattern in patients with primary angle-closure glaucoma using amplitude of low-frequency fluctuation: a fMRI study. Neuropsychiatr Dis Treat. 2015;11:1877–1883. | ||
Saad ZS, Gotts SJ, Murphy K, et al. Trouble at rest: how correlation patterns and group differences become distorted after global signal regression. Brain Connect. 2012;2(1):25–32. | ||
Dai XJ, Gong HH, Wang YX, et al. Gender differences in brain regional homogeneity of healthy subjects after normal sleep and after sleep deprivation: a resting-state fMRI study. Sleep Med. 2012;13(6):720–727. | ||
Qi RF, Zhang LJ, Xu Q, et al. Abnormal functional connectivity within the default mode network in patients with HBV-related cirrhosis without hepatic encephalopathy revealed by resting-state functional MRI. Brain Res. 2014;1576:73–80. | ||
Gorges M, Muller HP, Lule D, Ludolph AC, Pinkhardt EH, Kassubek J. Functional connectivity within the default mode network is associated with saccadic accuracy in Parkinson’s disease: a resting-state FMRI and videooculographic study. Brain Connect. 2013;3:265–272. | ||
Zhang D, Raichle ME. Disease and the brain’s dark energy. Nat Rev Neurol. 2010;6(1):15–28. | ||
Fornito A, Yoon J, Zalesky A, Bullmore ET, Carter CS. General and specific functional connectivity disturbances in first-episode schizophrenia during cognitive control performance. Biol Psychiatry. 2011;70:64–72. | ||
Jao T, Vertes PE, Alexander-Bloch AF, et al. Volitional eyes opening perturbs brain dynamics and functional connectivity regardless of light input. Neuroimage. 2013;69:21–34. | ||
Dang-Vu TT, Schabus M, Desseilles M, et al. Functional neuroimaging insights into the physiology of human sleep. Sleep. 2010;33(12):1589–1603. | ||
Muzur A, Pace-Schott EF, Hobson JA. The prefrontal cortex in sleep. Trends Cogn Sci. 2002;6(11):475–481. | ||
Perrier J, Clochon P, Bertran F, et al. Specific EEG sleep pattern in the prefrontal cortex in primary insomnia. PLoS One. 2015;10(1):e0116864. | ||
Fortier-Brochu E, Beaulieu-Bonneau S, Ivers H, Morin CM. Insomnia and daytime cognitive performance: a meta-analysis. Sleep Med Rev. 2012;16(1):83–94. | ||
Wilckens KA, Erickson KI, Wheeler ME. Age-related decline in controlled retrieval: the role of the PFC and sleep. Neural Plast. 2012:e624795. | ||
Beer JS, Lombardo MV, Bhanji JP. Roles of medial prefrontal cortex and orbitofrontal cortex in self-evaluation. J Cogn Neurosci. 2010;22(9):2108–2119. | ||
Bechara A, Damasio H, Damasio AR. Emotion, decision making and the orbitofrontal cortex. Cereb Cortex. 2000;10(3):295–307. | ||
Koenigs M, Holliday J, Solomon J, Grafman JJ. Left dorsomedial frontal brain damage is associated with insomnia. Neuroscience. 2010;30(47):16041–16043. | ||
Zhou SY, Tong L, Song F, et al. Selective medial temporal volume reduction in the hippocampus of patients with idiopathic generalized tonic-clonic seizures. Epilepsy Res. 2015;110:39–48. | ||
Barkhof F, Polvikoski TM, van Straaten EC, et al. The significance of medial temporal lobe atrophy: a postmortem MRI study in the very old. Neurology. 2007;69(15):1521–1527. | ||
de Leon MJ, Mosconi L, Blennow K, et al. Imaging and CSF studies in the preclinical diagnosis of Alzheimer’s disease. Ann NY Acad Sci. 2007;1097:114–145. | ||
Visser PJ, Verhey FR, Hofman PA, Scheltens P, Jolles J. Medial temporal lobe atrophy predicts Alzheimer’s disease in patients with minor cognitive impairment. J Neurol Neurosurg Psychiatry. 2002;72(4):491–497. | ||
Nofzinger EA, Buysse DJ, Germain A, Price JC, Miewald JM, Kupfer DJ. Functional neuroimaging evidence for hyperarousal in insomnia. Am J Psychiatry. 2004;161(11):2126–2128. | ||
Aggleton JP, Dumont JR, Warburton EC. Unraveling the contributions of the diencephalon to recognition memory: a review. Learn Mem. 2011;18(6):384–400. | ||
Aggleton J, Brown MW. Interleaving brain systems for episodic and recognition memory. Trends Cogn Sci. 2006;10(10):455–463. | ||
Aggleton JP, Brown MW. Episodic memory, amnesia, and the hippocampal-anterior thalamic axis. Behav Brain Sci. 1999;22(3):425–444. | ||
Gusnard DA, Raichle ME, Raichle ME. Searching for a baseline: functional imaging and the resting human brain. Nat Rev Neurosci. 2001;2(10):685–694. | ||
Foster DJ, Wilson MA. Reverse replay of behavioural sequences in hippocampal place cells during the awake state. Nature. 2006;440(7084):680–683. | ||
Wig GS, Grafton ST, Demos KE, Wolford GL, Petersen SE, Kelley WM. Medial temporal lobe BOLD activity at rest predicts individual differences in memory ability in healthy young adults. Proc Natl Acad Sci. 2008;105(47):18555–18560. | ||
Laird AR, Eickhoff SB, Li K, Robin DA, Glahn DC, Fox PT. Investigating the functional heterogeneity of the default mode network using coordinate-based meta-analytic modeling. J Neurosci. 2009;29(46):14496–14505. | ||
Felician O, Anton JL, Nazarian B, Roth M, Roll JP, Romaiguère P. Where is your shoulder? Neural correlates of localizing others’ body arts. Neuropsychologia. 2009;47(8–9):1909–1916. | ||
Schaich Borg J, Hynes C, Van Horn J, Grafton S, Sinnott-Armstrong W. Consequences, action, and intention as factors in moral judgments: an fMRI investigation. J Cogn Neurosci. 2006;18(5):803–817. | ||
Raine A, Yang Y. Neural foundations to moral reasoning and antisocial behavior. Soc Cogn Affect Neurosci. 2006;1(3):203–213. | ||
Schilbach L, Bzdok D, Timmermans B, et al. Introspective minds: using ALE meta-analyses to study commonalities in the neural correlates of emotional processing, social and unconstrained cognition. PLoS One. 2012;7(2):e30920. | ||
Seghier ML. The angular gyrus: multiple functions and multiple subdivisions. Neuroscientist. 2013;19(1):43–61. | ||
Chee MW, Chuah YM. Functional neuroimaging and behavioral correlates of capacity decline in visual short-term memory after sleep deprivation. Proc Natl Acad Sci. 2007;104(22):9487–9492. | ||
Horovitz SG, Braun AR, Carr WS, et al. Decoupling of the brain’s default mode network during deep sleep. Proc Natl Acad Sci. 2009;106(27):11376–11381. | ||
Sämann PG, Tully C, Spoormaker VI, et al. Increased sleep pressure reduces resting state functional connectivity. MAGMA. 2010;23(5–6):375–389. | ||
De Havas JA, Parimal S, Soon CS, Chee MW. Sleep deprivation reduces default mode network connectivity and anti-correlation during rest and task performance. Neuroimage. 2012;59(2):1745–1751. | ||
Gao L, Bai L, Zhang Y, Dai XJ, Netra R, et al. Frequency-dependent changes of local resting oscillations in sleep-deprived brain. PLoS One. 2015;10(3):e0120323. | ||
Peng DC, Dai XJ, Gong HH, et al. Altered intrinsic regional brain activity in male patients with severe obstructive sleep apnoea: a resting-state fMRI study. Neuropsychiatr Dis Treat. 2014;10:1819–1826. | ||
Sestieri C, Corbetta M, Romani GL, Shulman GL. Episodic memory retrieval, parietal cortex, and the default mode network: functional and topographic analyses. J Neurosci. 2011;31(12):4407–4420. | ||
Tessitore A, Esposito F, Vitale C, et al. Default-mode network connectivity in cognitively unimpaired patients with Parkinson disease. Neurology. 2012;79(23):2226–2232. |
 © 2015 The Author(s). This work is published and licensed by Dove Medical Press Limited. The
full terms of this license are available at https://www.dovepress.com/terms
and incorporate the Creative Commons Attribution
- Non Commercial (unported, 3.0) License.
By accessing the work you hereby accept the Terms. Non-commercial uses of the work are permitted
without any further permission from Dove Medical Press Limited, provided the work is properly
attributed. For permission for commercial use of this work, please see paragraphs 4.2 and 5 of our Terms.
© 2015 The Author(s). This work is published and licensed by Dove Medical Press Limited. The
full terms of this license are available at https://www.dovepress.com/terms
and incorporate the Creative Commons Attribution
- Non Commercial (unported, 3.0) License.
By accessing the work you hereby accept the Terms. Non-commercial uses of the work are permitted
without any further permission from Dove Medical Press Limited, provided the work is properly
attributed. For permission for commercial use of this work, please see paragraphs 4.2 and 5 of our Terms.