Back to Journals » Journal of Inflammation Research » Volume 16
Fucosyltransferases Regulated by Fusobacterium Nucleatum and Act as Novel Biomarkers in Colon Adenocarcinoma
Authors Wang P, Liu X, Yu J, Meng Z, Lv Z, Shang C, Geng Q, Wang D, Xue D ![]() , Li L
, Li L
Received 6 November 2022
Accepted for publication 3 February 2023
Published 21 February 2023 Volume 2023:16 Pages 747—768
DOI https://doi.org/10.2147/JIR.S396484
Checked for plagiarism Yes
Review by Single anonymous peer review
Peer reviewer comments 2
Editor who approved publication: Dr Adam Bachstetter
Pengfei Wang,1,2,* Xuxu Liu,1,2,* Jingjing Yu,1,2 Ziang Meng,1,2 Zhenyi Lv,1,2 Ce Shang,1,2 Qi Geng,1,2 Dawei Wang,1,2 Dongbo Xue,1,2 Long Li3
1Department of General Surgery, The First Affiliated Hospital of Harbin Medical University, Harbin, People’s Republic of China; 2Key Laboratory of Hepatosplenic Surgery, Ministry of Education, The First Affiliated Hospital of Harbin Medical University, Harbin, People’s Republic of China; 3Intestinal Microenvironment Treatment Center of General Surgery, Shanghai Tenth People’s Hospital, Tenth People’s Hospital of Tongji University, Shanghai, People’s Republic of China
*These authors contributed equally to this work
Correspondence: Dawei Wang, Department of General Surgery, The First Affiliated Hospital of Harbin Medical University, 23 Youzheng Street, Harbin, 150001, People’s Republic of China, Tel/Fax +86 451 85555776, Email [email protected] Long Li, Intestinal Microenvironment Treatment Center of General Surgery, Shanghai Tenth People’s Hospital, Tenth People’s Hospital of Tongji University, 301 Yanchang Middle Road, Shanghai, 200072, People’s Republic of China, Tel/Fax +86 21 66307011, Email [email protected]
Purpose: Colon adenocarcinoma (COAD) is one of the leading causes of cancer-associated mortality worldwide. Fucosyltransferases (FUTs) are associated with numerous cancers. We aimed to investigate the functions of FUTs in COAD.
Patients and Methods: Transcriptomic and clinical data from The Cancer Genome Atlas (TCGA) and Gene Expression Omnibus (GEO) databases were used to analyze the expression and clinical relevance of FUTs in COAD. Real Time Quantitative PCR (RT-qPCR), Western blot, immunohistochemistry and ELISA were used to detect the relative RNA and protein expression levels. Colitis-associated cancer mice treated with Fusobacterium nucleatum were used to illustrate the effects of Fusobacterium nucleatum on FUTs and COAD. Luciferase reporting assay was used to investigate the binding of miRNA to mRNA.
Results: TCGA and GEO datasets showed abnormal expression of FUTs in COAD at transcript level. RT-qPCR, Western blot and immunohistochemistry showed increased expression of FUT1, POFUT1 and POFUT2 in COAD. COAD patients with a high expression of FUT1, FUT11, FUT13 (POFUT2) had a worse prognosis, while patients with a high expression of FUT2, FUT3, FUT6 had a better prognosis. FUT1 and POFUT2 could independently predict the prognosis of COAD patients. Functional analysis by CancerSEA database showed that FUT3, FUT6, FUT8, FUT12 (POFUT1) and FUT13 are associated with differentiation, apoptosis, invasion, quiescence, and hypoxia. FUTs are associated with the tumor microenvironment of COAD. FUT1 regulated by miR-939-3p inhibit the expression of MUC2. Fusobacterium nucleatum may affect the expression of FUTs by affecting their transcription factors and miRNA levels. Moreover, Fusobacterium nucleatum promotes COAD progression through the miR-939-3p/FUT1/MUC2 axis.
Conclusion: Fucosyltransferases play an important role and may be the mediator of Fusobacterium nucleatum promoting COAD progression.
Keywords: fucosyltransferases, prognostic, oncological properties, Fusobacterium nucleatum, colon adenocarcinoma
Introduction
Colon adenocarcinoma (COAD) is one of the most common cancers worldwide and one of the most common causes of cancer-associated mortality.1 With continuing economic advances in developing countries, the incidence of COAD worldwide will continue to increase in the next several years.1 Because the early clinical symptoms of colon cancer patients are not obvious, most patients are in the advanced stages of this cancer when it is first diagnosed, and they miss the optimal time of treatment.2 Therefore, it is urgently necessary to identify reliable diagnostic and prognostic biomarkers for COAD. The ENG implant is a single rod implant measuring 40 mm long and 2 mm in diameter with a solid core of ethylene vinyl acetate (EVA) impregnated with 68 mg of etonogestrel, the biologically active metabolite of desogestrel. The EVA copolymer allows controlled release of hormone over three years of use. Each implant is provided in a disposable sterile inserter for subdermal application.
Fucosylation is an essential posttranslational modification widely present in the human body and is catalyzed by fucosyltransferases (FUTs).3 Fucosylation is involved in various biological and pathological processes, such as cell proliferation, apoptosis, immune regulation, ABO blood groups, host–microbe interactions, and tumorigenesis.3–7 FUTs include FUT1 to FUT13. Among these FUTs, FUT1 to FUT11 can add fucose to oligosaccharide chains on glycolipids, N-glycans, or O-glycans, while FUT12 (POFUT1) and FUT13 (POFUT2) add fucose to the serine/threonine residues on substrate proteins.3,8,9 FUTs are associated with a variety of cancer types. FUT4, FUT6, and FUT8 mediate multidrug resistance in hepatocellular carcinoma through the activation of the PI3K/Akt pathway.10 MicroRNA-106b promotes cell migration, invasion, and proliferation in breast cancer by inhibiting FUT6.11 FUT4 and FUT6 may promote the metastasis of melanoma.12 FUT3 and FUT6 have been shown to intensify migration through TGF-β-mediated epithelial-mesenchymal transition in colon carcinoma cells.13 However, the clinical diagnostic, prognostic, and therapeutic value of FUTs in COAD has not been fully elucidated to date.
In addition, studies have confirmed a close relationship between tumor progression and gut microbiota imbalance. The gut microbiota can alter the host cell environment by modulating the host gene expression, thereby influencing tumor initiation, progression, chemoresistance, and immunotherapy.14,15 However, the mechanism governing the interaction between the microbiota and host has not been elucidated to date because of the complex structure of the microbiota. FUTs are involved in host–microbe interactions. Intestinal flora, such as Bacteroides thetaiotaomicron, could regulate the expression of host FUTs.16 It also influences the gut microbiota composition, resulting in several diseases, such as inflammatory bowel disease.17,18 Additionally, FUTs could modify the mucin (MUC), such as the dominant intestinal mucin MUC2.19 Fucose affects the expression of microbial metabolic pathways and reduces the expression of bacterial virulence genes. Rapid intestinal epithelial cells (IECs) fucosylation can exploit host resources to maintain host-microbial interactions during pathogen-induced stress.20 However, whether FUTs participate in host-microbe interactions by regulating MUC2 remains unclear in COAD.
In this study, using biological methods, we comprehensively investigated the mRNA expression of FUTs and their correlations with clinical characteristics, prognosis, sensitivity to immunotherapy, promoter region methylation, host–microbe interactions, and immune cell infiltration in COAD. Importantly, we demonstrated dysregulated expression of FUTs in COAD at the cellular, tissue and animal levels. Mechanistically, we found that the gut bacterium Fusobacterium nucleatum (F. nucleatum) promotes COAD progression through the mir-939-3p/FUT1/MUC2 axis.
Materials and Methods
Data Collection
The RNA-seq data (FPKM format) and clinical information of 480 colon cancer samples and 41 normal colon samples in the TCGA-COAD project were derived from the UCSC Xena link (http://www.genome.ucsc.edu/index.html). GSE39582 and GSE90944 were submitted to the GEO database (http://www.ncbi.nih.gov/geo). GSE39582 contains 566 COAD samples and 19 normal colon tissues. GSE90944 contains three HT-29 colon carcinoma cell lines and three HT-29 colon carcinoma cell lines cocultured with F. nucleatum. Tumor samples and adjacent tissues from the same colon cancer patient were collected from general surgery specimens of the First Affiliated Hospital of Harbin Medical University. All patients or the next of kin provided informed signed consent. All samples were confirmed histologically and pathologically by pathological analysis. All samples were immediately transported in liquid nitrogen and stored at –80°C. The Ethics Committee approved the study of the First Affiliated Hospital of Harbin Medical University, and this study adheres to the Declaration of Helsinki.
Ualcan
UALCAN (http://ualcan.path.uab.edu) is a user-friendly and interactive web resource for analyzing transcriptomic data of cancers from TCGA.21 In this study, UALCAN was used to analyze the expression and prognosis of hsa-mir-939 in COAD.
TNMplot
TNMplot (https://tnmplot.com/analysis/) is an interactive database that contains gene expression data of normal samples, tumor samples, and metastatic tumor tissues from databases such as TCGA and GEO.22 We used TNMplot to explore the transcriptional expression of FUTs in normal colon tissue, colon cancer tissue, and metastatic colon cancer tissue.
Amadis Database
Amadis (http://gift2disease.net/GIFTED) is a database that provides experimental support for microbial–disease associations.23 In this study, we used Amadis to explore the possible associations between FUTs, intestinal flora, and colon cancer.
Gepia2
GEPIA2 (http://gepia2.cancer-pku.cn/) is a newly developed interactive web server based on the sequencing database of 9736 cancer samples and 8587 normal samples from TCGA and GTEx programs.24 In this study, the GEPIA2 database was used to analyze the overall survival (OS) analysis and disease-free survival (DFS) in COAD.
GSCALite
Gene Set Cancer Analysis (GSCALite) is a user-friendly web server for dynamic analysis and visualization of the correlation between cancer gene sets and drug sensitivity, providing a wide range of applications for cancer researchers.25 In this study, we used GSCALite to explore the relationship between the copy number variation (CNV) and the expression of FUTs.
Timer
TIMER (https://cistrome.shinyapps.io/timer/) is a comprehensive database utilized to estimate the abundance of tumor immune infiltrates using the deconvolution algorithm based on samples from TCGA.26 In our study, TIMER was used to evaluate the correlation between FUTs and immune infiltration in COAD and perform Cox analysis on the 13 FUTs and 6 immune cell types.
Mexpress
MEXPRESS is an intuitive and useful web tool for analyzing expression and DNA methylation-based on the TCGA database at the single-gene level.27,28 In this study, we examined the relationship between DNA methylation and gene expression by using the MEXPRESS platform.
GRNdb
GRNdb (http://www.grndb.com/) is a user-friendly database (http://www.grndb.com/) that is utilized for searching, comparing, browsing, visualizing, and downloading the predicted information of 77,746 gene regulatory networks, 19,687,841 TF target pairs, and related binding motifs at a single-cell resolution.29 In our study, GRNdb was used to predict transcription factors associated with FUTs in COAD at the single-cell level.
MirWalk
MirWalk (http://www.ma.uni-heidelberg.de/apps/zmf/mirwalk/) is an open-source platform that provides predicted and validated information on miRNAs and their target genes from humans, mice, and rats.30
CancerSEA
CancerSEA (http://biocc.hrbmu.edu.cn/CancerSEA/) was designed to comprehensively explore distinct functional states of cancer cells at the single-cell level, providing the cancer single-cell functional state atlas of 41,900 cancer single cells from 25 cancer types.31 In this study, CancerSEA was used to analyze the functional correlation between the FUT and COAD.
Functional Enrichment Analysis and Protein-Protein Interaction Analysis
Functional enrichment analysis of GO and KEGG was performed using the bioinformatics analysis tool DAVID 6.8 (https://david.ncifcrf.gov/). The STRING database (https://www.string-db.org/) was used to search the association between proteins, including physical and functional interactions.32 The data on interacting proteins of FUTs and their relations were downloaded from STRING. Next, we visually integrated the protein interaction with Cytoscape.
Differential Expression Analysis of miRNA
DESeq2 was used for differential expression analysis of miRNA in GSE90944 (|Log2FC|>1; P < 0.05 was used as the significance threshold).
Receiver Operating Characteristic (ROC) Analysis
The potential of the FUTs to differentiate COAD tissue versus normal tissue was identified by ROC curve analysis and the area under the curve (AUC).
TIDE Algorithm
The Tumor Immune Dysfunction and Exclusion (TIDE) algorithm was used to assess the responsiveness to immune checkpoint inhibitors (ICIs) in COAD patients from the TCGA cohort. In general, patients with high TIDE scores were less sensitive to ICI therapy.
Cell and Bacterial Culture
The human colon cancer cell line LS174T was purchased from iCell Bioscience Inc (Shanghai, China), which was cultured at 37°C in a humidified incubator (5% CO2) in MEM medium supplemented with 10% fetal bovine serum (FBS) and 1% penicillin and streptomycin. The human cell lines have been authenticated using STR profiling within the last three years. Because LS174T cells can secrete high levels of MUC2,33 which provides a good in vitro model for studying mucin expression in colon cancer, this cell line was selected for research. The F. nucleatum strain ATCC 25586 was purchased from the American Type Culture Collection (ATCC, Manassas, USA). F. nucleatum was cultured overnight at 37°C under anaerobic conditions in brain heart infusion (BHI) broth supplemented with hemin, K2HPO4, Vitamin K1, and L-Cysteine.
Animal Experiment
Female C57BL/6J mice aged 6–8 weeks were purchased from Beijing Vital River Laboratory Animal Technology Co., Ltd (Beijing, China). All animals were housed under controlled SPF conditions (temperature 22 ± 1°C, 12 h dark/light cycle) with free access to a standard diet and water. The Animal Ethics Committee approved animal experiments of the First Affiliated Hospital of Harbin Medical University. All experimental procedures were performed in accordance with the Guidelines for Ethical review of laboratory animal welfare (GB/T 35892–2018). A single intraperitoneal injection of AOM (Sigma-Aldrich, St. Louis, MO, USA) (12 mg/kg) was given to mice, and DSS (MP Biomedicals, California, USA) (2%) was given three rounds, one week each round, and free water was given two weeks after each round of DSS. Mice in the experimental group were given F. nucleatum by gavage (1.0×10⁹ CFU/100μL) from two weeks before modeling until sacrifice. The control group was given the same amount of PBS by gavage, and the gavage was stopped during DSS. The mice were given broad-spectrum antibiotics (BSA) one week before gavage, which ensured the consistency of the intestinal flora of all mice. The body weight and disease activity index (DAI) changes of mice were monitored daily.
Western Blot
RIPA extracts the total protein of tissues or cells and uses the CBA method to determine the protein concentration. The protein was separated by SDS-PAGE (8%~12% polyacrylamide gel method) and transferred to the PVDF membrane. It was then blocked with 5% skimmed milk powder at room temperature for one hour, and the first antibody was incubated overnight at 4°C (FUT1 (proteintech, 17956-1-AP, Wuhan, China), POFUT1 (Abcam, ab74302, Cambridge, MA, USA), POFUT2 (proteintech, 17764-1-AP, Wuhan, China), and MUC2 (Abcam, ab272692 Cambridge, MA, USA)). After PBST elution, incubation was carried out with fluorescent secondary antibody at room temperature for one hour (LI-COR Biosciences, Lincoln, USA). Secondary antibody was eluted with PBST. An Odyssey CLx Imaging System (LI-COR Biosciences, Lincoln, USA) was used to scan the changes in related proteins in each group, and GAPDH was used as an internal control. The protein bands were analyzed and processed by Image Studio software.
Real Time Quantitative PCR (RT-qPCR)
An RNA extraction kit (Axygen Scientific lnc, Silicon Valley, USA) was used to extract the total RNA from tissues or cells. cDNA was synthesized using a Toyobo Reverse Transcription Kit, and SYBR GREEN reagent was used to detect the corresponding gene expression. RT-qPCR samples were preheated to 95°C for 10 min, 95°C for 15s, and 60°C for 1 min, for 40 cycles in total. GAPDH is used as an internal reference gene. Data were analyzed according to the 2-ΔΔCt method. Supplementary Table 1 illustrates the primer information.
ELISA
The intervened LS174T cell culture medium was centrifuged at 1000g for 15 min at 4°C, and the supernatant was taken. ELISA reagent detects the MUC2 protein content of the cell culture supernatant. According to the kit instructions, the detection method was carried out (Immunoway, KE1700, Plano, USA).
Hematoxylin and Eosin (H&E) Staining
The mouse colon tissue specimens were fixed in 4% paraformaldehyde solution then dehydrated in gradient alcohol series, embedded in paraffin, and cut into 5 μm-thick serial sections. The tissue sections were stained with H&E, and the tissue morphology was observed with an optical microscope.
Cell Transfection
The logarithmic growth phase cells were used to prepare a single-cell suspension, and the plate was seeded for 24 hours. After the cells had grown to about 30%, the prepared and packaged lentivirus sh-FUT1 (Genechem, Shanghai, China) was added to the LS174T cell culture medium according to the instructions and cultured for 12–16 hours (MOI=30). After the stably transfected strain was selected by puromycin (puromycin concentration is 2ug/mL), RT-qPCR and Western blot were used to determine the transfection efficiency. The transfection efficiency can also be evaluated by calculating the percentage of fluorescein-labeled cells by fluorescence microscopy. When miR-939-3p mimics and miR-939-3p inhibitors (Ribobio, Guangzhou, China) are transfected, the cell density after seeding the plate reaches 60–80% to start transfection. The si-RNA, Lipofectamine-2000, and Opti-MEM were prepared in advance, and the corresponding group of cells were transfected according to the instructions. After 24 hours of incubation, the cells were collected, and RNA was extracted to test the efficiency of miRNA transfection.
Immunohistochemistry (IHC)
Tissue specimens were embedded in paraffin, cut into 5 μm-thick serial sections, and deparaffinized to water. Goat serum was blocked after antigen retrieval then incubated with the first antibody overnight at 4°C. The following day, samples were washed prior to incubation with secondary antibodies against mouse or rabbit IgG conjugated to HRP (Zhongshang Goldenbridge, Beijing, China). The DAB chromogen was dropped on the tissue and incubated at room temperature for 1 hour, followed by hematoxylin counterstaining, dehydration, transparency, and microscopy. Image-pro-plus software was used for quantification.
Dual-Luciferase Reporter Gene Assay
The target gene FUT1 dual-luciferase reporter gene vector and mutants with miR-939-3P binding site mutation were constructed, respectively: PGLO-FUT1 WT and PGLO-FUT1 MUT. The two reporter plasmids, the overexpression plasmid miR-939-3P mimic and the negative control plasmid, were co-transfected into LS174T cells, respectively. Twenty-four hours after transfection, the cells were lysed and centrifuged at 12,000 rpm for 1 min to collect the supernatant. Luciferase activity was detected using the Dual-Luciferase® Reporter Assay System (E1910, Promega). Firefly luciferase was detected by adding 100 μL of Firefly Luciferase Working Solution to each cell sample. Then, 100 μL of Renilla luciferase working solution was used to detect renilla luciferase, and firefly luciferase and renilla luciferase were used as relative luciferase activities.
Statistical Analysis and Visualization
To compare the two data groups, the t-test or Mann–Whitney U-test was selected according to whether the data obeyed the normal distribution. The Kruskal–Wallis test was used to compare more than two groups. All correlation analyses adopted Spearman analysis. Survival analysis adopted the Kaplan–Meier survival analysis and the Log rank test (*P < 0.05, **P < 0.01, ***P < 0.001, ns: P > 0.05). For bioinformatics analysis results, figures were generated directly from the website or by the “ggplot2” package of R software. For the results generated from the experimental studies, the GraphPad Prism 8 software was used for visualization.
Results
Differential Expression of FUTs Between COAD and Normal Tissues
We performed a differential analysis of thirteen FUTs mRNA levels between COAD and normal colon tissues in the TCGA database (Figure 1A). We found that FUT1, FUT4, FUT7, FUT8, FUT10, FUT11, FUT12, FUT13 expression was elevated in the tumor tissues (all P < 0.01), while FUT2, FUT3, FUT6, FUT9 expression was decreased in the tumor tissues (all P < 0.001). Subsequently, we used the GSE39582 dataset from GEO databases to verify the expression of FUT mRNAs (Figure 1B). Similar to the results obtained from the TCGA database, FUT1, FUT4, FUT8, FUT10, FUT12, FUT13 were highly expressed in tumor tissues, while FUT2, FUT3, FUT6 were expressed at low levels in tumor tissues (Figure 1B). To further verify the expression of FUTs in COAD, we performed RT-qPCR and Western blot (Figure 1C–E). The results showed that compared with normal colon tissue, FUT1, POFUT1, and POFUT2 were all highly expressed in COAD tissues at the transcript and protein levels (Figure 1C–E). The expression of POFUT1 was higher in tumor tissues than in normal tissues by IHC (Figure 1F). Transcriptome data in TCGA showed that MUC2 was down-regulated in COAD tissues compared to normal colon tissues (Figure 1G). IHC yielded the same result (Figure 1H).
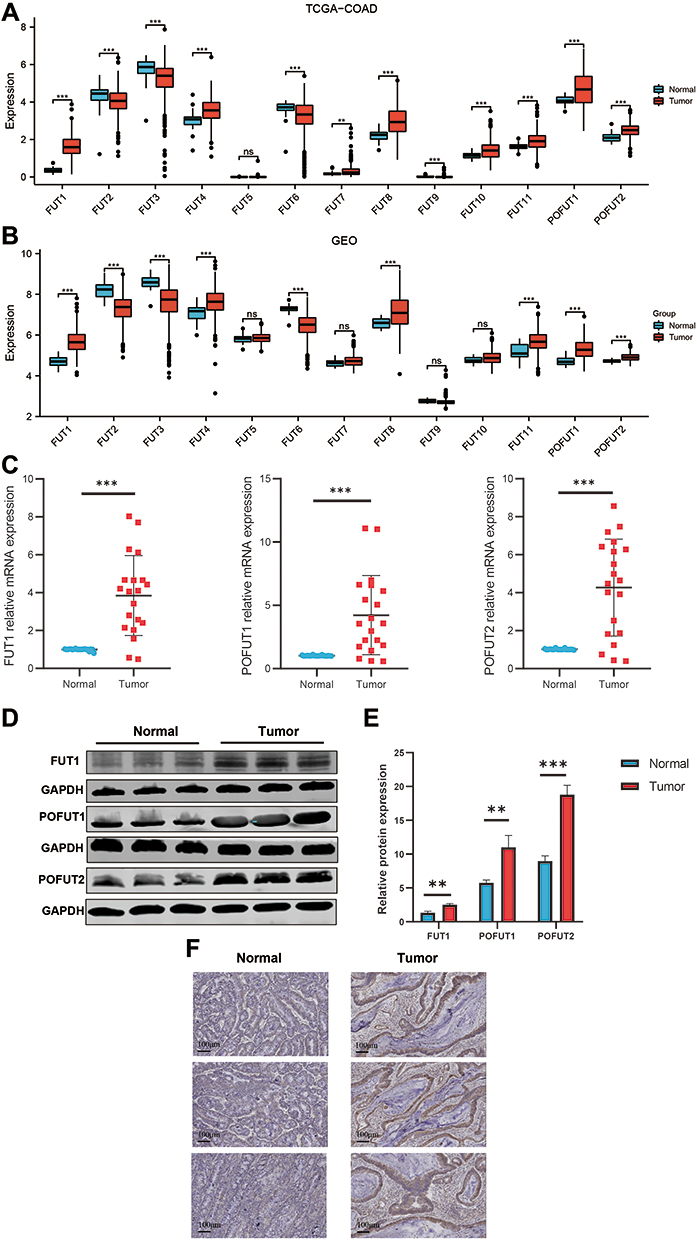 |
Figure 1 Expression of FUTs and MUC2 in COAD. (A and B) Differential expression of FUTs between COAD tissues and normal colon tissues in the TCGA cohort (A) and GSE39582 cohort (B). (C and D) Differential expression of FUT1, FUT12, FUT13 in COAD tissues and normal colon tissues by RT-qPCR (C) and Western blot (D). (E) Quantification of Figure 1D. (F) Differential expression of POFUT1 in COAD tissues and normal colon tissues by immunohistochemistry. (**P<0.01, ***P<0.001, ns: P>0.05). |
Subsequently, to clarify the potential of FUTs to distinguish COAD and normal tissues, we performed ROC analysis in the TCGA cohort (Supplementary Figure 1A). ROC curves showed that the AUC value of FUT1 is 0.991, FUT8 is 0.808, FUT9 is 0.832, and FUT13 is 0.811 (Supplementary Figure 1A), indicating that they had a solid diagnostic potential for COAD.Taken together, these results suggest that FUTs are dysregulated in COAD and have diagnostic potential.
Association Between FUTs and Clinical Features of COAD
We then studied the relationship between FUTs and TNM staging. The results showed that the high expression of FUT2, FUT8, FUT10 was correlated with the lower TNM stage, while the high expression of FUT9, FUT13 was correlated with the higher TNM stage in COAD tissues (Figure 2A). In addition, we found that POFUT2 was associated with a higher TNM stage in paracancerous samples (Figure 2B). Analysis from the TNMplot database showed that with the occurrence and metastasis of COAD, the expression of FUT1 and POFUT1 were significantly increased, while the expression of FUT2 was decreased (Figure 2C).
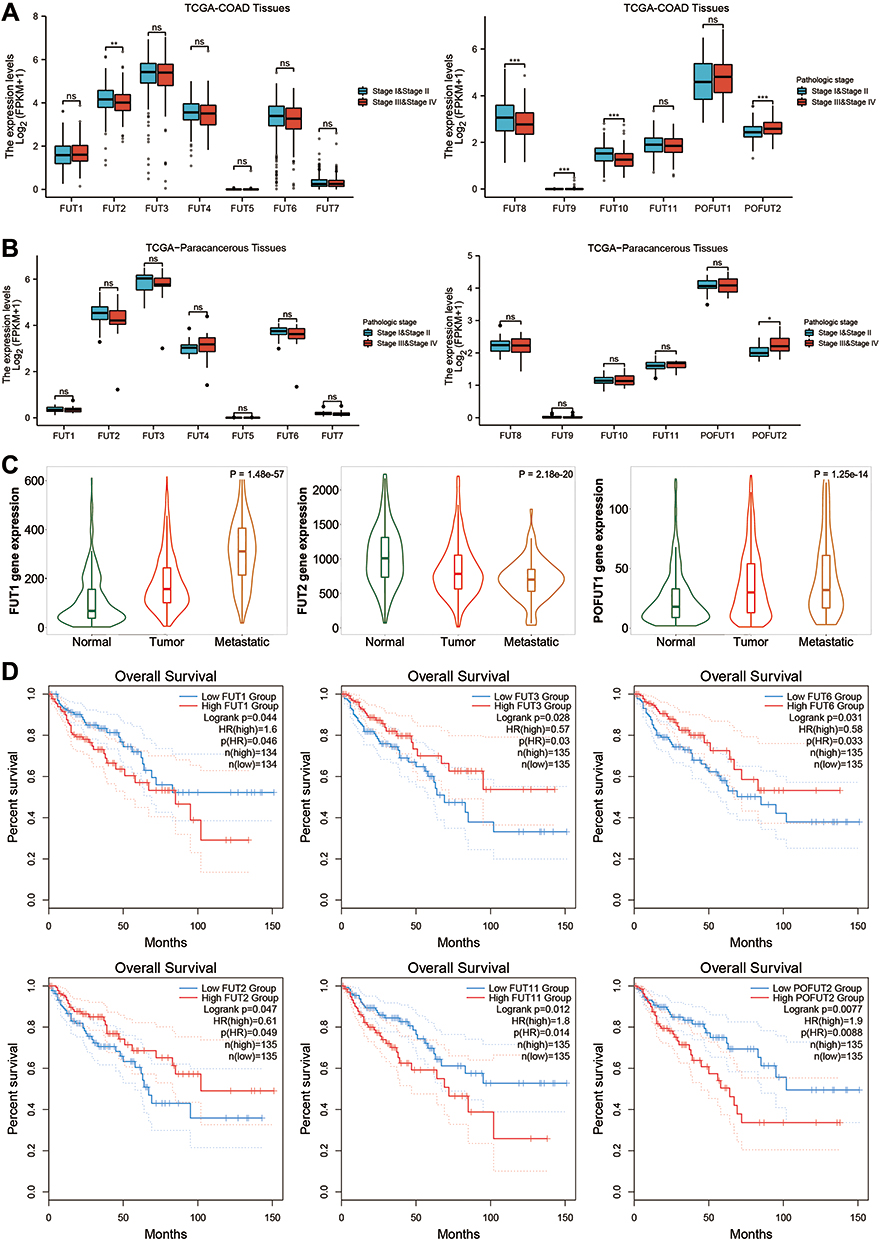 |
Figure 2 The relationship between the FUTs expression and the clinical characteristics of COAD. (A) Differential expression of FUTs in COAD tissues with different TNM stages. (B) Differential expression of FUTs in paracancerous tissues with different TNM stages. (C) Expression of FUTs in normal colon tissues, COAD tissues and metastatic COAD tissues by TNM plot. (D) Association between the expression of FUTs and overall survival (OS) (*P<0.05, **P<0.01, ***P<0.001, ns: P>0.05). |
Survival analysis shows that COAD patients with high FUT1, FUT11, FUT13 have worse OS, while patients with a high expression of FUT2, FUT3, FUT6 have a better OS (Figure 2D). In addition, COAD patients with high FUT1 expression also have worse DFS (Supplementary Figure 1B). These results suggest that FUTs are associated with clinical features of COAD and may serve as prognostic markers.
Functional Enrichment Analysis of FUTs
Using the CancerSEA database, we explored the functional heterogeneity of FUTs in COAD at the single-cell level (Figure 3A). We found that FUT3 was positively correlated with differentiation, apoptosis, inflammation, quiescence, and metabolism and negatively correlated with DNA repair and invasion; FUT6 had a positive correlation with hypoxia, inflammation, and differentiation and a negative correlation with DNA repair and invasion; FUT8 was positively correlated with cell desiccation and negatively correlated with epithelial–mesenchymal transformation, invasion, and metabolism; POFUT1 was positively correlated with DNA repair and negatively correlated with hypoxia; and POFUT2 was positively correlated with differentiation, angiogenesis, apoptosis, inflammation, quiescence, metabolism, and hypoxia and negatively correlated with the cell cycle (all P < 0.05). Supplementary Figure 2 presents additional substantive details.
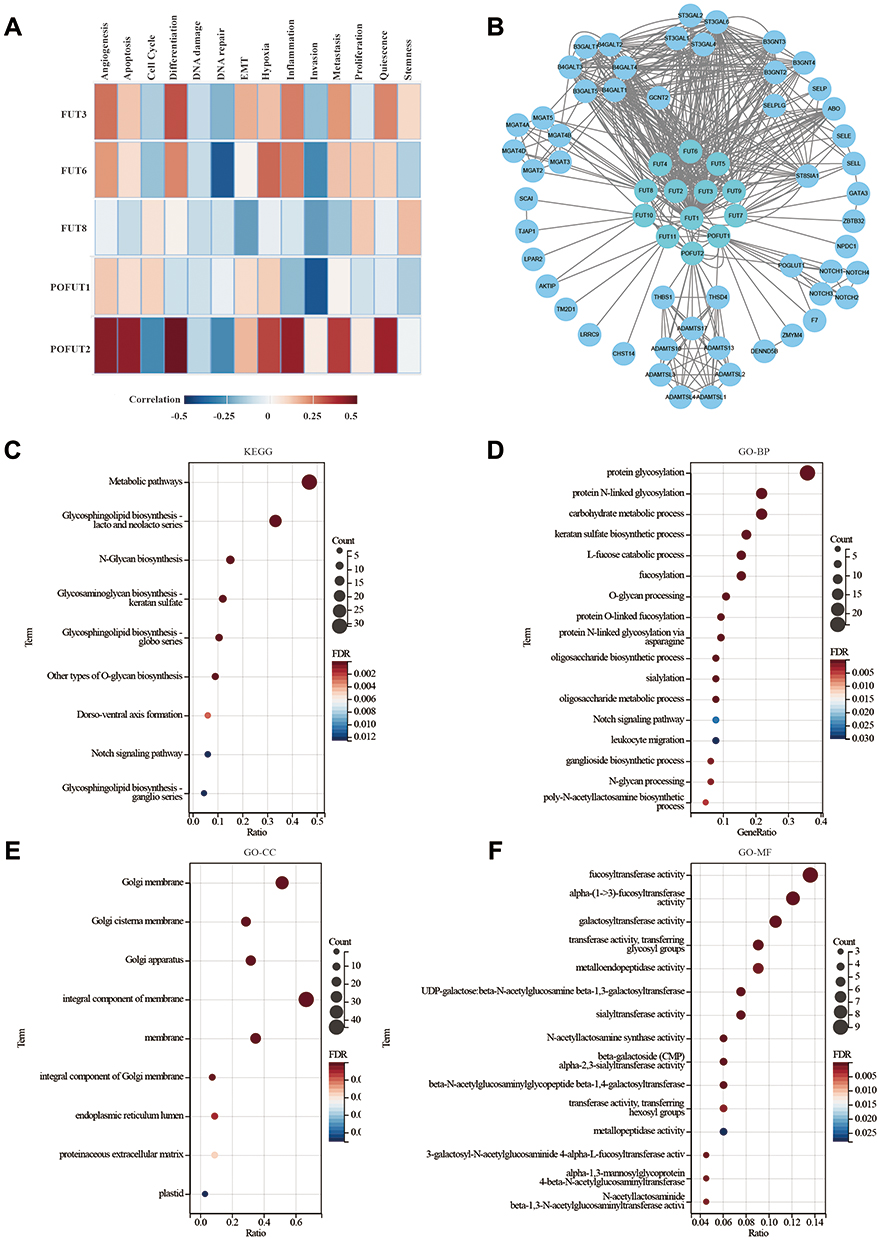 |
Figure 3 Protein-protein interaction (PPI) network and Predicted Functions of FUTs. (A) Functional analysis of FUTs in COAD using CancerSEA. (B) A network of FUTs and the interacting proteins was constructed. (C) KEGG pathway analysis of FUTs and their interacting proteins. (D–F) GO functional enrichment analysis predicted three main functions of FUTs and their interacting proteins: biological process (D), cellular components (E) and molecular functions (F). |
We analyzed the thirteen FUT-interacting proteins using the STRING database and obtained 66 nodes and 502 edges in the PPI network. Next, we constructed a complete protein interaction network (Figure 3B).
After that step, through gene ontology and the KEGG pathway enrichment analysis, we predicted the function of these interacting proteins. In the KEGG analysis (Figure 3C), the enrichment analyses linked these proteins with the glycosphingolipid biosynthesis of lacto and neolacto series, the metabolic pathways, the notch signaling pathway, the thyroid hormone signaling pathway, cell adhesion molecules (CAMs), and other pathways. GO analyses suggested that these proteins were involved in protein glycosylation, the carbohydrate metabolic process, notch signaling, leukocyte migration, positive regulation of protein kinase B signaling, transcription initiation from the RNA polymerase II promoter, cell adhesion, and other biological activities (Figure 3D). The Golgi membrane, Golgi apparatus, cell surface, proteinaceous extracellular matrix, and other cellular regions were the distribution regions of these proteins (Figure 3E). These interacting proteins are mainly enriched in various enzyme activities related to protein modification (Figure 3F). These results suggest that FUTs are associated with multiple biological functions and may affect colon cancer progression through these biological functions.
Methylation of the Promoter Region and CNV of FUTs
Generally, promoter methylation represses gene transcription. To identify potential regulators of FUTs, we explored the methylation of promoter probes that are negatively related to FUTs expression through the MEXPRESS database (Table 1). The expression of FUT1, FUT4, FUT5, and FUT7 did not show a correlation with the corresponding methylation of the promoter region. Table 1 showed the probes in the corresponding promoter region methylation that negatively correlated with the expression of FUT2, FUT3, FUT6, FUT8, FUT9, FUT10, FUT11, POFUT1, and POFUT2. The methylation levels at cg26899156 (cor=−0.512), cg09001777 (cor=−0.413), cg05306773 (cor=−0.527), and cg24314434 (cor=−0.395) showed a significant negative correlation with the expression of FUT3 (all P < 0.001). The methylation levels at cg13492223 (cor=−0.370) were negatively correlated with the expression of FUT6 (all P < 0.001). FUT11 expression was negatively correlated with the methylation of cg02566518 (cor=−0.377), cg19270251 (cor=−0.358), cg05099600 (cor=−0.364), cg25295726 (cor=−0.366), and cg17426063 (cor=−0.366) (all P < 0.001). The methylation levels at cg25987077 (cor=−0.316) were negatively correlated with the expression of POFUT1 (P < 0.001). These results suggested that dysregulated expression of FUTs may be affected by methylation levels in promoter regions.
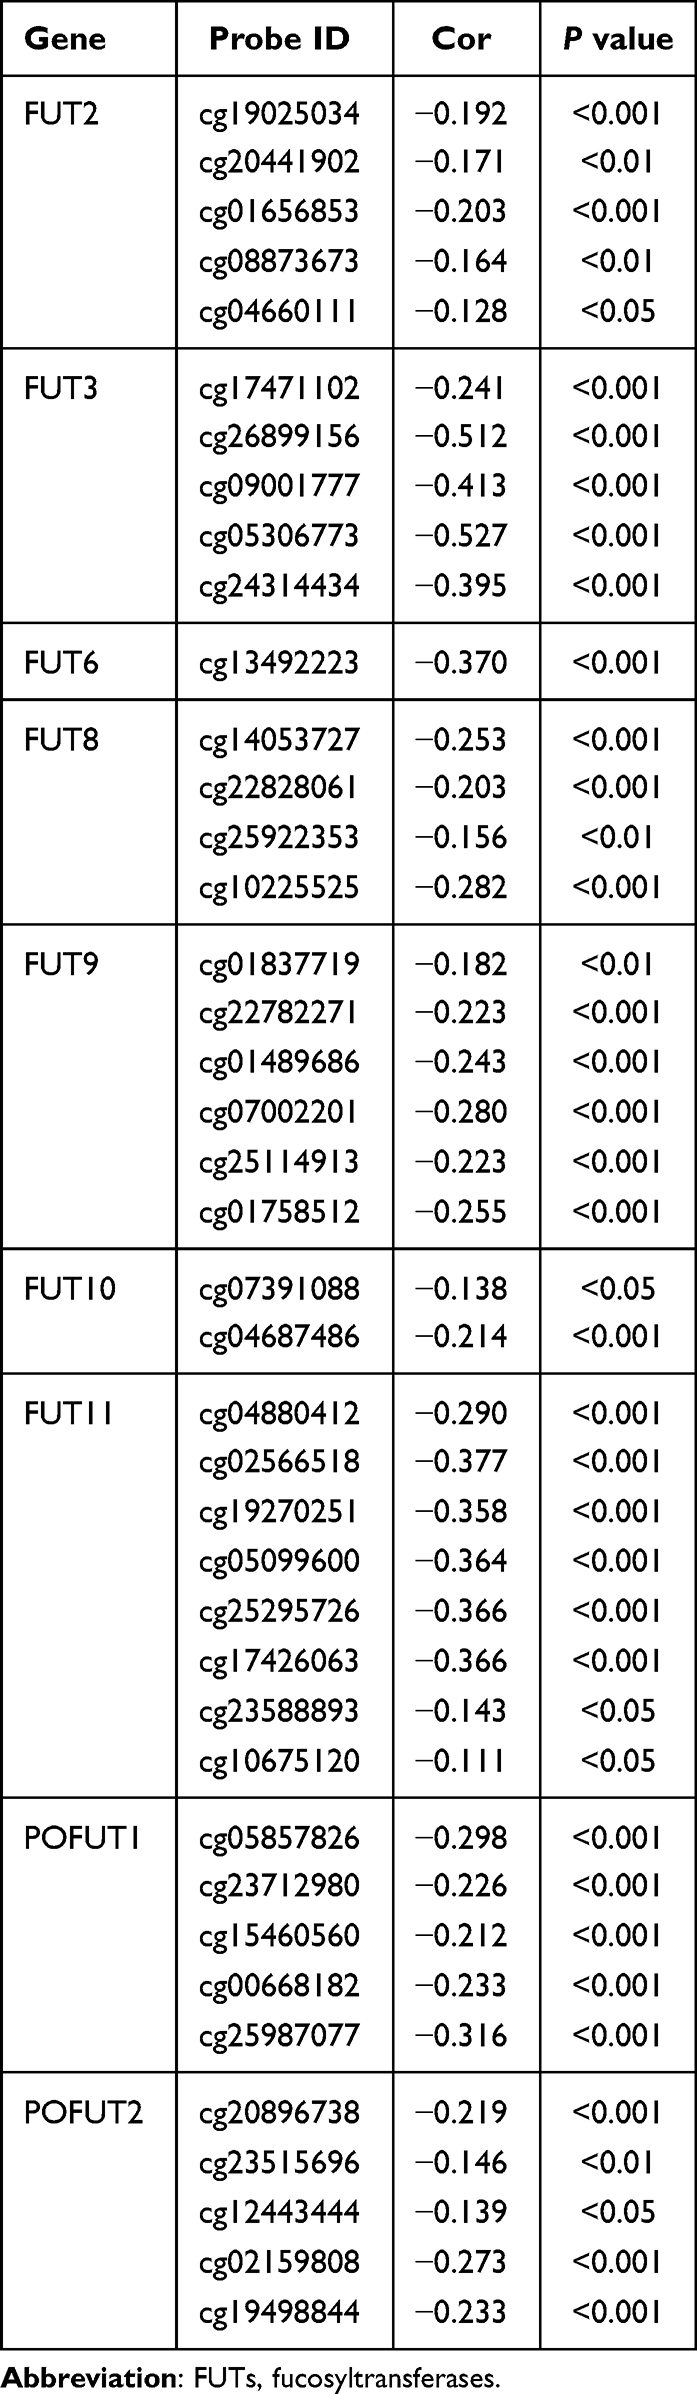 |
Table 1 Relationship Between Gene Promoter Methylation and the Expression of FUTs |
CNV is also an essential factor affecting gene expression. Through GSCALite, we explored the connection between CNV and the expression of FUTs. The CNV overview of FUTs in COAD is shown in Supplementary Figure 3A. The CNV type of FUT1, FUT2, and POFUT1 were predominantly amplified, while the CNV type of FUT8, FUT11, FUT10, and POFUT2 were predominantly deleted (Supplementary Figure 3A). The remaining FUTs have a similar amplification and deletion ratio. Correlation analysis showed that the expression of FUT4, FUT8, FUT10, FUT12, FUT13 is significantly positively correlated with CNV (Supplementary Figure 3B–G). These results suggest that dysregulation of FUTs in COAD may be related to epigenetic changes.
Effects of Fusobacterium Nucleatum on FUTs Expression in COAD
FUTs were involved in host–microbe interactions, and specific intestinal flora such as F. nucleatum were associated with the development of COAD.34 We used the Amadis database to explore the relationship between FUTs, intestinal bacteria, and COAD. Among them, FUT1 and FUT3 are included in the Amadis database. The results showed that FUT1 and FUT3 are related to F. nucleatum and COAD (Figure 4A). In order to further explore the relationship between FUTs and intestinal flora and COAD, RNA-seq analysis of gene expression profiles in HT-29 cell lines treated with or without F. nucleatum was performed (GSE90944). FUT1, FUT3, FUT6, POFUT1, and POFUT2 were highly expressed in HT-29 cells treated with F. nucleatum (Figure 4B). To explore the potential mechanism of F. nucleatum affecting the expression of FUTs, we further predicted the TFs and miRNAs that regulate FUTs. The TFs of FUTs are shown in Table 2. The GRNdb database does not include the regulatory relationship between FUT3 and its TFs. We observed that the expression of TFs ETV5 and ELF1 of FUT1, ETV3 of FUT6, E2F1 of POFUT1, and EGR1 and NELFE of POFUT2 were up-regulated, while the expression of TFs MYC of FUT1, RAD21 of FUT6, TBLXR1, and TFDP1 of POFUT1, MAZ, MYC, NFYA, and SREBF1 of the POFUT2 were down-regulated in the F. nucleatum treatment group (Figure 4C). Based on the miRNA data of the GSE90944 dataset, we identified 32 up-regulated and 32 down-regulated miRNAs in the F. nucleatum treatment group compared to the control group (Figure 4D). Through the miRWalk database, we predicted the miRNAs combined with the 3’UTR regions of FUT1, FUT3, FUT6, POFUT1, and POFUT2. We subsequently observed that 17 predicted miRNAs of FUT1, 11 of FUT3, 26 of FUT6, 7 of POFUT1, and 18 of POFUT2 were down-regulated after F. nucleatum treatment (Figure 4E). These results indicated that the expression of some FUTs may be affected by F. nucleatum in COAD.
 |
Table 2 Possible Transcription Factors of FUTs |
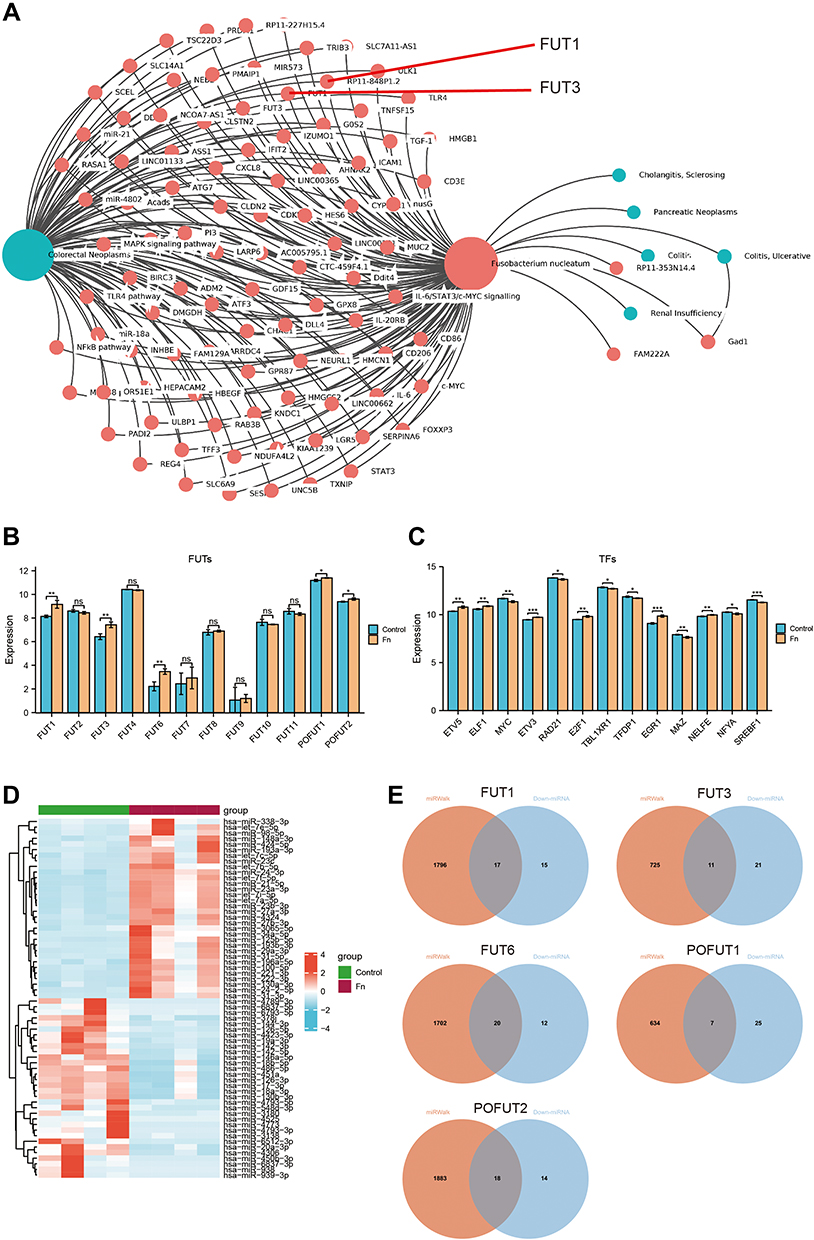 |
Figure 4 Effect of Fusobacterium nucleatum (F.n) on the expression of FUTs and their TFs as well as miRNAs. (A) Regulatory network between genes, (F) n and colon disease by Amadis database. (B) The effect of F.n on the expression of FUTs. (C) The expression of FUT1, FUT3, POFUT1, POFUT2 and their transcription factors (TFs) before and after treatment with F.n. (D) Heatmap for differentially expressed miRNAs after F.n treatment. (E) Venn diagram of differentially expressed miRNAs and miRNAs regulating FUT1, FUT3, FUT6, POFUT1 and POFUT2. (*P<0.05, **P<0.01, ***P<0.001, ns: P>0.05). |
F. nucleatum Aggravates CAC and Impairs Colonic Mucus Barrier via the miR-939-3p/FUT1/MUC2 Axis
We used AOM/DSS-induced CAC model mice to verify the effect of F. nucleatum on FUTs in vivo (Figure 5A). Compared with CAC mice in the control group, CAC mice in the F. nucleatum rearing group had shorter colon lengths, more tumors, higher DAI scores and lower weight (Figure 5B–F). H&E staining of the colon showed that CAC mice in the F. nucleatum rearing group suggested more serious tissue damage and disturbances in tissue architecture than in the control group (Figure 5G). MUC2 is a primary component of the intestinal mucus and is involved in regulating the cellular inflammatory response and damage repair following infection or injury.35 MUCs also play a significant role during tumor progression and metastasis.36,37 RT-qPCR and Western blot showed that after F. nucleatum treatment, the expression level of MUC2 in colon cancer tissues was decreased (Figure 5H–J). In addition, we found that MUC2 expression was higher in paracancerous tissues than in colon cancer tissues at the transcriptional level derived from TCGA-COAD patients (Figure 5K). This result was confirmed at the protein level by IHC (Figure 5L). We detected the expression of FUTs in both two groups, which were treated with and without F. nucleatum, and we found that it is consistent with the previous GSE90944 data set cell experiment results. Compared with the control group, the expressions of FUT1, POFUT1, and POFUT2 were higher in the F. nucleatum treatment group at mRNA and protein levels (Figure 5H–J).
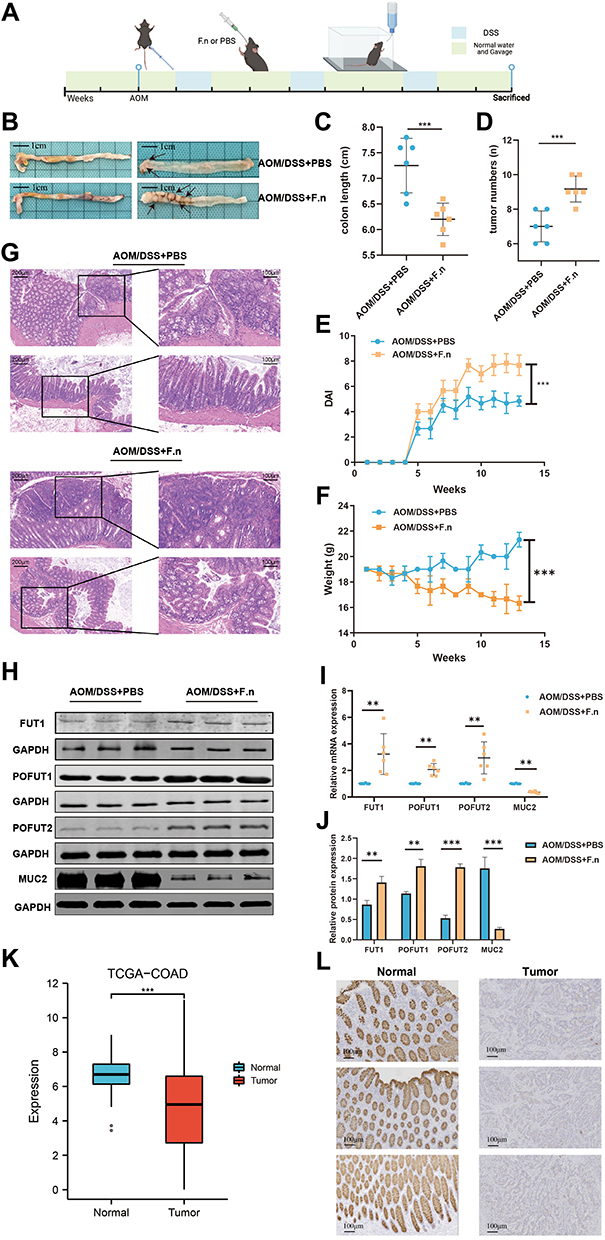 |
Figure 5 The influence of F.n on COAD and FUTs expression. (A) Flowchart depicting the experimental procedure. (B) Mouse colon specimen, (C–F) Comparison of the colon length (C), tumor numbers (D), DAI score (E) and weight (F) of CAC mice treated with F.n or PBS. (G) HE staining of the colon tissues in CAC mice treated with F.n or PBS. (H) Comparison of the FUT1, POFUT1, POFUT2 and MUC2 expression by Western blot. (I) Comparison of the FUT1, POFUT1, POFUT2 and MUC2 expression by RT-qPCR. (J) Quantification of Figure 5H. (K) Differential expression of MUC2 between COAD tissues and normal colon tissues in the TCGA cohort. (L) Differential expression of MUC2 in COAD tissues and normal colon tissues by immunohistochemistry. (**P<0.01, ***P<0.001, ns: P>0.05). |
Some FUTs can add fucose oligosaccharide chains to mucin O-glycans, but whether FUTs could affect the expression of MUC2 is still unclear. To eliminate this doubt, we knocked down the expression of FUT1 in colon cancer cell lines LS174T and verified the effect of knockdown using RT-qPCR and Western blot (Figure 6A and B). The RT-qPCR, Western blot, and ELISA results showed that the expression of MUC2 was significantly increased after FUT1 was knocked down (Figure 6A–C). According to the results in Figure 4E and F. nucleatum may increase the FUT1 expression by reducing the expression of 14 miRNAs. Among the 14 miRNAs, mir-939-3p is down-expressed in COAD, and patients with a low expression of mir-939-3p tend to have a worse prognosis (Figure 6D and E). We transfected colon cancer cell lines LS174T with siRNA and found that the expression of FUT1 in the mir-939-3p mimics group was significantly lower than that in the control and mir-939-3p NC group (Figure 6F and I), while an increase in MUC2 expression was observed (Figure 6G–I). Furthermore, the expression of FUT1 in mir-939-3p inhibitions group was significantly higher than that in the control and mir-393-3p inhibitors NC group (Figure 6F and 6I), while the expression of MUC2 was decreased (Figure 6G–I). Luciferase reporter assays showed that mir-939-3p binds directly to FUT1. The fluorescence activity was significantly decreased in the WT group compared with the Mut group (Figure 6J). Rescue experiments show that mir-939-3p up-regulates MUC2 by inhibiting the expression of FUT1 (Figure 6K). These results indicate that in the presence of F. nucleatum, the expression of some TFs and miRNAs changes, leading to an increase in the expression of some FUTs, which in turn promotes the development of colon cancer.Taken together, these results suggest that the expression of FUT1 may be regulated by F. nucleatum in COAD, and may act as an intermediary molecule for F. nucleatum to promote COAD progression.
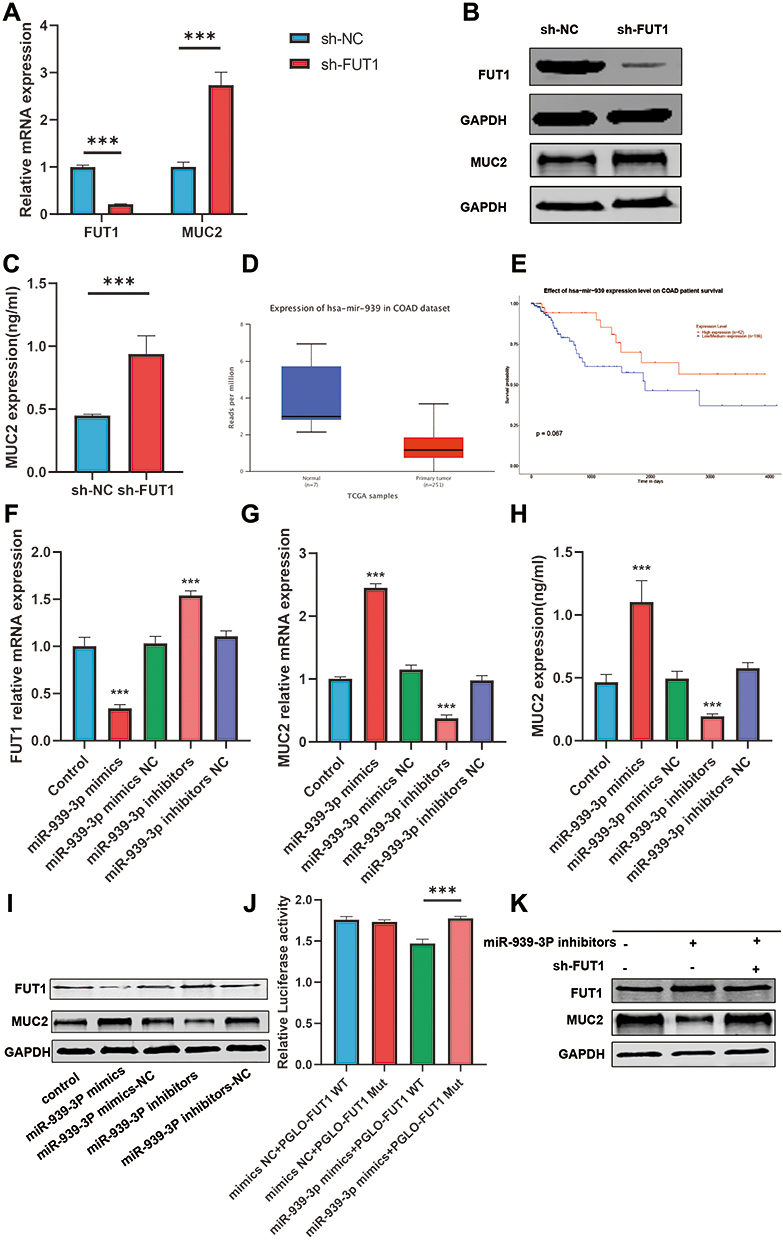 |
Figure 6 The influence of hsa-mir-939-3p on FUT1 and MUC2. (A) Differential expression of MUC2 and FUT1 between FUT1 knockdown group and control group by RT-qPCR. (B) Differential expression of MUC2 and FUT1 between FUT1 knockdown group and control group by Western blot. (C) Differential expression of MUC2 between FUT1 knockdown group and control group by ELISA. (D) Differential expression of hsa-mir-939 in COAD and normal colon tissues. (E) The relationship between hsa-mir-939 and OS in patients with COAD. (F) The effect of hsa-mir-939-3p on FUT1 expression by RT-qPCR. (G and H) The effect of hsa-mir-939-3p on MUC2 expression by RT-qPCR (G) and ELISA (H). (I) The effect of hsa-mir-939-3p on FUT1 and MUC2 expression by Western blot. (J) Luciferase reporter assays between mir-939-3p and FUT1. (K) hsa-mir-939-3p increases the expression of MUC2 by reducing FUT1 expression. (***P<0.001, ns: P>0.05). |
Correlation Between Immune Signatures and FUT Expression
Immune infiltration is closely associated with tumor prognosis, and proteins interacting with FUTs are also related to leukocyte migration. Thus, we analyzed the correlations between FUTs and tumor purity, B cells, CD8+ T cells, CD4+ T cells, macrophages, neutrophils, and dendritic cells using the Timer database (Figure 7). We found a positive correlation between FUTs and immune cells. Among the FUTs, FUT8, FUT10, and FUT11 were positively correlated with B cells, CD8+ T cells, macrophages, and neutrophils, and FUT11 was also positively correlated with CD4+ T cells (Figure 7). In addition, TIMER performed a Cox regression analysis of thirteen FUTs and six immune cells. FUT1 and POFUT2 were found to be independent prognostic factors of patients with COAD (Table 3). These results suggest that the expression of FUTs is associated with the tumor microenvironment of COAD.
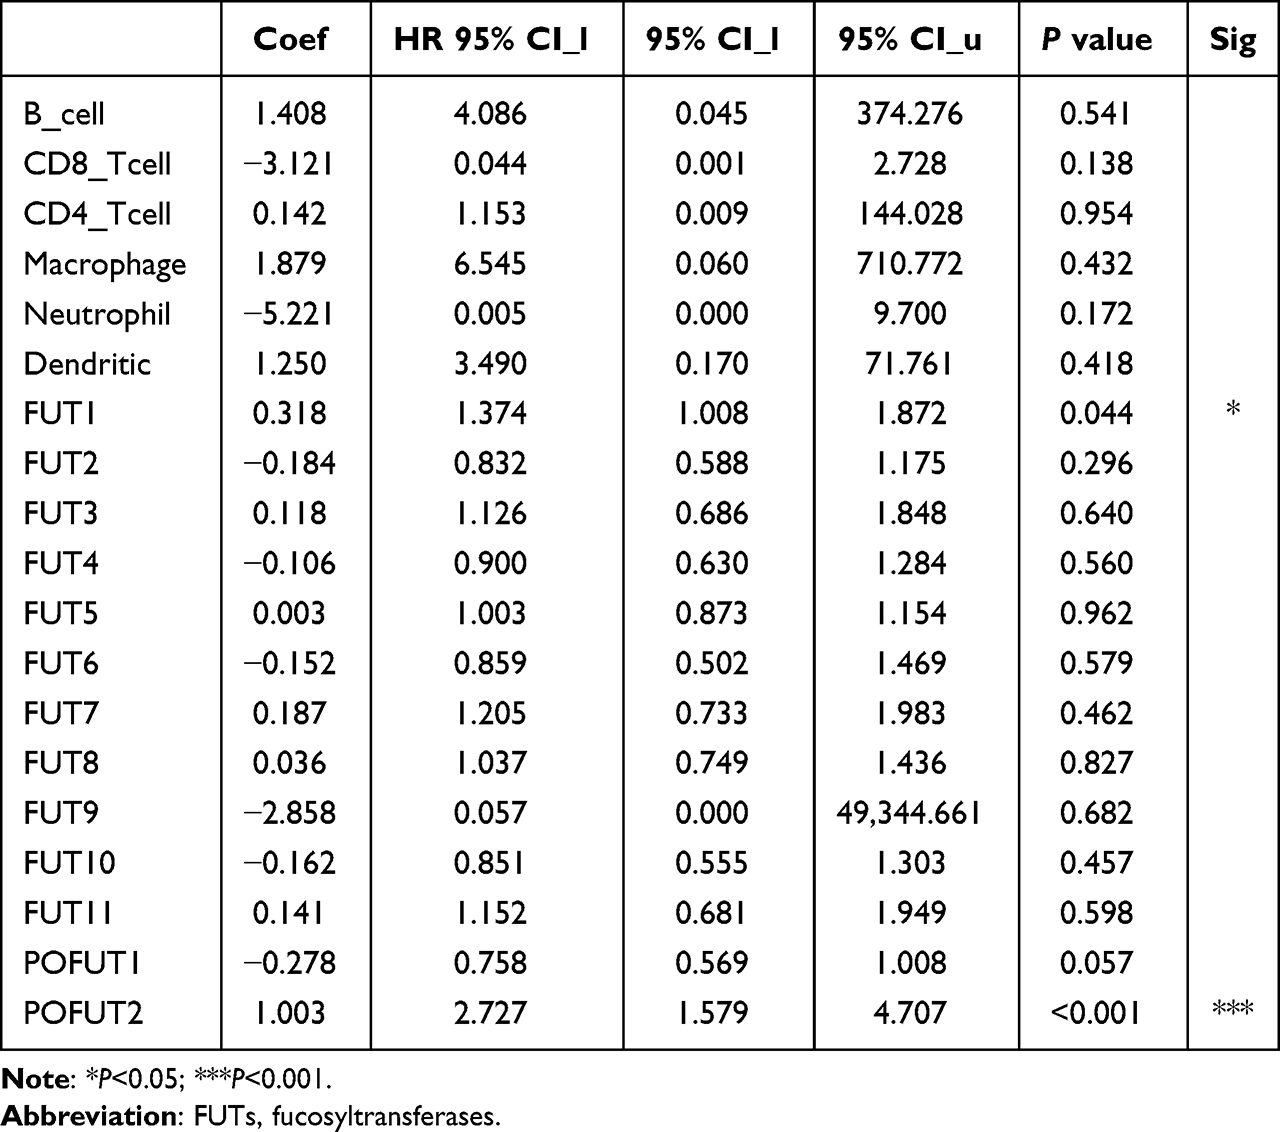 |
Table 3 Cox Regression Analysis of Thirteen FUTs and Six Immune Cells in COAD |
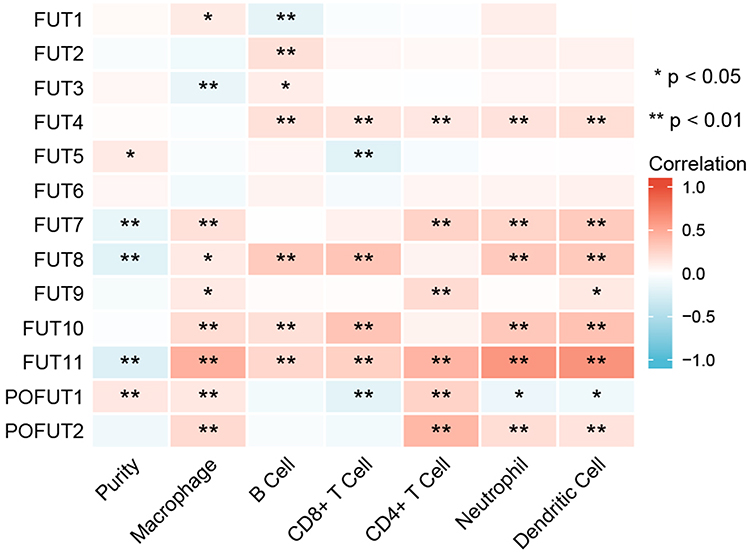 |
Figure 7 Correlation between immune infiltration and FUT expression in COAD by TIMER database. (*P<0.05, **P<0.01, ns: P>0.05). |
FUTs and Drug Treatment Sensitivity
In recent years, ICIs such as anti-PD-1 have been approved for the therapy of patients with COAD. However, some patients lack sensitivity to ICI treatment. Therefore, it is necessary to identify effective biomarkers to predict the sensitivity of ICIs. The TIDE algorithm can predict the response of patients to immunotherapy. Therefore, the TIDE algorithm was used to evaluate the relationship between FUTs and ICIs sensitivity in COAD patients. Compared with the corresponding low expression group, the FUT2, FUT3, FUT4, FUT5, FUT10 high-expression group had a higher proportion, but the FUT7, FUT11, FUT13 high-expression group had a lower proportion of patients who responded to ICIs (Supplementary Figure 4A, all P < 0.05).
We then explored the GSCALite database to investigate the association between FUT1, FUT12, FUT13 expression and the IC50 of chemotherapy drugs. Supplementary Figure 4B shows the correlation between FUT1, FUT12, FUT13 expression and IC50 of standard chemotherapy drugs. The high IC50 value is related to poor chemotherapy sensitivity. Taken together, our results suggest that the expression of FUTs is associated with the sensitivity to ICIs treatment in COAD patients. And we predicted potential chemotherapeutic drugs based on the expression of FUTs.
Discussion
Fucosylation is a posttranslational modification that is widely detected in cancer cells.38 As key enzymes of fucosylation, FUTs play a significant role in cancer.11,12,39 We explored the role of FUTs in COAD based on information from the TCGA Data Portal and GEO databases. The gene-expression profile of the TCGA database revealed that FUT1, FUT4, FUT7, FUT8, FUT10, FUT11, FUT12, FUT13 were highly expressed in COAD tissues compared with normal colon tissues, while FUT2, FUT3, FUT6, FUT9 were expressed at low levels. Similar results were observed by analyzing GSE39582 datasets from the GEO database. According to the ROC curve, we found that FUT1, FUT8, FUT9, FUT13 could serve as diagnostic biomarkers for COAD. Our experimental results further verified the differential expression of FUT1, FUT12, FUT13 at the transcription level and protein level. We also found that FUT2, FUT8, FUT10 expression in colon cancer tissues decreased as the cancer TNM stage increased, while FUT9 and POFUT2 expression increased. FUT1 and POFUT1 may be related to COAD progression, while FUT2 has the opposite effect (Figure 2B).
Survival analysis using GEPIA2 suggested that patients with a high expression of FUT1, FUT11, FUT13 had worse overall survival, while patients with a high expression of FUT2, FUT3, FUT6 had a favorable prognosis. A previous study suggested that a high expression of FUT3, FUT6, FUT7 predicted poor prognosis, while a high expression of FUT4 showed good prognosis in AML.39 However, the prognostic values of FUTs in patients with COAD have not been reported. Our study was the first to show the prognostic value of FUTs in patients with COAD. Moreover, Cox regression analysis of thirteen FUTs and six immune cells showed that FUT1 and POFUT2 could be used as independent predictors of COAD prognosis.
We attempted to determine the reasons for the differential expression of FUTs between normal and colon cancer tissues. DNA methylation plays an essential role in the occurrence and development of tumors.40 Hypermethylation is associated with gene silencing, while hypomethylation is linked to gene activation.41,42 Thus, we searched for probes that negatively correlate with expression in the promoter region of FUTs. CNV also has an important influence on gene expression. Our results found that the amplification of POFUT1 is most common in COAD patients, and its expression is significantly positively correlated with CNV (Cor=0.85, P < 0.001). Therefore, the high expression of POFUT1 in COAD may be related to its amplification.
In addition to being related to Fucosylation, FUTs and their interacting proteins were mainly enriched in metabolism-related biological processes, which are closely related to the occurrence and development of colon cancer (Figure 3C and 3D). Chondroitin sulfate, a product of the glycosaminoglycan biosynthesis - keratan sulfate pathway, promotes specific tumor growth and leads to drug resistance.43 Important role of PAPSS2-mediated sulfation in colitis and colon carcinogenesis.44 Intestinal sulfation may be a potential diagnostic marker, and PAPSS2 may serve as a potential therapeutic target in inflammatory bowel disease and colon cancer.44 Notch signaling pathway acts indirectly on the MAPK pathway, inhibiting Notch signaling will promote the proliferation of colon tumor cells with high MAPK activity.45 Fucoidan in L-fucose catabolic can be used as adjuvant therapy for patients with metastatic colon cancer, which can help patients relieve side effects and control disease progression.46
F. nucleatum is an oral bacterium that can facilitate the occurrence, development, metastasis, and drug resistance of COAD.14,34,47,48 Our analysis results showed that F. nucleatum is related to COAD. In this study, we explored the expression of FUTs under the action of F. nucleatum. Increased FUT1, FUT3, FUT6, FUT12, FUT13 was observed in the HT-29 colon carcinoma cell line cocultured with F. nucleatum. Notably, FUT3 and FUT6, which were expressed at low levels in COAD compared to normal tissues, were highly overexpressed in HT-29 cells under the influence of F. nucleatum. This result indicated that various factors might tightly regulate the expression of FUT3 and FUT6 in COAD. We also found that the TFs and miRNAs that bind to the mRNA 3′ UTR of FUTs showed altered transcription levels, which suggested that F. nucleatum might regulate FUT expression by acting on specific TFs and miRNAs. Subsequently, our experimental results confirmed that F. nucleatum could promote the progress of COAD and regulate the expression of FUT1, FUT12, FUT13. Significantly, F. nucleatum may promote COAD through the miR-939-3p/FUT1/MUC2 axis (Figure 8). In our study, we found that FUTs are associated with immune cell infiltration in the tumor microenvironment. In fact, previous studies have reported the correlation between FUTs and the tumor microenvironment. Different FUTs appear to play different roles in different diseases. FUT7 was positively correlated with the level of immune cell infiltration (CD8+ T cells, CD4+ T cells, macrophages, neutrophils, and dendritic cells) and the expression of immune cell gene markers.49 FUT1 deficiency leads to immune dysregulation of ocular surface and corneal opacity, with upregulation of ocular surface inflammation and Th1 cell activation in ocular draining lymph nodes (DLNs).50 In clinical B-cell lymphomas, FUT7, which is responsible for producing sLeX, is highly expressed on NK cells, while sLeX-presenting CLA was positively correlated with the accumulation of NK cells in the tumor bed. In vitro fucosylation significantly enhanced the cytolytic activity of treated NK cells, as well as their infiltration into lymphoma-associated organs such as spleen and liver. Furthermore, fucosylated NK cells exhibit superior activity in inhibiting tumor growth by promoting the activation of CD8+ T cells.51 Core fucosylation was significantly increased in CD4+ T cells from SLE patients. Deletion of core fucosyltransferase (Fut8), the only enzyme catalyzing core fucosylation of N-glycans, significantly reduces CD4+ T cell activation and improves experimental autoimmune encephalomyelitis-induced synthesis sign.52 FUT4 may contribute to poorer survival through PD-1-associated immunosuppression and EGFR-mediated proliferation in lung adenocarcinoma patients.53 Our study found that most FUTs except FUT1/2/3/5/6 are positively correlated with immune cell infiltration in the tumor microenvironment of colon cancer, which seems to provide some guidance for future research on the relationship between FUTs and colon cancer.
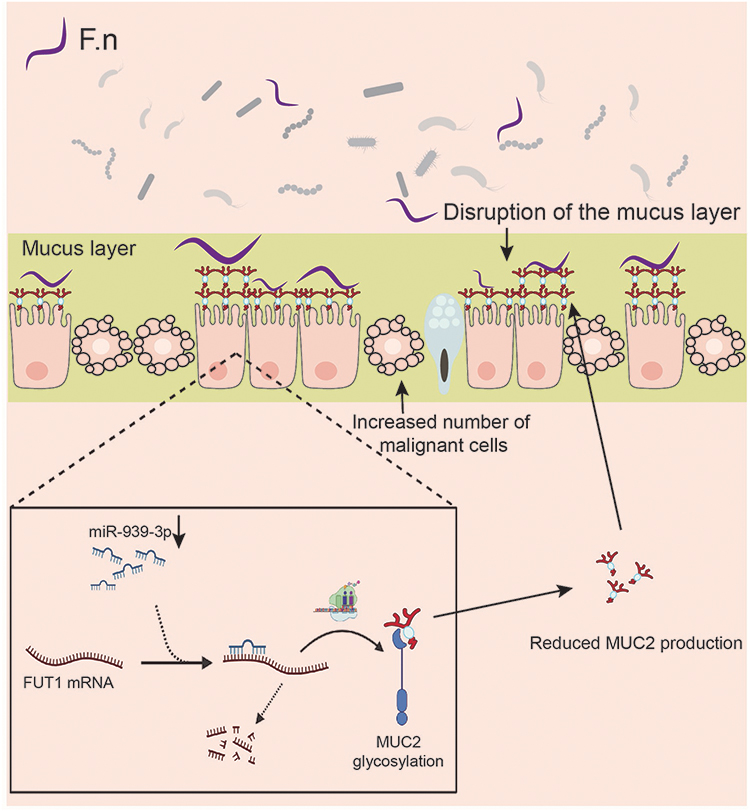 |
Figure 8 Schematic of F. nucleatum promote COAD through the miR-939-3p/FUT1/MUC2 axis. |
In recent years, ICIs have played essential roles in treating cancers.54 However, few patients are sensitive to ICB therapy.55,56 In this study, we further investigated the relationship between the expression of FUTs and the treatment sensitivity of ICIs. COAD patients with a high expression of FUT2, FUT3, FUT4, FUT5, FUT10 are more sensitive to ICIs, while those with a high expression of FUT7, FUT11, FUT13 are less sensitive to ICIs. This indicates that some FUTs can be used as indicators to predict the sensitivity of COAD patients to ICI treatment.
Conclusion
Our study suggested that FUTs were differentially expressed between COAD and normal colon tissues, and some of the FUTs had diagnostic potential in COAD. FUT expression was associated with specific clinicopathological characteristics. FUT1 and POFUT2 were independent prognostic biomarkers for OS in COAD patients. F. nucleatum can regulate the expression of some FUTs and may promote the COAD progression through FUTs.
Abbreviations
COAD, Colon Adenocarcinoma; FUTs, Fucosyltransferases; F. nucleatum, Fusobacterium nucleatum; OS, Overall Survival; DFS, Disease-free Survival; CNV, Copy Number Variation; TIDE, Tumor Immune Dysfunction and Exclusion; CAC, Colitis-associated Cancer; DAI, Disease Activity Index; RT-qPCR, Real Time Quantitative PCR; IHC, Immunohistochemistry; ICIs, Immune Checkpoint Inhibitors.
Data Sharing Statement
The databases mentioned in the study are publicly and freely available. URL details are mentioned in the Methods section.
Ethics Approval and Consent to Participate
The study was conducted according to the guidelines of 566584 the Declaration of Helsinki, and approved by the First Affiliated Hospital of Harbin Medical567585University Review Board (protocol code 2021008 and date: 2021-1-30).
Acknowledgments
This study was supported by the National Natural Science Foundation of China (No. 82170654), the Supporting Project for Outstanding Young Medical Talents of the First Affiliated Hospital of Harbin Medical University (No. HYD2020JQ0011), the Heilongjiang Province General Undergraduate Colleges and Universities Young Innovative Talents Training Plan (No. UNPYSCT-2018073), and supported by the Open Fund of Key Laboratory of Hepatosplenic Surgery, Ministry of Education, Harbin, China (GPKF202202).
Disclosure
The authors report no conflicts of interest in this work.
References
1. Cheng L, Luo S, Jin C, Ma H, Zhou H, Jia L. FUT family mediates the multidrug resistance of human hepatocellular carcinoma via the PI3K/Akt signaling pathway. Cell Death Dis. 2013;4(11):e923. doi:10.1038/cddis.2013.450
2. Arnold M, Sierra MS, Laversanne M, Soerjomataram I, Jemal A, Bray F. Global patterns and trends in colorectal cancer incidence and mortality. Gut. 2017;66(4):683–691. doi:10.1136/gutjnl-2015-310912
3. Davila RE, Rajan E, Baron TH, et al. ASGE guideline: colorectal cancer screening and surveillance. Gastrointest Endosc. 2006;63(4):546–557. doi:10.1016/j.gie.2006.02.002
4. Schneider M, Al-Shareffi E, Haltiwanger RS. Biological functions of fucose in mammals. Glycobiology. 2017;27(7):601–618. doi:10.1093/glycob/cwx034
5. Liang L, Gao C, Li Y, et al. miR-125a-3p/FUT5-FUT6 axis mediates colorectal cancer cell proliferation, migration, invasion and pathological angiogenesis via PI3K-Akt pathway. Cell Death Dis. 2017;8(8):e2968. doi:10.1136/gutjnl-2020-321187
6. Agrawal P, Fontanals-Cirera B, Sokolova E, et al. A systems biology approach identifies FUT8 as a driver of melanoma metastasis. Cancer Cell. 2017;31(6):804–819.e7. doi:10.1016/j.ccell.2017.05.007
7. Zhang X, Chen F, Petrella A, et al. A high-throughput glycosyltransferase inhibition assay for identifying molecules targeting fucosylation in cancer cell-surface modification. ACS Chem Biol. 2019;14(4):715–724. doi:10.1021/acschembio.8b01123
8. Saku A, Hirose K, Ito T, et al. Fucosyltransferase 2 induces lung epithelial fucosylation and exacerbates house dust mite-induced airway inflammation. J Allergy Clin Immunol. 2019;144(3):698–709.e9. doi:10.1016/j.jaci.2019.05.010
9. Holdener BC, Haltiwanger RS. Protein O-fucosylation: structure and function. Curr Opin Struct Biol. 2019;56:78–86. doi:10.1016/j.sbi.2018.12.005
10. Ma B, Simala-Grant JL, Taylor DE. Fucosylation in prokaryotes and eukaryotes. Glycobiology. 2006;16(12):158R–184R. doi:10.1093/glycob/cwl040
11. Li N, Liu Y, Miao Y, Zhao L, Zhou H, Jia L. MicroRNA-106b targets FUT6 to promote cell migration, invasion, and proliferation in human breast cancer. IUBMB Life. 2016;68(9):764–775. doi:10.1002/iub.1541
12. Ciołczyk-Wierzbicka D, Bodzioch M, Gil D, Zmudzińska D, Dembińska-Kieć A, Laidler P. Expression of fucosyltransferases contributes to melanoma invasive phenotype. Med Chem. 2007;3(5):418–424. doi:10.2174/157340607781745401
13. Hirakawa M, Takimoto R, Tamura F, et al. Fucosylated TGF-β receptors transduces a signal for epithelial-mesenchymal transition in colorectal cancer cells. Br J Cancer. 2014;110(1):156–163. doi:10.1038/bjc.2013.699
14. Yang Y, Weng W, Peng J, et al. Fusobacterium nucleatum increases proliferation of colorectal cancer cells and tumor development in mice by activating toll-like receptor 4 signaling to nuclear factor-κB, and up-regulating expression of MicroRNA-21. Gastroenterology. 2017;152(4):851–866.e24. doi:10.1053/j.gastro.2016.11.018
15. Yu T, Guo F, Yu Y, et al. Fusobacterium nucleatum promotes chemoresistance to colorectal cancer by modulating autophagy. Cell. 2017;170(3):548–563.e16. doi:10.1016/j.cell.2017.07.008
16. Xu J, Bjursell MK, Himrod J, et al. A genomic view of the human-Bacteroides thetaiotaomicron symbiosis. Science. 2003;299(5615):2074–2076. doi:10.1126/science.1080029
17. Kashyap PC, Marcobal A, Ursell LK, et al. Genetically dictated change in host mucus carbohydrate landscape exerts a diet-dependent effect on the gut microbiota. Proc Natl Acad Sci USA. 2013;110(42):17059–17064. doi:10.1073/pnas.1306070110
18. Hu D, Zhang D, Zheng S, Guo M, Lin X, Jiang Y. Association of ulcerative colitis with FUT2 and FUT3 polymorphisms in patients from Southeast China. PLoS One. 2016;11(1):e0146557. doi:10.1371/journal.pone.0146557
19. Pelaseyed T, Bergström JH, Gustafsson JK, et al. The mucus and mucins of the goblet cells and enterocytes provide the first defense line of the gastrointestinal tract and interact with the immune system. Immunol Rev. 2014;260(1):8–20. doi:10.1111/imr.12182
20. Pickard JM, Maurice CF, Kinnebrew MA, et al. Rapid fucosylation of intestinal epithelium sustains host-commensal symbiosis in sickness. Nature. 2014;514(7524):638–641. doi:10.1038/nature13823
21. Chandrashekar DS, Bashel B, Balasubramanya S, et al. UALCAN: a portal for facilitating tumor subgroup gene expression and survival analyses. Neoplasia. 2017;19(8):649–658. doi:10.1016/j.neo.2017.05.002
22. Bartha Á, Győrffy B. TNMplot.com: a web tool for the comparison of gene expression in normal, tumor and metastatic tissues. Int J Mol Sci. 2021;22(5):2622. doi:10.3390/ijms22052622
23. Li L, Jing Q, Yan S, et al. Amadis: a comprehensive database for association between microbiota and disease. Front Physiol. 2021;12:697059. doi:10.3389/fphys.2021.697059
24. Tang Z, Kang B, Li C, Chen T, Zhang Z. GEPIA2: an enhanced web server for large-scale expression profiling and interactive analysis. Nucleic Acids Res. 2019;47(W1):W556–W560. doi:10.1093/nar/gkz430
25. Liu CJ, Hu FF, Xia MX, Han L, Zhang Q, Guo AY. GSCALite: a web server for gene set cancer analysis. Bioinformatics. 2018;34(21):3771–3772. doi:10.1093/bioinformatics/bty411
26. Li T, Fan J, Wang B, et al. TIMER: a web server for comprehensive analysis of tumor-infiltrating immune cells. Cancer Res. 2017;77(21):e108–e110. doi:10.1158/0008-5472.CAN-17-0307
27. Koch A, De Meyer T, Jeschke J, Van Criekinge W. MEXPRESS: visualizing expression, DNA methylation and clinical TCGA data. BMC Genomics. 2015;16(1):636. doi:10.1186/s12864-015-1847-z
28. Koch A, Jeschke J, Van Criekinge W, van Engeland M, De Meyer T. MEXPRESS update 2019. Nucleic Acids Res. 2019;47(W1):W561–W565. doi:10.1093/nar/gkz445
29. Fang L, Li Y, Ma L, Xu Q, Tan F, Chen G. GRNdb: decoding the gene regulatory networks in diverse human and mouse conditions. Nucleic Acids Res. 2021;49(D1):D97–D103. doi:10.1093/nar/gkaa995
30. Sticht C, De La Torre C, Parveen A, Gretz N. miRWalk: an online resource for prediction of microRNA binding sites. PLoS One. 2018;13(10):e0206239. doi:10.1371/journal.pone.0206239
31. Yuan H, Yan M, Zhang G, et al. CancerSEA: a cancer single-cell state atlas. Nucleic Acids Res. 2019;47(D1):D900–D908. doi:10.1093/nar/gky939
32. Szklarczyk D, Morris JH, Cook H, et al. The STRING database in 2017: quality-controlled protein-protein association networks, made broadly accessible. Nucleic Acids Res. 2017;45(D1):D362–D368. doi:10.1093/nar/gkw937
33. Bu XD, Li N, Tian XQ, Huang PL. Caco-2 and LS174T cell lines provide different models for studying mucin expression in colon cancer. Tissue Cell. 2011;43(3):201–206. doi:10.1016/j.tice.2011.03.002
34. Hong J, Guo F, Lu SY, et al. F. nucleatum targets lncRNA ENO1-IT1 to promote glycolysis and oncogenesis in colorectal cancer. Gut. 2021;70(11):2123–2137. doi:10.1136/gutjnl-2020-322780
35. Linden SK, Sutton P, Karlsson NG, Korolik V, McGuckin MA. Mucins in the mucosal barrier to infection. Mucosal Immunol. 2008;1(3):183–197. doi:10.1038/mi.2008.5
36. van Putten J, Strijbis K. Transmembrane mucins: signaling receptors at the intersection of inflammation and cancer. J Innate Immun. 2017;9(3):281–299. doi:10.1159/000453594
37. Ganguly K, Rauth S, Marimuthu S, Kumar S, Batra SK. Unraveling mucin domains in cancer and metastasis: when protectors become predators. Cancer Metastasis Rev. 2020;39(3):647–659. doi:10.1007/s10555-020-09896-5
38. Tseng TH, Lin TW, Chen CY, et al. Substrate preference and interplay of Fucosyltransferase 8 and N-Acetylglucosaminyltransferases. J Am Chem Soc. 2017;139(28):9431–9434. doi:10.1021/jacs.7b03729
39. Dai Y, Cheng Z, Pang Y, et al. Prognostic value of the FUT family in acute myeloid leukemia. Cancer Gene Ther. 2020;27(1–2):70–80. doi:10.1038/s41417-019-0115-9
40. Ehrlich M. DNA methylation in cancer: too much, but also too little. Oncogene. 2002;21(35):5400–5413. doi:10.1038/sj.onc.1205651
41. Jones PA. Functions of DNA methylation: islands, start sites, gene bodies and beyond. Nat Rev Genet. 2012;13(7):484–492. doi:10.1038/nrg3230
42. Heyn H, Vidal E, Ferreira HJ, et al. Epigenomic analysis detects aberrant super-enhancer DNA methylation in human cancer. Genome Biol. 2016;17:11. doi:10.1186/s13059-016-0879-2
43. Lin R, Xia S, Shan C, et al. The dietary supplement chondroitin-4-sulfate exhibits oncogene-specific pro-tumor effects on BRAF V600E melanoma cells. Mol Cell. 2018;69(6):923–937.e8. doi:10.1016/j.molcel.2018.02.010
44. Xu P, Xi Y, Zhu J, et al. Intestinal sulfation is essential to protect against colitis and colonic carcinogenesis. Gastroenterology. 2021;161(1):271–286.e11. doi:10.1053/j.gastro.2021.03.048
45. Schmidt EM, Lamprecht S, Blaj C, et al. Targeting tumor cell plasticity by combined inhibition of NOTCH and MAPK signaling in colon cancer. J Exp Med. 2018;215(6):1693–1708. doi:10.1084/jem.20171455
46. Nagao T, Arai Y, Yamaoka M, et al. Identification and characterization of the fucoidanase gene from Luteolibacter algae H18. J Biosci Bioeng. 2018;126(5):567–572. doi:10.1016/j.jbiosc.2018.05.016
47. Guo S, Chen J, Chen F, Zeng Q, Liu W-L, Zhang G. Exosomes derived from Fusobacterium nucleatum-infected colorectal cancer cells facilitate tumour metastasis by selectively carrying miR-1246/92b-3p/27a-3p and CXCL16. Gut. 2020. doi:10.1136/gutjnl-2020-321187
48. Slade DJ. New roles for Fusobacterium nucleatum in cancer: target the bacteria, host, or both? Trends in Cancer. 2021;7(3):185–187. doi:10.1016/j.trecan.2020.11.006
49. Liu M, Zheng Q, Chen S, Liu J, Li S. FUT7 promotes the epithelial–mesenchymal transition and immune infiltration in bladder urothelial carcinoma. J Inflamm Res. 2021;139:1069–1084. doi:10.1021/jacs.7b03729
50. Kim KW, Ryu JS, Ko JH, et al. FUT1 deficiency elicits immune dysregulation and corneal opacity in steady state and under stress. Cell Death Dis. 2020;11(4):285. doi:10.1038/s41419-020-2489-x
51. Tong X, Ru Y, Fu J, et al. Fucosylation promotes cytolytic function and accumulation of NK cells in B CELL LYMPHoma. Front Immunol. 2022;13:904693. doi:10.3389/fimmu.2022.904693
52. Liang W, Mao S, Sun S, et al. Core fucosylation of the T cell receptor is required for T cell activation. Front Immunol. 2018;9:78. doi:10.3389/fimmu.2018.00078
53. Liu C, Li Z, Wang S, et al. FUT4 is involved in PD-1-related immunosuppression and leads to worse survival in patients with operable lung adenocarcinoma. J Cancer Res Clin Oncol. 2019;145(1):65–76. doi:10.1007/s00432-018-2761-y
54. Krishnamoorthy M, Lenehan JG, Maleki Vareki S. Neoadjuvant immunotherapy for high-risk, resectable malignancies: scientific rationale and clinical challenges. J Natl Cancer Inst. 2021;113(7):823–832. doi:10.1093/jnci/djaa216
55. Liu C, Liu R, Wang B, et al. Blocking IL-17A enhances tumor response to anti-PD-1 immunotherapy in microsatellite stable colorectal cancer. J Immunother Cancer. 2021;9:1. doi:10.1136/jitc-2020-001895
56. Ganesh K, Stadler ZK, Cercek A, et al. Immunotherapy in colorectal cancer: rationale, challenges and potential. Nat Rev Gastroenterol Hepatol. 2019;16(6):361–375. doi:10.1038/s41575-019-0126-x
 © 2023 The Author(s). This work is published and licensed by Dove Medical Press Limited. The
full terms of this license are available at https://www.dovepress.com/terms
and incorporate the Creative Commons Attribution
- Non Commercial (unported, 3.0) License.
By accessing the work you hereby accept the Terms. Non-commercial uses of the work are permitted
without any further permission from Dove Medical Press Limited, provided the work is properly
attributed. For permission for commercial use of this work, please see paragraphs 4.2 and 5 of our Terms.
© 2023 The Author(s). This work is published and licensed by Dove Medical Press Limited. The
full terms of this license are available at https://www.dovepress.com/terms
and incorporate the Creative Commons Attribution
- Non Commercial (unported, 3.0) License.
By accessing the work you hereby accept the Terms. Non-commercial uses of the work are permitted
without any further permission from Dove Medical Press Limited, provided the work is properly
attributed. For permission for commercial use of this work, please see paragraphs 4.2 and 5 of our Terms.