Back to Journals » Diabetes, Metabolic Syndrome and Obesity » Volume 16
Fructosamine is Not a Reliable Test for the Detection of Hyperglycemia: Insight from the Africans in America Study
Authors Gatete JDD ![]() , Worthy CC, Jagannathan R
, Worthy CC, Jagannathan R ![]() , DuBose CW, Sacks DB, Sumner AE
, DuBose CW, Sacks DB, Sumner AE
Received 17 June 2023
Accepted for publication 24 August 2023
Published 5 September 2023 Volume 2023:16 Pages 2689—2693
DOI https://doi.org/10.2147/DMSO.S426406
Checked for plagiarism Yes
Review by Single anonymous peer review
Peer reviewer comments 2
Editor who approved publication: Professor Gian Paolo Fadini
Jean de Dieu Gatete,1,2,* Charlita C Worthy,1,* Ram Jagannathan,3 Christopher W DuBose,1 David B Sacks,4 Anne E Sumner1,5,6
1Section on Ethnicity and Health, Diabetes, Endocrinology, and Obesity Branch, National Institute of Diabetes, Digestive and Kidney Diseases, National Institutes of Health, Bethesda, MD, USA; 2Institute of Global Health Equity, University of Global Health Equity, Kigali, Rwanda; 3Emory Global Diabetes Research Center of Woodruff Health Sciences Center and Emory University, Rollins School of Public Health of Emory University, Atlanta, GA, USA; 4Clinical Center, National Institutes of Health, Bethesda, MD, USA; 5Hypertension in Africa Research Team, North-West University, Potchefstroom, North-West, South Africa; 6National Institute of Minority Health and Health Disparities, Bethesda, MD, USA
*These authors contributed equally to this work
Correspondence: Anne E Sumner, National Institutes of Health, Bld 10-CRC, Rm 6-5940, MSC 1612, Bethesda, MD, 20892-1612, USA, Tel +1-301-402-4240, Email [email protected]
Objective: To improve detection of abnormal glucose tolerance (Abnl-GT), attention has moved beyond the oral glucose tolerance test (OGTT), to non-fasting markers of glycemia, specifically, HbA1c, fructosamine (FA) and glycated albumin (GA). Emerging data suggest that in African descent populations, the combination of HbA1c and GA is superior to the combination of HbA1c and FA. However, the diagnosis of Abnl-GT is usually based on tests which are performed only once. As reproducibility of Abnl-GT diagnosis by HbA1c, fructosamine (FA) and glycated albumin (GA) is unknown, reproducibility of Abnl-GT diagnosis by HbA1c, FA and GA were assessed in 209 African-born Blacks living in America.
Methods: At Visits 1 and 2 (9 ± 4 days apart), samples were obtained for HbA1c, FA and GA levels. Glucose tolerance status was determined at Visit 1 by OGTT. Reproducibility was based on the К-statistic and paired t-tests. Thresholds for the diagnosis of Abnl-GT by FA and GA which corresponded to an HbA1c of 5.7% were 235umol/L and 14.6%, respectively.
Results: Abnl-GT occurred in 38% (80/209). Diagnostic reproducibility was excellent for HbA1c (К≥ 0.86) and GA (К≥ 0.89), but only moderate for FA (К=0.59). Neither HbA1c nor GA levels varied between visits (both P≥ 0.3). In contrast, FA was significantly lower at Visit 2 than Visit 1(P< 0.01).
Conclusion: As HbA1c and GA provided similar diagnostic results on different days and FA did not, HbA1C and GA are superior to FA in both clinical care settings and epidemiologic studies.
Plain Language Summary: Beyond the monitoring of blood glucose levels, HbA1c is now used to diagnose hyperglycemia, but fructosamine and glycated albumin are being evaluated as alternatives when red blood cell factors cause inaccurate HbA1c results.
Studies suggest glycated albumin may be a better diagnostic test than fructosamine, but these investigations were poorly designed as conclusions were based on studies done once on a single day.
Therefore, in our study, each participant was studied twice with samples drawn one to two weeks apart. We found that the reproducibility of the diagnosis of hyperglycemia made by glycated albumin was excellent but only moderate for fructosamine. This could explain why glycated albumin may be superior to fructosamine in both the care of patients and the design of large population studies.
Keywords: sensitivity, kappa-statistic, average glycemia, non-fasting glycemic markers
Introduction
To move beyond the time-consuming, logistically challenging and expensive oral glucose tolerance test (OGTT), attention has turned to the diagnostic value of non-fasting markers of glycemia to detect (Abnl-GT), specifically, hemoglobin A1c (HbA1c), fructosamine (FA) and glycated albumin (GA).1–5 Emerging data in African descent populations, especially African-born Blacks as they have even higher rates of hemoglobinopathies and glucose-6-phosphate deficiency than African Americans, if HbA1c values are compromised, GA may be a superior alternative to FA.1,5–7 However, studies of the value of non-fasting markers of glycemia are flawed by the need to base conclusions on the diagnostic values of these markers from a single visit.1,2,5,7,8 In short, studies to date focus on sensitivity from a single test and not reproducibility. However, data on the diagnostic reproducibility of both FA and GA could assist in test selection in both the clinical care setting and the design of epidemiologic studies.
HbA1c has been used since 1979 to monitor the adequacy of glycemic control in people with diabetes.9 However, with improvements in the standardization of HbA1c assays, it was decided in 2010 that HbA1c, measured by a NGSP-certified method, could also be used to diagnose abnormal glucose tolerance (Abnl-GT), a summary term for diabetes and prediabetes.10
As known for decades, HbA1c is formed by the nonenzymatic attachment of glucose to the N-terminal valine of the beta-chain of hemoglobin.11 However, HbA1c results may underdiagnose hyperglycemia in the presence of anemia, certain hemoglobinopathies, glucose-6-phosphate dehydrogenase (G6PD) deficiency, nutritional deficiencies such as folate and B12, and altered red blood cell (RBC) lifespan.11 If underdiagnosis of hyperglycemia occurs, detection of diabetes may occur after irreversible but preventable complications have already occurred. To offset these limitations, attention has turned to non-fasting RBC-independent measures of glycemia, specifically FA and GA.11
Both FA and GA are extracellular plasma proteins produced by nonenzymatic glycation. As FA and GA concentrations are independent of red blood cells, they may be appropriate for use diagnostically when HbA1c values are compromised.6 However, FA and GA are not interchangeable. FA is a measure of all glycated proteins in plasma, whereas GA is a subfraction of FA.6 As stated previously, evidence is accumulating which suggests that in the detection of hyperglycemia, GA is a better diagnostic test than FA.1,5–7 Yet, studies of all three non-fasting markers of glycemia, namely HbA1c, FA and GA, are limited by the need to make conclusions based on a single determination of HbA1c, FA and GA.2–5,12 Therefore, this study was designed to specifically address the data gap on diagnostic reproducibility of HbA1c, FA and GA. Working with African-born Blacks enrolled in the Africans in America cohort, we prospectively asked: what is the reproducibility of the diagnosis of Abnl-GT by HbA1c, FA and GA when visits are conducted approximately 1 week apart?
Methods
The 209 African-born Black participants had consecutively enrolled in the Africans in America cohort and were currently living in the metropolitan Washington, DC area (age: 39 ± 11 (mean ± SD), range 20 to 65y, male: 62% (130/209), BMI: 27.9 ± 4.8, range 19.3 to 41.6 kg/m2). The Africans in America study examine the physiologic and social determinants of cardiometabolic disease in African descent populations.13–18 To enroll, the participants must self-identify as healthy and the absence of anemia, liver and kidney dysfunction is confirmed with routine screening tests at Visit 1. Consistent with the Helsinki Accords, the protocol was approved by the NIH Institutional Review Board (ClinicalTrials.gov Identifier: NCT00001853). Informed consent was obtained prior to participant enrollment.
The study participants had two visits conducted 9 ± 4 days apart. An oral glucose tolerance test (OGTT) was performed at Visit 1. In addition, hemoglobin status (ie meaning presence of hemoglobinopathies such as sickle cell trait) and G6PD activity were measured. Abnl-GT was defined by glucose criteria.19 HbA1c, FA and GA were measured at both Visit 1 and Visit 2. The diagnostic threshold for HbA1c is ≥5.7%.19 In contrast, accepted thresholds for the diagnosis of Abnl-GT by FA and GA have not been established. As the HbA1c value of ≥5.7% is diagnostic of Abnl-GT and occurred at the upper quartile of the population distribution, we determined thresholds for FA and GA by using their cut-offs at the upper quartile of their population distribution, specifically 235 umol/L and 14.6%, respectively.2,8
HbA1c was assayed the same day it was drawn in whole blood by high performance liquid chromatography (HPLC) using a Bio-Rad D-10 (Bio-Rad, Hercules, USA). The method is NGSP-certified, and the coefficient of variation (CV) for HbA1c drawn on different days was 1.8%.
Plasma for FA and GA level determinations was obtained at both Visit 1 and 2, stored at −70°C and measured on a single day. FA was measured by colorimetric nitroblue tetrazolium assay and GA by an enzymatic assay (Asahi Kasei Pharma, Tokyo), both on a Cobas 6000 (Roche Diagnostics, Indianapolis).
The intra-assay CV was 2.9% for FA levels at 308 μmol/L and 2.6% for FA levels at 521 μmol/L. The intra-assay CV was 1.6% for GA levels of 15.6% and 1.8% for GA levels at 35.2%.
Kappa-statistic (К-statistic) was used to measure diagnostic reproducibility.20 Strength of agreement criteria by К-statistic was excellent: 0.81–1.0, substantial: 0.61–0.80, moderate: 0.41–0.60, fair: 0.21–0.40, slight: 0.0 to 0.20.20 Paired t-tests were also performed. Analyses were conducted with STATA17 (College Station, Texas).
Data were managed with Research Electronic Data Capture (REDCap).21
Results
Abnl-GT occurred in 38% (80/209) of participants. HbA1c, FA and GA concentrations are provided in Table 1. For HbA1c and GA, the diagnostic agreement between Visits 1 and 2 was excellent with К=0.86 and К=0.89, respectively. In contrast, the diagnostic agreement by FA drawn on different days was only moderate (К=0.59). In addition, by paired t-tests, neither HbA1c nor GA levels varied between visits (both P≥0.3) (Table 1). However, FA was significantly lower at Visit 2 than Visit 1 (P<0.01) (Table 1).
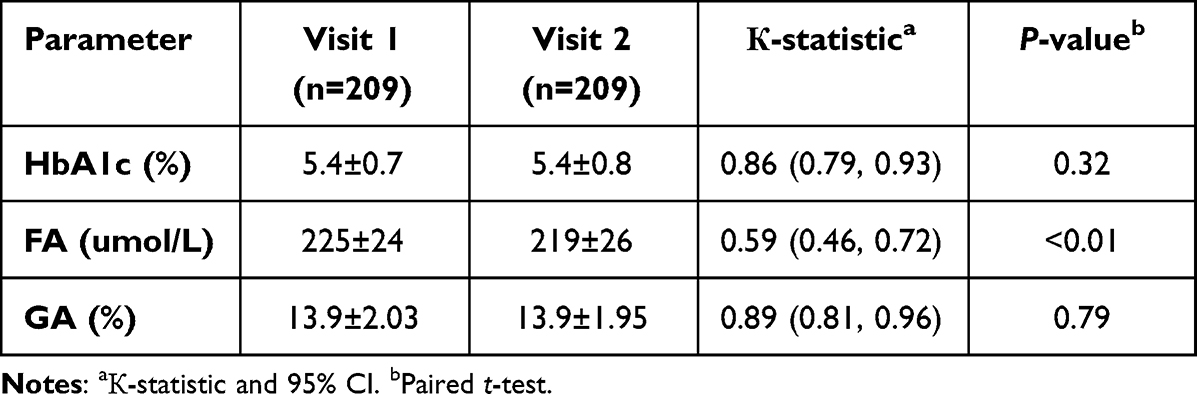 |
Table 1 Data on HbA1c, FA and GA |
Sickle cell and hemoglobin C traits occurred in 13% (28/209) and 2% (5/209) of participants, respectively. In the 164 consecutively enrolled participants who had G6PD activity measured, 10% (16/164) were G6PD deficient.
Discussion
This is the first investigation to move beyond looking at sensitivity and evaluate reproducibility of the diagnosis of Abnl-GT by HbA1c, FA and GA. The question was: if the diagnosis of Abnl-GT was made at Visit 1, would the diagnosis be made by the same test in one week’s time. In short, we found reproducibility of HbA1c, and GA were excellent but only moderate for FA. This could explain, in part, why GA has been reported to perform better as a diagnostic test than FA.1,5–7
As the intra-assay coefficients of variation for both FA and GA were low, differences in the diagnostic reproducibility of these two tests may be related to biological rather than analytic factors. We hypothesize that GA levels drawn one to two weeks apart may be more reproducible than FA, because FA includes all plasma proteins, whereas GA only includes albumin.
While this study addresses a data gap relative to reproducibility, it was not designed to study sensitivity. However, based on the reproducibility data provided, our study can help justify clinical and epidemiologic studies which test the sensitivity of HbA1c and GA and must for logistic reasons be based on a single determination.
We did not evaluate the ability of FA and GA to monitor average glycemia. However, we note with interest that GA has been reported to be superior to FA in monitoring average glycemia.22
A consistent challenge working with FA and GA as diagnostic tests is that there are no internationally accepted thresholds. Therefore, we followed the practice used with large cohorts, such as ARIC cohort and NHANES 1999–2004. As the threshold for HbA1c of 5.7% occurred at the upper quartile of our population distribution, we used the thresholds at the upper quartile for FA and GA. Interestingly, compared to FA of 241 umol/L reported in ARIC and GA of 14.4% reported in NHANES, our thresholds of 235 umol/L and 14.6% are remarkably similar.2,8
A strength of this study is that it was conducted in Africans, meaning a population in whom the issues of hemoglobinopathies and G6PD deficiency are highly relevant. While it is a limitation that the study is a convenience sample of African-born Blacks living in the United States, the prevalence of both hemoglobinopathies and G6PD deficiency was consistent with the frequency disorders that are known to occur.23–25
Conclusion
This analysis of Africans in America data has shown that FA is not a reliable test for the detection of hyperglycemia. The key finding is that both HbA1c and GA provided similar diagnostic results on different days, whereas FA did not. Therefore, in both the care of patients and the design of epidemiologic studies, HbA1c and GA may be superior to FA.
Data Sharing Statement
Deidentified participant data will be made available in Excel format upon reasonable request to the corresponding author, Anne E Sumner, MD.
Acknowledgments
JdDG, CCW and AES received supported from the intramural program of the National Institute of Minority Health and Health Disparities; JdDG received support from the Institute of Global Health Equity Research, University of Global Health Equity, Kigali, Rwanda, JdDG, CCW, CWD and AES received support from the intramural program of the National Institute of Diabetes and Digestive and Kidney Diseases; DBS received support from the Intramural Research Program of the Clinical Center, National Institutes of Health, Bethesda, Maryland, United States. Jean de Dieu Gatete and Charlita C. Worthy contributed equally and are co-first authors.
Funding
This NIH research was supported by intramural program of the Clinical Center and the intramural programs of the National Institute of Minority Health and Health Disparities and the National Institute of Diabetes and Digestive and Kidney Diseases.
Disclosure
All authors declare no conflict of interest. All authors state that the research was conducted in the absence of any commercial or financial relationships that could be construed as a potential conflict of interest.
References
1. Chan CL, Pyle L, Kelsey M, Newnes L, Zeitler PS, Nadeau KJ. Screening for type 2 diabetes and prediabetes in obese youth: evaluating alternate markers of glycemia - 1,5-anhydroglucitol, fructosamine, and glycated albumin. Pediatr Diabetes. 2016;17(3):206–211. doi:10.1111/pedi.12258
2. Fang M, Daya N, Coresh J, Christenson RH, Selvin E. Glycated Albumin for the Diagnosis of Diabetes in US Adults. Clin Chem. 2022;68(3):413–421. doi:10.1093/clinchem/hvab231
3. Kengne AP, Erasmus RT, Levitt NS, Matsha TE. Alternative indices of glucose homeostasis as biochemical diagnostic tests for abnormal glucose tolerance in an African setting. Prim Care Diabetes. 2017;11(2):119–131. doi:10.1016/j.pcd.2017.01.004
4. Kengne AP, Matsha TE, Sacks DB, Zemlin AE, Erasmus RT, Sumner AE. Combining HbA(1c) and glycated albumin improves detection of dysglycaemia in mixed-ancestry South Africans. EClinicalMedicine. 2022;48:101443. doi:10.1016/j.eclinm.2022.101443
5. Sumner AE, Duong MT, Aldana PC, et al. A1C Combined With Glycated Albumin Improves Detection of Prediabetes in Africans: the Africans in America Study. Diabetes Care. 2016;39(2):271–277. doi:10.2337/dc15-1699
6. Danese E, Montagnana M, Nouvenne A, Lippi G. Advantages and pitfalls of fructosamine and glycated albumin in the diagnosis and treatment of diabetes. J Diabetes Sci Technol. 2015;9(2):169–176. doi:10.1177/1932296814567227
7. Shima K, Abe F, Chikakiyo H, Ito N. The relative value of glycated albumin, hemoglobin A1c and fructosamine when screening for diabetes mellitus. Diabetes Res Clin Pract. 1989;7(4):243–250. doi:10.1016/0168-8227(89)90011-9
8. Selvin E, Rawlings AM, Grams M, et al. Fructosamine and glycated albumin for risk stratification and prediction of incident diabetes and microvascular complications: a prospective cohort analysis of the Atherosclerosis Risk in Communities (ARIC) study. Lancet Diabetes Endocrinology. 2014;2(4):4533–4588. doi:10.3390/ijerph17124533
9. National Diabetes Data Group. Classification and diagnosis of diabetes mellitus and other categories of glucose intolerance. National Diabetes Data Group. Diabetes. 1979;28(12):1039–1057. doi:10.2337/diab.28.12.1039
10. Hobabagabo AF, Osei-Tutu NH, Hormenu T, et al. Improved Detection of Abnormal Glucose Tolerance in Africans: the Value of Combining Hemoglobin A(1c) With Glycated Albumin. Diabetes Care. 2020;43(10):2607–2613. doi:10.2337/dc20-1119
11. Sacks DB. A1C versus glucose testing: a comparison. Diabetes Care. 2011;34(2):518–523. doi:10.2337/dc10-1546
12. Sewali B, Harcourt N, Everson-Rose SA, et al. Prevalence of cardiovascular risk factors across six African Immigrant Groups in Minnesota. BMC Public Health. 2015;15(1):411. doi:10.1186/s12889-015-1740-3
13. Briker SM, Aduwo JY, Mugeni R, et al. A1C Underperforms as a Diagnostic Test in Africans Even in the Absence of Nutritional Deficiencies, Anemia and Hemoglobinopathies: insight From the Africans in America Study. Front Endocrinol (Lausanne). 2019;10:533. doi:10.3389/fendo.2019.00533
14. Hormenu T, Shoup EM, Osei-Tutu NH, et al. Stress Measured by Allostatic Load Varies by Reason for Immigration, Age at Immigration, and Number of Children: the Africans in America Study. Int J Environ Res Public Health. 2020;17(12):4533. doi:10.3390/ijerph17124533
15. Ishimwe MCS, Wentzel A, Shoup EM, et al. Beta-cell failure rather than insulin resistance is the major cause of abnormal glucose tolerance in Africans: insight from the Africans in America study. BMJ Open Diabetes Res Care. 2021;9(1):e002447. doi:10.1136/bmjdrc-2021-002447
16. Jagannathan R, DuBose CW, Mabundo LS, et al. The OGTT is highly reproducible in Africans for the diagnosis of diabetes: implications for treatment and protocol design. Diabetes Res Clin Pract. 2020;170:108523. doi:10.1016/j.diabres.2020.108523
17. Waldman ZC, Schenk BR, Duhuze Karera MG, et al. Sleep and Economic Status Are Linked to Daily Life Stress in African-Born Blacks Living in America. Int J Environ Res Public Health. 2022;19(5):2562. doi:10.3390/ijerph19052562
18. Kabakambira JD, Baker Jr RL Jr, Briker SM, et al. Do current guidelines for waist circumference apply to black Africans? Prediction of insulin resistance by waist circumference among Africans living in America. BMJ Global Health. 2018;3(5):e001057. doi:10.1136/bmjgh-2018-001057
19. Magliano DJ, Boyko EJ. IDF Diabetes Atlas.
20. Khan KS, Chien PF. Evaluation of a clinical test. I: assessment of reliability. BJOG. 2001;108(6):562–567. doi:10.1111/j.1471-0528.2001.00150.x
21. Harris PA, Taylor R, Thielke R, Payne J, Gonzalez N, Conde JG. Research electronic data capture (REDCap)--A metadata-driven methodology and workflow process for providing translational research informatics support. J Biomed Informatics. 2009;42(2):377–381. doi:10.1016/j.jbi.2008.08.010
22. Desouza CV, Holcomb RG, Rosenstock J, et al. Results of a Study Comparing Glycated Albumin to Other Glycemic Indices. J Clin Endocrinol Metab. 2020;105(3):677–687. doi:10.1210/clinem/dgz087
23. Cappellini MD, Fiorelli G. Glucose-6-phosphate dehydrogenase deficiency. Lancet. 2008;371(9606):64–74. doi:10.1016/s0140-6736(08)60073-2
24. Piel FB, Howes RE, Patil AP, et al. The distribution of haemoglobin C and its prevalence in newborns in Africa. Sci Rep. 2013;3(1):1671. doi:10.1038/srep01671
25. Piel FB, Patil AP, Howes RE, et al. Global epidemiology of sickle haemoglobin in neonates: a contemporary geostatistical model-based map and population estimates. Lancet. 2013;381(9861):142–151. doi:10.1016/s0140-6736(12)61229-x
 © 2023 The Author(s). This work is published and licensed by Dove Medical Press Limited. The
full terms of this license are available at https://www.dovepress.com/terms
and incorporate the Creative Commons Attribution
- Non Commercial (unported, 3.0) License.
By accessing the work you hereby accept the Terms. Non-commercial uses of the work are permitted
without any further permission from Dove Medical Press Limited, provided the work is properly
attributed. For permission for commercial use of this work, please see paragraphs 4.2 and 5 of our Terms.
© 2023 The Author(s). This work is published and licensed by Dove Medical Press Limited. The
full terms of this license are available at https://www.dovepress.com/terms
and incorporate the Creative Commons Attribution
- Non Commercial (unported, 3.0) License.
By accessing the work you hereby accept the Terms. Non-commercial uses of the work are permitted
without any further permission from Dove Medical Press Limited, provided the work is properly
attributed. For permission for commercial use of this work, please see paragraphs 4.2 and 5 of our Terms.