Back to Journals » Nature and Science of Sleep » Volume 13
Frequency‑Specific Regional Homogeneity Alterations and Cognitive Function in Obstructive Sleep Apnea Before and After Short-Term Continuous Positive Airway Pressure Treatment
Authors Li H ![]() , Li L, Kong L, Li P, Zeng Y, Li K, Xie W, Shu Y, Liu X, Peng D
, Li L, Kong L, Li P, Zeng Y, Li K, Xie W, Shu Y, Liu X, Peng D
Received 22 October 2021
Accepted for publication 14 December 2021
Published 24 December 2021 Volume 2021:13 Pages 2221—2238
DOI https://doi.org/10.2147/NSS.S344842
Checked for plagiarism Yes
Review by Single anonymous peer review
Peer reviewer comments 3
Editor who approved publication: Prof. Dr. Ahmed BaHammam
Haijun Li,1,2 Lan Li,3 Linghong Kong,1 Panmei Li,1 Yaping Zeng,1 Kunyao Li,1 Wei Xie,1 Yongqiang Shu,1 Xiang Liu,1 Dechang Peng1,2
1Medical Imaging Center, The First Affiliated Hospital of Nanchang University, Nanchang City, Jiangxi Province, People’s Republic of China; 2PET Center, The First Affiliated Hospital of Nanchang University, Nanchang City, Jiangxi Province, People’s Republic of China; 3Jiangxi Provincial Institute of Parasitic Diseases Control, Nanchang City, Jiangxi Province, People’s Republic of China
Correspondence: Dechang Peng
The First Affiliated Hospital of Nanchang University, No. 17, Yongwai Zheng Street, Donghu District, Nanchang City, 330006, Jiangxi Province, People’s Republic of China
Tel +86 79186427560
Email [email protected]
Purpose: Previous studies have demonstrated abnormal local spontaneous brain activity in the conventional frequency bands (0.01– 0.08 Hz) in obstructive sleep apnea (OSA). However, it is not clear whether these abnormalities are associated with the specific frequency band of low-frequency oscillations or whether it can be improved with a continuous positive airway pressure (CPAP) treatment. This study aimed to investigate the regional homogeneity (ReHo) in specific frequency at baseline (pre-CPAP) and after one month of CPAP adherence treatment (post-CPAP) in OSA patients.
Methods: Twenty-one patients with moderate-to-severe OSA and 21 age- and sex-matched healthy controls (HCs) were included in the final analysis. ReHo was calculated in three different frequency bands (typical frequency band: 0.01– 0.1 Hz; slow-5 band: 0.01– 0.027 Hz; slow-4 band: 0.027– 0.073 Hz), respectively. A partial correlational analysis was performed to assess the relationship between altered ReHo and clinical evaluation.
Results: OSA patients revealed increased ReHo in the brainstem, bilateral inferior temporal gyrus (ITG)/fusiform, and right-cerebellum posterior lobe (CPL), and decreased ReHo in the bilateral inferior parietal lobule (IPL), right superior temporal gyrus (STG), and left precentral gyrus (PG) compared to HC groups in different frequency bands. Significantly changed ReHo in the bilateral middle temporal gyrus (MTG), PG, medial frontal gyrus (MFG), supplementary motor area (SMA), CPL, IPL, left superior frontal gyrus (SFG), ITG, MTG, and right STG were observed between post-CPAP and pre-CPAP OSA patients, which was associated with specific frequency bands. The altered ReHo in specific frequency bands was correlated with Montreal cognitive assessment score, Epworth sleepiness scale, and apnea hypopnea index in pre-CPAP OSA patients.
Conclusion: These findings indicate that OSA has frequency-related abnormalities of spontaneous neural activity before and after short-term CPAP treatment, which might contribute to a better understanding of local neural psychopathology and may serve as potential biomarkers for clinical CPAP treatment.
Keywords: obstructive sleep apnea, treatment, frequency band, local connectivity, resting-state functional magnetic resonance imaging
Introduction
Obstructive sleep apnea (OSA), characterized by repeated partial collapse and obstructions of the upper airway leading to intermittent hypoxia, hypercapnia, and sleep fragmentation, is one of the most common sleep disorders and affects at least 4% of middle-aged women and 6% of middle-aged men.1 The cognitive impairments, including memory, learning, attention, and executive function that may cause difficulties in work performance and increase the risk of industrial and vehicular accidents and reduce the quality of life, are recognized as clinical consequences of OSA.2 If OSA patients are not treated for cognitive impairment, they should be considered a moderate risk for Alzheimer’s disease.3 Progressive changes in sleep structure and quality, as well as changes in cerebral blood flow, neurovasculature and neurotransmitter, may lead to cognitive deficits in OSA patients.4 Previous studies found OSA-related brain alterations especially in brain regions responsible for cognitive and emotional functions, which are primarily thought to be caused by oxidative stress, ischemia- reperfusion injury, and an increase in sympathetic vasoconstriction associated with hypoxemia.5,6 However, the exact neural mechanisms of cognitive impairment in OSA patients are complex and unclear.
Continuous positive airway pressure (CPAP) is one of the most important treatments widely used for OSA. Numerous studies have shown that effective treatments not only alleviate daytime sleepiness and reduce nocturnal symptoms but also improve neurocognitive abnormalities.7,8 Although the effectiveness of CPAP therapy has been widely recognized, it does not completely reverse cognitive symptoms in all patients. Some studies have suggested that the varying degrees of neuronal damage caused by chronic intermittent hypoxia may be the reason for the different responses of OSA patients receiving the same CPAP therapy.9 Other studies suggest that the results may be related to selected neuropsychological tests, which vary in sensitivity to treatment effects.10 However, the underlying neural mechanisms of the CPAP therapy response are poorly understood.
Neuroimaging methods could explore changes in the brain caused by CPAP therapy and provide new insights into the cognitive response after CPAP therapy. There is growing evidence that OSA-related brain morphological changes can be ameliorated by CPAP therapy. Rosenzweig et al reported that the right thalamus showed hypertrophy with improved ESS and delayed memory scores after one month of CPAP therapy, which suggested that short-term CPAP therapy can lead to adaptive changes in neurocognitive structures associated with decreased sleepiness and improved memory in OSA patients.11 Another long-term CPAP treatment (18.2 ± 12.4 months) study found neocortical and cerebellar atrophy in untreated OSA patients and showed that increased brain volume largely overlapped with the initial atrophy. This study provides neuroimaging evidence of the positive effects of long-term CPAP therapy on OSA patients.12 A study found that the impairment of white matter (WM) integrity in multiple brain regions associated with cognitive impairment and mood in OSA patients was partially improved by 3 months of CPAP, whereas WM abnormalities were almost completely reversed in all affected areas after 12 months of CPAP therapy in OSA patients with good compliance, suggesting that the recovery of cognitive deficits after treatment is consistent with the presence of reversible structural nerve damage in OSA patients receiving CPAP treatment.13 Single-photon emission computed tomography (SPECT) found that complete reversal of regional cerebral blood flow (rCBF) decline was observed in the angular, medial orbitofrontal and cerebellum regions, and partial reversal of rCBF decline was observed in the prefrontal and limbic regions responsible for executive, affective, and memory function after more than 6 months of CPAP treatment.14 These studies indicated that partial brain volume and rCBF in OSA patients could be reversed after CPAP treatment. However, there are few studies on spontaneous brain activity related to CPAP therapy in OSA patients.
Compared to other resting-state fMRI methods, such as seed-based functional connectivity,15 independent component analysis16, and large-scale brain network analysis,17 regional homogeneity (ReHo), which measures the synchronization between a given voxel and its nearest neighbour and reflects the temporal homogeneity of the regional blood oxygen level-dependent (BOLD) signal, is an objective and noninvasive neuroimaging technology.18 Due to its multiscale characteristics in frequency, sensitivity, reproducibility and reliability, it is increasingly widely used in neuropsychiatric disorders.19 Some studies have detected low-frequency oscillation activities in the conventional frequency band (0.01–0.08 Hz) that are thought to reflect spontaneous neuronal activities. Our previous study found that OSA patients showed abnormal local spontaneous activity in multiple brain regions including the frontal lobe, precuneus and angular gyrus, superior parietal lobule, and cerebellum.20 However, Zuo et al showed that the low-frequency oscillation of BOLD signals is sensitive to specific frequency bands in different brain regions and divided into four subbands [slow-2 (0.198–0.25 Hz), slow-3 (0.073–0.198 Hz), slow-4 (0.027–0.073 Hz), and slow-5 (0.01–0.027 Hz)].21 Research has shown that the slow-3 and slow-2 bands mainly reflect the white matter signals and the high-frequency physiological noise, while the slow-4 and slow-5 bands mainly reflect the oscillating amplitude signal associated with gray matter. Several studies have investigated the effects of different bands of local spontaneous brain activity.22,23 However, it is unclear whether frequency-specific ReHo methods provide more information than conventional frequency bands or whether CPAP responses are frequency-specific in OSA patients.
Based on the above questions, we hypothesized that OSA patients had frequency-specific local spontaneous brain activity abnormalities, and those brain activity abnormalities could be partially reversed after CPAP treatment, which was related to cognitive function. To test this hypothesis, we first used the voxel-level ReHo method to explore local spontaneous brain activity changes in OSA patients before and after CPAP treatment (one-month follow-up) in different frequency bands. Then, the relationship between changed ReHo and clinical features was examined using partial correlation analysis in OSA patients.
Materials and Methods
Patients
This study is a short-term longitudinal study, and OSA patient recruitment is shown in Figure 1. Healthy controls (HC) were assessed only at baseline. The HC group was recruited through advertising from the community. All OSA patients were recruited from August 2020 to June 2021 from the sleep monitoring room at the otolaryngology department or respiratory department of the First Affiliated Hospital of Nanchang University. The diagnostic criteria for OSA were according to the American Academy of Sleep Medicine Clinical Practice Guideline for adult obstructive sleep apnea in 2017.24 The inclusion criteria for OSA include apnea–hypopnea index (AHI) >15, age 20–60 years, right-handedness, and received standard CPAP therapy for at least 1 month with compliance ≥4 h/night and at least 5 days a week. The exclusion criteria for all subjects were as follows: 1) sleep disorders other than OSA; 2) history of respiratory diseases, hypertension, diabetes, and previous CPAP treatment; 3) history of central nervous system disease, including neurodegenerative disease, epilepsy, brain tumours, and traumatic brain injury; 4) abuse of illicit drugs or current intake of psychoactive medications; 5) MRI contraindications, such as metallic implants in the body, and claustrophobia; 6) image artifacts; and 7) loss to follow-up. Finally, 21 OSA patients and 21 HCs were included in the analysis. We obey the principles of the Declaration of Helsinki. The approval for the study was provided by the Medical Ethics Committee of the First Affiliated Hospital of Nanchang University [No.2020(94)]. The participants signed written informed consent forms for this study.
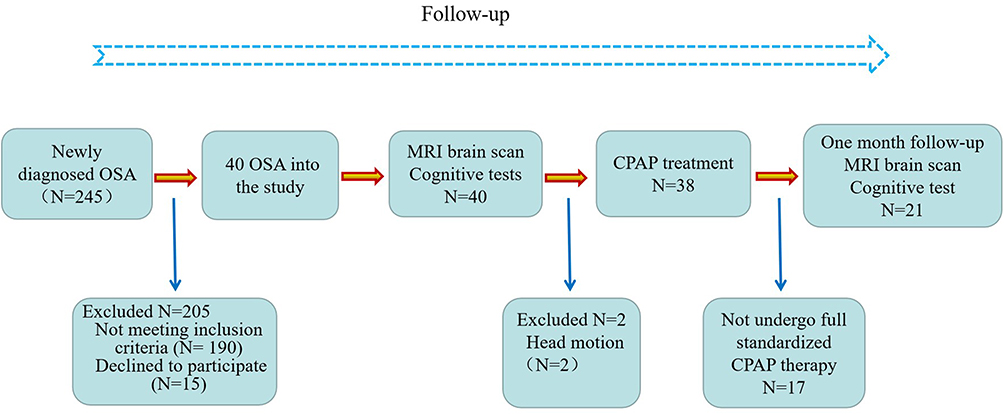 |
Figure 1 Schematic of recruiting procedures for the OSA patients in this study. |
Polysomnography
Before polysomnography (PSG) monitoring, all subjects were asked not to drink alcohol or coffee. All participants underwent overnight PSG (from 10 PM to 6 AM the next morning) using the Respironics LE-Series physiological monitoring system (Alice 5 LE, Respironics, Orlando, FL, USA) at baseline. The PSG monitoring included a standard electrocardiogram, electrooculogram, electromyogram, electrocardiogram, body position, oral and nasal airflow, thoracic and abdominal respiratory movements, snoring, and oxygen saturation (SaO2), and sleep latency, total sleep time, sleep efficiency, sleep stages, arousal, and respiratory events were recorded. See our previous study for details.15 According to the AASM manual, hypopnea was defined as a 30% or greater drop in airflow, lasting ≥10 seconds, accompanied by 4% or greater oxygen desaturation. Obstructive apnea was described as a continuous reduction in airflow ≥90% for ≥10 seconds along with evident respiratory effort. The AHI was defined as the sum of apnea and hypopnea events per hour during sleep.
Neuropsychological Assessment
All OSA patients completed the entire neuropsychological assessment at baseline and the one-month follow-up, including the Montreal Cognitive Assessment (MoCA), Epworth Sleepiness Scale (ESS), Pittsburgh Sleep Quality Index (PSQI), Hamilton Anxiety Scale (HAMA) and Hamilton Depression Scale (HAMD). The MoCA, including naming, visual space and executive function, attentional, language, delayed memory, abstraction, and orientation, was used to assess cognitive function. The MoCA total score is 30, with a score below 26 considered cognitive impairment, and one point is added as a correction if the years of education are less than 12.25 The ESS is a very simple questionnaire for the self-assessment of daytime sleepiness, including eight different conditions, each with a score of 0 to 3, and the total score ranges from 0 to 24. The PSQI was used to evaluate the sleep quality of the subjects in the last month. It consists of 19 self-assessment and 5 other-assessment items, and the total score ranges from 0 to 21. A higher score represented worse sleep quality. The HAMA and HAMD were used to assess anxiety and depression. In general, HAMA scores greater than 14 indicated clinically significant anxiety symptoms. A MAHD score <7 is normal, a score from 7 to 17 indicates possible depression, and a total score of 17 to 24 indicates definitely depressed, severe depression with an overall score >24.
Continuous Positive Airway Pressure (CPAP) Treatment
All OSA patients received standard CPAP therapy for at least 1 month with compliance ≥4 h/night and at least 5 days a week. They were all sent home using an auto-adjustment model of CPAP ventilator (YH-480, Yuwell, Jiangsu, China), which can detect breathing levels and automatically adjust the pressure needed. The treatment pressure of the ventilator was set at 4–20 cm H2O, and the treatment pressure needed was set automatically. Adherence at home was objectively reported by the built-in SIM card of the ventilator, which can upload user data in real time through wireless transmission function, including duration of use and AHI, mask leakage, blood oxygen, etc.
MRI Data Acquisition
All participants were acquired on a 3.0 Tesla MRI system with an 8-channel phased-array head coil (Siemens, Munich, Germany) between 7 p.m. and 9 p.m. They were sleeping at a normal time the night before the Scan. First, conventional axial T2-weighted imaging (repetition time (TR) = 4000 ms, echo time (TE) = 113 ms, thickness = 5 mm, gap = 1.5 mm, FOV = 220 mm × 220 mm, slices = 19) and axial T1-weighted imaging (TR = 250 ms, TE = 2.46 ms, thickness = 5 mm, gap = 1.5 mm, field-of-view (FOV) = 220 mm × 220 mm, slices = 19) were performed. High-resolution three-dimensional T1-weighted images were obtained by using a brain volume sequence (TR = 1900 ms, TE = 2.26 ms, thickness = 1.0 mm, gap = 0.5 mm, FOV = 250 mm × 250 mm, matrix = 256 × 256, flip angle = 9°, 176 sagittal slices). Finally, rs-fMRI data were collected using an echo-planar imaging sequence with the following parameters: TR = 2000 ms, TE = 30 ms, flip angle = 90°, FOV = 230 mm × 230 mm, matrix = 64, thickness = 4 mm, gap = 1.2 mm. Each brain volume consisted of 30 axial sections, and each functional run comprised 240 volumes. During MRI scans, all subjects were asked to close their eyes, stay as still as possible, not to think about anything, and not to fall asleep. Foam pads and earplugs were used to reduce patient head movement and scanner noise. Two senior radiologists read the images to exclude gross lesions and motion artifacts.
fMRI Data Preprocessing
Based on MATLAB2018b (MathWorks, Natick, MA, USA), Statistical Parametric Mapping (SPM12, https://www.fil.ion.ucl.ac.uk/spm/software/spm12/) and Data Processing & Analysis for Brain Imaging (DPABI, http://rfmri.org/dpabi) software were used for image preprocessing. Image preprocessing mainly includes the following steps: remove the first 10 time points; slice-time corrected and three-dimensional head motion corrected; T1 segmentation with the Diffeomorphic Anatomical Registration Through Exponentiated Lie algebra (DARTEL) and spatial normalization to register rs-fMRI datasets to the Montreal Neurological Institute spatially normalized and resampled to 3 mm × 3 mm × 3 mm voxels; regression of white matter, cerebrospinal fluid, whole-brain signal, and Friston 24-parameters model (6 head motion parameters, 6 head motion parameters one time point before, and the 12 corresponding squared items); Finally, we performed bandpass filtering (0.01–0.1 Hz, 0.01–0.027 Hz, 0.027–0.073 Hz), respectively. See our previous study for more details.26
ReHo Calculation
The ReHo value was calculated across the whole brain with Kendall’s coefficient of concordance (at a given voxel with the time series of its 26 nearest neighbours)18 in a voxel-wise way at three different frequency bands (0.01–0.1 Hz, 0.01–0.027 Hz, 0.027–0.073 Hz). ReHo maps from three frequency bands for each subject were obtained. Then, to reduce the global effects of variability across subjects, ReHo maps for each individual were divided by the global mean ReHo value, and spatially smoothed with a Gaussian kernel (full width at half maximum = 6 mm). The individual ReHo maps were generated via Fisher’s r-to-z standardization. Ultimately, szReHo maps were used for statistical analysis.
Statistical Analysis
For demographic and clinical data, the Kolmogorov–Smirnov test was used to test the normality of the data. Two-sample t-test were used to compare intergroup difference (pre-CPAP OSA vs HC) for normally distributed data. The paired-sample t-tests were used to compare the difference between the post- and pre-CPAP OSA patients.
For the voxel-based szReHo maps, one-sample t-tests were calculated in the two groups to identify the spatial distribution in three different frequency bands, respectively. Two-sample t-tests were performed between pre-CPAP OSA patients and HCs in the typical frequency band with BMI and educational years as covariates using DPABI (http://rfmri.org/dpabi) software in MATLAB2018b (MathWorks, Natick, MA, USA). Then, we performed a two-way analysis of variance (ANOVA) on ReHo using SPM12 software with group (pre-CPAP OSA patients and HC) as a between-subject factor and frequency band (slow-4 and slow-5) as a repeated measures factor to examine the effects of group and frequency band. The F-map of the group main effect and “frequency by group” interactions effect were obtained. Post hoc t-test was analysed between pre-CPAP OSA patients and HCs in the slow-4 and slow-5 bands, respectively. Pair-sample t-tests were used to compare the difference on ReHo z-values between the post- and pre-CPAP OSA patients. All clusters were reported with a voxel-level threshold of P < 0.01 and cluster-level of P < 0.05, two tailed, GRF correction.
The mean ReHo z-values of abnormal brain regions were correlated with clinical evaluation using partial correlational analyses with BMI and educational years as covariates in OSA patients. P < 0.05 was considered to be statistically significant.
Results
Clinical Characteristics
The demographic and clinical data of the two groups are shown in Table 1. There were no significant differences in age or sex between the OSA patients and the HC groups. The OSA patients showed significantly increased scores for AHI, BMI, ESS, HAMA, HAMD, and PSQI, but decreased scores for nadir SaO2, and MoCA compared to HCs. After one month of CPAP treatment follow-up, the MoCA was increased significantly (Figure 2), but the ESS (Figure 3), HAMA, HAMD, and PAQI were reduced significantly compared to pre-CPAP OSA patients.
 |
Table 1 Population and Clinical Characteristics of Particpants |
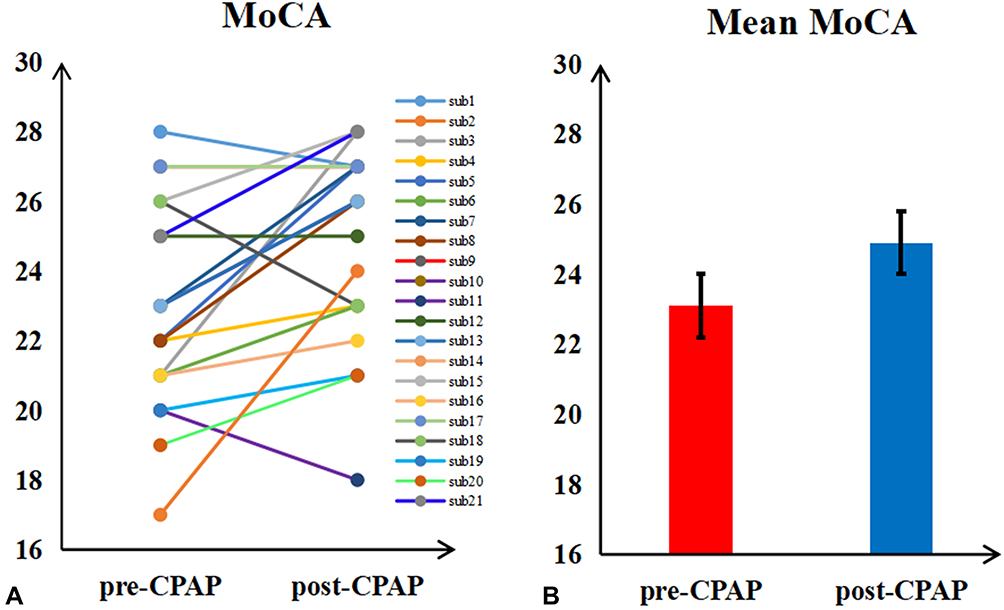 |
Figure 2 The MoCA score were changed between post- and pre-CPAP OSA patients. (A) Each OSA patient changes. (B) The mean value of MoCA. |
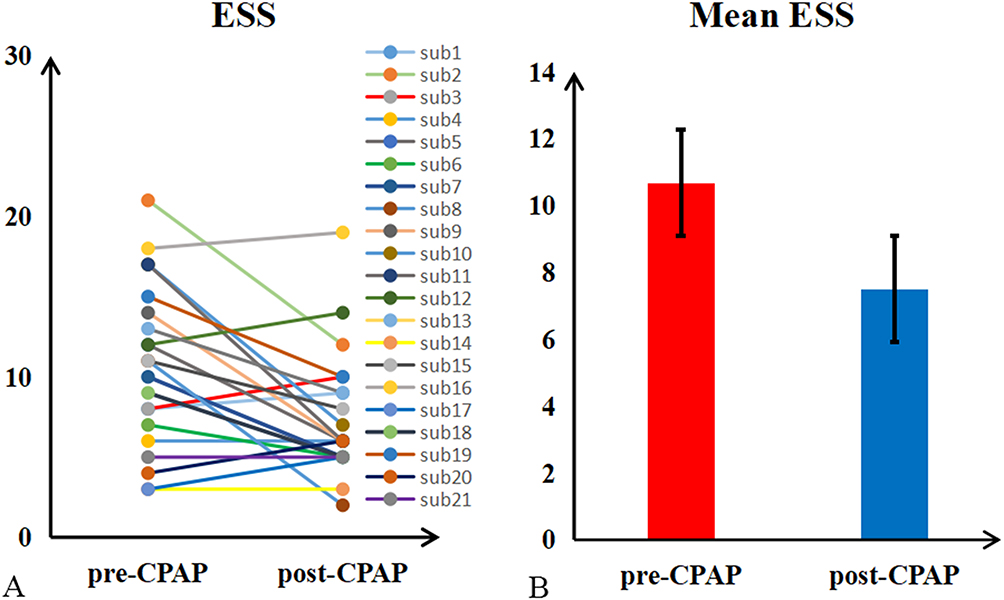 |
Figure 3 The ESS score were changed between post- and pre-CPAP OSA patients. (A) Each OSA patient changes. (B) The mean value of ESS. |
Spatial Distribution Pattern of ReHo in OSA Patients and HC Groups
For ReHo, we found that there were highly similar spatial distribution patterns of ReHo in the typical frequency band (0.01–0.1 Hz), slow-4 band (0.027–0.073 Hz), and slow-5 band (0.01–0.027 Hz) between OSA patients and HC groups and higher ReHo z-values in some regions, including the bilateral posterior cingulate cortex (PCC)/precuneus, inferior parietal lobule (IPL), inferior temporal gyrus (ITG), and medial prefrontal cortices (MPFC), which were the core subregions of the default mode network (DMN) (Figure 4).
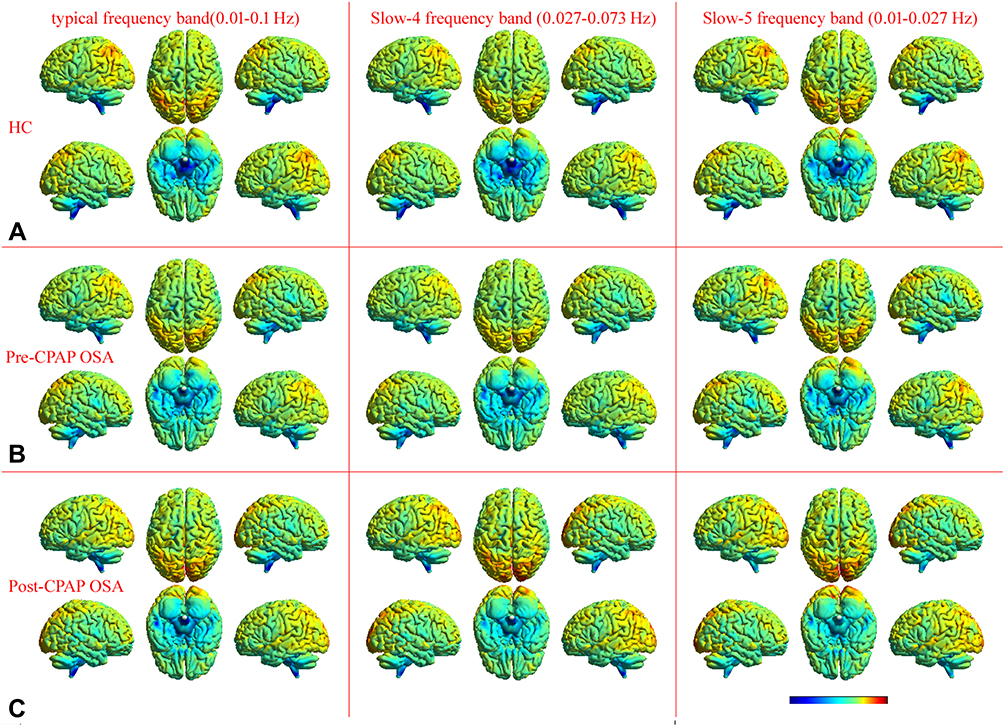 |
Figure 4 Highly similar spatial distribution patterns of ReHo were found at the group level for healthy controls (A) and OSA patients (pre-CPAP (B) and post-CPAP (C)) in the typical frequency band (0.01–0.1 Hz), slow-4 frequency band (0.027–0.073 Hz), and slow-5 frequency band (0.01–0.027 Hz). |
ReHo Changes in the Typical Frequency Band (0.01–0.1 Hz)
The pre-CPAP OSA patients showed reduced ReHo z-values in the right IPL, and exhibited increased ReHo z-values in the brainstem, bilateral ITG, and fusiform gyrus (Table 2 and Figure 5A). To eliminate the effect of having only one female subject, we compared 20 male OSA patients with 20 male HC groups in typical frequency bands (0.01–0.1 Hz), highly similar results were found (Figure S1), which indicated that the results were stable and reliable.
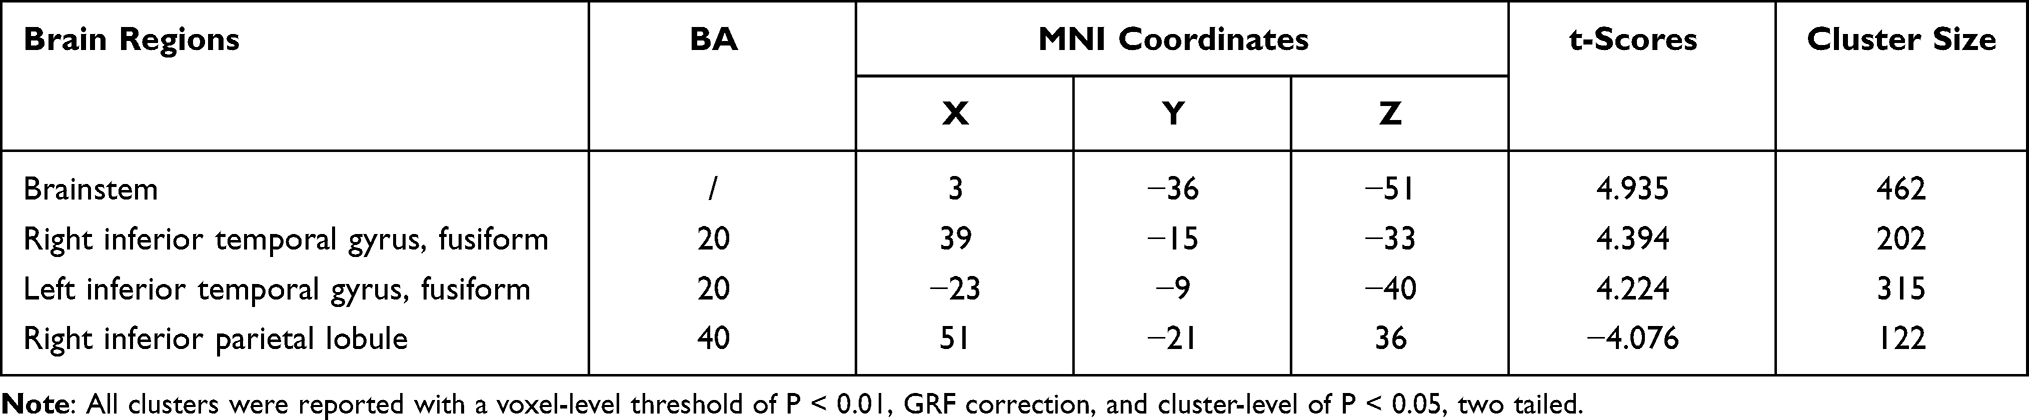 |
Table 2 Significant Altered ReHo in Typical Frequency Band (0.01–0.1 Hz) Between the Pre-CPAP OSA Patients and HC Groups (Two Sample t-Test) |
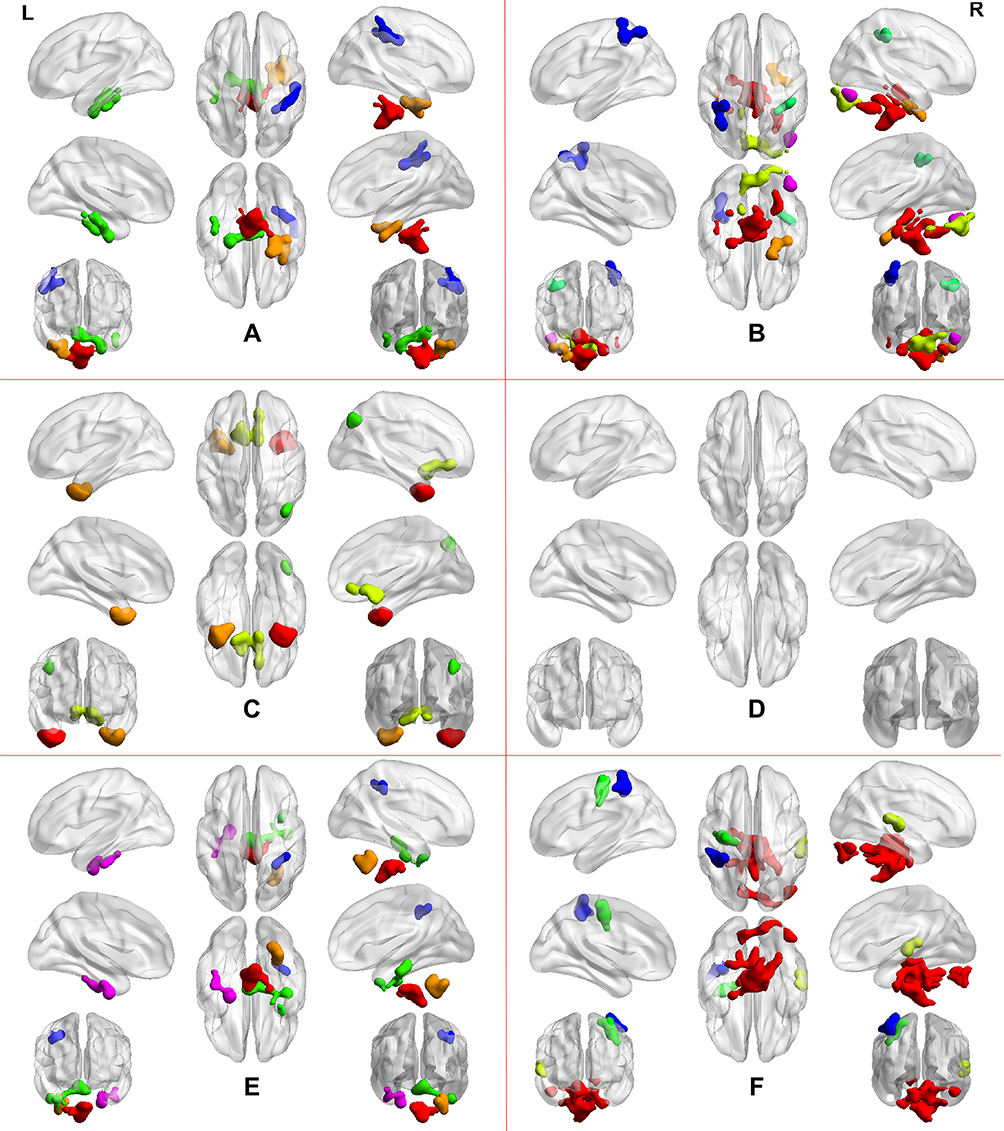 |
Figure 5 Two-sample t-test in the typical frequency band (0.01–0.08 Hz) (A). The results were obtained by a 2×2 two-way ANOVA analysis (group: baseline OSA patients and HC; frequency band: slow-4 and slow-5), Main effects of group (B); Main effects of frequency band (C); Interaction between frequency bands and groups (D). The post hoc two-sample t-test for the slow-4 frequency band (0.027–0.073 Hz) (E) and slow-5 frequency band (0.01–0.027 Hz) (F). All results were reported at voxel-level p < 0.01 and cluster-level p < 0.05, GRF corrected. |
ReHo Changes in Specific Frequency Band
To detect the frequency-specific changes in ReHo, we performed a two-way 2 × 2 ANOVA analysis. A significant main effect of the group was presented in the brainstem, bilateral cerebellum posterior lobe (CPL), right ITG and fusiform lobe, and bilateral IPL (Table 3, Figure 5B). The main effect of frequency was located in the bilateral MTG and STG, bilateral MFG and right IPL (Figure 5C). There were no significant interactions between groups and frequency band (Figure 5D).
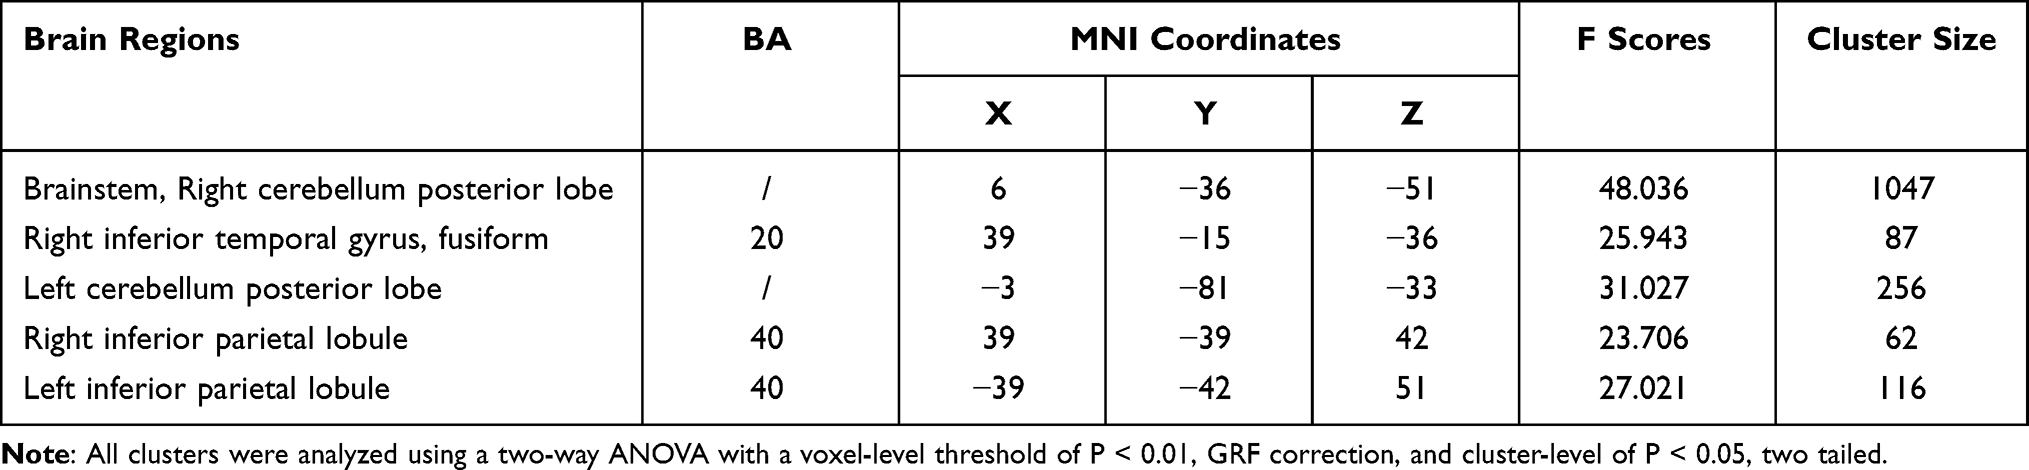 |
Table 3 Significant Altered ReHo in Main Effect of Group (Pre-CPAP OSA and HC Groups) |
Further post t-test results in the slow-4 and slow-5 are shown in Table 4 and Figure 5E and F. The same altered brain regions were observed in the brainstem, and right CPL in both bands. The OSA patients showed lower ReHo z-values in the right superior temporal gyrus (STG), left precentral gyrus (PG) and left IPL in the slow-4 band, and exhibited higher ReHo z-values in the bilateral ITG and fusiform gyrus, but lower ReHo z-values in the right IPL in the slow-5 band.
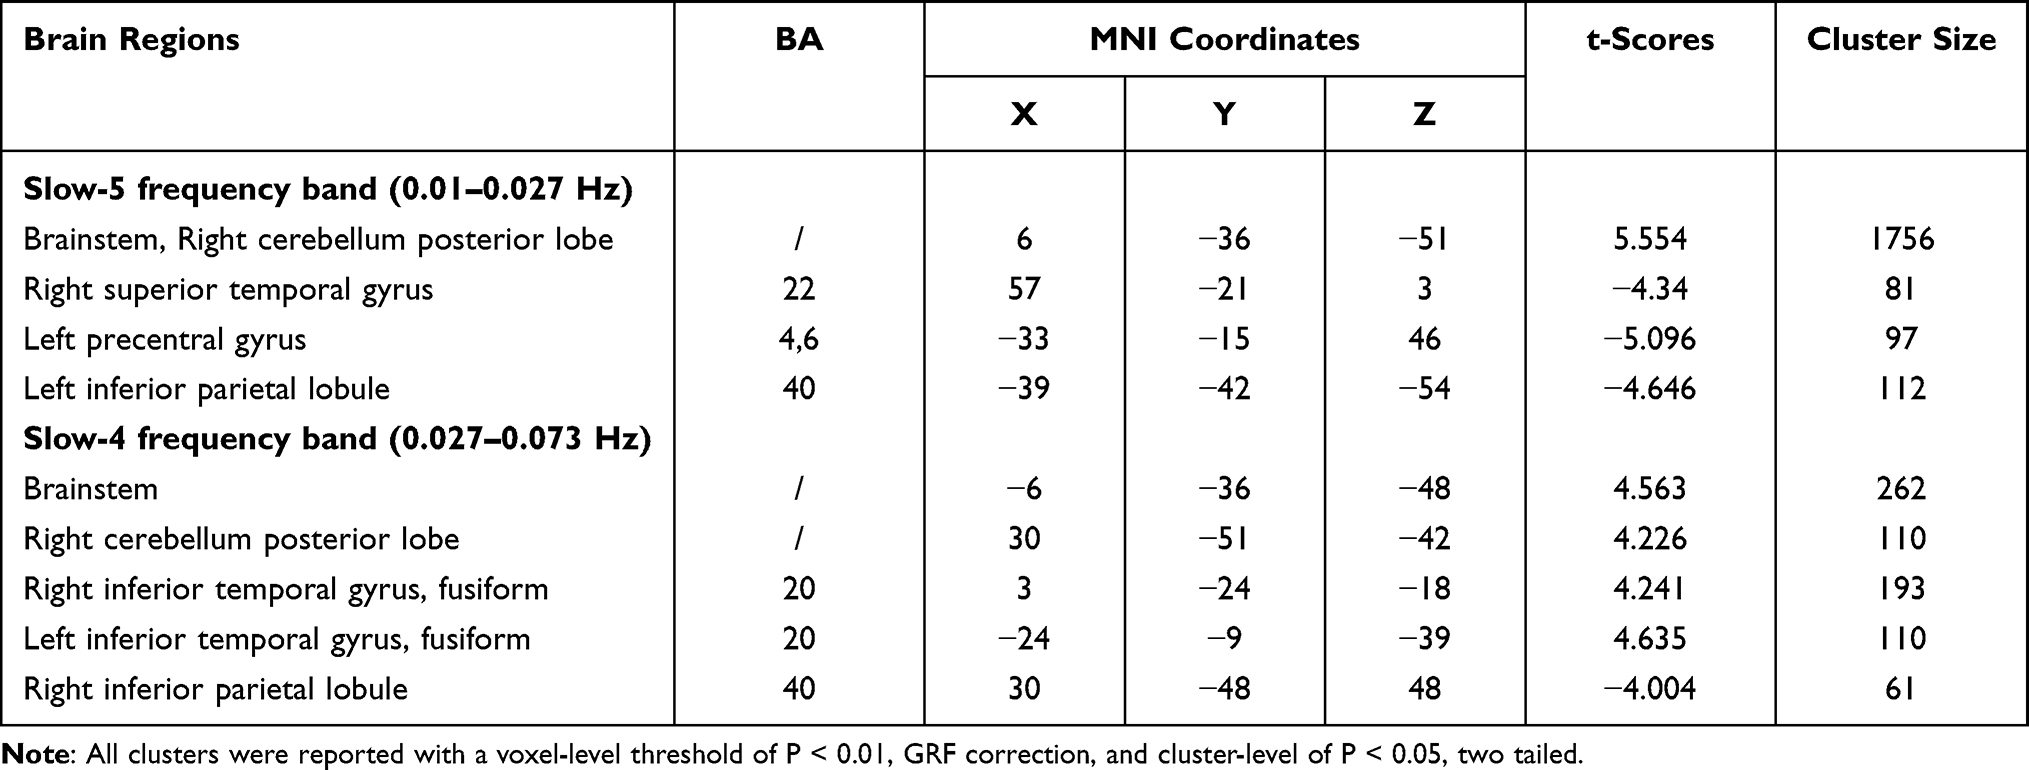 |
Table 4 Significant Altered ReHo at Specific Frequency Bands Between the Pre-CPAP OSA Patients and HCs (Two Sample t-Test) |
ReHo Changes Between Post- and Pre-CPAP OSA Patients
Paired-sample t-tests were used to compare the difference on the ReHo between the post- and pre-CPAP OSA patients in the three different frequency bands. Figure 6 shows significantly changed ReHo in three different frequency bands. The detailed abnormal brain regions are shown in Tables 5 and 6. In the post-CPAP OSA patients, significantly increased ReHo in left middle temporal gyrus (MTG), left inferior temporal gyrus (ITG), right STG, MTG, bilateral supplementary motor area (SMA), and reduced ReHo in right CPL, left SFG, right MFG and bilateral IPL in the typical frequency band (0.01–0.1 Hz) (Figure 6A). Higher ReHo in the right STG and SMA and lower ReHo in the left SFG were observed in the slow-4 band (Figure 6B). Increased ReHo in the left MTG, bilateral PG, right MFG, and right SMA and reduced ReHo in the left CPL, right MFG, and bilateral IPL were revealed in the slow-5 band (Figure 6C) compared to the pre-CPAP OSA patients. The CPAP treatment-related altered brain regions are shown in Figure 6D, which partially overlap with the brain regions detected in the comparison between the pre-CPAP OSA patients and the HC group. We extracted the average ReHo for each changed cluster, as shown in Figure 7. Interestingly, in post-CPAP OSA patients, the increased ReHo z-value was higher than that in the HC group, while the decreased ReHo z-value was lower than that in the HC group.
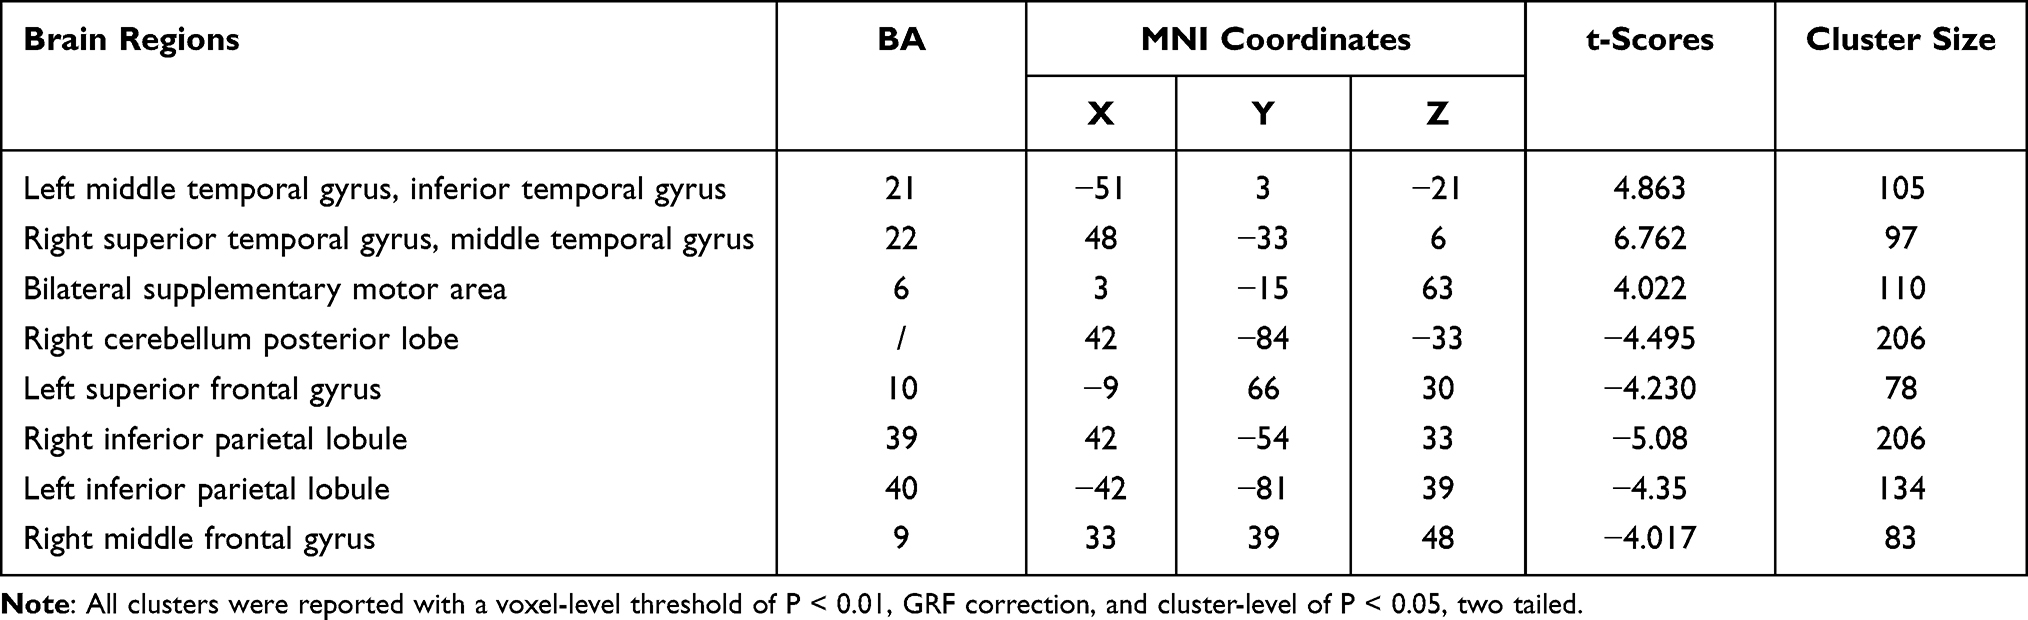 |
Table 5 Significant Altered ReHo at Typical Frequency Band (0.01–0.1 Hz) Between the Post-CPAP OSA Patients and Pre-CPAP OSA (Paired Sample t-Test) |
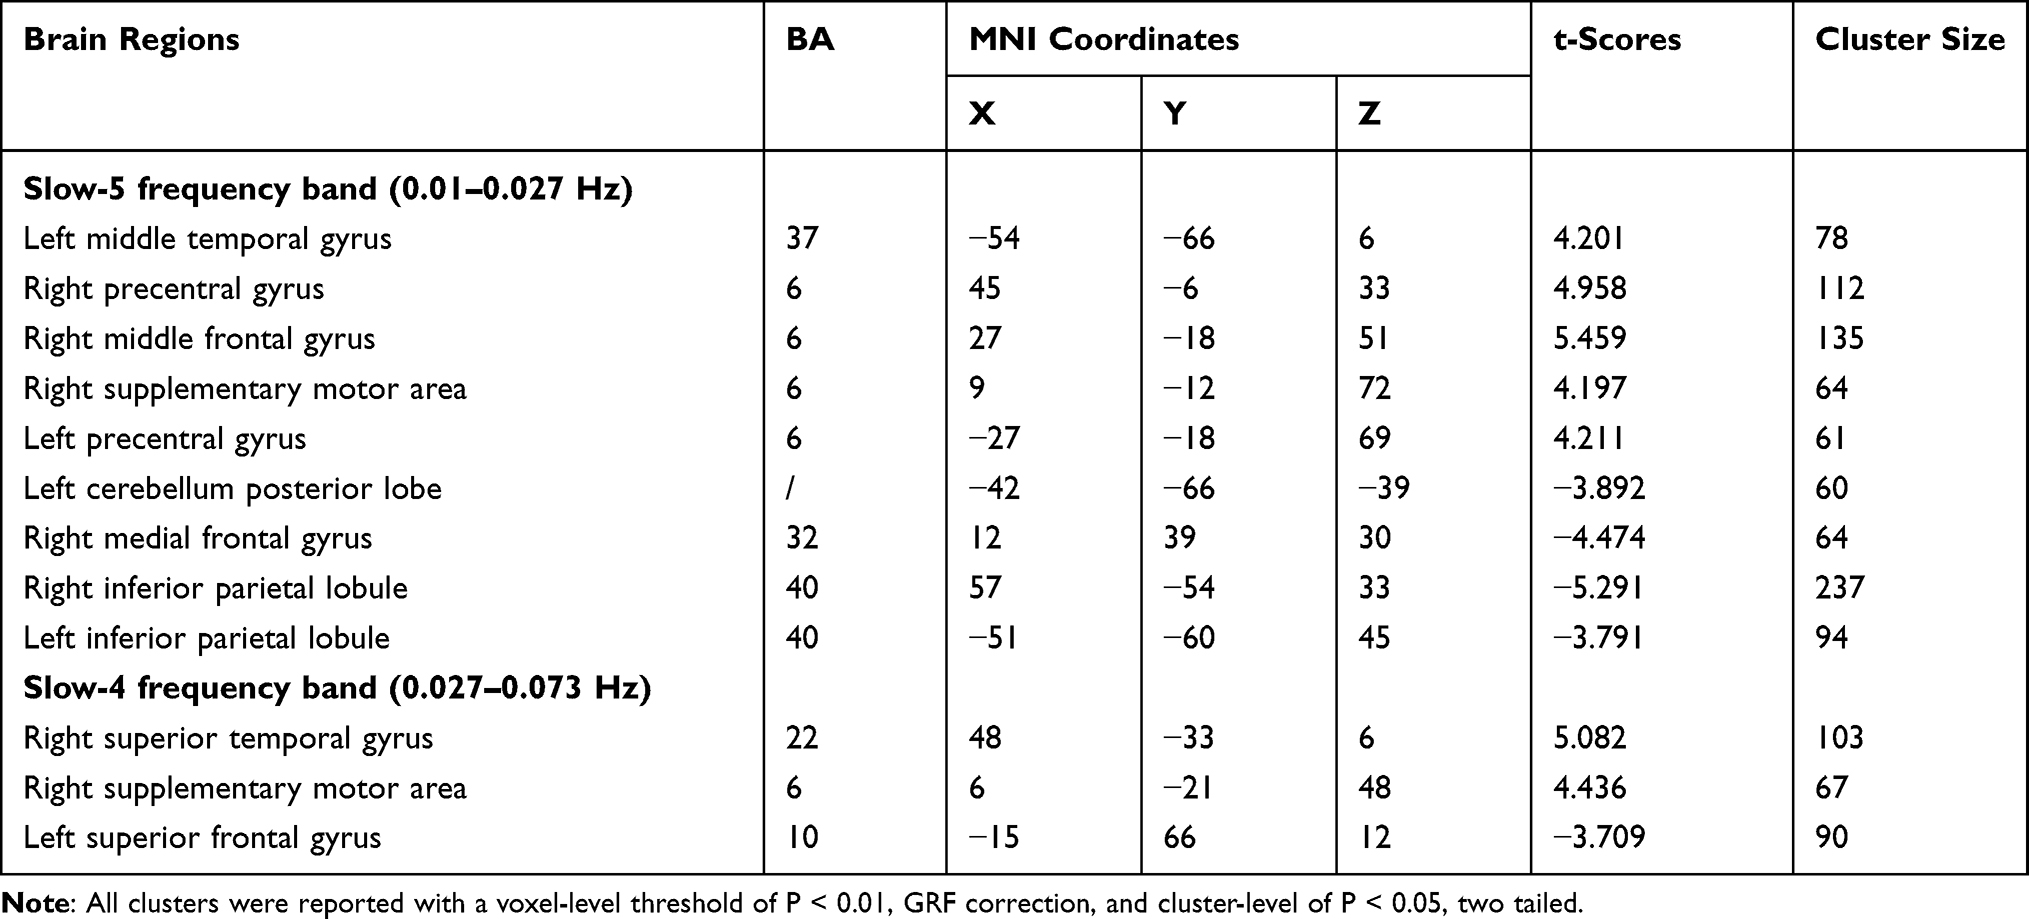 |
Table 6 Significant Altered ReHo at Specific Frequency Bands Between the Post- and Pre-CPAP OSA (Paired Sample t-Test) |
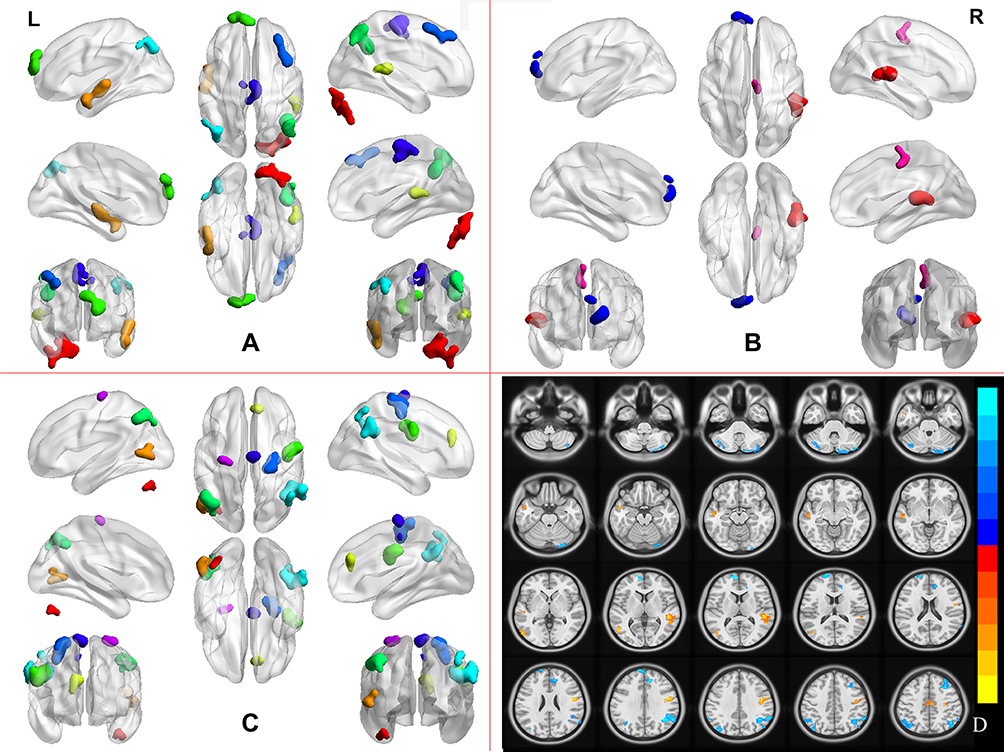 |
Figure 6 Pair sample t-test in the typical frequency band (0.01–0.08 Hz) (A), the slow-4 frequency band (0.027–0.073 Hz) (B), and slow-5 frequency band (0.01–0.027 Hz) (C) between pre- and post-CPAP OAS patients. The CPAP treatment-related changes of the ReHo in the three different frequency bands in OSA patients (D). All results were reported at voxel-level p < 0.01 and cluster-level p < 0.05, GRF corrected. |
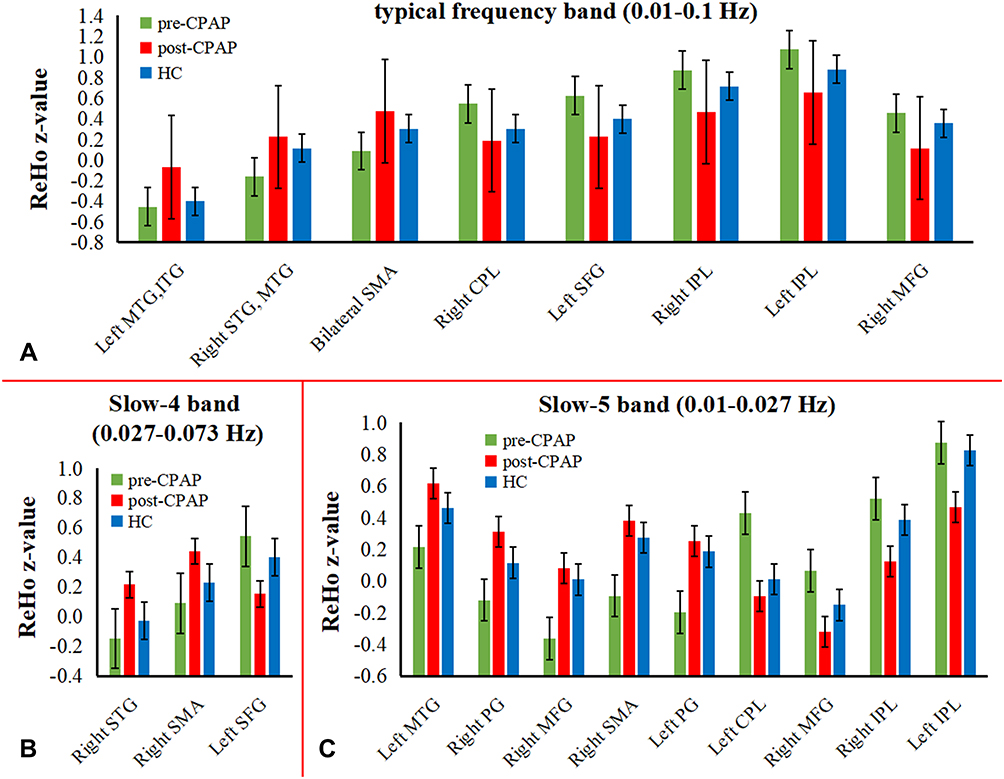 |
Figure 7 Mean ReHo z-value of HC, pre- and post-CPAP OSA patients in altered brain regions, which were compared before and after CPAP treatment in OSA patients in three different frequency band. (A) typical frequency band; (B) slow-4 band; (C) slow-5 band. |
Correlations Between Altered ReHo z-Values and Clinical Assessment
In pre-CPAP OSA patients, the MoCA was significantly correlated with the mean ReHo z-value of the right IPL (r = 0.673, P = 0.001) in the typical frequency band, and the right IPL (r = 0.748, P < 0.001) in the slow-4 band. Significant correlations between the ESS and mean ReHo z-value of right ITG and Fus (r = 0.462, P = 0.035) in typical frequency band, and brainstem (r = 0.462, P = 0.035) in slow-5 was found. The mean ReHo z-value of brainstem (r = 0.479, P = 0.028), right ITG and Fus (r = 0564, P = 0.008), left ITG and Fus (r = 0.590, P = 0.005) in typical frequency band, and right ITG (r = 0.517, P = 0.016), Left TIG (r = 0.503, P = 0.020) in slow-4 band, brainstem (r = 0.467, P = 0.033) and left IPL in slow-5 band showed significant correlations with severity of OSA (AHI) (Figure 8).
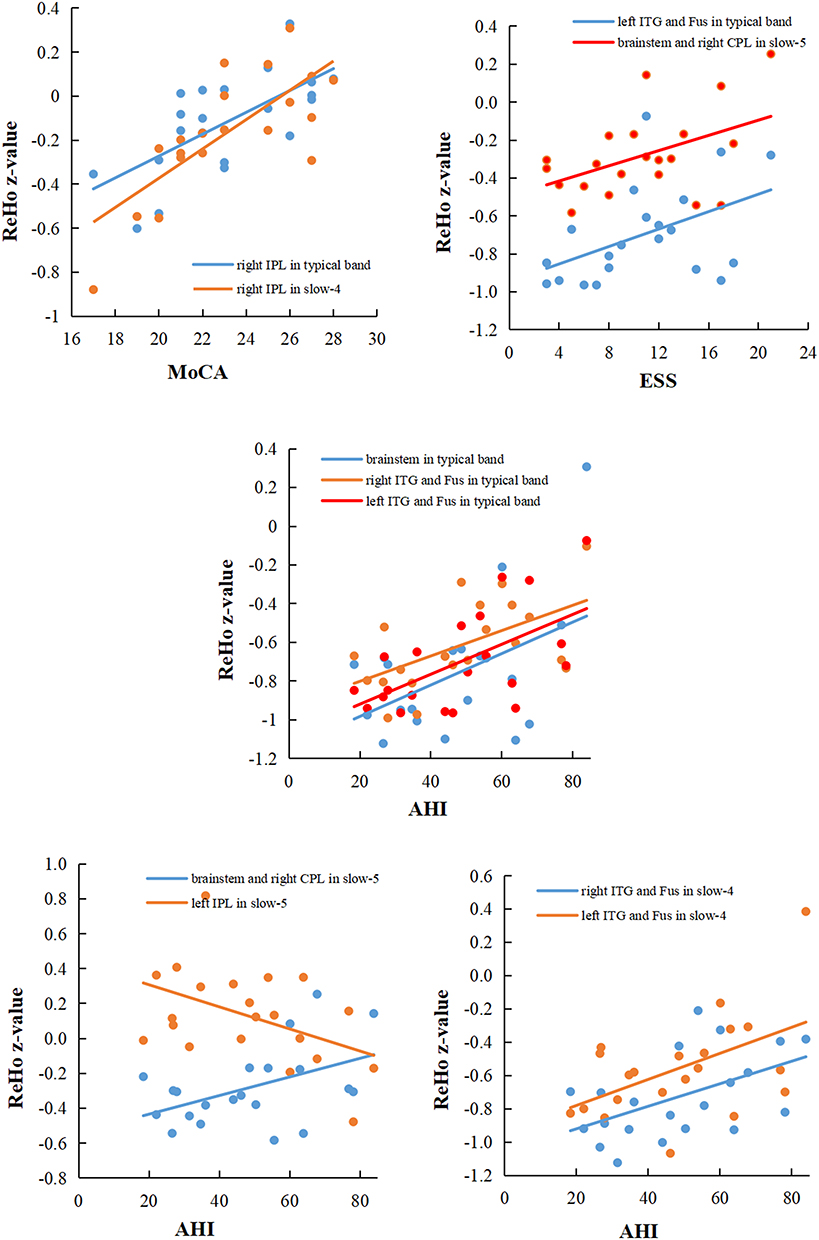 |
Figure 8 In the pre-CPAP OSA patients, significant correlations between the mean ReHo z-value with between-subgroup differences (pre-CPAP OSA patients vs HC groups) and clinical assessment. Abbreviations: ReHo, regional homogeneity; IPL, inferior parietal lobule; ITG, inferior temporal gyrus; Fus, Fusiform; MoCA, Montreal cognitive assessment; ESS, Epworth sleepiness scale. |
Discussion
To the best of our knowledge, this was the first study to explore changes in spontaneous brain activity and brain response to short-term CPAP therapy in OSA patients using voxel-based ReHo in three different frequency bands. In the typical frequency band, we found that pre-CPAP OSA patients showed increased ReHo in the brainstem, bilateral ITG/fusiform, and lower ReHo in the right IPL. The main effects of the group of ANOVA analysis in the bilateral brainstem, bilateral CPL, bilateral IPL, right ITG and fusiform were found. Interestingly, with the exception of increased ReHo in the brainstem and right CPL in both slow-4 and slow-5, lower ReHo in right STG, left PG and left IPL in slow-5, lower ReHo in right IPL, and higher ReHo in bilateral ITG/fusiform in slow-4 were observed. After one month of CPAP treatment, spontaneous brain activity was reversed in some brain regions, such as the bilateral CPL, right STG, and left PG. At the same time, we found increased ReHo in the bilateral SMA, left MTG/ITG, right MFG, and right PG, and reduced ReHo in the left SFG and bilateral IPL in post-CPAP OSA patients. The slow-5 band was more sensitive in detecting abnormal spontaneous brain activity in post-CPAP OSA patients. Meanwhile, we found a significant correlation between abnormal ReHo in multiple brain regions and MoCA, ESS, and AHI. These results suggested that OSA-related spontaneous brain activity was related to specific frequency bands. Meanwhile, the CPAP therapy can partially reverse the spontaneous activity of abnormal brain regions and partially produce adaptive compensatory changes in OSA. Altogether, abnormal changes in frequency-specific ReHo provided not only additional information for understanding the underlying neural mechanisms but also provided possible imaging markers for clinical CPAP therapy.
Obesity and male sex were the main risk factors for OSA. In the current study, BMI of OSA patients was significantly higher than that of healthy controls. There were 20 male OSA and only one female OSA patients. Previous studies have suggested that obesity and gender differences may affect resting brain activity.27,28 To confirm that our findings were primarily due to OSA rather than obesity or gender differences, we compared the intergroup differences in ReHo with BMI and educational years as covariates and performed a repeatability analysis comparing 20 male OSA patients with 20 male HC groups in typical frequency bands (0.01–0.1 Hz). These results are highly similar, which suggested that ReHo changes in OSA patients are caused by OSA itself rather than sex.
Compared with HCs, the pre-CPAP OSA patients showed increased ReHo in the brainstem in three bands. However, no significant changes were observed before and after CPAP treatment in OSA patients. The brainstem is an important central structure for sympathetic nerve activity and is highly connected to other cortical and subcortical regions involved in breathing and sleep. Respiration originates from the central processor of the brainstem and consists of driving downstream premotor neurons to supply spinal respiratory motor neurons, which in turn innervate cranial motoneurons to the muscles of the upper airway.29 It is well established that muscle sympathetic nerve activity is regulated by respiration. Previous studies have reported increased gray matter volume and brain activity in the brainstem associated with increased muscle sympathetic nerve activity in OSA patients.30 The coupling between respiratory rhythm and sympathetic output may result from the interaction between brainstem circuits since its transsection significantly attenuates the respiratory regulation of sympathetic output.31 An increased fractional anisotropy value in normal-appearing white matter of the brainstem was observed after 3 months of CPAP treatment,32 and muscle sympathetic nerve activity coupled with BOLD signal intensity within the brainstem returned to control levels after 6 months of CPAP treatment.33 Another study confirmed that structural and functional changes in the brainstem could be restored after 6 months of CPAP therapy and were maintained after 12 months of CPAP therapy in OSA patients.34 Consistent with these findings, we found significantly increased ReHo in the brainstem in OSA patients at baseline and increased ReHo in the typical band and slow-5 band was correlated with AHI. The respiratory chemosensitivity that drives automatic control of the upper airway is decreased, and muscle sympathetic nerve activity is decreased during sleep.35 Therefore, we speculate that sleep disruption in OSA patients leads to hypercapnia, which in turn stimulates respiratory chemosensitivity and increases sympathetic nerve activity, resulting in increased spontaneous brainstem brain activity. The lack of significant differences before and after CPAP therapy may be due to the short duration of treatment (one month).
The role of the cerebellum in sleep is unclear, but one study has shown that the cerebellum is involved in the regulation of the sleep-wake cycle.36 Some scholars have begun to pay attention to changes in the cerebellum in OSA patients. For instance, increased cerebellar gray matter volume was reported in OSA patients.37 One functional connectivity study demonstrated decreased functional connectivity between the left cerebellum and hippocampus.38 Park et al found that OSA showed cerebellar network integration and cerebrocerebellar connectivity was impaired in OSA patients, which may participate in cognitive decline.39 The cerebellum was susceptible to hypoxia or ischaemia. Consistent with our previous findings,40 we reconfirmed that increased ReHo in the right CPL in both slow-4 and slow-5 bands was observed in pre-CPAP OSA patients, which may be a compensatory response to hypoxia. The increase in local functional connectivity (ReHo) in the cerebellum may be related to the hypertrophic gray matter volume, leading to the decreased network connectivity in cerebrocerebellar in OSA patients. As we expected, our results showed that increased ReHo in the CPL was restored in the typical band after CPAP treatment, suggesting that CPAP therapy can reverse brain damage. Interestingly, we found that ReHo values in the right CPL in slow-5 were positively correlated with AHI, suggesting that it was related to the severity of the disease. Spontaneous abnormal brain activity in the cerebellar may be a compensatory response to hypoxia and may provide a new neuroimaging marker for OSA patients.
In the present study, OSA patients showed decreased ReHo in the bilateral IPL before and after CPAP treatment in different bands. The IPL is one of the core hubs of the DMN that is involved in several higher cognitive domains, including autobiographical memory,41 episodic memory,42 mind wandering or daydreaming,43 and collection and evaluation of information.44 Previous studies have described cortical thinning in the left IPL, which was correlated with respiratory arousal, suggesting that sleep fragmentation may cause brain tissue damage in IPL.45 The moderated to severe OSA patients showed a decrease FC value in bilateral IPL compared with mild group, suggesting that DMN was disrupted in OSA.46 Our previous studies reported reduced degree centrality in left IPL and were negatively correlated with the AHI and AI, which indicated that sleep fragmentation may be a potential factor for abnormal network of IPL.47 Similar to previous studies, we found decreased ReHo in the bilateral IPL in OSA patients, and ReHo z-values in right IPL in slow-4 and typical bands were positively correlated with the MoCA, which may disrupt higher cognitive processes. Unexpectedly, the ReHo of IPL did not improve but further decreased after CPAP treatment, which may be an illusion after short-term CPAP therapy due to the treatment adaptation process.
In addition, higher ReHo in the bilateral ITG and fusiform in the slow-4 and typical band were found in pre-CPAP OSA. The higher ReHo in the right STG and MTG in typical band was observed in post-CPAP OSA patients. The temporal lobe is responsible for processing auditory information and is also involved in memory and emotion. Recent research revealed that OSA exhibited loss of white matter integrity in the temporal lobe and hippocampus, which was correlated with impaired memory dysfunction.48 It has been reported that FC abnormalities in the right hippocampus and right STG and MTG in OSA are negatively correlated with performance of information processing speed, which may probably contribute to the development of cognitive dysfunction.38 Our previous study found an increase in rs-FC between the left IFG and bilateral ventrolateral amygdala in OSA patients, reflecting the potential adaptive compensation mechanism for the decline in emotion functions.49 A study reported decreased mean diffusivity and increased functional anisotropy in the temporal lobes and fusiform gyrus, and increased CBF in the ITG was found in OSA with six weeks of CPAP treatment, suggesting that CPAP therapy can recover OSA-induced brain injury.50 The elevated ReHo in the right STG and MTG may reflect a repair mechanism activation in our study. Furthermore, higher ReHo in the bilateral ITG and fusiform were positively correlated with the AHI. The potential causal relationship remains unclear and requires further exploration.
In the current study, we also found that some brain regions with normal brain activity at baseline showed increased ReHo after CPAP therapy. These brain regions include the bilateral SMA, MFG, right PG, and left SFG. The SMA and PG are core subregions of the sensorimotor network. Recent research reported that OSA patients showed decreased ReHo in the right SMA and PG, left SFG and MFG, and were negatively correlated with cognitive impairment, suggesting that frontal lobe dysfunction is an important neuropathophysiological mechanism of neurocognitive deficits.51 Previous studies have reported cortical thinning45 and reduced functional connectivity16 of the bilateral PG associated with sensorimotor function in OSA. Another study found impaired local functional specialization and integration of sensorimotor networks in OSA patients.17 These results suggested that OSA sensorimotor network abnormalities may be caused by repeated hypoxemia injury and upper respiratory tract collapse that further impairs sensorimotor function.52 In our study, no abnormality of spontaneous brain activity in sensorimotor areas was found at baseline. The inconsistency with other results may be due to the difference in the subjects’ population and the fMRI acquisition parameters in the resting state and the difference in the frequency band. However, we found significantly increased ReHo in those brain regions after CPAP treatment, which may be due to the early repair of neuronal spontaneous activity by CPAP treatment.
In our study, after CPAP treatment, the most interesting finding was that OSA patients showed abnormal spontaneous activity in multiple brain regions in typical bands, and these regions had a frequency-specific distribution. Higher ReHo in the right and right SMA, and lower ReHo in the left SFG were only observed in the slow-4 band. However, OSA patients exhibited more widespread alterations in the slow-5 band in the bilateral MFG, PG, IPL, left CPL, and right SMA, suggesting that the slow-5 band was more sensitive to detecting abnormal intrinsic brain activity. However, the relationships and specific physiological functions of the slow-4 and slow-5 bands are not fully understood. Previous studies have shown that low-frequency oscillations reflect the integration of large-scale neural networks. Yu et al observed higher amplitude of low-frequency fluctuation in a widespread range of cortical regions in the slow-5 band than in the slow-4 band.53 This is similar to what we have previously found in COPD patients.54 Therefore, we suggest that future studies on brain networks in OSA patients should include the influence of specific frequency bands.
Limitations
There are some limitations. First, this was a short-term CPAP therapy, and the effects of long-term CPAP therapy need to be further explored. We only explored the changes in local brain connections (ReHo) in different frequency bands, and the whole brain function network connections were not clear. Finally, there were relatively few patients after CPAP treatment, especially females, so we did not distinguish between sleepiness improvement and subjective residual daytime sleepiness by ESS. In the future, a multicenter, large-sample long-term follow-up study should be conducted to explore changes in whole-brain network connectivity in OSA patients.
Conclusion
In summary, the present study used voxel-based ReHo to investigate OSA-related spontaneous brain activity changes in three different frequency bands before and after short-term CPAP therapy. OSA patients showed frequency-specific abnormal alterations of ReHo in multiple brain regions, and some of these alterations could be reversed by short-term CPAP therapy. These findings suggested that multiband ReHo provides additional information for understanding the underlying neural mechanisms of OSA-related cognitive impairment, and can provide potential imaging markers for clinical treatment. In addition, future studies should consider the effects of different frequency bands on brain networks.
Acknowledgments
This study was supported by the National Natural Science Foundation of China (Grant Nos. 81860307 and 81560285), the Natural Science Foundation Project of Jiangxi, China (Grant Nos. 20202BABL216036, 20181ACB20023, and 20171BAB205070), Education Department Project of Jiangxi Province, China (Grant Nos. 700544006 and GJJ190133), and Department of Health Project and Jiangxi Province, China (Grant No. 20181039).
Disclosure
The authors declare no potential conflicts of interest in this work.
References
1. Franklin KA, Lindberg E. Obstructive sleep apnea is a common disorder in the population-a review on the epidemiology of sleep apnea. J Thorac Dis. 2015;7(8):1311–1322. doi:10.3978/j.issn.2072-1439.2015.06.11
2. Olaithe M, Bucks RS, Hillman DR, Eastwood PR. Cognitive deficits in obstructive sleep apnea: insights from a meta-review and comparison with deficits observed in COPD, insomnia, and sleep deprivation. Sleep Med Rev. 2018;38:39–49. doi:10.1016/j.smrv.2017.03.005
3. Andrade AG, Bubu OM, Varga AW, Osorio RS. The relationship between obstructive sleep apnea and Alzheimer’s disease. J Alzheimers Dis. 2018;64(s1):S255–270. doi:10.3233/JAD-179936
4. Rosenzweig I, Williams SC, Morrell MJ. The impact of sleep and hypoxia on the brain: potential mechanisms for the effects of obstructive sleep apnea. Curr Opin Pulm Med. 2014;20(6):565–571. doi:10.1097/MCP.0000000000000099
5. Jelic S, Padeletti M, Kawut SM, et al. Inflammation, oxidative stress, and repair capacity of the vascular endothelium in obstructive sleep apnea. Circulation. 2008;117(17):2270–2278. doi:10.1161/CIRCULATIONAHA.107.741512
6. Lanfranchi P, Somers VK. Obstructive sleep apnea and vascular disease. Respir Res. 2001;2(6):315-319. doi:10.1186/rr79
7. Marshall NS, Barnes M, Travier N, et al. Continuous positive airway pressure reduces daytime sleepiness in mild to moderate obstructive sleep apnoea: a meta-analysis. Thorax. 2006;61(5):430–434. doi:10.1136/thx.2005.050583
8. Antic NA, Catcheside P, Buchan C, et al. The effect of CPAP in normalizing daytime sleepiness, quality of life, and neurocognitive function in patients with moderate to severe OSA. Sleep. 2011;34(1):111–119. doi:10.1093/sleep/34.1.111
9. Zhang J, Weaver TE, Zhong Z, et al. White matter structural differences in OSA patients experiencing residual daytime sleepiness with high CPAP use: a non-Gaussian diffusion MRI study. Sleep Med. 2019;53:51–59. doi:10.1016/j.sleep.2018.09.011
10. Ferini-Strambi L, Marelli S, Galbiati A, Castronovo C. Effects of continuous positive airway pressure on cognition and neuroimaging data in sleep apnea. Int J Psychophysiol. 2013;89(2):203–212. doi:10.1016/j.ijpsycho.2013.03.022
11. Rosenzweig I, Glasser M, Crum WR, et al. Changes in neurocognitive architecture in patients with obstructive sleep apnea treated with continuous positive airway pressure. Ebiomedicine. 2016;7:221–229. doi:10.1016/j.ebiom.2016.03.020
12. Kim H, Joo E, Suh S, Kim J, Kim ST, Hong SB. Effects of long-term treatment on brain volume in patients with obstructive sleep apnea syndrome. Hum Brain Mapp. 2016;37(1):395–409. doi:10.1002/hbm.23038
13. Castronovo V, Scifo P, Castellano A, et al. White matter integrity in obstructive sleep apnea before and after treatment. Sleep. 2014;37(9):1465–1475. doi:10.5665/sleep.3994
14. Kim JS, Seo JH, Kang MR, et al. Effect of continuous positive airway pressure on regional cerebral blood flow in patients with severe obstructive sleep apnea syndrome. Sleep Med. 2017;32:122–128. doi:10.1016/j.sleep.2016.03.010
15. Li H, Nie X, Gong H, Zhang W, Nie S, Peng D. Abnormal resting-state functional connectivity within the default mode network subregions in male patients with obstructive sleep apnea. Neuropsych Dis Treat. 2016;12:203–212. doi:10.2147/NDT.S97449
16. Zhang Q, Wang D, Qin W, et al. Altered resting-state brain activity in obstructive sleep apnea. Sleep. 2013;36(5):651–659. doi:10.5665/sleep.2620
17. Park B, Palomares JA, Woo MA, et al. Disrupted functional brain network organization in patients with obstructive sleep apnea. Brain Behav. 2016;6(3):e00441. doi:10.1002/brb3.441
18. Zang Y, Jiang T, Lu Y, He Y, Tian L. Regional homogeneity approach to fMRI data analysis. Neuroimage. 2004;22(1):394–400. doi:10.1016/j.neuroimage.2003.12.030
19. Jiang L, Zuo XN. Regional homogeneity: a multimodal, multiscale neuroimaging marker of the human connectome. Neuroscientist. 2016;22(5):486–505. doi:10.1177/1073858415595004
20. Dai X, Peng D, Gong H, Li H, Nie X, Zhang W. Altered intrinsic regional brain activity in male patients with severe obstructive sleep apnea: a resting-state functional magnetic resonance imaging study. Neuropsych Dis Treat. 2014;10:1819. doi:10.2147/NDT.S67805
21. Zuo XN, Di Martino A, Kelly C, et al. The oscillating brain: complex and reliable. Neuroimage. 2010;49(2):1432–1445. doi:10.1016/j.neuroimage.2009.09.037
22. Zhao Z, Tang C, Yin D, et al. Frequency-specific alterations of regional homogeneity in subcortical stroke patients with different outcomes in hand function. Hum Brain Mapp. 2018;39(11):4373–4384. doi:10.1002/hbm.24277
23. Lou YT, Li XL, Wang Y, et al. Frequency-Specific regional homogeneity alterations in Tourette syndrome. Front Psychiatry. 2020;11:543049. doi:10.3389/fpsyt.2020.543049
24. Kapur VK, Auckley DH, Chowdhuri S, et al. Clinical practice guideline for diagnostic testing for adult obstructive sleep apnea: an American Academy of Sleep Medicine clinical practice guideline. J Clin Sleep Med. 2017;13(3):479–504. doi:10.5664/jcsm.6506
25. Nasreddine ZS, Phillips NA, Bdirian V, et al. The Montreal Cognitive Assessment, MoCA: a brief screening tool for mild cognitive impairment. J Am Geriatr Soc. 2005;53(4):695–699. doi:10.1111/j.1532-5415.2005.53221.x
26. Li H, Xin H, Yu J, et al. Abnormal intrinsic functional hubs and connectivity in stable patients with COPD: a resting-state MRI study. Brain Imaging Behav. 2020;14(2):573–585. doi:10.1007/s11682-019-00130-7
27. Dai XJ, Gong HH, Wang YX, et al. Gender differences in brain regional homogeneity of healthy subjects after normal sleep and after sleep deprivation: a resting-state fMRI study. Sleep Med. 2012;13(6):720–727. doi:10.1016/j.sleep.2011.09.019
28. Zhang P, Wu GW, Yu FX, et al. Abnormal regional neural activity and reorganized neural network in obesity: evidence from resting-state fMRI. Obesity. 2020;28(7):1283–1291. doi:10.1002/oby.22839
29. Smith JC, Abdala AP, Borgmann A, Rybak IA, Paton JF. Brainstem respiratory networks: building blocks and microcircuits. Trends Neurosci. 2013;36(3):152–162. doi:10.1016/j.tins.2012.11.004
30. Lundblad LC, Fatouleh RH, Hammam E, Mckenzie DK, Macefield VG, Henderson LA. Brainstem changes associated with increased muscle sympathetic drive in obstructive sleep apnoea. Neuroimage. 2014;103:258–266. doi:10.1016/j.neuroimage.2014.09.031
31. Baekey DM, Dick TE, Paton JF. Pontomedullary transection attenuates central respiratory modulation of sympathetic discharge, heart rate and the baroreceptor reflex in the in situ rat preparation. Exp Physiol. 2008;93(7):803–816. doi:10.1113/expphysiol.2007.041400
32. Salsone M, Caligiuri ME, Castronovo V, et al. Microstructural changes in normal-appearing white matter in male sleep apnea patients are reversible after treatment: a pilot study. J Neurosci Res. 2021;99(10):2646–2656. doi:10.1002/jnr.24858
33. Lundblad LC, Fatouleh RH, Mckenzie DK, Macefield VG, Henderson LA. Brain stem activity changes associated with restored sympathetic drive following CPAP treatment in OSA subjects: a longitudinal investigation. J Neurophysiol. 2015;114(2):893–901. doi:10.1152/jn.00092.2015
34. Henderson LA, Fatouleh RH, Lundblad LC, Mckenzie DK, Macefield VG. Effects of 12 months continuous positive airway pressure on sympathetic activity related brainstem function and structure in obstructive sleep apnea. Front Neurosci. 2016;10:90. doi:10.3389/fnins.2016.00090
35. Benarroch EE. Brainstem integration of arousal, sleep, cardiovascular, and respiratory control. Neurology. 2018;91(21):958–966. doi:10.1212/WNL.0000000000006537
36. Delrosso LM, Hoque R. The cerebellum and sleep. Neurol Clin. 2014;32(4):893–900. doi:10.1016/j.ncl.2014.07.003
37. Fatouleh RH, Hammam E, Lundblad LC, et al. Functional and structural changes in the brain associated with the increase in muscle sympathetic nerve activity in obstructive sleep apnoea. Neuroimage Clin. 2014;6:275–283. doi:10.1016/j.nicl.2014.08.021
38. Zhou L, Liu G, Luo H, et al. Aberrant hippocampal network connectivity is associated with neurocognitive dysfunction in patients with moderate and severe obstructive sleep apnea. Front Neurol. 2020;11:580408. doi:10.3389/fneur.2020.580408
39. Park HR, Cha J, Joo EY, Kim H. Altered cerebrocerebellar functional connectivity in patients with obstructive sleep apnea and its association with cognitive function. Sleep. 2021. doi:10.1093/sleep/zsab209
40. Peng DC, Dai XJ, Gong HH, Li HJ, Nie X, Zhang W. Altered intrinsic regional brain activity in male patients with severe obstructive sleep apnea: a resting-state functional magnetic resonance imaging study. Neuropsychiatr Dis Treat. 2014;10:1819–1826. doi:10.2147/NDT.S67805
41. Buckner RL, Carroll DC. Self-projection and the brain. Trends Cogn Sci. 2007;11(2):49–57. doi:10.1016/j.tics.2006.11.004
42. Cabeza R, Dolcos F, Graham R, Nyberg L. Similarities and differences in the neural correlates of episodic memory retrieval and working memory. Neuroimage. 2002;16(2):317–330. doi:10.1006/nimg.2002.1063
43. Mason MF, Norton MI, Van Horn JD, Wegner DM, Grafton ST, Macrae CN. Wandering minds: the default network and stimulus-independent thought. Science. 2007;315(5810):393–395. doi:10.1126/science.1131295
44. Gusnard DA, Raichle ME, Raichle ME. Searching for a baseline: functional imaging and the resting human brain. Nat Rev Neurosci. 2001;2(10):685–694. doi:10.1038/35094500
45. Joo EY, Jeon S, Kim ST, Lee JM, Hong SB. Localized cortical thinning in patients with obstructive sleep apnea syndrome. Sleep. 2013;36(8):1153–1162. doi:10.5665/sleep.2876
46. Guan WT, Liu B, Huang ZC, Zhang HX, Yang M. Altered regional brain activity of functional connectivity in patients with obstructive sleep apnea. Zhonghua Yi Xue Za Zhi. 2019;99(14):1095–1100. doi:10.3760/cma.j.issn.0376-2491.2019.14.012
47. Li H, Li L, Shao Y, et al. Abnormal intrinsic functional hubs in severe male obstructive sleep apnea: evidence from a Voxel-Wise degree centrality analysis. PLoS One. 2016;11(10):e164031. doi:10.1371/journal.pone.0164031
48. Chen HL, Huang CC, Lin HC, et al. White matter alteration and autonomic impairment in obstructive sleep apnea. J Clin Sleep Med. 2020;16(2):293–302. doi:10.5664/jcsm.8186
49. Yu H, Chen L, Li H, et al. Abnormal resting-state functional connectivity of amygdala subregions in patients with obstructive sleep apnea. Neuropsychiatr Dis Treat. 2019;15:977–987. doi:10.2147/NDT.S191441
50. Maresky HS, Shpirer I, Klar MM, Levitt M, Sasson E, Tal S. Continuous positive airway pressure alters brain microstructure and perfusion patterns in patients with obstructive sleep apnea. Sleep Med. 2019;57:61–69. doi:10.1016/j.sleep.2018.12.027
51. Zhou L, Shan X, Peng Y, et al. Reduced regional homogeneity and neurocognitive impairment in patients with moderate-to-severe obstructive sleep apnea. Sleep Med. 2020;75:418–427. doi:10.1016/j.sleep.2020.09.009
52. Mayer P, Dematteis M, Pepin JL, et al. Peripheral neuropathy in sleep apnea. A tissue marker of the severity of nocturnal desaturation. Am J Respir Crit Care Med. 1999;159(1):213–219. doi:10.1164/ajrccm.159.1.9709051
53. Yu R, Chien YL, Wang HL, et al. Frequency-specific alternations in the amplitude of low-frequency fluctuations in schizophrenia. Hum Brain Mapp. 2014;35(2):627–637. doi:10.1002/hbm.22203
54. Yu J, Wang W, Peng D, et al. Intrinsic low-frequency oscillation changes in multiple-frequency bands in stable patients with chronic obstructive pulmonary disease. Brain Imaging Behav. 2021;15(4):1922–1933. doi:10.1007/s11682-020-00385-5
 © 2021 The Author(s). This work is published and licensed by Dove Medical Press Limited. The
full terms of this license are available at https://www.dovepress.com/terms
and incorporate the Creative Commons Attribution
- Non Commercial (unported, 3.0) License.
By accessing the work you hereby accept the Terms. Non-commercial uses of the work are permitted
without any further permission from Dove Medical Press Limited, provided the work is properly
attributed. For permission for commercial use of this work, please see paragraphs 4.2 and 5 of our Terms.
© 2021 The Author(s). This work is published and licensed by Dove Medical Press Limited. The
full terms of this license are available at https://www.dovepress.com/terms
and incorporate the Creative Commons Attribution
- Non Commercial (unported, 3.0) License.
By accessing the work you hereby accept the Terms. Non-commercial uses of the work are permitted
without any further permission from Dove Medical Press Limited, provided the work is properly
attributed. For permission for commercial use of this work, please see paragraphs 4.2 and 5 of our Terms.