Back to Journals » Neuropsychiatric Disease and Treatment » Volume 15
Frequency-dependent neural activity in primary angle-closure glaucoma
Authors Jiang F ![]() , Yu C
, Yu C ![]() , Zuo MJ, Zhang C, Wang Y, Zhou FQ
, Zuo MJ, Zhang C, Wang Y, Zhou FQ ![]() , Zeng XJ
, Zeng XJ
Received 13 September 2018
Accepted for publication 10 December 2018
Published 18 January 2019 Volume 2019:15 Pages 271—282
DOI https://doi.org/10.2147/NDT.S187367
Checked for plagiarism Yes
Review by Single anonymous peer review
Peer reviewer comments 3
Editor who approved publication: Dr Yu-Ping Ning
Fei Jiang,1,* Chen Yu,2,* Min-Jing Zuo,1,* Chun Zhang,3 Ying Wang,4 Fu-Qing Zhou,2 Xian-Jun Zeng2
1Department of Radiology, The Second Affiliated Hospital of Nanchang University, Nanchang, Jiangxi 330006, People’s Republic of China; 2Department of Radiology, The First Affiliated Hospital of Nanchang University, Jiangxi Province Medical Imaging Research Institute, Nanchang, Jiangxi 330006, People’s Republic of China; 3Department of Radiology, Huai An Maternal and Child Health Hospital, Huai An, Jiangsu 223302, People’s Republic of China; 4Department of Ophthalmology, The Second Affiliated Hospital of Nanchang University, Nanchang, Jiangxi 330006, People’s Republic of China
*These authors contributed equally to this work
Objective: In this study, we aimed to investigate the frequency-dependent spontaneous neural activity in primary angle-closure glaucoma (PACG) using the amplitude of low-frequency fluctuations (ALFF) method.
Patients and methods: In total, 52 PACG individuals (24 males and 28 females) and 52 normal-sighted controls (NS; 24 males and 28 females) who were closely matched in age, sex, and education underwent resting-state magnetic resonance imaging scans. A repeated-measures ANOVA and post hoc two-sample t-tests were conducted to analyze the different ALFF values in two different frequency bands (slow-4, 0.027–0.073 Hz and slow-5, 0.010–0.027 Hz) between the two groups. Pearson’s correlation analysis was conducted to reveal the relationship between the mean ALFF values and clinical variables in the PACG group.
Results: Compared to the NS group, the PACG group had high ALFF values in the right inferior occipital gyrus and low ALFF values in the left middle occipital gyrus, left precentral gyrus, and left postcentral gyrus in the slow-4 band. The PACG group had high ALFF values in the right inferior occipital gyrus and low ALFF values in the left inferior parietal lobule, left postcentral gyrus, and right precentral/postcentral gyrus in the slow-5 band. Specifically, we found that the abnormal ALFF values in the bilateral posterior cingulate gyrus and bilateral precuneus were higher in the slow-4 than in the slow-5 band, whereas ALFF in the bilateral frontal lobe, right fusiform, and right cerebellum posterior lobe were higher in the slow-5 than in the slow-4 band. The greater mean ALFF values of the right inferior occipital gyrus were associated with smaller retinal nerve fiber layer thickness and greater visual fields in PACG group in the slow-4 band.
Conclusion: Our results highlighted that individuals in the PACG group showed abnormal spontaneous neural activities in the visual cortices, sensorimotor cortices, frontal lobe, frontoparietal network, and default mode network at two frequency bands, which might indicate impaired vision and cognition and emotion function in PACG individuals. These findings offer important insight into the understanding of the neural mechanism of PACG.
Keywords: primary angle-closure glaucoma, amplitude of low-frequency fluctuations, frequency dependent, resting-state magnetic resonance imaging
Introduction
Glaucoma is a serious eye disease characterized by progressive visual loss. The main pathological mechanism is optic atrophy due to retinal ganglion cell death. Glaucoma is the second leading cause of blindness globally, with the number of glaucoma-related blindness set to grow to 79.6 million by 2020.1 The disease is commonly classified as open-angle glaucoma, closed-angle glaucoma, and normal-tension glaucoma. There are several risk factors for glaucoma, such as genetic,2 family history,3 anterior chamber angle segment,4 and high IOP5 and ocular vascular dysregulation.6,7 Currently, drug and surgery are the primary effective treatments for glaucoma. However, there is no effective medical treatment for last-stage glaucoma. Glaucoma patients do not only exhibit progressive vision loss but also suffer from mental and psychological disorders. Growing evidences report that anxiety and depression are more prevalent in glaucoma patients.8,9 Glaucoma patients have also been shown to face higher risks of occurrence of Alzheimer’s and Parkinson’s diseases than healthy individuals. Another study reported that both glaucoma and alzheimer’s disease might share with similar neural mechanisms.10 Many neural biomarkers indicating AD have been observed in glaucoma patients. Yan et al detected amyloid-β (Aβ) and Tau proteins in the visual pathway of monkeys with glaucoma.11 Furthermore, increased tumor necrosis factor-a generated by glia has also been observed in glaucoma patients.12 Glaucoma, therefore, does not only lead to an eye disorder but is also a neurodegenerative disease.
Functional magnetic resonance imaging (fMRI) and diffusion tensor imaging (DTI) methods are noninvasive neuroimaging techniques that are applied extensively to detect the functional and morphological changes of the central nervous system in glaucoma. Previous neuroimaging studies have demonstrated that glaucoma leads to the dysfunction of neural activities in the visual and visual-related cortices. Borges et al reported that unilateral primary open-angle glaucoma (POAG) patients are associated with decreased activation in the primary visual cortex (V1).13 Murphy et al found that glaucoma subjects exhibited decreased neural activity in the V1 before the manifestation of visual field (VF) defect.14 Another research has also reported that glaucoma patients are associated with reduced neural activity in the V1, which correlated with the degree of VF defect.15,16 Furthermore, glaucoma causes functional connectivity (FC) impairment within visual cortices. Dai et al found that POAG patients exhibited an abnormal FC between the V1 and higher visual cortices.17 Frezzotti et al reported that POAG patients showed disturbed FC in the visual, working memory, and dorsal attention networks.18 Chen et al demonstrated that glaucoma patients displayed abnormal brain activity in the visual pathway.19 The dysfunction of the intra- and interconnectivity in the visual network and default model network has been observed in glaucoma patients.20 Structural magnetic resonance imaging (MRI) and DTI methods have been applied to detect the altered cerebral structure in visual cortices and visual pathway. Yu et al revealed that POAG patients were associated with a reduced cortical thickness in the V1, which correlated with the thickness of the retinal nerve fiber layer (RNFL).21 Meanwhile, reduced cortical thickness of the V5/MT+ area and posterior subregion of the V1 has also been established in POAG patients.22 According to a DTI study, subjects in the glaucoma group had reduced fractional anisotropy (FA) values in bilateral optic radiations and chiasma compared with normal-sighted controls (NS).23 Chang et al found that glaucoma patients had decreased FA within the visual pathway.24 However, existing findings have mainly focused on changes in the visual cortices and visual pathway in glaucoma patients. A previous study demonstrated that glaucoma patients also face higher risks of occurrence of cognitive decline disorders such as Alzheimer’s and Parkinson’s diseases. Besides, various previous studies reported that the glaucoma patients presented cognitive decline,25–27 which indicated that abnormal central nervous system function might be involved in the pathological mechanisms of glaucoma. We hypothesized that glaucoma patients might be associated with spontaneous neural activity changes related to impaired cognition and emotion.
Low-frequency oscillations (LFOs) have been reported to be closely related to various physiological activities28,29 and gray matter (GM) volume.30 Also, LFOs are closely linked to neuronal activity.31 The amplitude of the spontaneous low-frequency fluctuation (ALFF) method, a resting-state fMRI method, is widely used to assess the extent of LFOs. ALFF indicates the total power within a specific frequency range and the extent of LFOs.32 LFOs in different frequency bands were shown to correlate with specific properties and physiological functions.33 Previous studies suggest that reating state- low frequency oscillations (rs-LFOs) are correlated with synchronized delta electroencephalogram (EEG) oscillations. Concurrent EEG-rsfMRI connectivity-based studies have shown that a subset of resting state-magnetic resonance imaging (rs-fMRI) networks is positively modulated by delta/theta and upper beta/lower gamma EEG responses and negatively modulated by EEG alpha.34 Zuo et al were the first to extend this concept to rs-fMRI. They evaluated LFOs in four distinct bands – slow-5 (0.01–0.027 Hz), slow-4 (0.027–0.073), slow-3 (0.073–0.198 Hz), and slow-2 (0.198–0.25 Hz) – and demonstrated differential and interactive amplitude effects within them in several brain regions.35 In this study, we have chosen to adopt the Buzsaki framework36 and only examine the slow-5 (0.01–0.027 Hz) and slow-4 (0.027–0.073) bands because these encompass most of the traditional 0.01–0.08 frequency spectrum and have minimal overlap with potential physiological noise frequency. The signals of slow-6, slow-3, and slow-2 were discarded as these low-frequency bands are sensitive and influenced by white matter (WM) signals and physiological noises. Slow-4 has greater test–retest reliability for low-frequency fluctuation (LFF) amplitude measure and more reliable blood oxygen level dependent imaging (BOLD) fluctuation amplitude voxels than slow-5. Slow-5 showed that higher power localizes more within default-mode regions, while slow-4 is most robust in the basal ganglia and midbrain. Lower-frequency oscillations are integrated into large neuronal networks. Previous neuroimaging studies have widely applied the frequency-dependent ALFF method to reveal the neural mechanism of psychiatric disorders.37–39 Our previous study revealed that primary angle-closure glaucoma (PACG) patients had significantly reduced ALFF values in the precentral gyrus and frontal gyrus at a frequency band of 0.01–0.08 Hz.40 However, it is largely unknown whether the specific frequency-dependent neural activity changes occur in PACG individuals.
The purpose of this study was to determine whether PACG individuals show abnormal frequency-dependent spontaneous neural activity (slow-4 and slow-5 bands) compared to NS. We also investigated the relationship between the spontaneous neural activity in different bands and visual function (RNFL and VFs) in the PACG group. Our results could provide useful information to explore the underlying neurophysiological mechanisms of PACG individuals.
Patients and methods
Ophthalmic assessment
In the PACG group, mean retinal fiber layer thickness was obtained by using CIRRUS™ HD-OCT in each subject. The LogMAR values of the best-corrected VA of both eyes were measured in each group using the LogMAR table. All PACG individuals were preformed with visual field test (Humphrey Field Analyzer II; Carl Zeiss Meditec AG, Jena, Germany).
Image acquisition
MRI scanning was performed on a 3 T MRI scanner (Siemens, Erlangen, Germany) with an eight-channel head coil. High-resolution T1-weighted images were acquired using a three-dimensional spoiled gradient-recalled sequence with the following parameters: repetition time =1,900 ms, echo time =2.26 ms, thickness =1.0 mm, gap =0.5 mm, acquisition matrix =256×256, field of view =250×250 mm, flip angle =9°, slices =176. Functional images were obtained by using gradient-echo-planar imaging sequence with the following parameters: repetition time =2,000 ms, echo time =25 ms, thickness =3.0 mm, gap =1.2 mm, acquisition matrix =64×64, flip angle =90°, field of view =240×240 mm2, voxel size =3.6×3.6×3.6 mm3, 35 axial). All subjects underwent the MRI scanning with the eyes closed and without falling asleep.
fMRI data processing
The functional images were preprocessed using Statistical Parametric Mapping SPM12 (http://www.fil.ion.ucl.ac.uk/spm/) and the toolbox for Data Processing Assistant & Analysis for Brain Imaging (DPABI, http://rfmri.org/dpabi) software41 implemented in MATLAB 2013a (MathWorks, Natick, MA, USA). Briefly, it consists of the following steps:
- DICOM format of the functional images was converted to NIFTI format; the first ten volumes function images of each subject were discarded due to the signal reaching equilibrium.
- The remaining 230 volumes function images were corrected for slice timing effects, motion corrected, and realigned. The subjects whose head motion exceeded 2 mm or for whom the rotation exceeded 1.5° during scanning were excluded.
- Individual T1-weighted MPRAGE structural images were registered to the mean fMRI data; then, the resulting aligned T1-weighted images were segmented using the diffeomorphic anatomical registration using exponentiated lie algebra toolbox for improving spatial precise in the normalization of fMRI data.42 Normalized data (in Montreal Neurological Institute 152 space) were re-sliced at a resolution of 3×3×3 mm3 and spatially smoothed with a 6 mm full width at half-maximum Gaussian kernel.
- Linear trends were removed.
- Finally, the linear regression was used to reduce the contribution of non-neuronal fluctuations, including Friston 24-parameter head motion parameters, WM signal, cerebrospinal fluid, and global signal.
No temporal filtering was implemented during preprocessing. We divided the full frequency range (0–0.25 Hz) into five different bands: slow-6 (0–0.01 Hz), slow-5 (0.01–0.027 Hz), slow-4 (0.027–0.073 Hz), slow-3 (0.073–0.198 Hz), and slow-2 (0.198–0.25 Hz). The signals of slow-6, slow-3, and slow-2 were discarded as these low-frequency bands are sensitive and influenced by WM signals and physiological noises. Thus, we computed ALFF in the slow-5 and slow-4 bands.35,36
ALFF computing
According to a previous study,43 the ALFF was calculated using the Resting-State fMRI Data Analysis Toolkit (http://www.restfmri.net). Briefly, we converted the smoothed signal of each voxel from time domain to frequency domain via a fast Fourier transform algorithm to obtain the power spectrum. This averaged square root was determined as the ALFF. The ALFF of each voxel was divided by the global mean ALFF value for each participant to reduce the global effects of variability. All the ALFF of each voxel was z-transformed with Fisher’s r-to-z transformation to reduce the influence of individual variation for group statistical comparisons.
Statistical analyses
Independent-samples t-test was performed to compare best-corrected VA and RNFL thickness between the two groups.
To determine the effects of group, frequency band, and interaction between frequency band and group on ALFF, a repeated-measures ANOVA method was used with SPM8 software (Wellcome Institute of Cognitive Neurology, London, UK) on a voxel-by-voxel basis with two groups as a between-subject factor and frequency band (slow-4 and slow-5) as a repeated measure. All the statistical maps were corrected for multiple comparisons using Gaussian random field (GRF) theory (voxel-level P<0.001, GRF correction, cluster-level P<0.01). For clusters showing significant main effects and an interaction between group and frequency band, post hoc two-sample t-tests were further performed at the two frequency band.
Pearson’s correlation was conducted to calculate the relationships between the ALFF values of different brain regions in slow-4 band and slow-5 band and clinical variables in the PACG group using the SPSS software version 16.0 (SPSS Inc., Chicago, IL, USA).
Ethical statement
The research protocol followed the Declaration of Helsinki and was approved by the medical ethics committee of the First Affiliated Hospital of Nanchang University. All subjects who agreed to participate in this study gave a written informed consent form.
In total, 52 patients with PACG (24 males and 28 females) were enrolled from the Ophthalmology Department of the First Affiliated Hospital of Nanchang University. The diagnostic criteria of PACG were: 1) IOP greater than 21 mmHg; 2) optic disc/cup area .0.6; 3) typical glaucomatous vision field defect (such as nasal step, tunnel vision, and so on); and 4) absence of any other ocular diseases (strabismus, amblyopia, cataracts, retinal degeneration, and so on). (The diagnosis of PACG was established by two experienced ophthalmologists.)
Fifty-two healthy controls (24 males and 28 females) were also recruited for this study. The inclusion criteria were: 1) absence of any ocular disease with uncorrected visual acuity (VA) .1.0; 2) no cardiovascular system diseases and psychiatric disorders; and 3) being able to be scanned with MRI (eg, no cardiac pacemaker or implanted metal devices).
Results
Demographics and visual measurements
The clinical variables of PACG group and NS group including best-corrected VA, VF, mRNFL thickness, and duration of PACG are shown in Table 1.
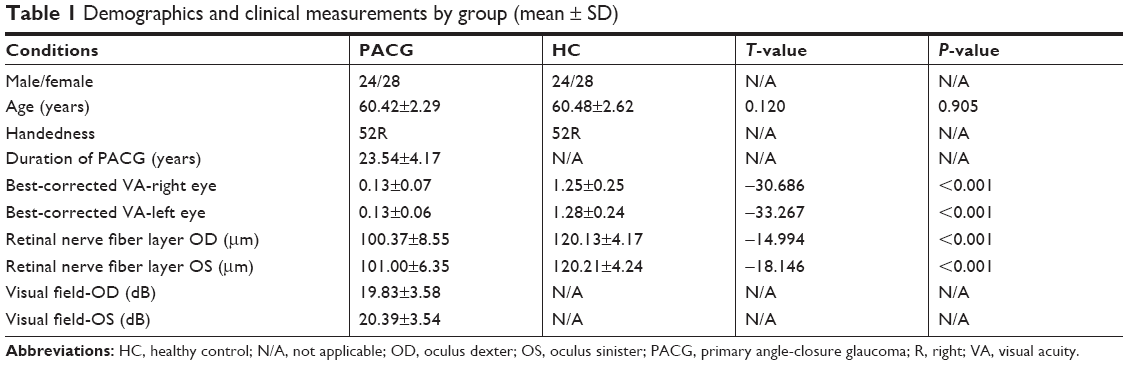 | Table 1 Demographics and clinical measurements by group (mean ± SD) |
ALFF differences
The effect of groups in both groups
Brain regions showing a significant main effect for group included the right inferior occipital gyrus (Brodmann area [BA] 18) and right superior frontal gyrus (BA 10) (PACG > NS), and the left middle occipital gyrus (BA 19), right middle occipital gyrus (BA 19), left precentral/postcentral gyrus (BA 6), right precentral gyrus (BA 6), and left inferior parietal lobule (BA 40) (PACG < NS), as shown in Figure 1 and Table 2 (repeated-measures ANOVA, voxel-level P<0.001, GRF correction, cluster-level P<0.01).
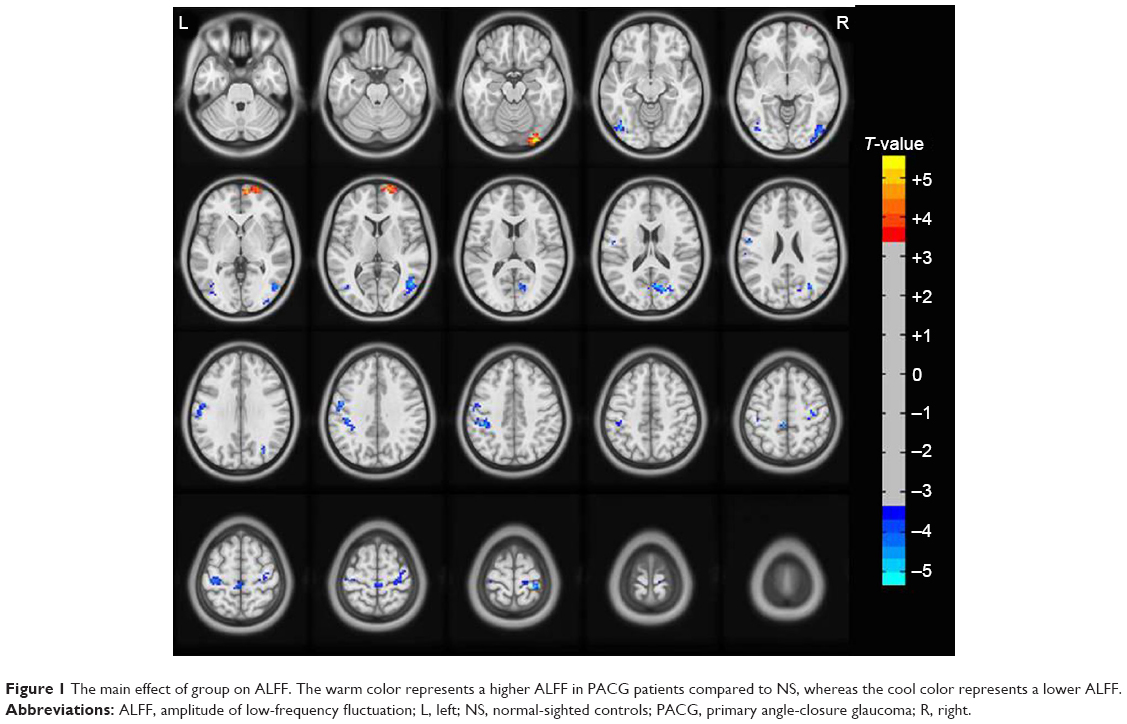 | Figure 1 The main effect of group on ALFF. The warm color represents a higher ALFF in PACG patients compared to NS, whereas the cool color represents a lower ALFF. |
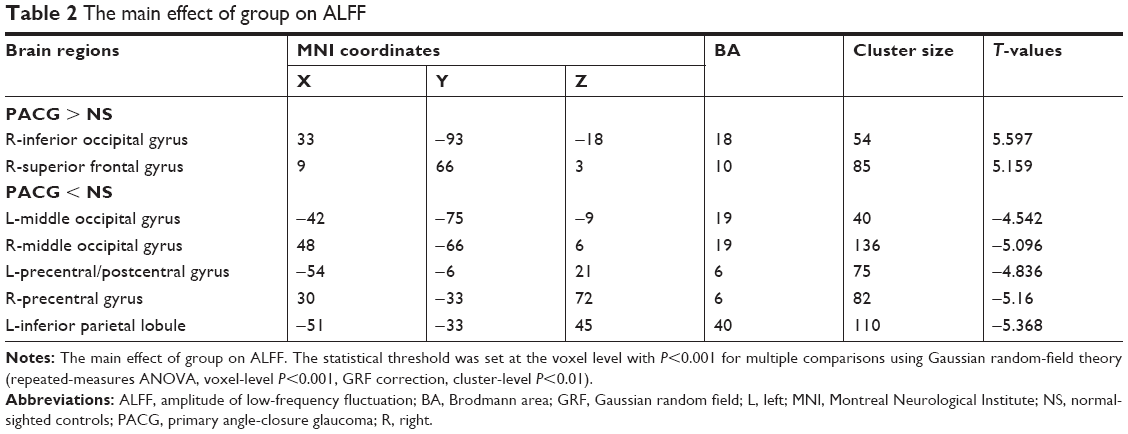 | Table 2 The main effect of group on ALFF |
The effect of frequency band in both groups
Compared to slow-5 band, slow-4 band showed higher ALFF values in the bilateral posterior cingulate gyrus (BA 23/31) and bilateral precuneus (BA 7) and lower ALFF values in bilateral frontal lobe (BA 11), right fusiform (BA 38), and right cerebellum posterior lobe, as shown in Figure 2 and Table 3 (repeated-measures ANOVA, voxel-level P<0.001, GRF correction, cluster-level P<0.01).
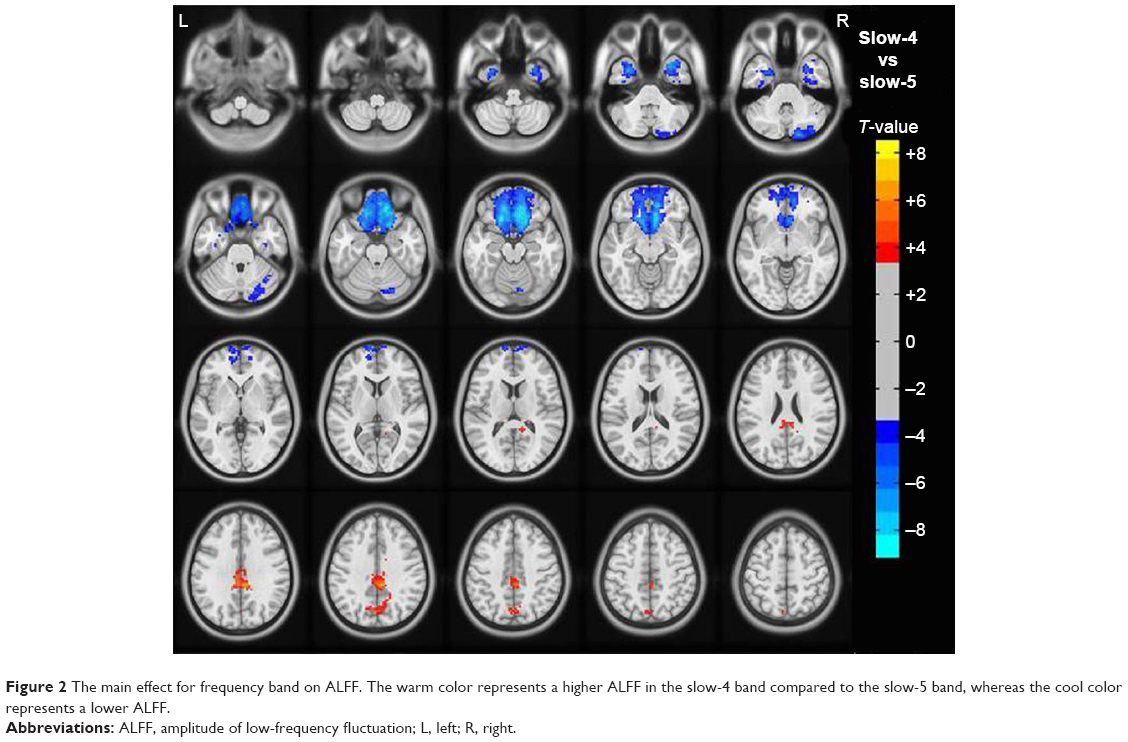 | Figure 2 The main effect for frequency band on ALFF. The warm color represents a higher ALFF in the slow-4 band compared to the slow-5 band, whereas the cool color represents a lower ALFF. |
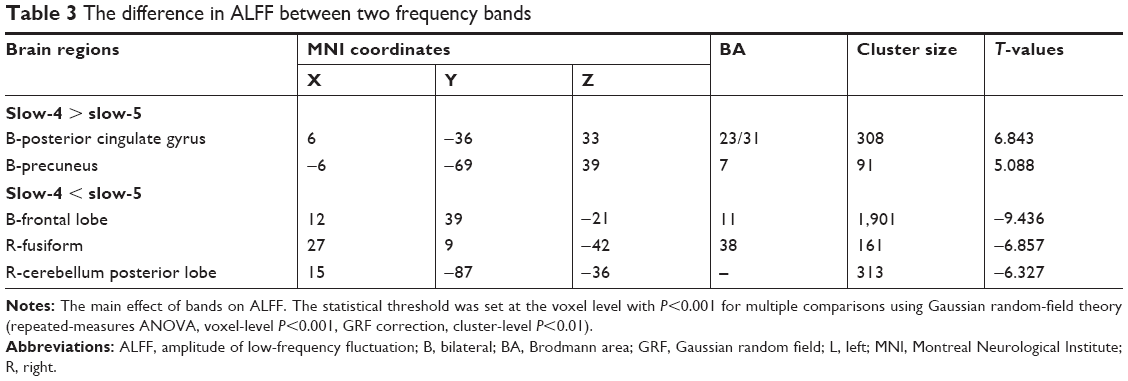 | Table 3 The difference in ALFF between two frequency bands |
Frequency band slow-4 (0.027 and 0.073 Hz)
Compared to NS, PACG patients had increased ALFF values in the right inferior occipital gyrus (BA 18). In contrast, PACG patients exhibited decreased ALFF values in the left middle occipital gyrus (BA 19), left precentral gyrus (BA 3), and left postcentral gyrus (BA 4), as shown in Figure 3A (voxel-level P<0.001, GRF correction, cluster-level P<0.01). The mean ALFF values of different brain regions in the two groups in slow-4 band are shown with a histogram (Figure 3C; Table 4).
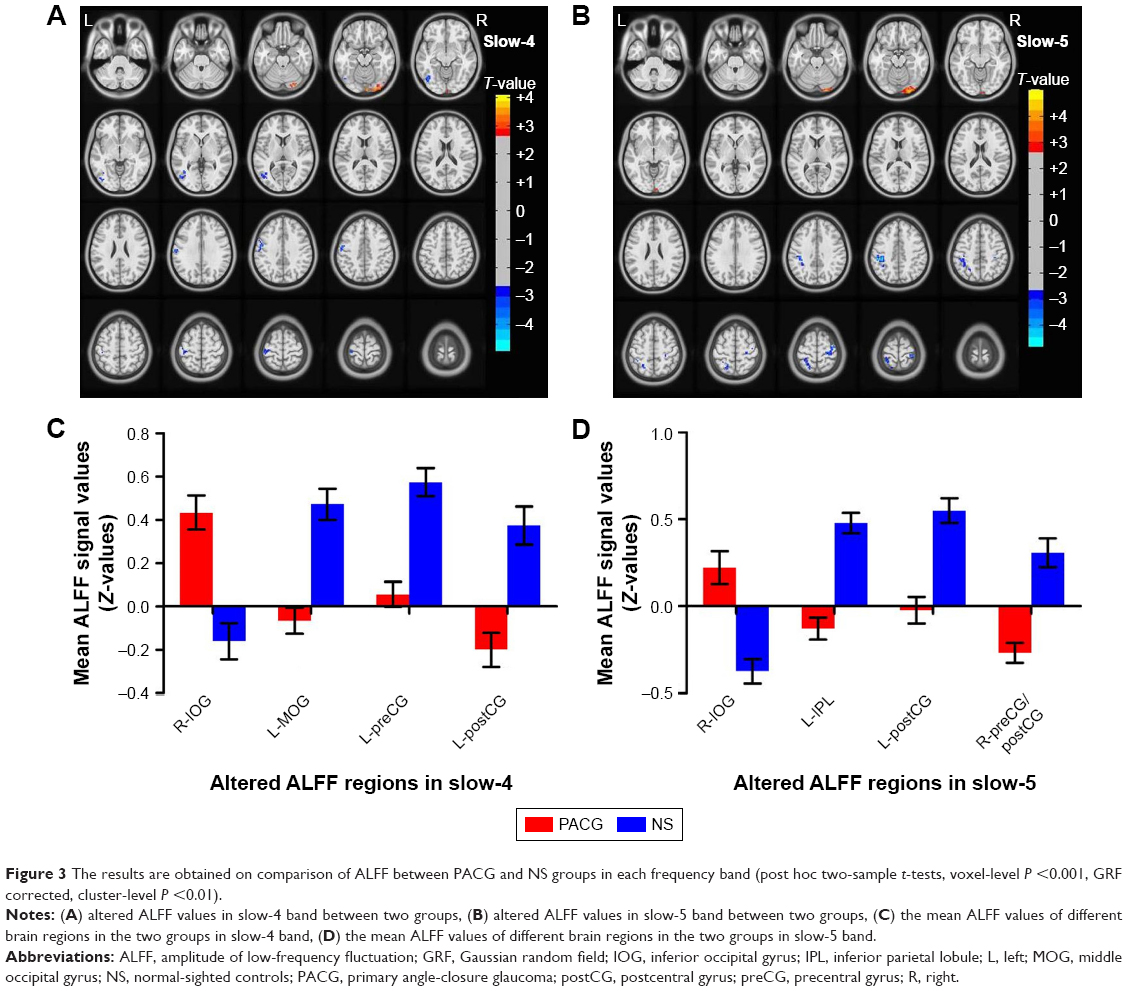 | Figure 3 The results are obtained on comparison of ALFF between PACG and NS groups in each frequency band (post hoc two-sample t-tests, voxel-level P <0.001, GRF corrected, cluster-level P <0.01). |
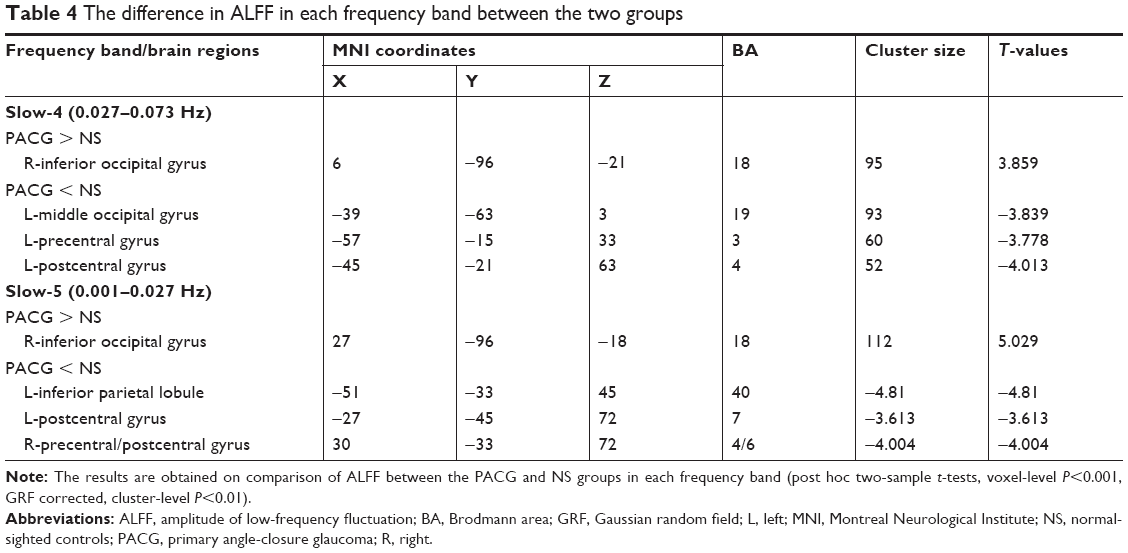 | Table 4 The difference in ALFF in each frequency band between the two groups |
Frequency band slow-5 (0.010–0.027 Hz)
Compared to NS, PACG patients had increased ALFF values in the right inferior occipital gyrus (BA 18). In contrast, PACG patients exhibited decreased ALFF values in the left inferior parietal lobule (BA 40), left postcentral gyrus (BA 7), and right precentral/postcentral gyrus (BA 4/6), as shown in Figure 3B (voxel-level P<0.001, GRF correction, cluster-level P<0.01). The mean ALFF values of different brain regions in the two groups in slow-5 band are shown with a histogram (Figure 3D; Table 4).
Receiver operating characteristic (ROC) curve
The mean ALFF values of the different brain regions were analyzed by the ROC curves. The areas under the curve (AUCs) for ALFF (slow-4 band) values were as follows: PACG > NS, for right inferior occipital gyrus 0.235 (P<0.001; 95% CI =0.145–0.326); PACG < NS for left middle occipital gyrus 0.793 (P<0.001; 95% CI =0.708–0.879), left precentral gyrus 0.797 (P<0.001; 95% CI =0.714–0.880), and left postcentral gyrus 0.742 (P<0.001; 95% CI =0.649–0.835), as shown in Figure 4A. The AUCs for ALFF (slow-5 band) values were: PACG > NS, for right inferior occipital gyrus 0.233 (P<0.001; 95% CI =0.143–0.324); PACG < NS for left inferior parietal lobule 0.843 (P<0.001; 95% CI =0.765–0.922), left postcentral gyrus 0.781 (P<0.001; 95% CI =0.693–0.869), and right precentral/postcentral gyrus 0.793 (P<0.001; 95% CI =0.707–0.880), as shown in Figure 4B.
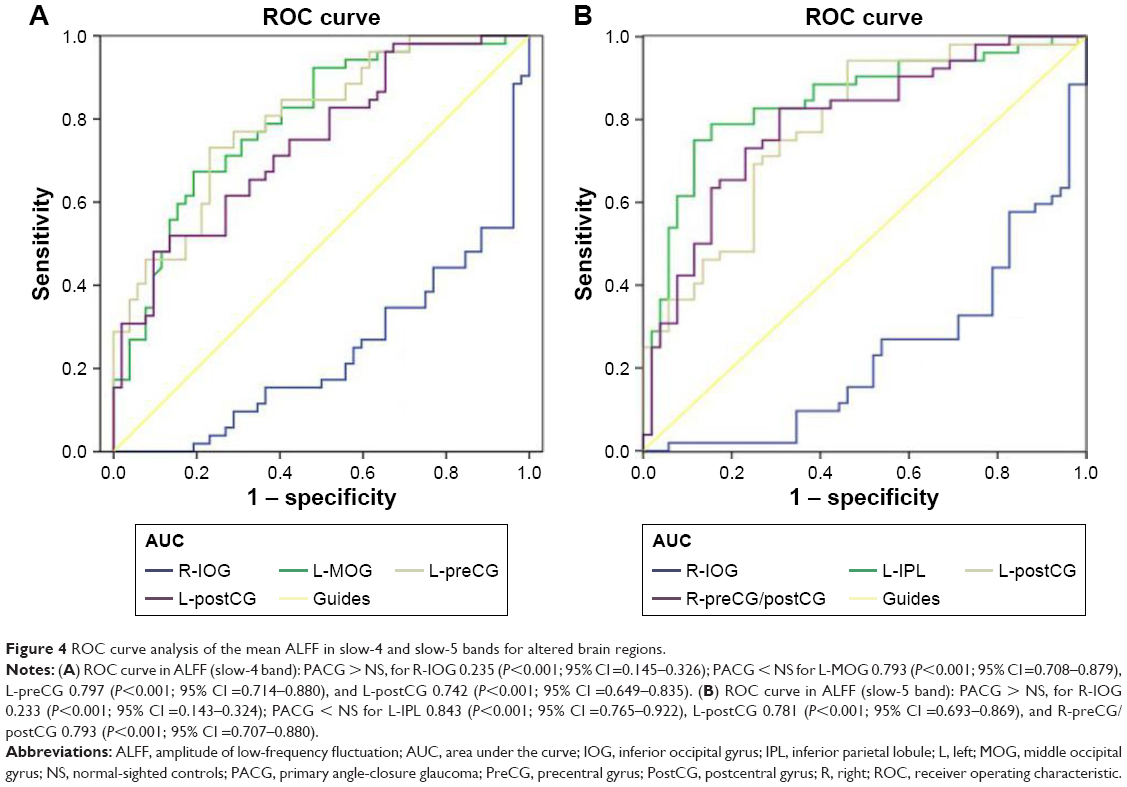 | Figure 4 ROC curve analysis of the mean ALFF in slow-4 and slow-5 bands for altered brain regions. |
Correlation analysis
In PACG group, the greater mean ALFF values of the right inferior occipital gyrus were associated with smaller RNFL thickness-oculus dexter (thickness-OD; r=0.595, P<0.001; Figure 5A) and oculus sinister (OS; r=0.560, P<0.001; Figure 5B) and with greater VF-OD (r=−0.830, P<0.001; Figure 5C) and OS (r=−0.837, P<0.001; Figure 5D).
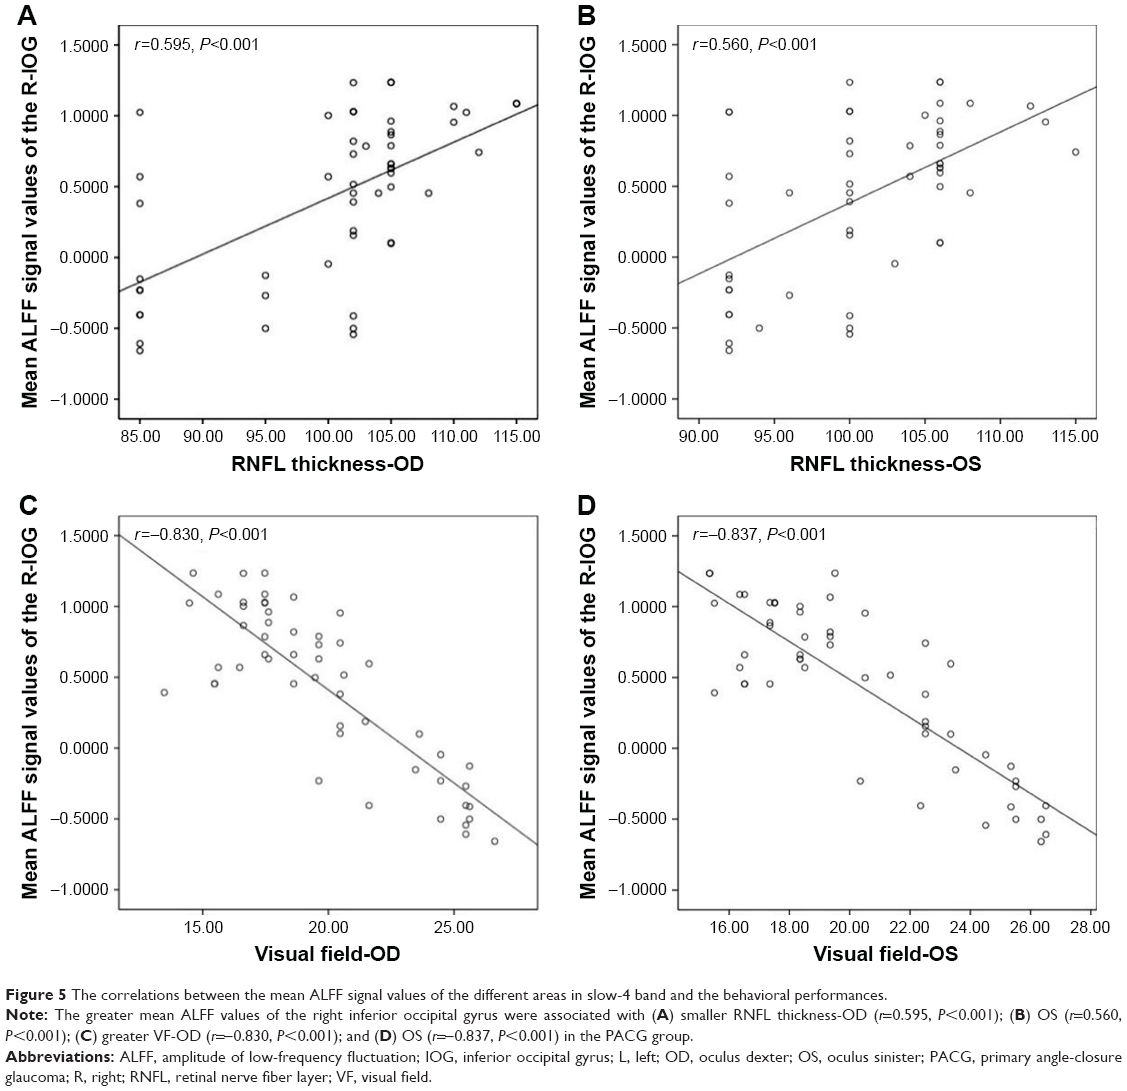 | Figure 5 The correlations between the mean ALFF signal values of the different areas in slow-4 band and the behavioral performances. |
Discussion
The aim of this study was to determine whether there are local spontaneous fluctuations in PACG patients under different frequency bands. Neural oscillations in different frequency bands within the same structure do not co-occur, and signals in such frequency bands might indicate different physiological mechanisms. Consistent with a previous study, the signals of slow-6, slow-3, and slow-2 were discarded as these low-frequency bands are sensitive and influenced by non-neural signals. Thus, we selected and analyzed frequency-specific effects in the slow-5 (0.01–0.027 Hz) and slow-4 (0.027–0.073 Hz) bands in PACG patients. Our findings revealed that PACG group had abnormal spontaneous brain activity in widespread brain regions related to visual cortices, sensorimotor cortices, and frontal lobe at two different frequency bands (slow-4 and slow-5 bands) compared with NS. Furthermore, in the slow-4 band, the greater mean ALFF values of the right inferior occipital gyrus were associated with smaller RNFL thickness and greater VF (dB) in the PACG group.
Differences in ALFF between groups
Compared with NS, the PACG group showed significantly decreased ALFF values in the left middle occipital gyrus, right middle occipital gyrus, left precentral/postcentral gyrus, right precentral gyrus, and left inferior parietal lobule. Retina input reduced due to ganglion cell death in PACG individuals. The loss of visual input from the eye leads to diminished activity in the corresponding parts of the visual cortex. Previous neuroimaging studies have demonstrated that glaucoma patients exhibit functional dysfunction in the visual cortices. Using the regional homogeneity (ReHo) method, Chen et al found that PACG individuals displayed decreased regional spontaneous neural activity values in the bilateral middle occipital gyrus in typical 0.01–0.08 band compared to the NS.19 Also, Frezzotti et al found that POAG patients had decreased FC in the visual networks.44 Dai et al also demonstrated that POAG patients were associated with decreased FC between the primary visual cortex (BA 17) and the left middle occipital gyrus.17 Retinal ganglion cell death is the pathological change in glaucoma. Thus, glaucoma patients might show transsynaptic degeneration (the degenerating axons originating from the retinal ganglion cell death of the directly connected neurons, and this degeneration is propagated toward more posterior parts of the visual pathways and may eventually involve the visual cortex). According to Wang et al, POAG patients had reduced cerebral blood flow in the visual cortices, which correlated with the severity of POAG.45 Wang et al reported that POAG group patients showed decreased cortical thickness in the bilateral lateral geniculate body (LGN) and right V1 compared to NS.46 Fukuda et al also found that POAG patients showed decreased GM density in the visual cortex in BA 17, BA 18, and BA 19.47 Consistent with these findings, our results revealed reduced ALFF values in the left middle occipital gyrus and right middle occipital gyrus in the PACG group, which might be caused by a reduced retina input and transsynaptic degeneration. Thus, we speculated that PACG induces a dysfunction in the visual network.
Remarkably, another important finding is that decreased ALFF was observed in the precentral/postcentral gyrus in PACG individuals. The precentral and postcentral gyri are the sensory and motor cortex, respectively, which play an important role in the sensory and motor control functions. A previous fMRI study reported that PACG individuals showed decreased ALFF values in the bilateral precentral gyrus relative to NS in typical 0.01–0.08 Hz band.40 Besides, previous ALFF studies demonstrated that POAG patients also exhibited abnormal spontaneous neural activity in the sensory and motor cortices.48,49 A voxel-based morphometry study previously reported that POAG patients exhibited reduced GM densities in the right precentral gyrus.50 Thus, we speculated that PACG could trigger impairment of the sensorimotor network. The inferior parietal lobule (IPL) is the terminal of the dorsal stream, which plays an important role in the coordination of the visual–motor function and is a core component of the parieto-occipital pathway. The IPL is involved in oculomotor, attentional mechanisms, and eye–hand coordination. Furthermore, the IPL is subserved by distinct subcortical systems from the superior colliculus, hippocampus, and cerebellum.51 Therefore, we hypothesized that PACG could be linked to the reorganization of the dorsal stream and impairment of the oculomotor and attentional function.
Remarkably, PACG group individuals exhibited significantly increased ALFF values in the right inferior occipital gyrus. Because the inferior occipital gyrus plays an important role in face processing,52,53 the hyperfunction of the inferior occipital gyrus could reflect the visual function compensating for the VF defect in PACG individuals.
Differences in ALFF between frequency bands
In this study, we noted abnormal specific frequency differences in spontaneous neural activity in the PACG group. Greater ALFF values in the slow-4 band than in slow-5 band have been identified in the bilateral posterior cingulate gyrus and bilateral precuneus. On the other hand, greater ALFF values in the slow-5 band than in slow-4 band have been identified in the bilateral frontal lobe, right fusiform, and right cerebellum posterior lobe in the PACG group. Lower-frequency oscillations are integrated into large neuronal networks, whereas higher-frequency oscillations are related to default mode networks (DMNs).35,36 The frontal lobe and posterior cingulate gyrus are the core components of the DMNs, and DMN exists in the human brain in a resting state.54,55 Previous studies have detected disturbed DMN FC in POAG groups.49,56 Our results suggest that higher-frequency oscillations might reflect dysfunction of DMN in PACG individuals. Compared to slow-4 band, the higher slow-5 band brain regions were located in the frontal lobe, fusiform, and cerebellum posterior lobe. These brain regions might indicate the abnormal large-scale cortical network in PACG individuals. Dai et al reported that POAG individuals showed decreased FC between V1 and left fusiform and left cerebellum and increased FC between V1 and middle frontal gyrus relative to NS.17 Thus, our result suggests that the higher slow-5 band brain regions might reflect disturbed cortical network related to cognition and visual–motor function.
Differences in ALFF at slow-4 and slow-5 frequency bands across groups
Compared to the NS group, the PACG group showed increased ALFF values in the right inferior occipital gyrus and decreased ALFF values in the left middle occipital gyrus and the left precentral/postcentral gyrus in the slow-4 band. PACG group also showed increased ALFF values in the right inferior occipital gyrus and decreased ALFF values in the left inferior parietal lobule, left postcentral gyrus, and right precentral/postcentral gyrus in the slow-5 band. PACG patients showed lower ALFF values in the visual cortices and precentral/postcentral gyrus both in the slow-4 and slow-5 bands, consistent with the earlier fMRI studies.19,57 Li et al demonstrated that in POAG patients, the slow-5 band showed abnormalities in the left posterior cingulate cortex, right limbic lobe, left inferior parietal lobule, right middle cingulate cortex, right middle frontal gyrus, left postcentral gyrus, and left cuneus. However, the slow-4 band showed alterations in the left middle temporal gyrus, left lingual gyrus, right cuneus, left postcentral gyrus, and left cuneus.49 Our results suggest that PACG individuals show abnormal neural activity in the visual cortices, sensory and motor cortices in both bands. However, POAG patients showed more widespread abnormal neural activity brain regions than PACG individuals. Furthermore, PACG individuals exhibited decreased ALFF values in the left inferior parietal lobule in show-5 band. IPL is involved in oculomotor and attentional mechanisms, which plays an important role in the coordination of the visual–motor function. Meanwhile, the IPL is an integral part of a critical frontoparietal network.58 Thus, we speculated that specific neural activity changes in different brain regions in the two bands occurred in PACG individuals, which might reflect the dysfunction of visual network, sensorimotor network, and frontoparietal network in slow-4 and slow-5 bands. Our results suggest the importance of ALFF values within different frequency bands in understanding the neural mechanism of PACG.
Correlation analysis between ALFF and visual function in PACG group
In PACG individuals, the greater mean ALFF values of the inferior occipital gyrus were associated with smaller RNFL thickness and greater VF in the slow-4 band. Previous studies have shown that the VF defect and RNFL thickness are closely correlated with the severity of PACG.59,60 Hence, we speculate that the ALFF in the slow-4 band might be more sensitive to reflect the neurophysiological function.
Conclusion
Our results highlighted that the PACG group showed abnormal, spontaneous neural activities in the visual cortices, sensorimotor cortices, frontal lobe, frontoparietal network, and DMN at two frequency bands, which might indicate the impaired vision and cognition and emotion function in PACG individuals. These findings offer important insight into the understanding of the neural mechanism of PACG.
Disclosure
The authors report no conflicts of interest in this work.
References
Quigley HA, Broman AT. The number of people with glaucoma worldwide in 2010 and 2020. Br J Ophthalmol. 2006;90(3):262–267. | ||
Suri F, Yazdani S, Chapi M, et al. COL18A1 is a candidate eye iridocorneal angle-closure gene in humans. Hum Mol Genet. 2018;27(21):3772–3786. | ||
Kavitha S, Zebardast N, Palaniswamy K, et al. Family history is a strong risk factor for prevalent angle closure in a South Indian population. Ophthalmology. 2014;121(11):2091–2097. | ||
Smith SD, Singh K, Lin SC, et al. Evaluation of the anterior chamber angle in glaucoma: a report by the American Academy of Ophthalmology. Ophthalmology. 2013;120(10):1985–1997. | ||
Miglior S, Bertuzzi F. Relationship between intraocular pressure and glaucoma onset and progression. Curr Opin Pharmacol. 2013;13(1):32–35. | ||
Flammer J, Orgül S, Costa VP, et al. The impact of ocular blood flow in glaucoma. Prog Retin Eye Res. 2002;21(4):359–393. | ||
Mozaffarieh M, Grieshaber MC, Flammer J. Oxygen and blood flow: players in the pathogenesis of glaucoma. Mol Vis. 2008;14:224–233. | ||
Kong X, Yan M, Sun X, Xiao Z. Anxiety and depression are more prevalent in primary angle closure glaucoma than in primary open-angle glaucoma. J Glaucoma. 2015;24(5):e57–e63. | ||
Agorastos A, Skevas C, Matthaei M, et al. Depression, anxiety, and disturbed sleep in glaucoma. J Neuropsychiatry Clin Neurosci. 2013;25(3):205–213. | ||
Moon JY, Kim HJ, Park YH, et al. Association between open-angle glaucoma and the risks of Alzheimer’s and Parkinson’s diseases in South Korea: a 10-year nationwide cohort study. Sci Rep. 2018;8(1):11161. | ||
Yan Z, Liao H, Chen H, et al. Elevated intraocular pressure induces amyloid-β deposition and tauopathy in the lateral geniculate nucleus in a monkey model of glaucoma. Invest Ophthalmol Vis Sci. 2017;58(12):5434–5443. | ||
Tezel G. TNF-alpha signaling in glaucomatous neurodegeneration. Prog Brain Res. 2008;173:409–421. | ||
Borges VM, Danesh-Meyer HV, Black JM, Thompson B. Functional effects of unilateral open-angle glaucoma on the primary and extrastriate visual cortex. J Vis. 2015;15(15):9. | ||
Murphy MC, Conner IP, Teng CY, et al. Retinal structures and visual cortex activity are impaired prior to clinical vision loss in glaucoma. Sci Rep. 2016;6:31464. | ||
Qing G, Zhang S, Wang B, Wang N. Functional MRI signal changes in primary visual cortex corresponding to the central normal visual field of patients with primary open-angle glaucoma. Invest Ophthalmol Vis Sci. 2010;51(9):4627–4634. | ||
Duncan RO, Sample PA, Weinreb RN, Bowd C, Zangwill LM. Retinotopic organization of primary visual cortex in glaucoma: a method for comparing cortical function with damage to the optic disk. Invest Ophthalmol Vis Sci. 2007;48(2):733–744. | ||
Dai H, Morelli JN, Ai F, et al. Resting-state functional MRI: functional connectivity analysis of the visual cortex in primary open-angle glaucoma patients. Hum Brain Mapp. 2013;34(10):2455–2463. | ||
Frezzotti P, Giorgio A, Motolese I, et al. Structural and functional brain changes beyond visual system in patients with advanced glaucoma. PLoS One. 2014;9(8):e105931. | ||
Chen W, Zhang L, Xu YG, Zhu K, Luo M, Yg X. Primary angle-closure glaucomas disturb regional spontaneous brain activity in the visual pathway: an fMRI study. Neuropsychiatr Dis Treat. 2017;13:1409–1417. | ||
Wang J, Li T, Zhou P, et al. Altered functional connectivity within and between the default model network and the visual network in primary open-angle glaucoma: a resting-state fMRI study. Brain Imaging Behav. 2017;11(4):1154–1163. | ||
Yu L, Xie B, Yin X, et al. Reduced cortical thickness in primary open-angle glaucoma and its relationship to the retinal nerve fiber layer thickness. PLoS One. 2013;8(9):e73208. | ||
Yu L, Yin X, Dai C, et al. Morphologic changes in the anterior and posterior subregions of V1 and V2 and the V5/MT+ in patients with primary open-angle glaucoma. Brain Res. 2014;1588:135–143. | ||
Dai H, Yin D, Hu C, et al. Whole-brain voxel-based analysis of diffusion tensor MRI parameters in patients with primary open angle glaucoma and correlation with clinical glaucoma stage. Neuroradiology. 2013;55(2):233–243. | ||
Chang ST, Xu J, Trinkaus K, et al. Optic nerve diffusion tensor imaging parameters and their correlation with optic disc topography and disease severity in adult glaucoma patients and controls. J Glaucoma. 2014;23(8):513–520. | ||
Yochim BP, Mueller AE, Kane KD, Kahook MY. Prevalence of cognitive impairment, depression, and anxiety symptoms among older adults with glaucoma. J Glaucoma. 2012;21(4):250–254. | ||
Ehrlich JR, Moroi SE. Glaucoma, cognitive decline, and healthy aging. JAMA Ophthalmol. 2017;135(7):740–741. | ||
Mancino R, Martucci A, Cesareo M, et al. Glaucoma and Alzheimer disease: one age-related neurodegenerative disease of the brain. Curr Neuropharmacol. 2018;16(7):971–977. | ||
Biswal B, Yetkin FZ, Haughton VM, Hyde JS. Functional connectivity in the motor cortex of resting human brain using echo-planar MRI. Magn Reson Med. 1995;34(4):537–541. | ||
Fox MD, Snyder AZ, Vincent JL, Corbetta M, van Essen DC, Raichle ME. From the cover: the human brain is intrinsically organized into dynamic, anticorrelated functional networks. Proc Natl Acad Sci U S A. 2005;102(27):9673–9678. | ||
Zhao ZL, Fan FM, Lu J, et al. Changes of gray matter volume and amplitude of low-frequency oscillations in amnestic MCI: an integrative multi-modal MRI study. Acta Radiol. 2015;56(5):614–621. | ||
Schroeter ML, Schmiedel O, von Cramon DY. Spontaneous low-frequency oscillations decline in the aging brain. J Cereb Blood Flow Metab. 2004;24(10):1183–1191. | ||
Shmuel A, Leopold DA. Neuronal correlates of spontaneous fluctuations in fMRI signals in monkey visual cortex: implications for functional connectivity at rest. Hum Brain Mapp. 2008;29(7):751–761. | ||
Zang YF, He Y, Zhu CZ, et al. Altered baseline brain activity in children with ADHD revealed by resting-state functional MRI. Brain Dev. 2007;29(2):83–91. | ||
Bridwell DA, Wu L, Eichele T, Calhoun VD. The spatiospectral characterization of brain networks: fusing concurrent EEG spectra and fMRI maps. Neuroimage. 2013;69:101–111. | ||
Zuo XN, Di Martino A, Kelly C, et al. The oscillating brain: complex and reliable. Neuroimage. 2010;49(2):1432–1445. | ||
Buzsáki G, Draguhn A. Neuronal oscillations in cortical networks. Science. 2004;304(5679):1926–1929. | ||
Li Y, Jing B, Liu H, et al. Frequency-dependent changes in the amplitude of low-frequency fluctuations in mild cognitive impairment with mild depression. J Alzheimers Dis. 2017;58(4):1175–1187. | ||
Yue Y, Jia X, Hou Z, Zang Y, Yuan Y. Frequency-dependent amplitude alterations of resting-state spontaneous fluctuations in late-onset depression. Biomed Res Int. 2015;2015(4):1–9. | ||
Zhou F, Huang S, Zhuang Y, Gao L, Gong H. Frequency-dependent changes in local intrinsic oscillations in chronic primary insomnia: a study of the amplitude of low-frequency fluctuations in the resting state. Neuroimage Clin. 2017;15:458–465. | ||
Huang X, Zhong YL, Zeng XJ, et al. Disturbed spontaneous brain activity pattern in patients with primary angle-closure glaucoma using amplitude of low-frequency fluctuation: a fMRI study. Neuropsychiatr Dis Treat. 2015;11:1877–1883. | ||
Chao-Gan Y, Yu-Feng Z. DPARSF: a MATLAB toolbox for “pipeline” data analysis of resting-state fMRI. Front Syst Neurosci. 2010;4:13. | ||
Goto M, Abe O, Aoki S, et al; Japanese Alzheimer’s Disease Neuroimaging Initiative. Diffeomorphic anatomical registration through exponentiated Lie algebra provides reduced effect of scanner for cortex volumetry with atlas-based method in healthy subjects. Neuroradiology. 2013;55(7):869–875. | ||
Zang YF, He Y, Zhu CZ, et al. Altered baseline brain activity in children with ADHD revealed by resting-state functional MRI. Brain Dev. 2007;29(2):83–91. | ||
Frezzotti P, Giorgio A, Toto F, De Leucio A, De Stefano N. Early changes of brain connectivity in primary open angle glaucoma. Hum Brain Mapp. 2016;37(12):4581–4596. | ||
Wang Q, Chen W, Qu X, et al. Reduced cerebral blood flow in the visual cortex and its correlation with glaucomatous structural damage to the retina in patients with mild to moderate primary open-angle glaucoma. J Glaucoma. 2018;27(9):816–822. | ||
Wang J, Li T, Sabel BA, et al. Structural brain alterations in primary open angle glaucoma: a 3T MRI study. Sci Rep. 2016;6(1):18969. | ||
Fukuda M, Omodaka K, Tatewaki Y, et al. Quantitative MRI evaluation of glaucomatous changes in the visual pathway. PLoS One. 2018;13(7):e0197027. | ||
Liu Z, Tian J. Amplitude of low frequency fluctuation in primary open angle glaucoma: a resting state fMRI study. Conf Proc IEEE Eng Med Biol Soc. 2014;2014:6706–6709. | ||
Li T, Liu Z, Li J, et al. Altered amplitude of low-frequency fluctuation in primary open-angle glaucoma: a resting-state FMRI study. Invest Ophthalmol Vis Sci. 2015;56(1):322–329. | ||
Li C, Cai P, Shi L, et al. Voxel-based morphometry of the visual-related cortex in primary open angle glaucoma. Curr Eye Res. 2012;37(9):794–802. | ||
Clower DM, West RA, Lynch JC, Strick PL. The inferior parietal lobule is the target of output from the superior colliculus, hippocampus, and cerebellum. J Neurosci. 2001;21(16):6283–6291. | ||
Sato W, Kochiyama T, Uono S, et al. Rapid, high-frequency, and theta-coupled gamma oscillations in the inferior occipital gyrus during face processing. Cortex. 2014;60:52–68. | ||
Sato W, Kochiyama T, Uono S, et al. Bidirectional electric communication between the inferior occipital gyrus and the amygdala during face processing. Hum Brain Mapp. 2017;38(9):4511–4524. | ||
Raichle ME, Snyder AZ. A default mode of brain function: a brief history of an evolving idea. Neuroimage. 2007;37(4):1083–1090. | ||
Raichle ME, Macleod AM, Snyder AZ, Powers WJ, Gusnard DA, Shulman GL. A default mode of brain function. Proc Natl Acad Sci U S A. 2001;98(2):676–682. | ||
Wang J, Li T, Zhou P, Wang N, Xian J, He H. Altered functional connectivity within and between the default model network and the visual network in primary open-angle glaucoma: a resting-state fMRI study. Brain Imaging Behav. 2017;11(4):1154–1163. | ||
Song Y, Mu K, Wang J, et al. Altered spontaneous brain activity in primary open angle glaucoma: a resting-state functional magnetic resonance imaging study. PLoS One. 2014;9(2):e89493. | ||
Dormal V, Dormal G, Joassin F, Pesenti M. A common right fronto-parietal network for numerosity and duration processing: an fMRI study. Hum Brain Mapp. 2012;33(6):1490–1501. | ||
Nouri-Mahdavi K. Selecting visual field tests and assessing visual field deterioration in glaucoma. Can J Ophthalmol. 2014;49(6):497–505. | ||
Lin PW, Chang HW, Lin JP, et al. Analysis of peripapillary retinal nerve fiber layer and inner macular layers by spectral-domain optical coherence tomography for detection of early glaucoma. Int J Ophthalmol. 2018;11(7):1163–1172. |
 © 2019 The Author(s). This work is published and licensed by Dove Medical Press Limited. The
full terms of this license are available at https://www.dovepress.com/terms
and incorporate the Creative Commons Attribution
- Non Commercial (unported, 3.0) License.
By accessing the work you hereby accept the Terms. Non-commercial uses of the work are permitted
without any further permission from Dove Medical Press Limited, provided the work is properly
attributed. For permission for commercial use of this work, please see paragraphs 4.2 and 5 of our Terms.
© 2019 The Author(s). This work is published and licensed by Dove Medical Press Limited. The
full terms of this license are available at https://www.dovepress.com/terms
and incorporate the Creative Commons Attribution
- Non Commercial (unported, 3.0) License.
By accessing the work you hereby accept the Terms. Non-commercial uses of the work are permitted
without any further permission from Dove Medical Press Limited, provided the work is properly
attributed. For permission for commercial use of this work, please see paragraphs 4.2 and 5 of our Terms.