Back to Journals » International Journal of Chronic Obstructive Pulmonary Disease » Volume 17
Frailty Among Older Individuals with and without COPD: A Cohort Study of Prevalence and Association with Adverse Outcomes
Authors Roberts MH ![]() , Mapel DW
, Mapel DW ![]() , Ganvir N, Dodd MA
, Ganvir N, Dodd MA
Received 16 November 2021
Accepted for publication 12 March 2022
Published 5 April 2022 Volume 2022:17 Pages 701—717
DOI https://doi.org/10.2147/COPD.S348714
Checked for plagiarism Yes
Review by Single anonymous peer review
Peer reviewer comments 2
Editor who approved publication: Prof. Dr. Richard Russell
Melissa H Roberts,1 Douglas W Mapel,1,2 Nikhil Ganvir,3 Melanie A Dodd1
1College of Pharmacy, The University of New Mexico, Albuquerque, NM, USA; 2Northern Arizona Pulmonary Associates/Critical Care Consultants of Arizona, Flagstaff, AZ, USA; 3Department of Economics, The University of New Mexico, Albuquerque, NM, USA
Correspondence: Melissa H Roberts, College of Pharmacy, The University of New Mexico, 2502 Marble Ave, Albuquerque, NM, 87106, USA, Tel +1 505 925 0953, Fax +1 505 272 6749, Email [email protected]
Rationale: Frailty prevalence estimates among individuals with COPD have varied widely, and few studies have investigated relationships between frailty and adverse outcomes in a COPD population.
Objective(s): Describe frailty prevalence among individuals with and without COPD and examine associations between frailty and mortality and other adverse outcomes in the next two years.
Methods: This was an observational cohort study using Health and Retirement Study data (2006– 2018) of community living individuals ages 50– 64 and ≥ 65 with and without COPD (non-COPD). Frailty (Fried phenotype [5 items], and a modified Frailty Index-Comprehensive Geriatric Assessment [Enhanced FI-CGA] [37 items], and debility (modified BODE Index [4 items]) were assessed. Two-year post-assessment outcomes (mortality, ≥ 1 inpatient stay, home health and skilled nursing facility (SNF) use) were reviewed in a population matched 3:1 (non-COPD: COPD) on age, sex, race, and year using univariate and multivariate logistic regression (adjusted for morbidities). Area-under-the-curve (AUC) was used to evaluate regressions.
Results: The study included 18,979 survey observations for age 50– 64, and 24,162 age ≥ 65; 7.8% and 12.0% respectively reporting a diagnosis of COPD. Fried phenotype frailty prevalence for age ≥ 65 was 23.1% (COPD) and 9.4% (non-COPD), and for the Enhanced FI-CGA, 45.9% (COPD) and 22.4% (non-COPD). Two-year mortality for COPD was more than double non-COPD for age 50– 64 (95% CI: 3.8– 5.9% vs 0.7– 1.3%) and age ≥ 65 (95% CI: 11.9– 14.3% vs 5.6– 6.6%). Inpatient utilization, home health care use, or at least temporary SNF placement were also more frequent for COPD. Measures were predictive of adverse outcomes. In adjusted models, the Fried phenotype and modified BODE score performed similarly, and both performed better than the Enhanced FI-CGA index. AUC values were higher for morality regressions.
Conclusion: Frailty prevalence among individuals with COPD in this national survey is substantially greater than without COPD, even at pre-retirement (50– 64 years). These measures identify patients with increased risk of poor outcomes.
Keywords: disability, survival, home health, peak air flow, cognition
Introduction
COPD is associated with increased prevalence of several comorbidities, many of which can result in substantial limitations in physical and cognitive function.1 All too frequently the combination of impaired lung function along with comorbidities leads to frailty and physical debility – where frailty is defined as “a clinically recognizable state of increased vulnerability, resulting from aging-associated decline in reserve and function across multiple physiologic systems such that the ability to cope with everyday or acute stressors is compromised”2,3 and debility is a related term indicating lack of strength and general decline in physical function.
There are evaluations of the prevalence and incidence of frailty among COPD patients,4 however most of what is available is based on small or specific clinical populations, or where populations are somewhat larger, non-US populations.5,6 Frailty estimates among individuals with COPD range widely; for example, 10% for a Netherlands study,5 11% for a Japan study,7 approximately 25% for two UK studies8,9 and estimates of 18%10 and 58%11 for US populations. Frailty prevalence in the US among the general community dwelling population 65 and older was estimated for 2011 as 15%,12 while estimates from an earlier 2004 assessment for 10 European countries ranged from 8% to 16%, with higher rates in southern European countries.13
Multiple instruments are used to assess frailty, contributing to variance in estimates. Frailty assessment has its roots in the Comprehensive Geriatric Assessment (CGA), an interdisciplinary diagnostic assessment begun three decades ago that considered multiple dimensions of an elderly individual – medical, as well as psychological and physical functioning.14 Conducting a CGA requires substantial time however, and as an interdisciplinary assessment, can be resource intensive. Over time, other specific frailty assessment tools were developed. The phenotype model has been used the longest. First presented by Fried et al in 2001, frailty is defined as a clinical syndrome with three or more criteria present: unintentional weight loss (10 pounds in past year), self-reported exhaustion, weakness (grip strength), slow walking speed, and low physical activity.15 The frailty index based on a comprehensive geriatric assessment (FI-CGA) developed by Rockwood and Mitnitski, another widely used assessment, alternatively considers frailty as an age-associated accumulation of deficits.16 The two tools have been demonstrated to be moderately correlated.17 Populations identified by these two tools have been found to overlap, but conceptually the instruments may serve different purposes.18,19 The FI-CGA includes items assessed by Fried’s frailty phenotype model, and additionally includes other deficits: poor cognition, disrupted sleep, difficulty with activities of daily living (ADLs) and instrumental ADLs (IADLs), poor vision, and chronic morbidities.16 An additional adaption of the Rockwood et al frailty index assesses frailty across an age spectrum.20
While frailty measures are multidimensional, debility measures usually focus on symptoms or deficits in physical strength and vigor. Severe disability is commonly seen among palliative care patients. However, debility and generalized weakness is also frequently observed in individuals after long-hospital stays, or who have progressive chronic disease.24 For patients with COPD, systemic consequences of the disease often result in muscle weakness and weight loss, which in turns leads to limitations in physical activity.25 The BODE index is a 4-item measure developed for a COPD population that includes assessment of pulmonary impairment, the individual’s perception of the most disabling symptom of COPD, dyspnea, and two items capturing systemic effects of COPD – low body mass and difficulty walking.26 The BODE index has been shown to be strongly predictive of mortality among individuals with COPD.26
Although frailty is increasingly recognized as a serious concern among COPD patients,21 the limitations of small cohort studies and the heterogeneity among frailty measurement instruments creates uncertainty about its prevalence in the general community dwelling population, particularly in the US.6 Current studies often lack prospective data relating frailty in COPD to relevant clinical outcomes.6 Further, recent research describes molecular level changes associated with frailty occurring in middle age, supporting frailty identification among younger patients.27 However, few COPD studies have examined frailty prevalence among persons less than 65 years of age.13
The objectives of this study are 1) to describe the prevalence of frailty and physical debility among individuals with and without COPD age ≥50 in a large national sample in the US, and 2) to examine the association between these measures and adverse outcomes in the two years post-assessment.
Methods
Data and Study Design
This is a retrospective observational cohort study of individuals age ≥50. The study uses publicly available Health and Retirement Study (HRS) data for years 2006–2018. The HRS, a longitudinal study sponsored by the National Institute on Aging (grant number NIA U01AG009740) and conducted by the University of Michigan, biennially surveys a representative sample of approximately 20,000 people across the United States.28 In the present study, using responses and assessments, each survey year individuals were characterized by levels of frailty and by a COPD-oriented debility measure. Outcomes reported in the next biennial survey were reviewed.
The HRS employs a complex research design that includes weights to calculate nationally representative estimates, focusing on four broad areas - income and wealth; health, cognition and use of healthcare services; work and retirement; and family connections.28 Existence of chronic disease is based on self-report.29 Survey responses are also used to assess individual limitations in the following areas: mobility, strength and fine motor skills, ADLs, IADLs, depression, and cognition.30–32 In addition to survey responses, in-person physical health measure assessment began in 2004, and include hand grip strength, timed walk, height, weight, and peak expiratory flow (PEF) rates.33
Respondents age ≥50 living in a community dwelling (non-institutional) setting with at least one physical measure assessment in each of the survey years 2006–2016 were included in analyses. Outcomes were identified in survey years 2008–2018. Individuals were characterized as having COPD or not having COPD based on self-report (“Has a doctor ever told you that you have chronic lung disease such as chronic bronchitis or emphysema? Do not include asthma.”).
The study was conducted in accordance with the principles of the Declaration of Helsinki. This study uses publicly available secondary research data and was approved as exempt research by The University of New Mexico Health Sciences Office of Research Human Research Protections Program.
Participant Characteristics
Socio-demographic characteristics included: age (in years, and by age category [50–64, ≥65]), sex, race (White, African-American, Other), Hispanic ethnicity, marital status (married, single, widowed), years of education (<high school, high school/GED, some college, college degree), living arrangements (alone, with someone else), smoking status (past, current, never).
HRS participants were surveyed concerning hypertension, heart disease (to include angina/myocardial infarction (MI), congestive heart failure (CHF)), diabetes, cancer, stroke, medication to treat stomach problems, osteo/rheumatoid arthritis, back problems other than arthritis, migraine headaches, pain, and urinary incontinence. Responses for excessive alcohol consumption, sedentary behavior, and depression were included. Depression was determined using the CES-D8, with a score of ≥3 considered evidence of current depression.31
In-person physical measures included in the study were: PEF, hand grip strength, timed walk (12-foot distance), height, and weight. From these, BMI and percentage of predicted PEF (% Pred PEF) were determined. Mobility, strength, and gross and fine motor skills items included: walking 1 block, getting up from a chair, climbing one flight of stairs, lifting or carrying over 10 lbs., and picking up a dime. ADLs and IADLs were included,30 as well as vision/hearing impairment, poor/disrupted sleep, and shortness of breath. Individuals unable to complete the hand grip strength test/self-reporting very weak hand strength or unable to complete the timed walk/self-reporting difficulty with walking 1 block were considered to be in the lowest 20% for grip strength and walking speed.
Frailty, COPD-Oriented Debility, and Cognition Measures
Fried Phenotype
Frailty is defined as a clinical syndrome in which ≥3 of 5 items are present: low BMI (≤21), self-reported exhaustion, weakness (lowest 20% grip strength), slow walking speed (lowest 20%), and low physical activity (lowest 20%).15,34 Each item has equal weight (1 point), and individuals are characterized as robust (scale=0), pre-frail (scale of 1 or 2), or frail (scale 3 to 5). Cutoff points for the scale items based on HRS data were determined by age group (50–64, ≥65 years). See Appendix Table A-1 for scale assessment using HRS measures.
Frailty Index-Comprehensive Geriatric Assessment (FI-CGA)
The FI-CGA is a widely used frailty assessment that alternatively considers frailty as an age-associated accumulation of deficits based on the Comprehensive Geriatric Assessment (CGA).16 The index includes items in Fried’s phenotype measure, and other additional deficits: poor cognition, disrupted sleep, difficulty with ADLs and IADLs, poor vision, and chronic morbidities. Rockwood et al were instrumental in developing the FI-CGA, but also published an alternative “fitness and frailty” index that was used for ages <65 – an index that omitted some CGA items and included additional items such as dexterity.20 The scale characterized in this study as “Enhanced FI-CGA” includes these additional items for a total of 37 items. Appendix Table A-2 provides a summary of the Enhanced FI-CGA scale based on HRS data. Each item has equal weight (1 point), and individuals are categorized into 5 groups according to percentage of deficits: “relatively fit” (≤0.03), “less fit” (0.03 to ≤0.10), “least fit” (0.10 to ≤0.21), “frail” (0.21 to ≤0.45), and “most frail” (>0.45).16,20
Modified Bode Index
The BODE index is a multi-dimensional assessment developed for individuals with COPD and has been shown to have a stronger association with survival and other outcomes than those based on lung function alone.26,35 The BODE index is a weighted scale of 4 items: low BMI, reduced percent predicted forced expiratory volume in one second (FEV1), shortness of breath as measured by the modified Medical Research Council (MMRC) dyspnea scale, and limitations on distance walked in 6 minutes.26 BODE items capture evidence of debility, or deconditioning. Using HRS data, Roberts and Mapel showed that a modified BODE index in which % predicted PEF was substituted for % predicted FEV1, was similar to the original BODE in the strength of its association with mortality.36 They had also previously demonstrated that reduced PEF is associated with poorer health status, increased health-care utilization, and poorer expected survival in older adults.37 This study makes use of the modified BODE index based on HRS data:36 low BMI, reduced % predicted PEF, shortness of breath, and in lieu of a timed walk test, uses difficulty lifting/carrying 10 lbs or walking 1 block (See Appendix Table A-3). The maximum modified BODE index score is 8. Scores are grouped as 0–1, 2–3, or 4 or higher.
Cognition
Cognition status was determined using the Langa-Weir 27-point assessment contained in the HRS, where higher scores indicate better cognitive functioning.32,38 The cognitive assessment is designed to provide a measurement of mental status as well as screen for early signs of dementia. The cognitive assessment comprises questions regarding memory testing (recall and working memory), abstract and fluid reasoning, vocabulary, numeracy, and dementia. The 27-point scale includes: 1) immediate and delayed 10-noun free recall test to measure memory (0 to 20 points); 2) a serial sevens subtraction test to measure working memory (0 to 5 points); and 3) a counting backwards test to measure speed of mental processing (0 to 2 points). Status is characterized as “normal” (score>11), “impairment” (score 7–11), and “dementia” (score <7). The Langa-Weir data utilized in the analysis contained some imputed data for missing values. The methods they used to impute values are well-documented and described elsewhere.39,40
Outcomes
Outcomes were identified in the two-year period after a given survey. The primary outcome was mortality. In the HRS, death information is obtained from both family members and a search of the National Death Index.41 Secondary outcomes were for individuals still alive after the two-year period. Secondary outcome assessment was based on respondent and/or a caregiver/family member interviews and were: any hospitalization occurrence, nursing facility short-term stay, change of residence to a nursing facility, or need for home health care.
Statistical Analysis
Respondents missing information for these items were excluded from analyses: COPD, sex, race, components of Fried, proxy BODE measure, Rockwood frailty/fitness index, or Enhanced FI-CGA. Descriptive statistics for continuous variables include measures of central tendency (mean, standard deviation, median, minimum, and maximum) and quartile values as appropriate. Descriptive summaries of categorical variables include the frequency and percent of responses. All confidence intervals are two-sided with a significance level of 0.05.
Prevalence estimates and 95% confidence intervals were calculated using the HRS provided respondent level survey physical measure weights for each measurement year.42,43 Briefly, cohorts are added to HRS every 6 years according to the multi-stage, area-clustered, stratified sample design of the HRS, and sample weights adjust for a cohort’s differential participant sampling probabilities. Weights are non-zero for living non-institutionalized respondents born in the appropriate years, and zero for non-respondents, deceased respondents and respondents residing in nursing homes. Weights are designed to account for oversampling of Black and Hispanic respondents, but also to correspond to the US population as measured for the year of data collection.43 Prevalence was estimated for the population overall, and stratified by age groups (age 50–64, ≥65) and by sex, and within each age group strata, by individuals with and without COPD.
For matched analyses, individuals without COPD were matched 3:1 to individuals with COPD using individual non-modifiable factors: age (± 2 years), sex, and race (White vs Non-White). Matching was done by survey year. Relationships between the frailty measures and the modified BODE and outcomes were investigated using univariate analyses and multivariate regression. Multivariate mortality models included adjustment for demographic factors previously found to be associated with adverse outcomes among older populations (education level, living arrangements, marital status, smoking status) that were significantly different after matching between COPD and non-COPD populations, and for morbidities not otherwise included in measures (arthritis, cancer, diabetes, heart condition, hypertension, pain limitation, stroke effects). Multivariate models for secondary outcomes additionally investigated impaired vision, difficulty with picking up a dime, and difficulty with dressing as covariates in models including the Fried phenotype and the modified BODE Index.
Given the paired nature of the data due to matching and repeated measures observed for individuals across years generalized estimating equations (GEE) were used for logistical regression analysis. Area under the receiver operating characteristic curve (AUC), a measure that combines true positive and false positive rates, was used to characterize model performance in classifying and predicting adverse event experience. Higher AUC values indicate better model predictions, with values 0.70 to <0.80 indicating acceptable discrimination and values 0.80 to <0.90, excellent discrimination.44,45
SAS statistical software (Cary, NC version 9.4) and Stata (College Station, TX; StataCorp LLC) were used to perform analyses.
Results
Prevalence
Across the survey years 2006 to 2016 we identified 45,344 person-year observations for individuals meeting study inclusion criteria: 20,521 for individuals age 50 to 64, and 24,823 for individuals age ≥65 (Appendix Table B-1). Of these, 391 observations for age 50 to 64 and 582 for age ≥65 were excluded due to missing data. Another 1151 observations for age 50 to 54, and 79 for age ≥65, were excluded due to zero weight values, resulting in 43,141 person-year observations for analyses. Across the surveys conducted 2006–2016, the percent of participants annually self-reporting physician diagnosed COPD was 7.8% (95% CI=7.1–8.5%) among those age 50–64, and 12.0% (95% CI=11.2–12.7%) among those age ≥65 (see Appendix Table B-1).
The demographic characteristics of non-COPD and COPD participants by age group are presented in Table 1. For non-COPD vs COPD, there were slight differences in race and in mean age for those 50–64, but no difference in ethnicity. There were substantial differences by sex (higher percentage of women for COPD), education, living arrangement, marital status, and smoking history. Although dementia was uncommon among participants and similar for non-COPD and COPD, mild cognitive impairment was more prevalent among those with COPD. Differences observed between the non-COPD and COPD groups were similar for the age 50–64 and ≥65 groups. Demographic differences were consistent across the study years; although after 2008, when HRS made a concerted effort to increase participation by African American and Hispanic individuals, there is greater representation of these individuals.
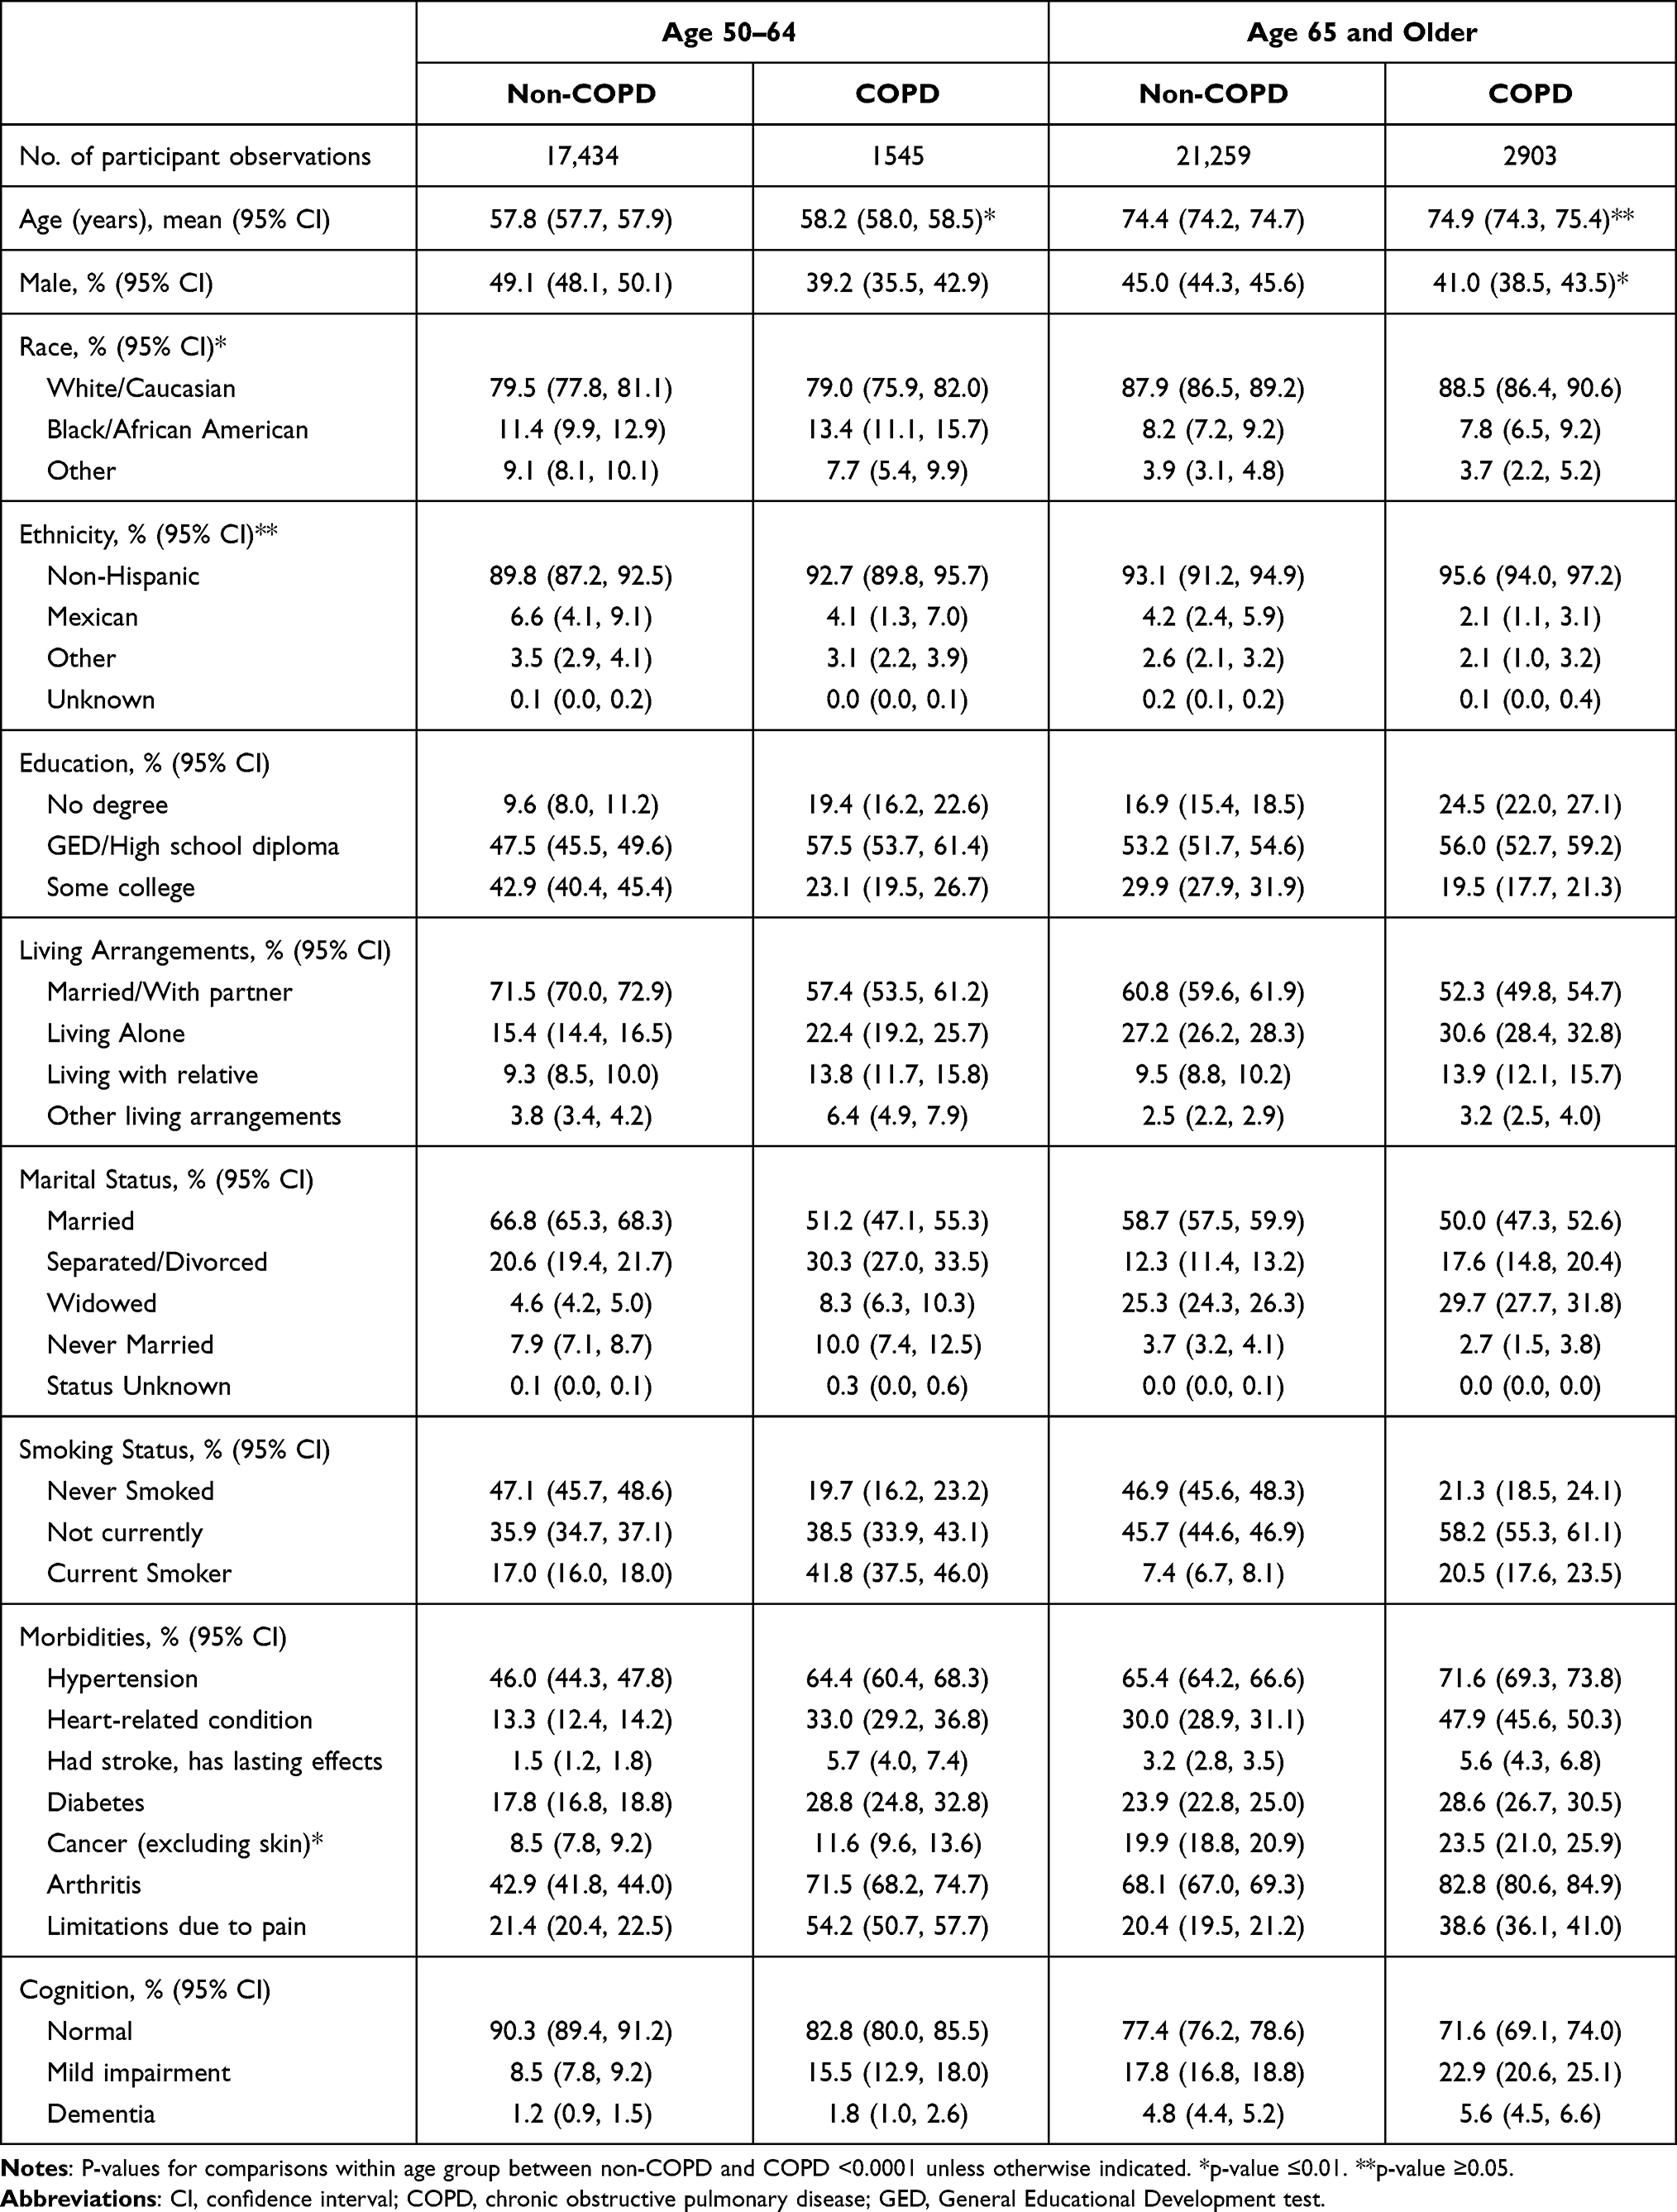 |
Table 1 Survey Participant Demographics, Surveys 2006–2016 |
Prevalence, stratified by age group and non-COPD/COPD, of the two frailty measures and the modified BODE index are presented in Table 2 and Figure 1. While within the COPD population there were similar estimates for the most severe Fried phenotype and modified BODE measures, overlap between people identified by the respective measures was moderate. Among those identified as frail using the Fried phenotype, the percentage also identified as most severe by the modified BODE was 39.4% for those age 50–64, and 49.3% for age ≥65. Differences between non-COPD and COPD were substantial for the more severe frailty category levels. Differences between men and women tended to be small, with significant differences only in the most severe categories of the Fried phenotype and Enhanced FI-CGA, for which prevalence was higher among women age ≥65 (Appendix Table B-2).
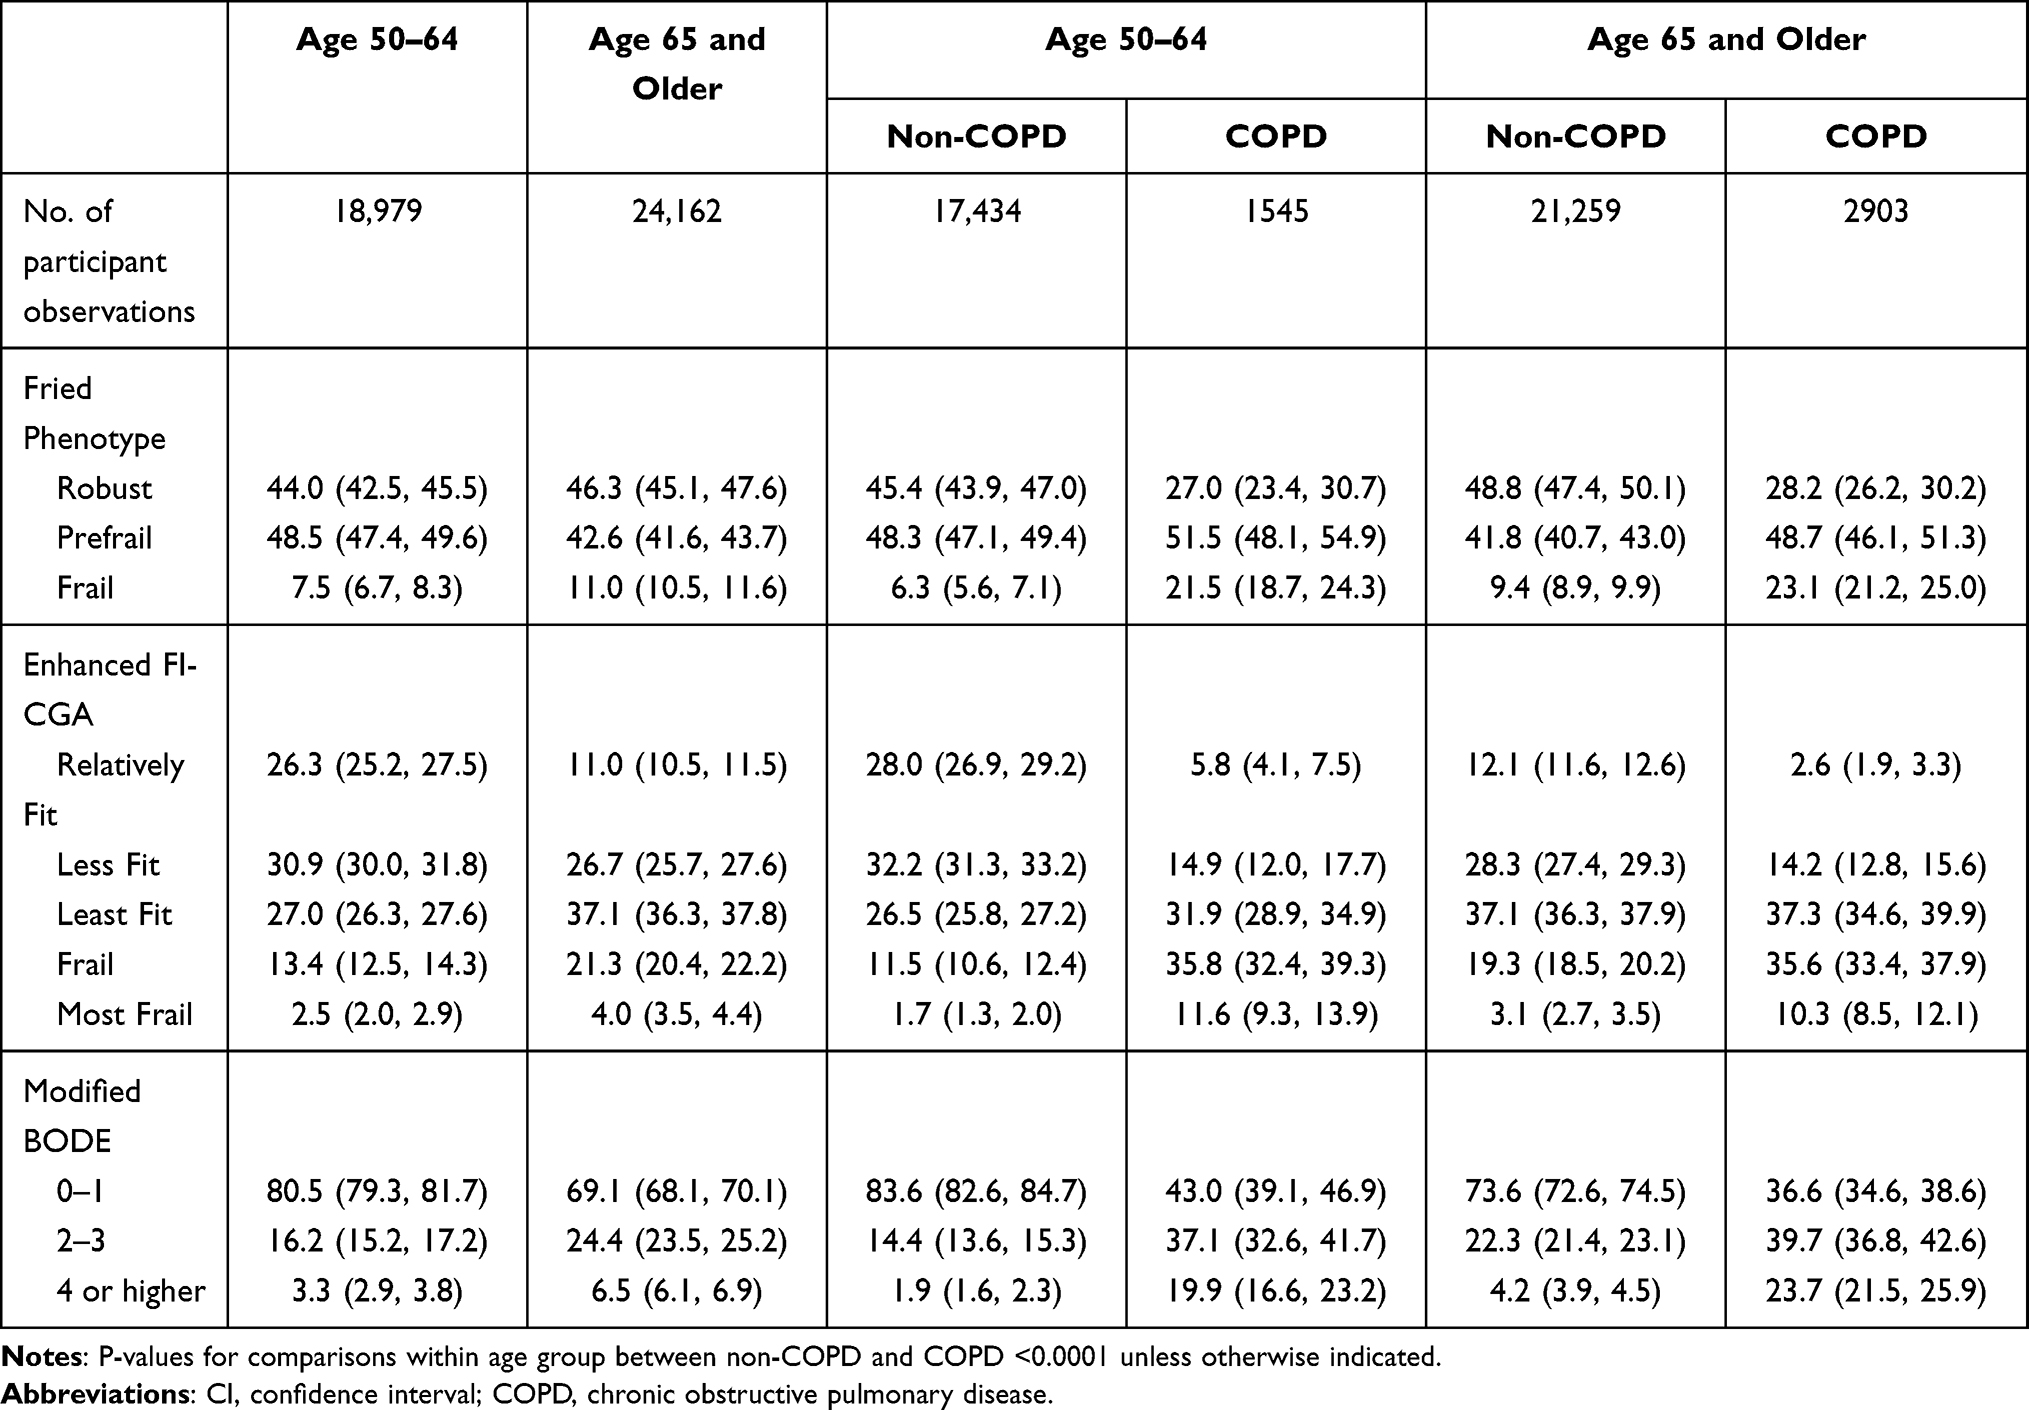 |
Table 2 Weighted Prevalence (95% CI) by Age Group, Survey Years 2006–2016 |
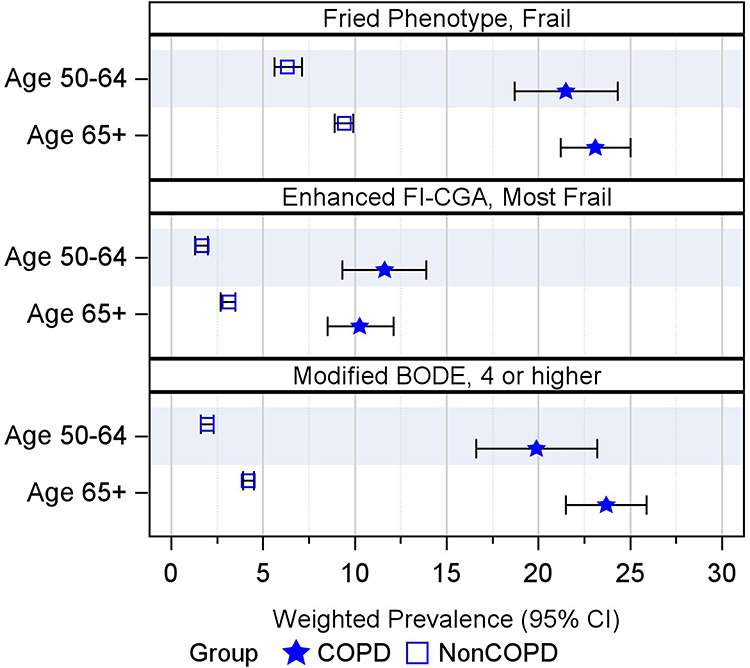 |
Figure 1 Frailty and modified BODE prevalence (95% CI) by age group, survey years 2006–2016. Abbreviations: CI, confidence interval; COPD, chronic obstructive pulmonary disease. |
In matching, all observations for age 50–64 with COPD were matched (n=1545) and for those age ≥65, there were no matches for two COPD observations and for one, there was only one non-COPD match, resulting in 2901 COPD observations. The matched dataset included a total of 17,782 person-survey observations for 13,200 unique individuals. Matching reduced differences between groups for the matched factors of age, sex, and race, but differences remained for education, living arrangement, marital status, and smoking history (Appendix Table B-3) and for the prevalence of the most severe levels of the frailty and the modified BODE measures (see Table 3 and Appendix Table B-3).
 |
Table 3 Comparison of Study Populations Before and After Matching, 2006–2016 |
Outcomes
Outcomes in the next two years for the matched cohort are presented in Figure 2. Overall 2.0% (95% CI=1.66–2.32) of those 50–64 died in the two years after assessment and 7.8% (95% CI=7.4–8.3%) of those ≥65. Mortality for those with COPD was more than double those without COPD for both age 50–64 (4.9% [95% CI=3.8–5.9%] vs 1.0% [95% CI= 0.7–1.3%]), and age ≥65 (13.1% [95% CI=11.9–14.3%] vs 6.1% [95% CI=5.6–6.6%]) (Figure 2, Appendix Table B-4).
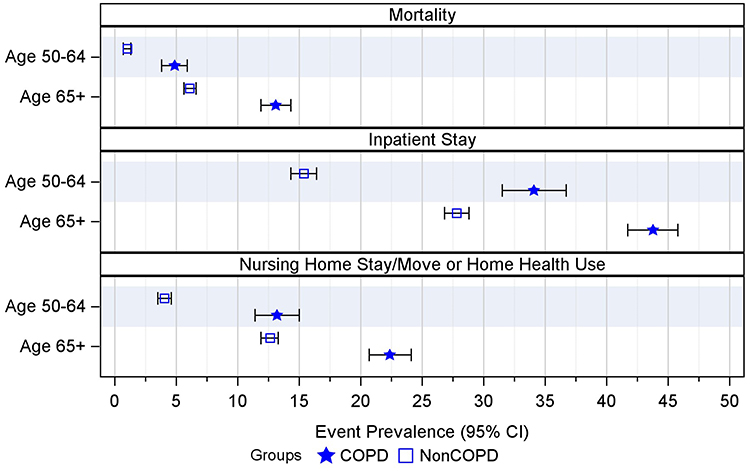 |
Figure 2 Prevalence of outcome event in next two years (95% CI), matched population by age group. Individuals surveyed in years 2006–2016, and outcome events identified at the next two-year survey (survey years 2008–2018). Abbreviations: CI, confidence interval; COPD, chronic obstructive pulmonary disease. |
Among individuals still alive in the next two years, information on secondary outcomes was missing for some individuals, however the proportions with missing information were similar between the COPD and non-COPD groups. Among those age ≥65, outcome information was missing for ≤5%, and for those age 50–64, ≤8% had missing information (Appendix Table B-4). Outcome percentages (95% CI) were: ≥1 hospital stay age 50–64 19.9% (95% CI=18.9–21.0%), age ≥65 31.6% (95% CI=30.7–32.4%); home health or nursing facility care age 50–64 6.3% (95% CI=5.6–6.9%), age ≥65 14.9% (95% CI=14.2–15.6%). Similar to mortality, the proportions of those with ≥1 hospital stay, home health care use, or at least a temporary nursing facility stay were higher among those with COPD compared to those without (Figure 2, Appendix Table B-4).
The unadjusted odds ratio (OR) comparisons of the three measures as predictors of mortality are summarized in Appendix Table B-5. Unadjusted AUC values were highest (approximately 0.70 or higher) for the COPD population using the Fried frailty and BODE Index, and for the non-COPD using FI CGA (Table 4). While unadjusted ORs were similar between non-COPD and COPD for those age ≥65, for those age 50–64, ORs for the most severe frailty categories were lower for individuals with COPD. The adjusted ORs, summarized in Figure 3 and Appendix Table B-5, included adjustment for other comorbidities, as well as demographic characteristics that were significantly different between the groups after matching. Confidence intervals for the age 50–64 population were wider due to low mortality rates in this population. Performance of the models as measured by AUC improved in adjusted models, reaching approximately 0.80 or higher for both non-COPD and COPD age 50–64 using the BODE Index, and for non-COPD age 50–64 using the Fried Frailty and FI-CGA (Table 4). In fully adjusted models, ORs were similar between non-COPD and COPD for age ≥65 using the FI-CGA and BODE Index, but the adjusted OR was higher for COPD vs non-COPD using the Fried Frailty (OR 12.7, 95% CI=8.2–19.7 vs OR 8.6, 95% CI = 6.4–11.6). In the 50–64 population, ORs were similar for the Fried Frailty and BODE Index, however point estimates for ORs were lower for COPD compared to non-COPD.
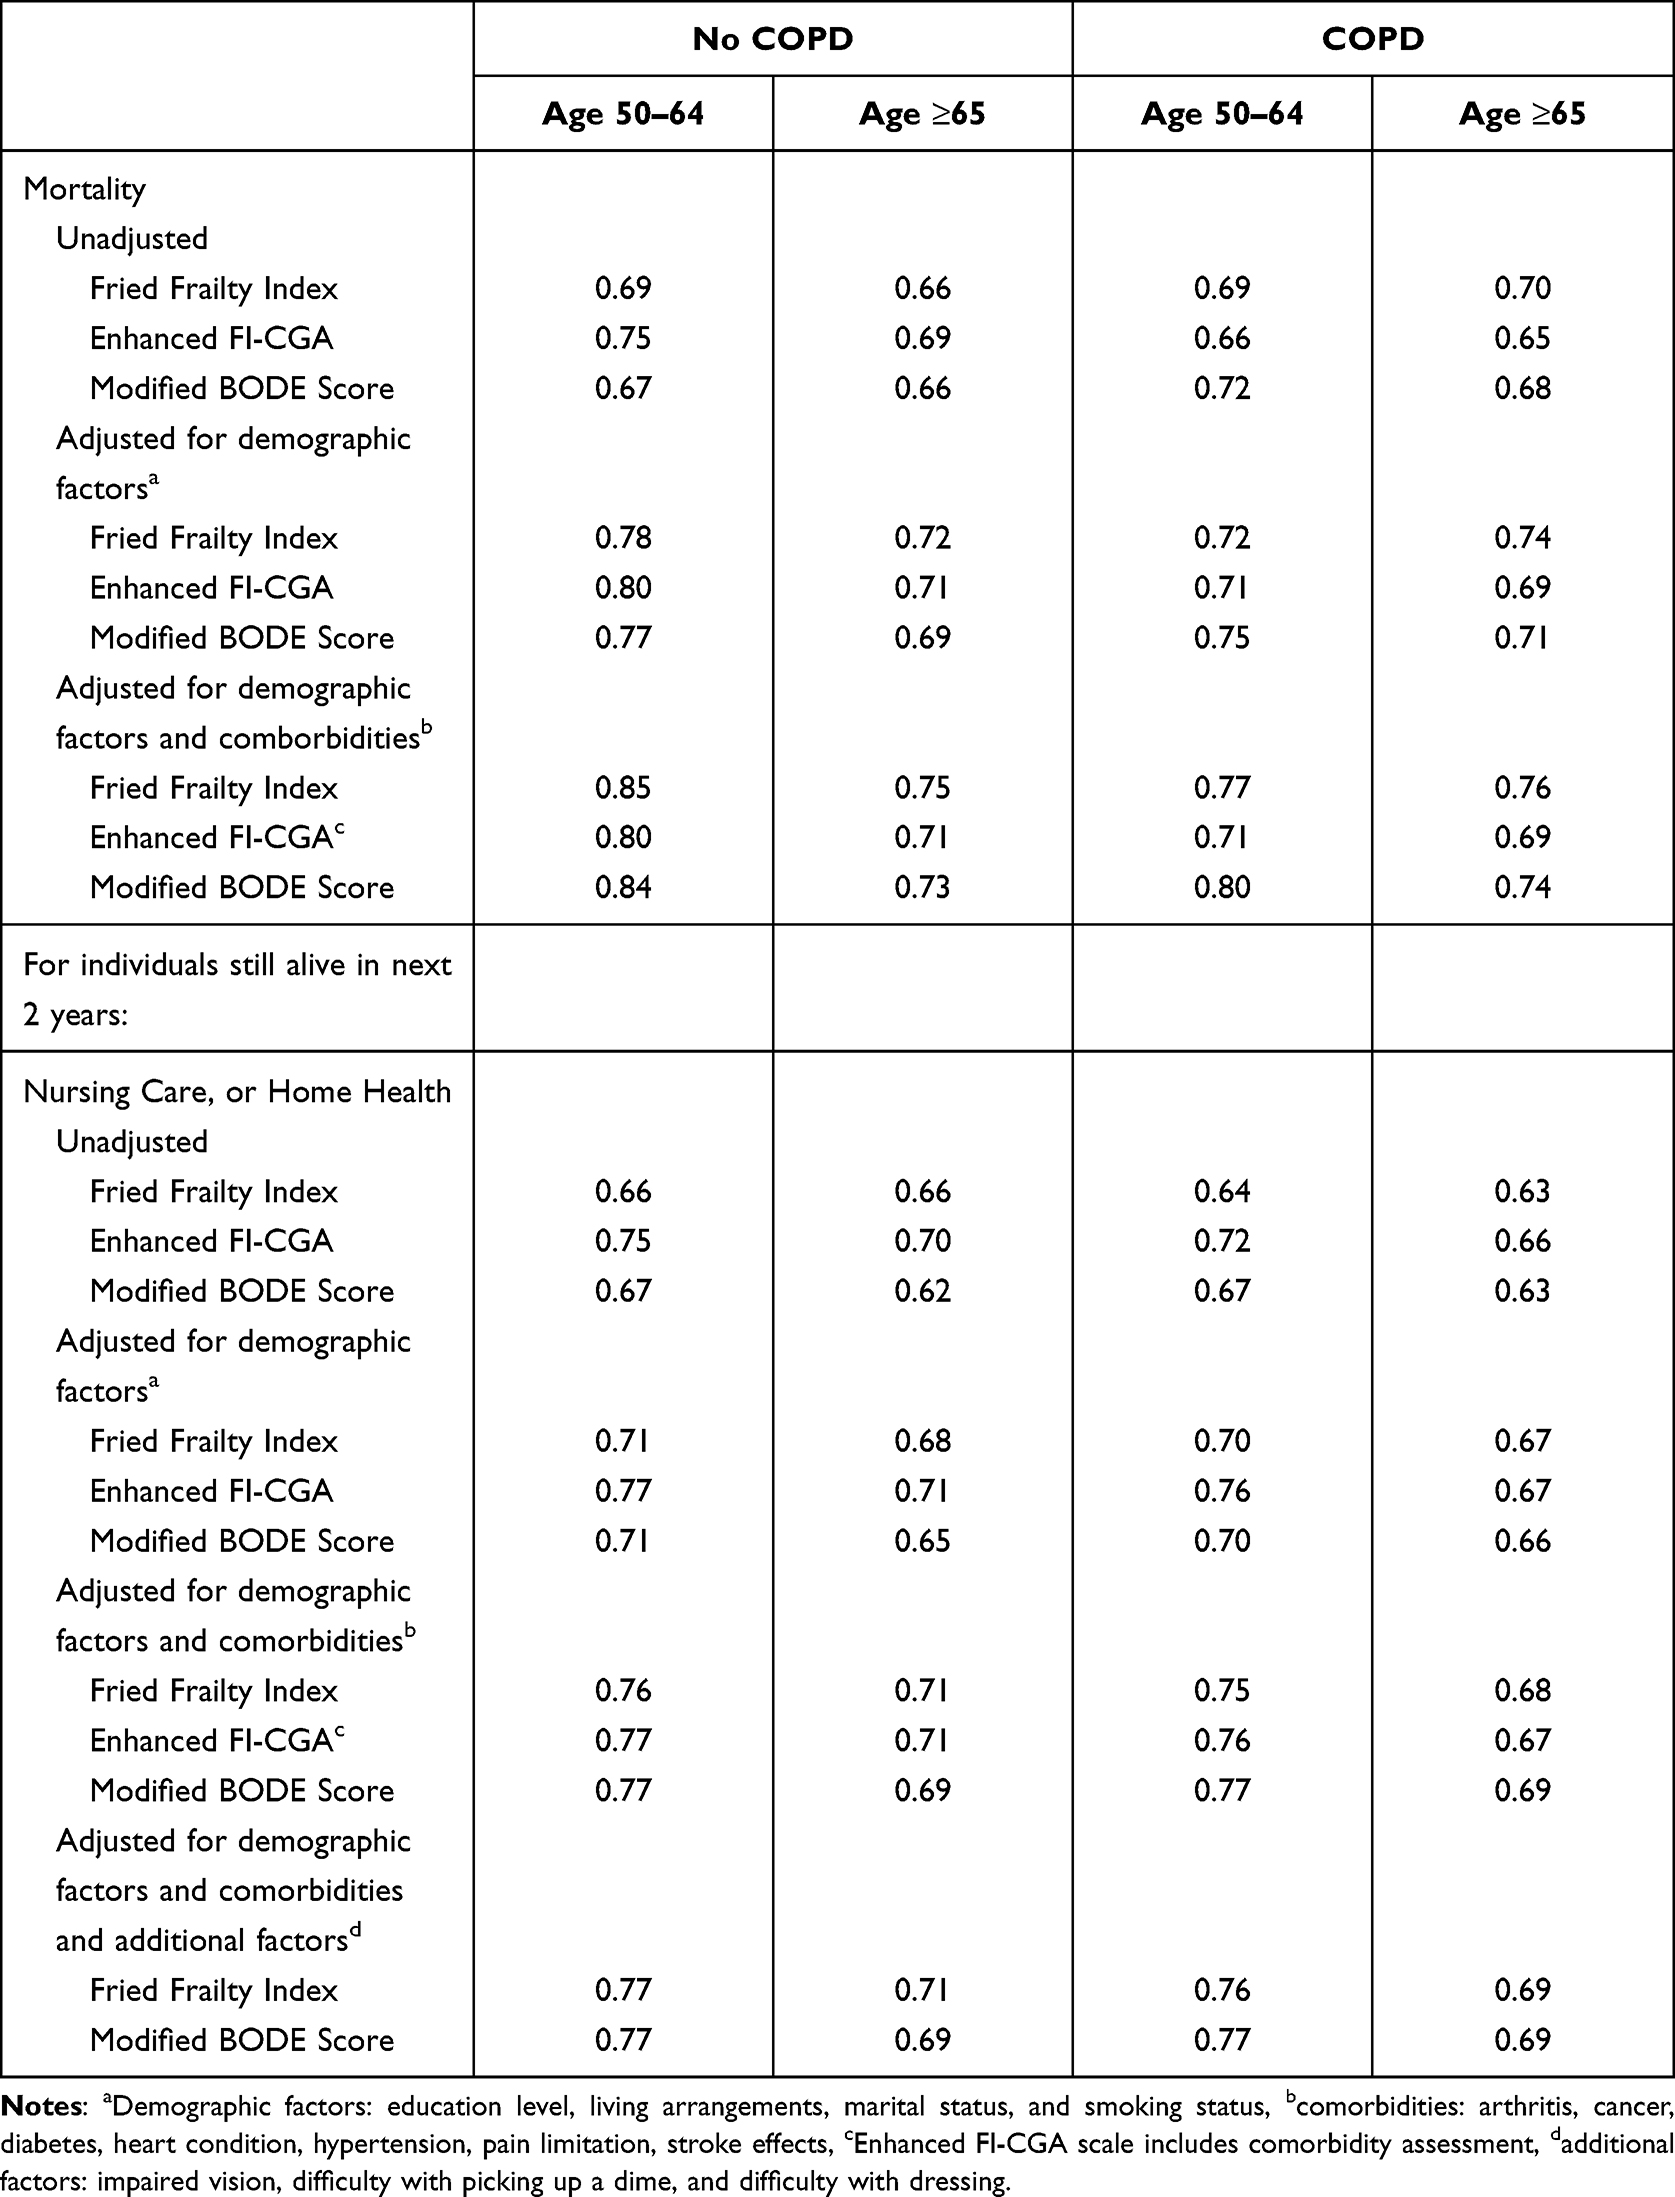 |
Table 4 Outcomes Next 2 Years (2008–2018), AUC Statistics for Regression Models, by COPD |
 |
Figure 3 Mortality next two years, matched population by age group, adjusted odds ratio (95% CI). Measure reference groups for ORs: Fried Phenotype = Robust, Enhanced FI-CGA = Relatively Fit, Modified BODE Score = 0–1 score. Regression models adjusted for demographics (all scales) and comorbidities (Fried, modified BODE). Abbreviations: CI, confidence interval; COPD, chronic obstructive pulmonary disease. |
Secondary outcomes are summarized in Figures 4 and 5 (adjusted ORs), and Appendix Tables B-6 and B-7 (unadjusted and adjusted ORs). Performance of unadjusted models for the outcome nursing care/home health as measured using AUC was better than for the outcome any inpatient stay (Fried AUC values ≤0.60, Enhanced FI-CGA ≤0.69, BODE Index ≤0.62) (Appendix Tables B-6 and B-7). In models for the need for nursing care/home health that were adjusted for demographic and comorbidity factors, among both non-COPD and COPD age 50–64, the AUC values were 0.75 or higher, and ranged from 0.67 to 0.71 for those age ≥65 (Table 4, Appendix Table B-7). Further adjustment of the need for nursing care/home health models for impaired vision and the fine motor skill “difficulty picking up a dime” did not appreciably change AUC values (Table 4, Appendix Tables B-7).
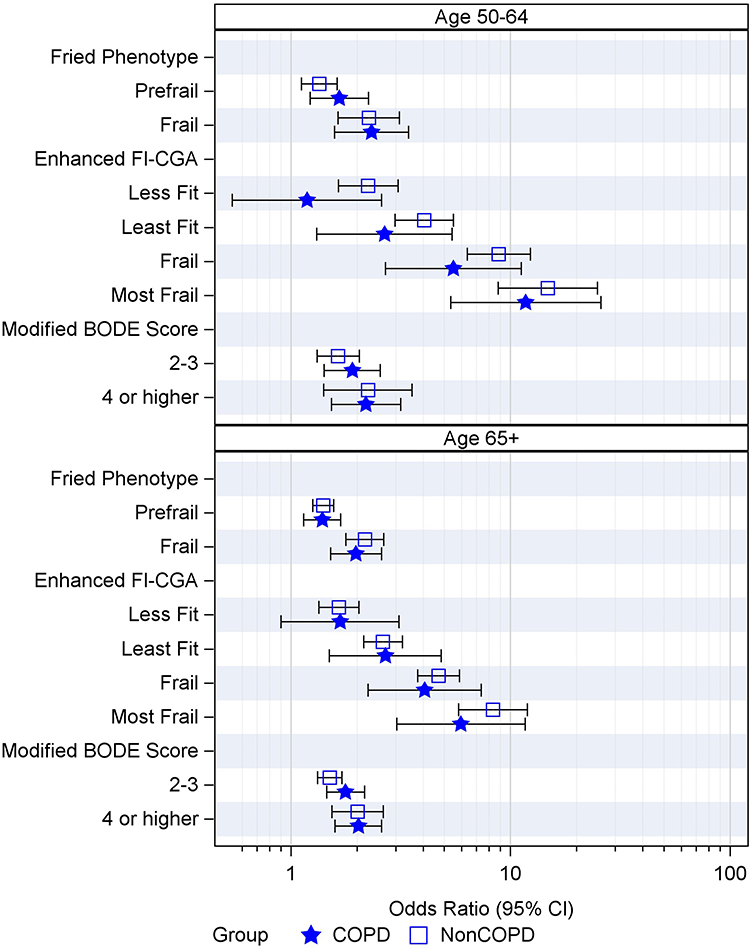 |
Figure 4 Inpatient stay next two years, matched population by age group, adjusted odds ratio (95% CI). Measure reference groups for ORs: Fried Phenotype = Robust, Enhanced FI-CGA = Relatively Fit, Modified BODE Score = 0–1 score, Regression models adjusted for demographics (all scales) and comorbidities (Fried, modified BODE). Abbreviations: CI, confidence interval; COPD, chronic obstructive pulmonary disease. |
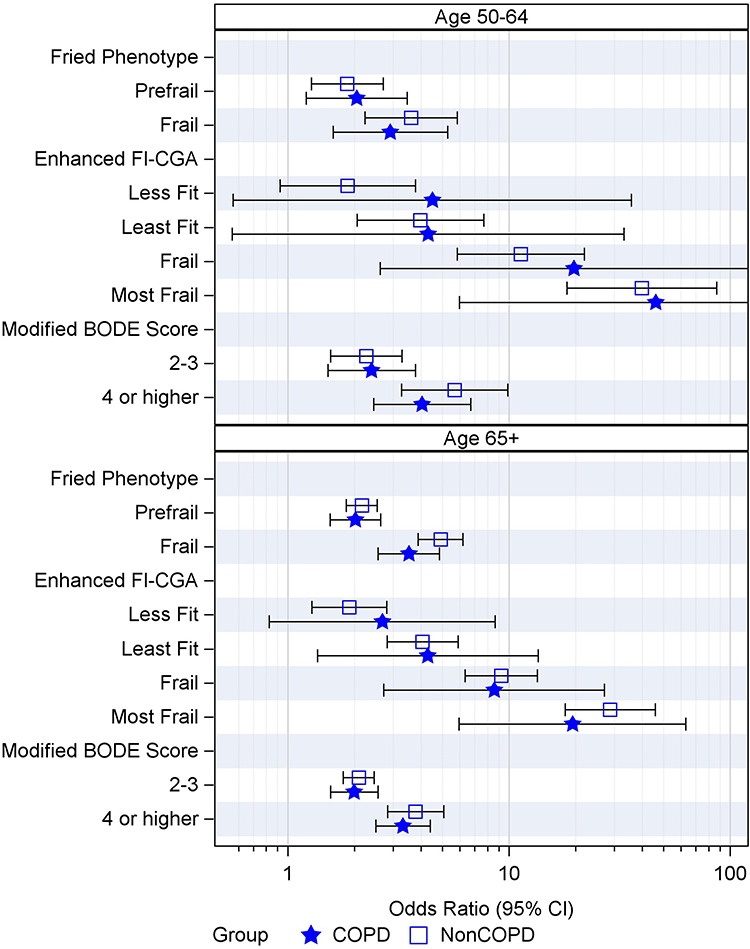 |
Figure 5 Nursing care, or home health next next two years, matched population by age group, adjusted odds ratio (95% CI). Measure reference groups for ORs: Fried Phenotype = Robust, Enhanced FI-CGA = Relatively Fit, Modified BODE Score = 0–1 score, Regression models adjusted for demographics (all scales) and comorbidities (Fried, modified BODE). Abbreviations: CI, confidence interval; COPD, chronic obstructive pulmonary disease. |
Discussion
This study estimated prevalence estimates using a nationally representative sample of the United States population 50 to 64 and ≥65 years of age living in a community setting. Prevalence estimates were based on surveys occurring every two years from 2006 through 2016. Prevalence of COPD in this population is similar to estimates from other national surveys.46–48 Findings demonstrate advanced frailty is common among COPD patients, with prevalence estimates >20% for not only individuals age ≥65, but also for those age 50–64. Prevalence among those age ≥65 was approximately twice that of age, sex, and race-matched individuals without COPD, a finding aligned with the two-fold higher odds of frailty determined by a systematic review of the relationship between COPD and frailty.6 While summary prevalence rates have been reported for COPD populations, rates specifically for individuals age 50–64 are not widely reported.6 Novel to our study is the finding that more severe frailty prevalence among individuals with COPD age 50–64 was more than three times that of patients without COPD. Chronic inflammation present in patients with COPD is posited to be one factor driving higher frailty rates, along with smoking, decreased ability to exercise, and other systemic effects of COPD.6,10
Adverse outcomes were assessed in the two-year period after each survey. The two frailty scales and the modified BODE score were independent predictors of 2-year mortality for those with and without COPD. Frailty has previously been found to have a strong association with mortality in community dwelling older adults,49,50 and beyond frailty status, respiratory illness has been found to have a hazard ratio for mortality greater than cardiovascular disease.34 The BODE index association with mortality is well-established, and the modified BODE and Fried phenotype had acceptable performance for 2-year mortality in unadjusted models among individuals with COPD. After further adjustment for demographic factors and comorbidities, model performance for all three scales was much improved, particularly among individuals age 50–64 for whom AUC values for the BODE index were ≥0.80.
Two-year mortality was higher for individuals with COPD for both age groups. However adjusted ORs for death in the next two years for individuals age 50–64 with and without COPD were comparable for the most severe categories of the Fried frailty and BODE index, while ORs for the Enhanced FI-CGA were lower for COPD compared to non-COPD. In comparison, among individuals ≥65, while adjusted ORs were comparable for the Enhanced FI-CGA and the BODE Index, individuals with COPD and frail status identified by the Fried frailty index had greater odds of death in the next two years than individuals without COPD who were frail. Vaz Fragoso et al also noted in a large sample of community dwelling older adults that the combined effects of frailty and respiratory impairment greatly increased mortality risk, with potentially a multiplicative as opposed to additive impact.51
In our review of adverse outcomes other than mortality occurring in the 2-year post-assessment period we found need for nursing care also had a strong relationship with frailty and the modified BODE score. While prevalence rates were higher among those with COPD, ORs for the more severe levels of all three scales were of similar magnitude in those with and without COPD (Figures 4 and 5). Vermeiren et al showed that frailty increases risk among community dwelling older adults for most negative outcomes.52 Similarly, Koroukian et al, used the HRS to examine combinations of chronic conditions, functional limitations, and geriatric syndromes (eg, visual impairment, hearing impairment, moderate/severe depressive symptoms, low cognitive performance, severe pain),53 and demonstrated that functional limitations were more predictive of adverse health outcomes than chronic conditions.
Our study findings are also consistent with and build upon other previous COPD studies. Martinez et al, likewise used the HRS (2006 and 2008 surveys) to examine relationships between COPD, cognitive impairment, and development of disability.54 Findings showed individuals with COPD were more likely than those without to have disability (defined as dependence on someone else to assist with ≥1 ADL), and more likely to have incident disability in the 2-year follow-up. Cognitive impairment was more common among Individuals with COPD, as was observed in our study, and there were additive effects between COPD and cognitive impairment on disability. Interestingly, hand-grip strength, a measurement that is helpful in identifying frailty, was also found in another study by Martinez et al to be related to higher rates of COPD exacerbations.55 Identification of measures with more sensitivity and specificity with regard to particular adverse outcomes, particularly with a goal to identifying individuals who might benefit from proactive interventions, is an area for future research.
In this population of community-dwelling individuals, prevalence of frailty among those age 50–64 using the Fried phenotype was 7.5%, and 11.0% for age ≥65; using the FI-CGA frailty prevalence was 15.9% for age 50–64 and 25.3% for age ≥65. These estimates for age ≥65 are similar to pooled prevalence estimates previously reported by Shamliyan et al for community-dwelling adults age ≥65 for the Fried phenotype (14%) and accumulation of deficits (24%).56
As expected, frailty was more prevalent among older persons compared to middle-aged persons, however lower middle-aged prevalence is due to those without COPD, as we found high frailty rates in both age groups of COPD. Our estimates among individuals with COPD for prevalence of frailty using the Fried phenotype (21.5% for age 50–64 and 23.1% for age ≥65) are slightly higher than, but in the range of the pooled prevalence of 19% (95% CI=14–24%) reported by Marengoni et al, a review that included studies from the US and other countries pertaining to adults age ≥18.6 We observed similar prevalence rates for frailty and for the modified BODE among those age 50–64 and age ≥65. It is possible that among individuals reporting COPD, the causal association between COPD and frailty and debility is stronger than the association between age and frailty and debility, resulting in age effects among persons with COPD becoming obscured. Prevalence of debility was also noted to be higher among middle-aged adults participating in recent US Behavioral Risk Factor Surveillance System surveys.57 Higher middle-aged prevalence of debility and frailty is also consistent with the fact COPD ranks third among leading causes of disability-adjusted life-years in the United States, and eleventh in terms of total years lived with disability.58 Middle-aged COPD patients are also known to have substantially increased healthcare cost and decreased work productivity.59
While not inclusive of depression and cognitive performance, the Fried phenotype and modified BODE indices utilized in this study included functional limitations related to strength, endurance, and lung functioning. Inclusion of chronic conditions improved measure performance in predicting adverse outcomes. Further addition of measures related to vision and motor skills did not appreciably change performance. Among individuals with COPD, prevalence of frailty using the Fried phenotype was similar to the prevalence of those with more severe modified BODE scores. Overlap between frailty, disability and comorbidity has been noted previously,60 and these scales identified overlapping but different populations. Among those 50–64 who were frail for the Fried Phenotype, approximately 40% also had more severe BODE scores, and within those ≥65 it was approximately 50%. Comparable relationships have been recently reported elsewhere. In a cohort of individuals (age ≥40) with stable COPD, Naval et al found approximately 40% of individuals identified as frail using the Fried phenotype also had more severe BODE scores.61 Using a deficit accumulation definition of frailty, Scarlata et al showed a strong correlation (r=0.53) between frailty and BODE scores among stable COPD patients age 60 or older.62
Recognizing that multiple definitions of frailty exist, but that each definition contributes to knowledge about frailty, Rockwood et al encouraged researchers to be clear about their frailty definition.17 Recent guidelines recommend all older adults (individuals ≥65 years of age) be screened for sarcopenia and for frailty using a validated instrument.60,63 Citing another study,64 the guidelines do not however recommend screening among all older adults. Our study however provides some potential support for earlier screening among individuals with COPD. Cross-sectional surveys have associated frailty with poor outcomes, but evidence exists that some can recover to robust status with targeted interventions. Pulmonary exercise rehabilitation has been shown to benefit COPD patients with frailty, although they also have twice the risk of not completing the program, often due to exacerbations and hospitalizations.22 Longitudinal follow-up in the NETT study found among those prefrail at baseline, 23% improved to non-frail in 12 months.23 Formal assessment of frailty might identify need for palliative care services, but could also identify some with COPD who might benefit from aggressive treatment.
Limitations
Although the recruitment scheme and weighted results for the HRS are designed to create a representative sample of older adults from across the United States, prevalence estimates and outcome associations for other countries may be different. Information about physician’s diagnosis of COPD and other morbidities is from participant self-report, causing potential for misclassification. Participants in this study were limited to community dwelling persons, thus older persons living in assisted or institutional living are not represented. However, it is likely these limitations would have biased our results to the null. Medication regimens or other physical and rehabilitative therapies may affect physical, emotional and cognitive functioning. Information on these was not available for survey participants in this study, however this is an area of investigation for future studies.
We considered unadjusted and adjusted regression models. While fully adjusted models included the majority factors that are associated with mortality and negative outcomes, other factors could be considered. AUC values were acceptable and similar to the 0.70 reported for other predictive mortality models based on frailty.56
Conclusion
Frailty and debility are common among COPD patients and have serious prognostic implications. Using a nationally representative database of well characterized community dwelling population, this study highlights that frailty is common not only among individuals with COPD age ≥65, but also those age 50 to 64. This work supports the concept of frailty as a quantifiable phenotype among COPD patients that identifies patients at increased risk of poor outcomes, even in study populations that have been homogenized by rigorous inclusion and exclusion criteria.65,66
Abbreviations
ADL, activities of daily living; AUC, area under the receiver operating characteristic curve; BMI, body mass index; CES-D8, Center for Epidemiologic Studies Depression Scale, 8 items; CHF, congestive heart failure; CI, confidence interval; COPD, chronic obstructive pulmonary disease; FEV1, forced expiratory volume in one second; FI-CGA, frailty index based on a comprehensive geriatric assessment; IADL, instrumental activities of daily living; HRS, Health and Retirement Study; MI, myocardial infarction; MMRC, modified Medical Research Council; NIA, National Institutes on Aging; OR, odds ratio; PEF, peak expiratory flow.
Funding
The study summarized in this article was partially funded by an investigator-initiated research grant from Sunovion Pharmaceuticals. Data used in this study is from the Health and Retirement Study, a longitudinal study sponsored by the National Institute on Aging (National Institutes of Health, Bethesda, MD; grant number NIA U01AG009740) and conducted by the University of Michigan (Ann Arbor, MI). The views expressed in this article do not communicate an official position of The University of New Mexico, or Sunovion Pharmaceuticals.
Disclosure
The authors report the following disclosures outside of the submitted work. Dr. Roberts reports grants from Sunovion Pharmaceuticals, receipt of research support from GlaxoSmithKline and manuscript writing support from Boehringer Ingelheim. Dr. Mapel reports grants from Sunovion Pharmaceuticals, personal fees from Genentech, receipt of research support from GlaxoSmithKline, and manuscript writing support from Boehringer Ingelheim and Genentech. Dr Melissa H Roberts reports grants from Sunovion Pharmaceuticals, during the conduct of the study; grants from GlaxoSmithKline, non-financial support from Boehringer Ingelheim, outside the submitted work; Dr Melanie A Dodd reports grants from Sunovion Pharmaceuticals, during the conduct of the study. The authors report no other conflicts of interest in this work.
References
1. Barnes PJ, Celli BR. Systemic manifestations and comorbidities of COPD. Eur Resp J. 2009;33(5):1165–1185. doi:10.1183/09031936.00128008
2. Katz PP, Gregorich S, Eisner M, et al. Disability in valued life activities among individuals with COPD and other respiratory conditions. J Cardiopulm Rehabil Prev. 2010;30(2):126–136. doi:10.1097/HCR.0b013e3181be7e59
3. Xue QL. The frailty syndrome: definition and natural history. Clin Geriatric Med. 2011;27(1):1–15. doi:10.1016/j.cger.2010.08.009
4. Guan C, Niu H. Frailty assessment in older adults with chronic obstructive respiratory diseases. Clin Interv Aging. 2018;13:1513–1524. doi:10.2147/CIA.S173239
5. Lahousse L, Ziere G, Verlinden VJA, et al. Risk of frailty in elderly with COPD: a population-based study. J Gerontol a Biol Sci Med Sci. 2016;71(5):689–695. doi:10.1093/gerona/glv154
6. Marengoni A, Vetrano DL, Manes-Gravina E, Bernabei R, Onder G, Palmer K. The relationship between COPD and frailty: a systematic review and meta-analysis of observational studies. Chest. 2018;154(1):21–40. doi:10.1016/j.chest.2018.02.014
7. Watanabe Y, Hirano H, Arai H, et al. Relationship between frailty and oral function in community-dwelling elderly adults. J Am Geriatr Soc. 2017;65(1):66–76. doi:10.1111/jgs.14355
8. Maddocks M, Kon SSC, Canavan JL, et al. Physical frailty and pulmonary rehabilitation in COPD: a prospective cohort study. Thorax. 2016;71(11):988–995.
9. Gale NS, Albarrati AM, Munnery MM, et al. Frailty: a global measure of the multisystem impact of COPD. Chron Respir Dis. 2018;15(4):347–355. doi:10.1177/1479972317752763
10. Mittal N, Raj R, Islam EA, Nugent K. The frequency of frailty in ambulatory patients with chronic lung diseases. J Prim Care Community Health. 2016;7(1):10–15. doi:10.1177/2150131915603202
11. Park SK, Richardson CR, Holleman RG, Larson JL. Frailty in people with COPD, using the National Health and Nutrition Evaluation Survey dataset (2003–2006). Heart Lung. 2013;42(3):163–170. doi:10.1016/j.hrtlng.2012.07.004
12. Bandeen-Roche K, Seplaki CL, Huang J, et al. Frailty in older adults: a nationally representative profile in the United States. J Gerontol Biol Sci Med Sci. 2015;70(11):1427–1434. doi:10.1093/gerona/glv133
13. Santos-Eggimann B, Cuénoud P, Spagnoli J, Junod J. Prevalence of frailty in middle-aged and older community-dwelling Europeans living in 10 countries. J Gerontol Biol Sci Med Sci. 2009;64(6):675–681. doi:10.1093/gerona/glp012
14. Pilotto A, Cella A, Pilotto A, et al. Three decades of comprehensive geriatric assessment: evidence coming from different healthcare settings and specific clinical conditions. J Am Med Dir Assoc. 2017;18(2):
15. Fried LP, Tangen CM, Walston J, et al. Frailty in older adults: evidence for a phenotype. J Gerontol Biol Sci Med Sci. 2001;56(3):M146–M156. doi:10.1093/gerona/56.3.M146
16. Rockwood K, Mitnitski A. Frailty defined by deficit accumulation and geriatric medicine defined by frailty. Clin Geriatr Med. 2011;27(1):17–26. doi:10.1016/j.cger.2010.08.008
17. Rockwood K, Andrew M, Mitnitski A. A Comparison of two approaches to measuring frailty in elderly people. J Gerontol a Biol Sci Med Sci. 2007;62(7):738–743. doi:10.1093/gerona/62.7.738
18. Cesari M, Gambassi G, Abellan van Kan G, Vellas B. The frailty phenotype and the frailty index: different instruments for different purposes. Age Ageing. 2013;43(1):10–12. doi:10.1093/ageing/aft160
19. Cigolle CT, Ofstedal MB, Tian Z, Blaum CS. Comparing models of frailty: the health and retirement study. J Am Geriatr Soc. 2009;57(5):830–839. doi:10.1111/j.1532-5415.2009.02225.x
20. Rockwood K, Song X, Mitnitski A. Changes in relative fitness and frailty across the adult lifespan: evidence from the Canadian National Population Health Survey. CMAJ. 2011;183(8):E487–494. doi:10.1503/cmaj.101271
21. Cicutto LC. Frailty: is this a new vital sign? Chest. 2018;154(1):1–2. doi:10.1016/j.chest.2018.03.041
22. Maddocks M, Kon SS, Canavan JL, et al. Physical frailty and pulmonary rehabilitation in COPD: a prospective cohort study. Thorax. 2016;71(11):988–995. doi:10.1136/thoraxjnl-2016-208460
23. Kennedy CC, Novotny PJ, LeBrasseur NK, Wise RA, Sciurba FC, Benzo RP. Frailty and clinical outcomes in chronic obstructive pulmonary disease. Ann Am Thorac Soc. 2019;16(2):217–224. doi:10.1513/AnnalsATS.201803-175OC
24. Galloway RV, Karmarkar AM, Graham JE, et al. Hospital readmission following discharge from inpatient rehabilitation for older adults with debility. Phys Ther. 2016;96(2):241–251. doi:10.2522/ptj.20150030
25. Decramer M, De Benedetto F, Del Ponte A, Marinari S. Systemic effects of COPD. Respir Med. 2005;99:S3–S10. doi:10.1016/j.rmed.2005.09.010
26. Celli BR, Cote CG, Marin JM, et al. The body-mass index, airflow obstruction, dyspnea, and exercise capacity index in chronic obstructive pulmonary disease. N Engl J Med. 2004;350(10):1005–1012. doi:10.1056/NEJMoa021322
27. Prince CS, Noren Hooten N, Mode NA, et al. Frailty in middle age is associated with frailty status and race-specific changes to the transcriptome. Aging. 2019;11(15):5518–5534. doi:10.18632/aging.102135
28. Sonnega A, Faul JD, Ofstedal MB, Langa KM, Phillips JWR, Weir DR. Cohort profile: the Health and Retirement Study (HRS). Int J Epidemiol. 2014;43(2):576–585. doi:10.1093/ije/dyu067
29. Fisher GG, Faul JD, Weir DR, Wallace RB. Documentation of chronic disease measures in the Health and Retirement Study (HRS/AHEAD). Ann Arbor, MI: HRS/AHEAD Documentation Report Survey Research Center, Institute for Social Research, University of Michigan.
30. Fonda S, Herzog AR. Documentation of physical functioning measured in the health and retirement study and the asset and health dynamics among the oldest old study (DR-008). Ann Arbor, MI: HRS/AHEAD Documentation Report Survey Research Center, Institute for Social Research, University of Michigan; 2004.
31. Steffick DE. Documentation of affective functioning measures in the Health and Retirement Study. Ann Arbor, MI: HRS/AHEAD Documentation Report Survey Research Center, Institute for Social Research, University of Michigan; 2000.
32. Ofstedal MB, Fisher GG, Herzog AR. Documentation of cognitive functioning measures in the Health and Retirement Study (HRS/AHEAD). Ann Arbor, MI: HRS/AHEAD Documentation Report DR-006 Survey Research Center, Institute for Social Research, University of Michigan; 2005.
33. Crimmins E, Guyer H, Langa K, Ofstedal MB, Wallace R, Weir D Documentation of physical measures, anthropometrics and blood pressure in the Health and Retirement Study (DR-011). Ann Arbor, MI: HRS/AHEAD Documentation Report Survey Research Center, Institute for Social Research, University of Michigan; 2008.
34. Lohman MC, Sonnega AJ, Resciniti NV, Leggett AN. Frailty phenotype and cause-specific mortality in the United States. J Gerontol a Biol Sci Med Sci. 2020;75(10):1935–1942. doi:10.1093/gerona/glaa025
35. Marin JM, Alfageme I, Almagro P, et al. Multicomponent indices to predict survival in COPD: the COCOMICS study. Eur Resp J. 2013;42(2):323–332. doi:10.1183/09031936.00121012
36. Roberts MH, Mapel DW, Bruse S, Petersen H, Nyunoya T. Development of a modified BODE Index as a mortality risk measure among older adults with and without chronic obstructive pulmonary disease. Am J Epidemiol. 2013;178(7):1150–1160. doi:10.1093/aje/kwt087
37. Roberts MH, Mapel DW. Limited lung function: impact of reduced peak expiratory flow on health status, health-care utilization, and expected survival in older adults. Am J Epidemiol. 2012;176(2):127–134. doi:10.1093/aje/kwr503
38. Hung WW, Wisnivesky JP, Siu AL, Ross JS. Cognitive decline among patients with chronic obstructive pulmonary disease. Am J Respir Crit Care Med. 2009;180(2):134–137. doi:10.1164/rccm.200902-0276OC
39. Cao H. IMPUTE: a SAS application system for missing value imputations. Ann Arbor, MI: HRS/AHEAD Documentation Report Survey Research Center, Institute for Social Research, University of Michigan.
40. Fisher GG, Hassan H, Rodgers WL, Weir DR. Health and retirement study imputation of cognitive functioning measures: 1992–2006 data description. Ann Arbor, MI: HRS/AHEAD Documentation Report Survey Research Center, Institute for Social Research, University of Michigan.
41. Weir DR. Validating mortality ascertainment in the health and retirement study. Ann Arbor, MI: HRS/AHEAD Documentation Report Survey Research Center, Institute for Social Research, University of Michigan.
42. Ofstedal MB, Weir DR, Kuang-Tsung C, Wagner JA. Updates to HRS sample weights. Ann Arbor, Michigan: Institute for Social Research, University of Michigan; 2011.
43. HRS. Sampling weights: revised for tracker 2.0 & beyond. Ann Arbor, MI: Survey Research Center, Institute for Social Research, University of Michigan; 2019.
44. Hosmer D, Lemeshow S. Applied Logistic Regression.
45. Hosmer DW, Lemeshow S, Sturdivant RX. Applied Logistic Regression.
46. Ford ES, Croft JB, Mannino DM, Wheaton AG, Zhang X, Giles WH. COPD surveillance–United States, 1999–2011. Chest. 2013;144(1):284–305. doi:10.1378/chest.13-0809
47. Sullivan J, Pravosud V, Mannino DM, Siegel K, Choate R, Sullivan T. National and State estimates of COPD morbidity and mortality - United States, 2014–2015. Chronic Obstr Pulm Dis. 2018;5(4):324–333. doi:10.15326/jcopdf.5.4.2018.0157
48. CMS. Medicare chronic condition charts, CCW condition period prevalence, 2016: pulmonary conditions - trends, 2007–2016. CMS; 2018. Available from: https://www.ccwdata.org/web/guest/medicare-charts/medicare-chronic-condition-charts/#b2_pulm_2007_2016.
49. Grabovac I, Haider S, Mogg C, et al. Frailty status predicts all-cause and cause-specific mortality in community dwelling older adults. J Am Med Dir Assoc. 2019;20(10):1230–1235.e1232. doi:10.1016/j.jamda.2019.06.007
50. Ekram A, Woods RL, Britt C, Espinoza S, Ernst ME, Ryan J. The Association between frailty and all-cause mortality in community-dwelling older individuals: an umbrella review. J Frailty Aging. 2021;10(4):320–326. doi:10.14283/jfa.2021.20
51. Vaz Fragoso CA, Enright PL, McAvay G, Van Ness PH, Gill TM. Frailty and respiratory impairment in older persons. Am J Med. 2012;125(1):79–86. doi:10.1016/j.amjmed.2011.06.024
52. Vermeiren S, Vella-Azzopardi R, Beckwée D, et al. Frailty and the prediction of negative health outcomes: a meta-analysis. J Am Med Dir Assoc. 2016;17(12):
53. Koroukian SM, Schiltz N, Warner DF, et al. Combinations of chronic conditions, functional limitations, and geriatric syndromes that predict health outcomes. J Gen Intern Med. 2016;31(6):630–637. doi:10.1007/s11606-016-3590-9
54. Martinez CH, Richardson CR, Han MK, Cigolle CT. Chronic obstructive pulmonary disease, cognitive impairment, and development of disability: the Health and Retirement Study. Annals ATS. 2014;11(9):1362–1370. doi:10.1513/AnnalsATS.201405-187OC
55. Martinez CH, Diaz AA, Meldrum CA, et al. Handgrip strength in chronic obstructive pulmonary disease. associations with acute exacerbations and body composition. Annals ATS. 2017;14(11):1638–1645. doi:10.1513/AnnalsATS.201610-821OC
56. Shamliyan T, Talley KMC, Ramakrishnan R, Kane RL. Association of frailty with survival: a systematic literature review. Ageing Res Rev. 2013;12(2):719–736. doi:10.1016/j.arr.2012.03.001
57. Djibo DA, Goldstein J, Ford JG. Prevalence of disability among adults with chronic obstructive pulmonary disease, behavioral risk factor surveillance system 2016–2017. PLoS One. 2020;15(2):e0229404. doi:10.1371/journal.pone.0229404
58. Murray CJ, Abraham J, Ali MK, et al. The state of US health, 1990–2016: burden of diseases, injuries, and risk factors among US States. JAMA. 2018;319(14):1444–1472. doi:10.1001/jama.2018.0158
59. Patel JG, Coutinho AD, Lunacsek OE, Dalal AA. COPD affects worker productivity and health care costs. Int J Chron Obstruct Pulmon Dis. 2018;13:2301–2311. doi:10.2147/COPD.S163795
60. Dent E, Morley JE, Cruz-Jentoft AJ, et al. Physical Frailty: ICFSR International clinical practice guidelines for identification and management. J Nutr Health Aging. 2019;23(9):771–787. doi:10.1007/s12603-019-1273-z
61. Naval E, González MC, Giraldós S, et al. Frailty assessment in a stable COPD cohort: is there a COPD-frail phenotype? COPD. 2021;4:1–8.
62. Scarlata S, Finamore P, Laudisio A, et al. Association between frailty index, lung function, and major clinical determinants in chronic obstructive pulmonary disease. Aging Clin Exp Res. 2021;33(8):2165–2173. doi:10.1007/s40520-021-01878-z
63. Dent E, Morley JE, Cruz-Jentoft AJ, et al. International clinical practice guidelines for sarcopenia (ICFSR): screening, diagnosis and management. J Nutr Health Aging. 2018;22(10):1148–1161. doi:10.1007/s12603-018-1139-9
64. Ambagtsheer RC, Beilby JJ, Visvanathan R, Dent E, Yu S, Braunack-Mayer AJ. Should we screen for frailty in primary care settings? A fresh perspective on the frailty evidence base: a narrative review. Prev Med. 2019;119:63–69. doi:10.1016/j.ypmed.2018.12.020
65. Singer JP, Diamond JM, Anderson MR, et al. Frailty phenotypes and mortality after lung transplantation: a prospective cohort study. Am J Transplant. 2018;18(8):1995–2004. doi:10.1111/ajt.14873
66. Singer JP, Diamond JM, Gries CJ, et al. Frailty phenotypes, disability, and outcomes in adult candidates for lung transplantation. Am J Respir Crit Care Med. 2015;192(11):1325–1334. doi:10.1164/rccm.201506-1150OC
 © 2022 The Author(s). This work is published and licensed by Dove Medical Press Limited. The
full terms of this license are available at https://www.dovepress.com/terms
and incorporate the Creative Commons Attribution
- Non Commercial (unported, 3.0) License.
By accessing the work you hereby accept the Terms. Non-commercial uses of the work are permitted
without any further permission from Dove Medical Press Limited, provided the work is properly
attributed. For permission for commercial use of this work, please see paragraphs 4.2 and 5 of our Terms.
© 2022 The Author(s). This work is published and licensed by Dove Medical Press Limited. The
full terms of this license are available at https://www.dovepress.com/terms
and incorporate the Creative Commons Attribution
- Non Commercial (unported, 3.0) License.
By accessing the work you hereby accept the Terms. Non-commercial uses of the work are permitted
without any further permission from Dove Medical Press Limited, provided the work is properly
attributed. For permission for commercial use of this work, please see paragraphs 4.2 and 5 of our Terms.