")
Back to Journals » Cancer Management and Research » Volume 11
FOXN2 is downregulated in breast cancer and regulates migration, invasion, and epithelial–mesenchymal transition through regulation of SLUG
Received 12 June 2018
Accepted for publication 3 August 2018
Published 4 January 2019 Volume 2019:11 Pages 525—535
DOI https://doi.org/10.2147/CMAR.S176938
Checked for plagiarism Yes
Review by Single anonymous peer review
Peer reviewer comments 2
Editor who approved publication: Dr Antonella D'Anneo
Hui Ye,1 Meiling Duan2
1Department of Galactophore, Linyi Central Hospital of Shandong, Linyi, 276400, China; 2Department of Respiratory One, Linyi Central Hospital of Shandong, Linyi, 276400, China
Introduction: Forkhead box (FOX) N2 (FOXN2), a member of FOX protein family, has been reported to play critical roles in some types of cancers. However, the expression and function of FOXN2 in breast cancer remain unclear.
Methods: In the present work, we explored the detailed molecular mechanism of FOXN2 in breast cancer. We performed RT-qPCR and Western blotting analysis to detect the expression of FOXN2 in breast cancer. Colony formation assay, CCK-8 assay, wound healing assay, and Transwell assay were used to determine the effect of FOXN2 on cell proliferation, migration, and invasion in breast cancer.
Results: Our results demonstrated that FOXN2 was downregulated in breast cancer tissues and cell lines. Downregulation of FOXN2 was correlated with tumor size, pathological grade, and lymph node metastasis. The in vitro experiments revealed that the ectopic expression of FOXN2 significantly suppressed the proliferation, migration, and invasiveness of breast cancer cells, and inhibition of FOXN2 promoted the proliferation, migration, and invasiveness of breast cancer cells. Moreover, inhibition of FOXN2 facilitated epithelial–mesenchymal transition (EMT) through regulation of SLUG.
Conclusion: Taken together, our results showed for the first time that FOXN2 plays an essential role in cell proliferation and invasion. Thus, FOXN2 may be an attractive therapeutic target for the treatment of breast cancer.
Keywords: FOXN2, proliferation, EMT, SLUG, breast cancer
Introduction
Breast carcinoma is a common and principal cause of cancer-related death in women worldwide.1 Disorder in development of mammary epithelia is a prominent process contributing to tumorigenesis of breast carcinoma.2
The forkhead box (FOX) transcription factor superfamily is characterized by a highly conserved forkhead/winged helix DNA-binding domain. FOX family has been found to mediate a wide spectrum of biological processes, such as proliferation, apoptosis, differentiation, metabolism, and migration.3,4 An increasing evidence has revealed that the abnormal expression of FOX transcription factors results in the onset and progression of multiple cancers through directly regulating epithelial–mesenchymal transition (EMT).5
Forkhead box N2 (FOXN2), a member of the FOX transcription factor family, has been found to play key roles in various types of human cancers. A recent report has indicated that FOXN2 is downregulated and serves as a tumor suppressor in T-cell leukemia.6 Moreover, FOXN2 also inhibits tumorigenesis and radioresistance in lung cancer.7 In addition, downregulation of FOXN2 is closely associated with adverse prognosis in adult glioblastoma multiforme treated with radiotherapy or chemotherapy.8 Above studies have provided obvious clues regarding FOXN2 function in cancer development. Nevertheless, the function of FOXN2 in breast cancer is still unknown.
Previous reports have shown that EMT is an essential phenotypic event during embryonic development and tissue remodeling.9–11 In cancer, EMT induces epithelial cells to lose their polarity and become migratory mesenchymal cells, thereby facilitating tumor invasion and metastasis.12–15 The loss of E-cadherin and gain of N-cadherin have been frequently observed in tumor cells undergoing EMT.12,16 In addition, expression of the intermediate filament protein vimentin, which is known to induce changes in cell motility, is a classic marker of EMT.17 In EMT programming, pleiotropic EMT-related transcription factors (EMT-TFs), such as ZEB1, SNAIL1, and SNAIL2, form an interaction network in concert to regulate the EMT phenotype.18
The present study verified that FOXN2 was downregulated in breast cancer tissues and cell lines. The low expression of FOXN2 was associated with tumor size, pathological grade, and lymph node metastasis. In addition, downregulation of FOXN2 predicted a poor prognosis. The in vitro experiments demonstrated that knockdown of FOXN2 significantly promoted the proliferation, migration, and invasiveness of breast cancer cells. In addition, FOXN2 also repressed EMT through regulation of SLUG. Here, we proved FOXN2 as an attractive therapeutic target for the treatment of breast cancer.
Patients and methods
Patients and tissue samples
A total of 130 pairs of breast cancer tissues and adjacent normal tissues were obtained from patients with breast cancer who underwent surgery at Linyi Central Hospital of Shandong from April 2006 to April 2008. The patients who received radiotherapy or chemotherapy before surgery were excluded, and breast cancer tissues were confirmed using pathological method. Written informed consent was obtained from each patient, and the experiments of human tissue samples were approved by the Clinical Research Ethics Committee of Linyi Central Hospital of Shandong.
Cell lines and culture conditions
Human MCF-7 and MDA-MB-231 breast cancer cell lines and the human MCF-10A nontumorigenic breast cell line were acquired from the Shanghai Institute of Biochemistry and Cell Biology, Shanghai Institutes for Biological Sciences, and Chinese Academy of Sciences (Shanghai, China). MCF-7 cell was cultured in DMEM (HyClone, Logan, UT, USA) supplemented with 1% penicillin, 1% streptomycin, and 10% FBS (HyClone) at 37°C in 5% CO2 atmosphere. MDA-MB-231 cells were cultured in L-15 medium (HyClone) supplemented with 1% penicillin, 1% streptomycin, and 10% FBS at 37°C without CO2 atmosphere. MCF-10A cells were cultured in DMEM/F12 medium supplemented with insulin (10 µg/mL), EGF (10 ng/mL), heat-inactivated horse serum (5%), cholera toxin (1 µg/mL), and hydrocortisone (1 µg/mL) at 37°C in 5% CO2 atmosphere.
Cell transfection
siRNA targeting FOXN2 or SLUG and scramble siRNA (SCR) were chemically synthesized from GenePharma Co., Ltd (Shanghai, China). MCF-7 and MDA-MB-231 cells were added to six-well plates (Corning Incorporated, Corning, NY, USA) at a density of 4×10⁵ cells/well and incubated to reach approximately 30%–40% confluence. Then, cells were transfected with SCR or FOXN2 siRNA (siFOXN2) using Lipofectamine 2000 (Thermo Fisher Scientific, Waltham, MA, USA) according to the manufacturer’s protocol. After transfection for 48 hours, the transfection efficiency was confirmed by quantitative reverse transcription PCR (RT-qPCR) and Western blot analysis. Three biological replicates were carried out. The following primers were used: siFOXN2-1: 5′-GAGGAGUUACGGCAAUGCA-3′; siFOXN2-2: 5′-CCUUGCUGGAAUUCGUACA-3′; SLUG siRNA: 5′-GGAATATGTGAGCCTGGGCGCC-3′; SCR: 5′-GAACCGTGTCTTCCTCAGTATC-3′.
Western blotting assay
Total protein was prepared from cells using RIPA buffer (Beyotime, Jiangsu, People’s Republic of China). The concentration of protein samples was measured using a BCA kit (Pierce, Waltham, MA, USA) according to the manufacturer’s instructions. Fifty micrograms of cell lysates was loaded on 8% SDS-PAGE gel and then transferred onto a polyvinylidene difluoride (PVDF) membrane. After blocking with 5% nonfat dry milk, the membrane was incubated with indicated antibodies at 4°C overnight. After washing with Tris buffered saline-Tween 20 (TBST) for three times, the membranes were incubated with horseradish peroxidase (HRP)-conjugated secondary antibodies at room temperature for 1 hour and washed with TBST for three times. Finally, the proteins were visualized with an ECL Western blotting detection kit (Amersham Biosciences, Little Chalfont, UK) according to the manufacturer’s instructions. The following antibodies were used: FOXN2 (1:3,000; cat: HPA003485; Sigma-Aldrich Co., St. Louis, MO, USA); β-actin (1:4,000; cat: HPA041264; Sigma-Aldrich Co.); EMT kit (1:1,000; cat: 9782T; CST, Danvers, MA, USA); goat anti-rabbit (1:5,000; cat: ab6721: Abcam, Cambridge, UK); and goat anti-mouse (1:3,000; cat: ab6728; Abcam). All experiments were repeated three times.
RNA extraction and RT-qPCR
Total RNA was extracted from tissues and cells using TRIzol reagent (Thermo Fisher Scientific) according to the manufacturer’s protocol. Two micrograms of total RNA extracted was subjected to synthesize cDNA using a one-step RT-PCR kit (TaKaRa, Tokyo, Japan). Subsequently, SYBR Green Mix (Roche Diagnostics, Mannheim, Germany) was used to perform RT-PCR with an ABI 7300 real-time PCR thermal cycle instrument (Thermo Fisher Scientific, Waltham, MA, USA). GAPDH served as an internal control. The relative gene expression was calculated with the 2–ΔΔCq method. The primers were as follows: FOXN2, forward: 5′-AGTCCATTGTATGACATAGAGGG-3′ and reverse: 5′-TTCCATTAACCTTGCCATGG-3′; E-cadherin, forward: 5′-CCTCGAACTATATTCTTCTGTGAG-3′ and reverse: 5′-ATAGATTCTTGGGTTGGGTC-3′; N-cadherin, forward: 5′-GTCATCACAGTGACAGATGTC-3′ and reverse: 5′-TTCAAAGTCGATTGGTTTGACC-3′; vimentin, forward: 5′-AAAGGAACCAATGAGTCCCT-3′ and reverse: 5′-AAGGGCCATCTTAACATTGAG-3′; SLUG, forward: 5′-AGATGCATATTCGGACCCACA-3′ and reverse: 5′-CCTCATGTTTGTGCAGGAGAG-3′; SNAIL, forward: 5′-CTGAGGGGAGGCTCATACTG-3′ and reverse: 5′-AGAGAGGCATCCTCCAGACA-3′; ZEB1, forward: 5′-GCCAACAGACCAGACAGTGTT-3′ and reverse: 5′-TCTTGCCCTTCCTTTCCTG-3′; GAPDH, forward: 5′-GGTATCGTGGAAGGACTCATGAC-3′ and reverse: 5′-ATGCCAGTGAGCTTCCCGTTCAGC-3′. All experiments were repeated three times.
Cell counting kit 8 (CCK8) assay
Approximately 3×10³ transfected MCF-7 and MDA-MB-231 cells were seeded in 96-well plates (Corning Incorporated) with 200 µL DMDM. At 0 hour, 24 hours, 48 hours, and 72 hours, 20 µL of CCK-8 reagent was added to each well and incubated with the cells at 37°C for 1 hour. Absorbance values at 450 nm wavelength were measured with a Bio-Rad Benchmark micro-plate reader (Bio-Rad Laboratories Inc., Hercules, CA, USA). All experiments were repeated three times.
Colony formation assay
MCF-7 and MDA-MB-231 cells were transfected with vector, FLAG-FOXN2 plasmid, SCR, or siFOXN2. After transfection for 48 hours, approximately 5,000 cells were plated in six-well plates and maintained in a serum-free medium. After 14 days, cells were washed with PBS three times and fixed in 4% paraformaldehyde for 10 minutes at room temperature. Cells were stained with 0.1% crystal violet (Sigma-Aldrich Co.). The number of colonies are counted using Image J software (National Institutes of Health, Bethesda, MD, USA). All experiments were repeated three times.
Wound healing assay
Approximately 5×10⁵ transfected MCF-7 and MDA-MB-231 cells were seeded onto 12-well plates and incubated to reach approximately 90%–100% confluence. A scratch wound line was performed using a 20 µL pipette tip. The detached cells were removed using PBS. Cells were maintained in a serum-free DMEM. The images were taken at different time points, including the starting time point (0 hour) and at 48 hours after the scratch. The relative migration distance = (the width at 0 hour–the width at 48 hours)/the width at 0 hour. All experiments were repeated three times.
Transwell invasion assay
Tranwell invasion assay with a Matrigel-coated membrane was performed using a 24-well transwell inserts (8 mm pore filters; BD Biosciences) according to the manufacturers’ protocol. For both assays, 3×10⁵ transfected MDA-MB-231 cells suspended in 300 µL serum-free L-15 were seeded in the upper compartment, while the lower chamber was filled with 400 µL of L-15 medium supplemented with 10% FBS. After incubation for 18 hours, cells were stained with 0.1% crystal violate at room temperature for 10 minutes, and the cells on the upper surface of the membrane were removed with a cotton swab. Finally, the invaded cells were counted in six representative fields by a light microscopy (40× magnification). All experiments were repeated three times.
Dual luciferase assays
The pGL3 vector was purchased from Promega Corporation (Fitchburg, WI, USA) and used for dual luciferase assay. The wild-type promoter region (−2,000, +200) of SLUG was cloned into the pGL3vector (WT-pGL3-SLUG). The QuikChange Lightning Site-Directed Mutagenesis kit (Agilent Technologies, Santa Clara, CA, USA) was used to mutate the promoter region of SLUG (TTAAACCACTC, MT-pGL3-SLUG). For dual luciferase assays, approximately 4×10⁵ MCF-7 or MDA-MB-231 cells were seeded in a six-well plate and cotransfected with 1 µg WT-pGL3-SLUG or MT-pGL3-SLUG, 0.5 µg renilla, and 2 µg vector or 2 µg pcDNA3.1-FOXN2 plasmid or 30 Nm SCR or siFOXN2 using Lipofectamine 2000 (Thermo Fisher Scientific). After transfection for 24 hours, luciferase activities were measured using a Dual Luciferase Reporter Assay System (Promega Corporation) according to manufacturer’s instructions. All experiments were repeated three times.
ChIP assay
ChIP assay was performed using an EZ ChIP Kit (EMD Millipore, Billerica, MA, USA) according to the manufacturer’s protocol. In brief, cells were chemically cross-linked with 1% formaldehyde at 37 °C for 30 minutes, and cross-linked chromatin was sonicated into 200 bp to 1,000 bp fragments. The chromatin was immunoprecipitated using 5 µL anti-FOXN2 antibody. IgG was used as a negative control. After eluting the binding chromatin using PCR Purification kit (Qiagen NV, Venlo, the Netherlands), qRT-PCR was performed with the specific primer pairs: SLUG forward, 5′-CTGGATTATGCCTCTGTGAT-3′; reverse 5′-TGGTATTTATTTGCTGGTAG-3′. All experiments were repeated three times.
Statistical analyses
Data are presented as mean±SD. Statistical analyses were performed with SPSS software (version 17.0; SPSS Inc., Chicago, IL, USA). One-way ANOVA followed by Tukey’s post hoc test was used to assess the difference between multiple groups, and Student’s t-test was used to assess the difference between two groups. The Kaplan–Meier method followed by log-rank test was used to plot the survival curves based on the FOXN2 relative expression and overall survival. P<0.05 was considered statistically significant. All experiments were repeated three times.
Results
The relatively lower expression level of FOXN2 in breast cancer
First, we detected the expression of FOXN2 in breast cancer tumor tissue samples using RT-qPCR. Compared to adjacent normal tissue samples, the expression of FOXN2 in tumor tissues was obviously downregulated (Figure 1A). Subsequently, we also detected the expression of FOXN2 in breast cancer cell lines, including MCF-7 and MDA-MB-231 cells. Nontumorigenic normal breast cell line, MCF-10A, was used as a control. The results of RT-qPCR and Western blotting analyses revealed that both mRNA and protein levels of FOXN2 expression were markedly lower in breast cancer cell lines (MCF-7 and MDA-MB-231) than that in MCF-10A cells (Figure 1B). After analyzing the correlation of FOXN2 expression and patient clinicopathological features, we found that the downregulation of FOXN2 was associated with tumor size, pathological grade, and lymph node metastasis (Table 1; P<0.05). In addition, Kaplan–Meier followed by log-rank was used to analyze the survival rate, suggesting that the patients with low expression of FOXN2 had a poor prognosis (Figure 1C; P<0.05). Together, our findings reveal that downregulation of FOXN2 plays a key role in breast cancer development.
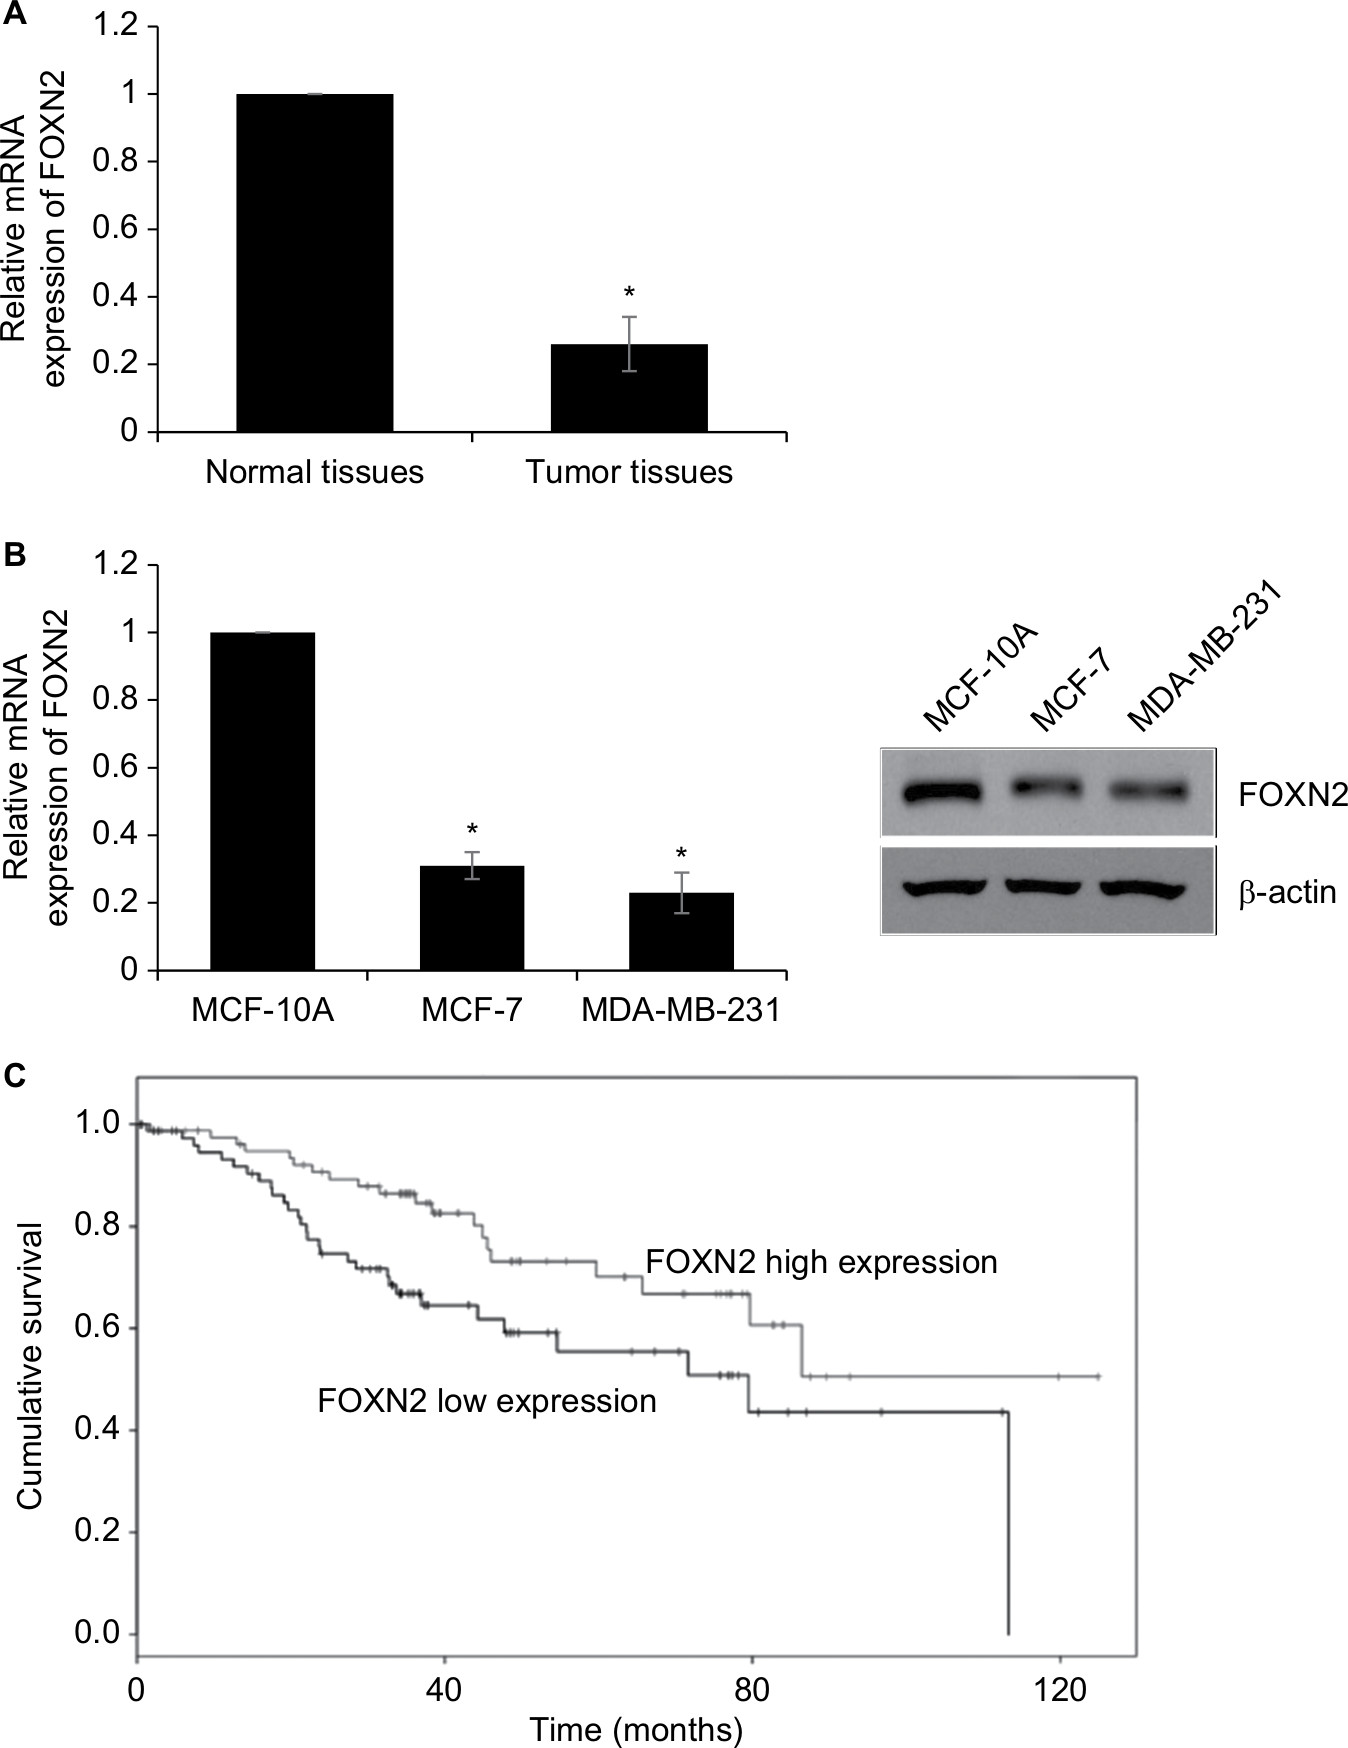 | Figure 1 The relatively lower expression level of FOXN2 in breast cancer. Notes: (A) RT-qPCR assay revealed that FOXN2 expression levels were lower in breast cancer tissues compared with expression levels in adjacent healthy tissues. *P<0.05 vs adjacent normal tissues. (B) RT-qPCR and Western blotting results indicated that breast cells, including MCF-7 and MDA-MB-231, expressed lower levels of FOXN2 than MCF-10A cell. *P<0.05 vs MCF-10A. (C) Kaplan–Meier analysis followed by log-rank analysis demonstrated that the low expression of FOXN2 was associated with poor prognosis. Abbreviations: FOXN2, forkhead box N2; RT-qPCR, quantitative reverse transcription PCR. |
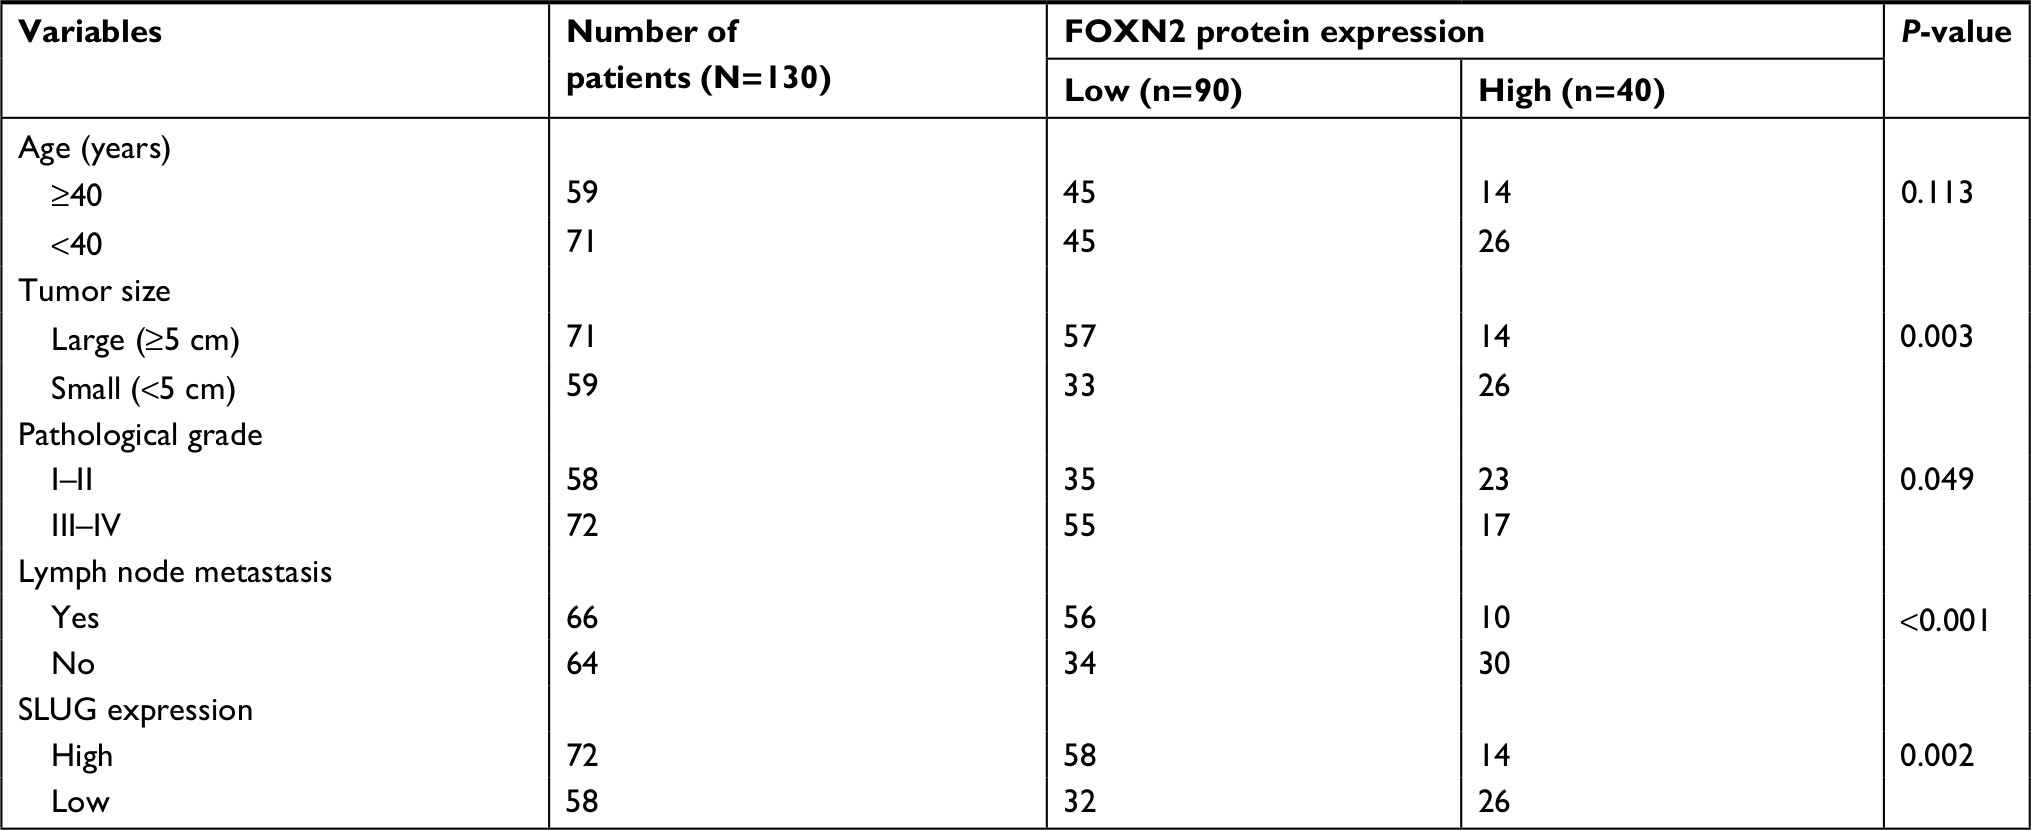 | Table 1 Clinicopathologic variables in 130 BC patients Abbreviations: BC, breast cancer; FOXN2, forkhead box N2. |
Downregulation of FOXN2 in breast cancer cells promotes breast cancer proliferation
Next, we explored whether the regulation of FOXN2 could affect the proliferation of breast cancer cells. We established FOXN2-knockdown or overexpressed cells using siRNA for human FOXN2 or pcDNA3.1-FOXN2, respectively. The expression of FOXN2 was determined using RT-qPCR and Western blotting analyses (Figure 2A and B). siFOXN2#2 was more efficient, so it was used in the further experiments. To assess the effect of FOXN2 on cellular proliferation, CCK-8 and colony formation assays were performed. The CCK-8 assay indicated that the ectopic expression of FOXN2 in MCF-7 and MDA-MB-231 cells led to impaired proliferation rate, compared with the vector group; however, knockdown of FOXN2 in MCF-7 and MDA-MB-231 cells resulted in an elevated proliferation rate, compared with the SCR group (Figure 2C). The effect of FOXN2 expression on the proliferation of breast cancer cells was also confirmed by colony formation assay, which demonstrated that the colony-forming efficiency was drastically decreased in cells with FOXN2 overexpression, while the knockdown of FOXN2 obviously facilitated the colony-forming efficiency (Figure 2D). Collectively, all these data demonstrate the inhibitory effect of FOXN2 overexpression on the proliferation of breast cancer cells in vitro, and inhibition of FOXN2 significantly facilitates breast cancer proliferation.
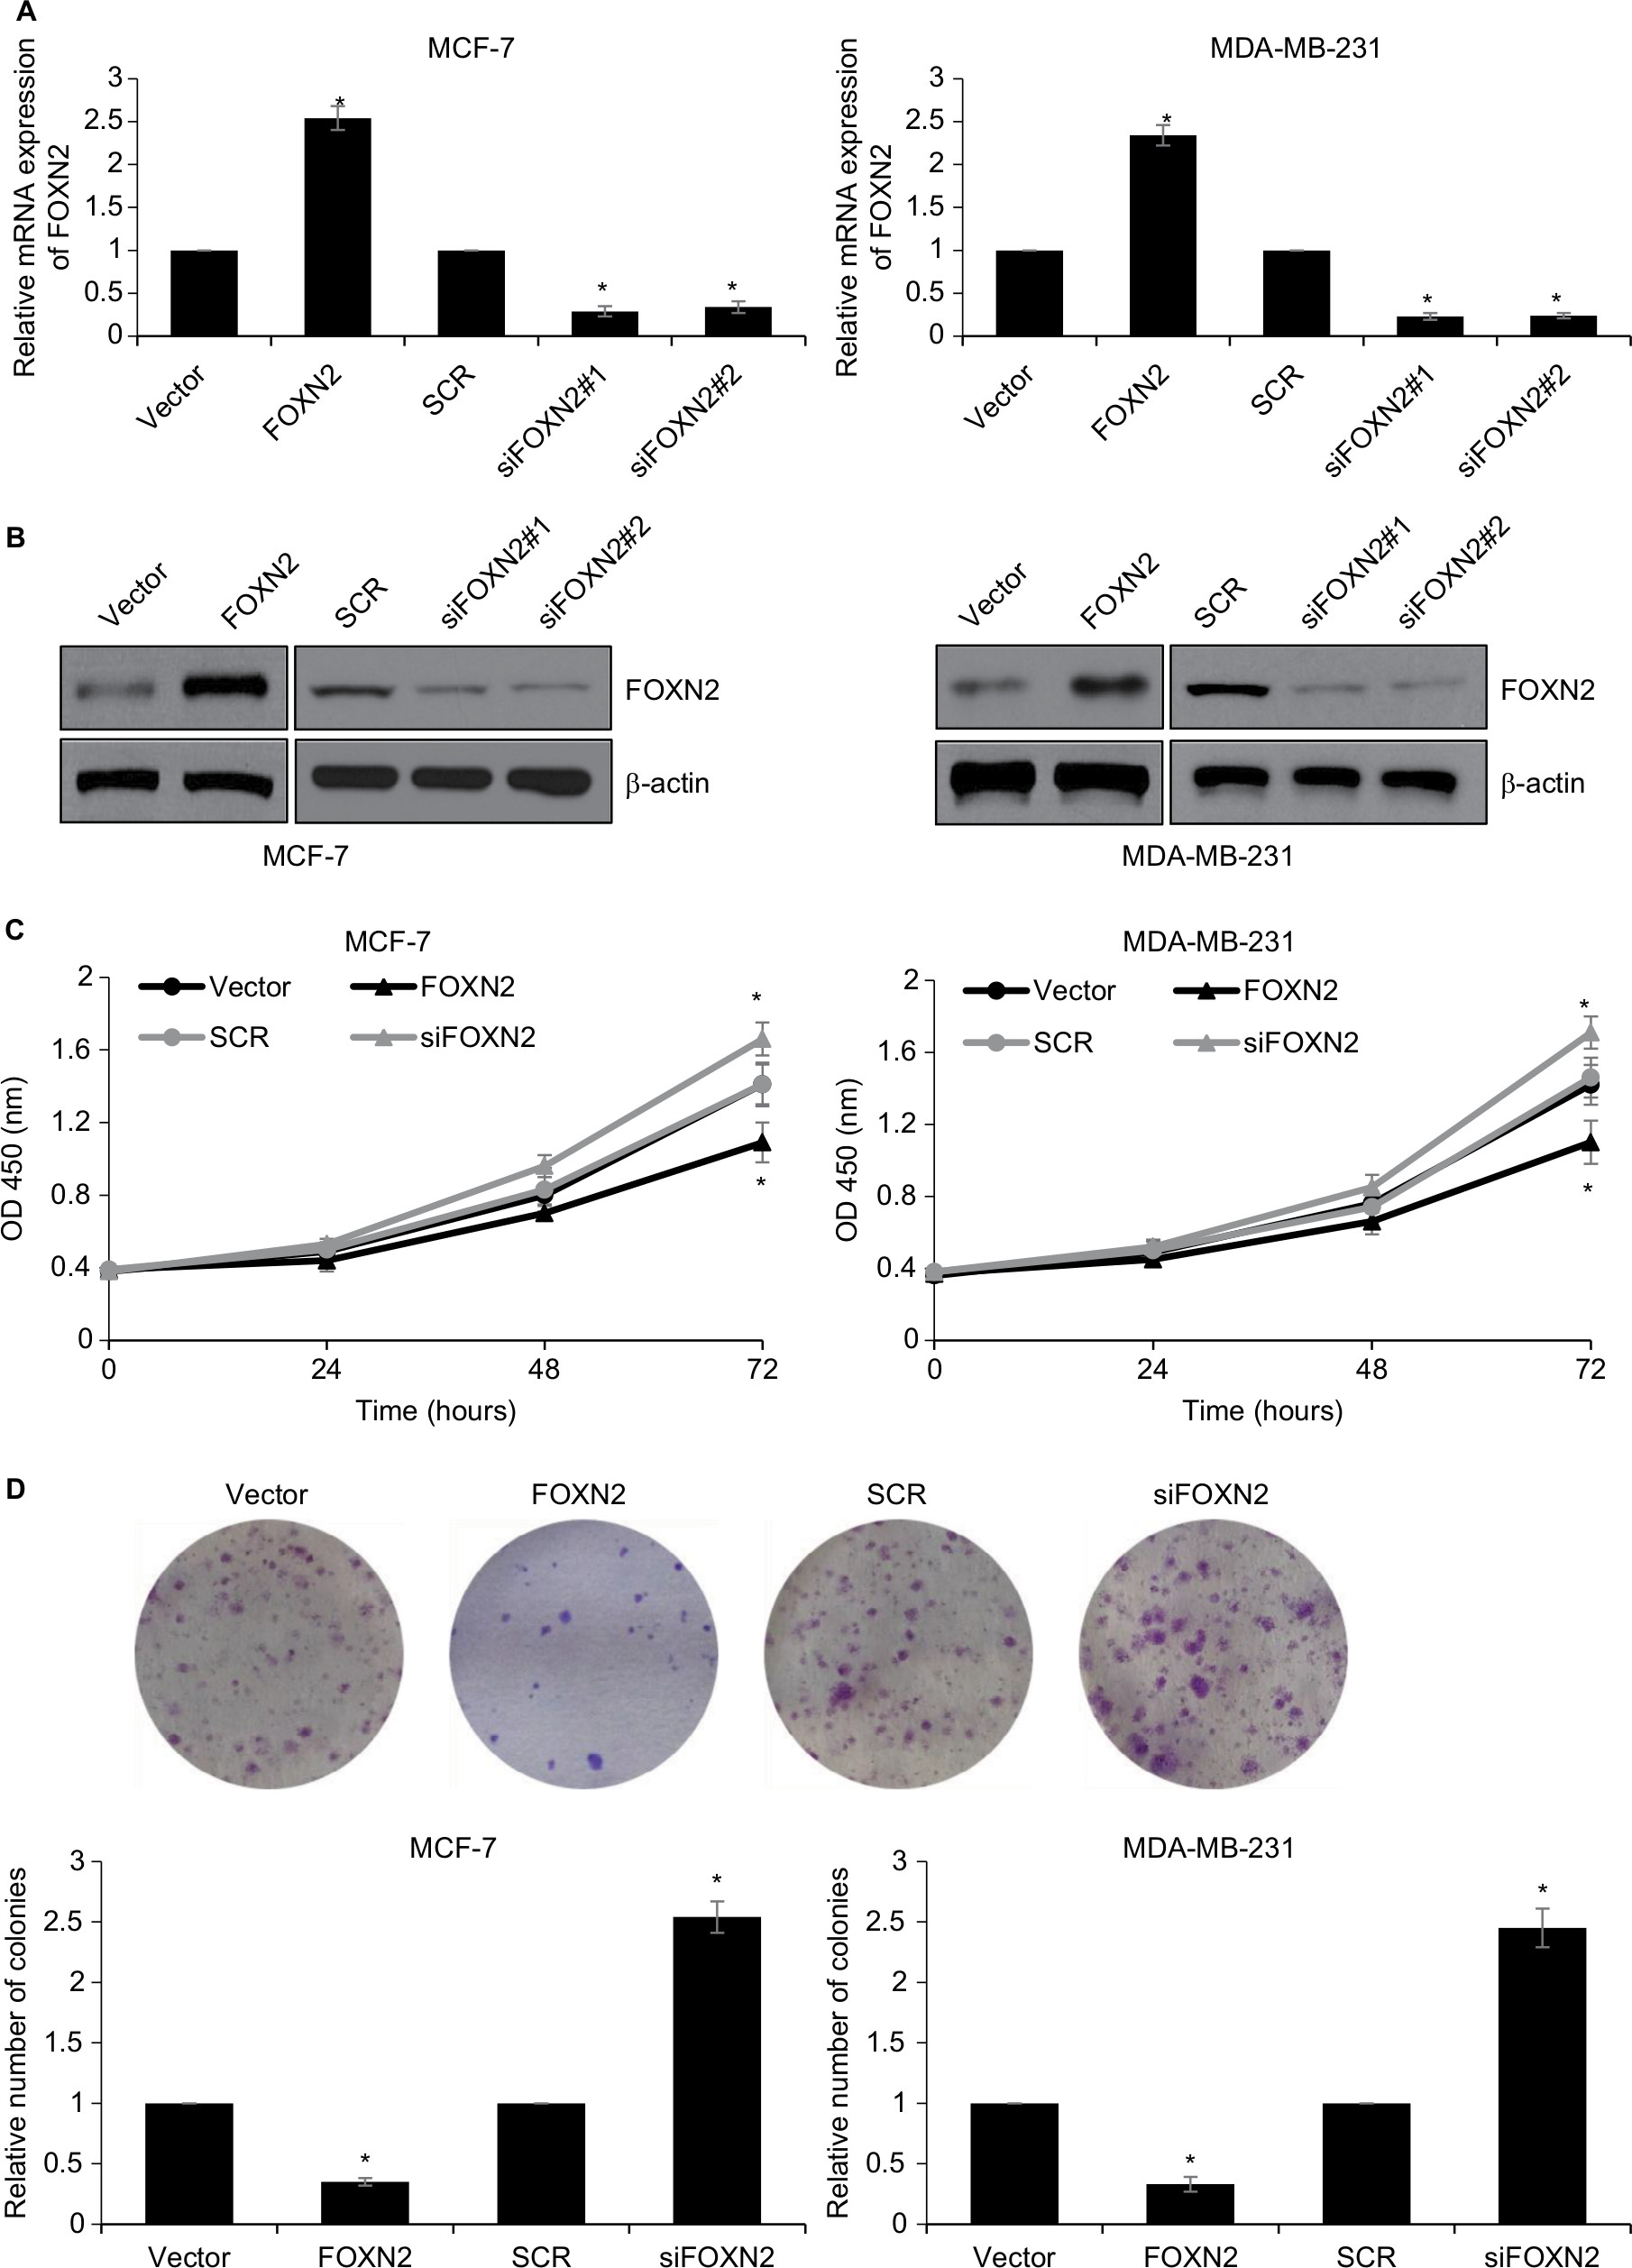 | Figure 2 Downregulation of FOXN2 in breast cancer cells promotes breast cancer proliferation. Notes: MCF-7 (A) and MDA-MB-231 (B) cells were transfected with vector, FLAG-FOXN2 plasmid or SCR, siFOXN2. The expression of FOXN2 was determined using qRT-PCR and Western blotting analysis. *P<0.05 vs vector or SCR group. (C) FOXN2 was overexpressed or knocked down in MCF-7 and MDA-MB-231 cells. CCK-8 assay results revealed that MCF-7 and MDA-MB-231 cell viability were reduced by the ectopic expression of FOXN2 and were increased by inhibition of FOXN2. *P<0.05 vs vector or SCR group. (D) FOXN2 was overexpressed or knocked down in MCF-7 and MDA-MB-231 cells. Colony formation assay results demonstrated that the number of colonies in MCF-7 and MDA-MB-231 cells were reduced by the ectopic expression of FOXN2 and were increased by inhibition of FOXN2. *P<0.05 vs vector or SCR group. The sequences of siFOXN2#1 and siFOXN2#2 are different. Abbreviations: FOXN2, forkhead box N2; OD, optical density; RT-qPCR, quantitative reverse transcription PCR; SCR, scramble siRNA; si, siRNA. |
Overexpression of FOXN2 suppresses the migration and invasion of breast cancer cells
To examine the potential effect of FOXN2 on the motility and invasiveness, the wound healing assay and transwell invasive assay were performed in MDA-MB-231 cells. As shown in Figure 3A, compared to the vector group, the width of the scratch line in FOXN2-overexpressed cells was obviously reduced; however, the width of the scratch line in FOXN2-deletion cells was significantly larger than that of the SCR group (Figure 3A), demonstrating that FOXN2 inhibited the migration of breast cancer cells. Transwell invasive assay was used to further validate the role of FOXN2 expression in the invasion of breast cancer cells. The result demonstrated that ectopic expression of FOXN2 inhibited cellular invasion, and inhibition of FOXN2 led to an increased number of invaded cells, suggesting downregulation of FOXN2 improved cellular invasion (Figure 3B). Collectively, these data demonstrate that FOXN2 suppresses the migration and invasion of breast cancer cells.
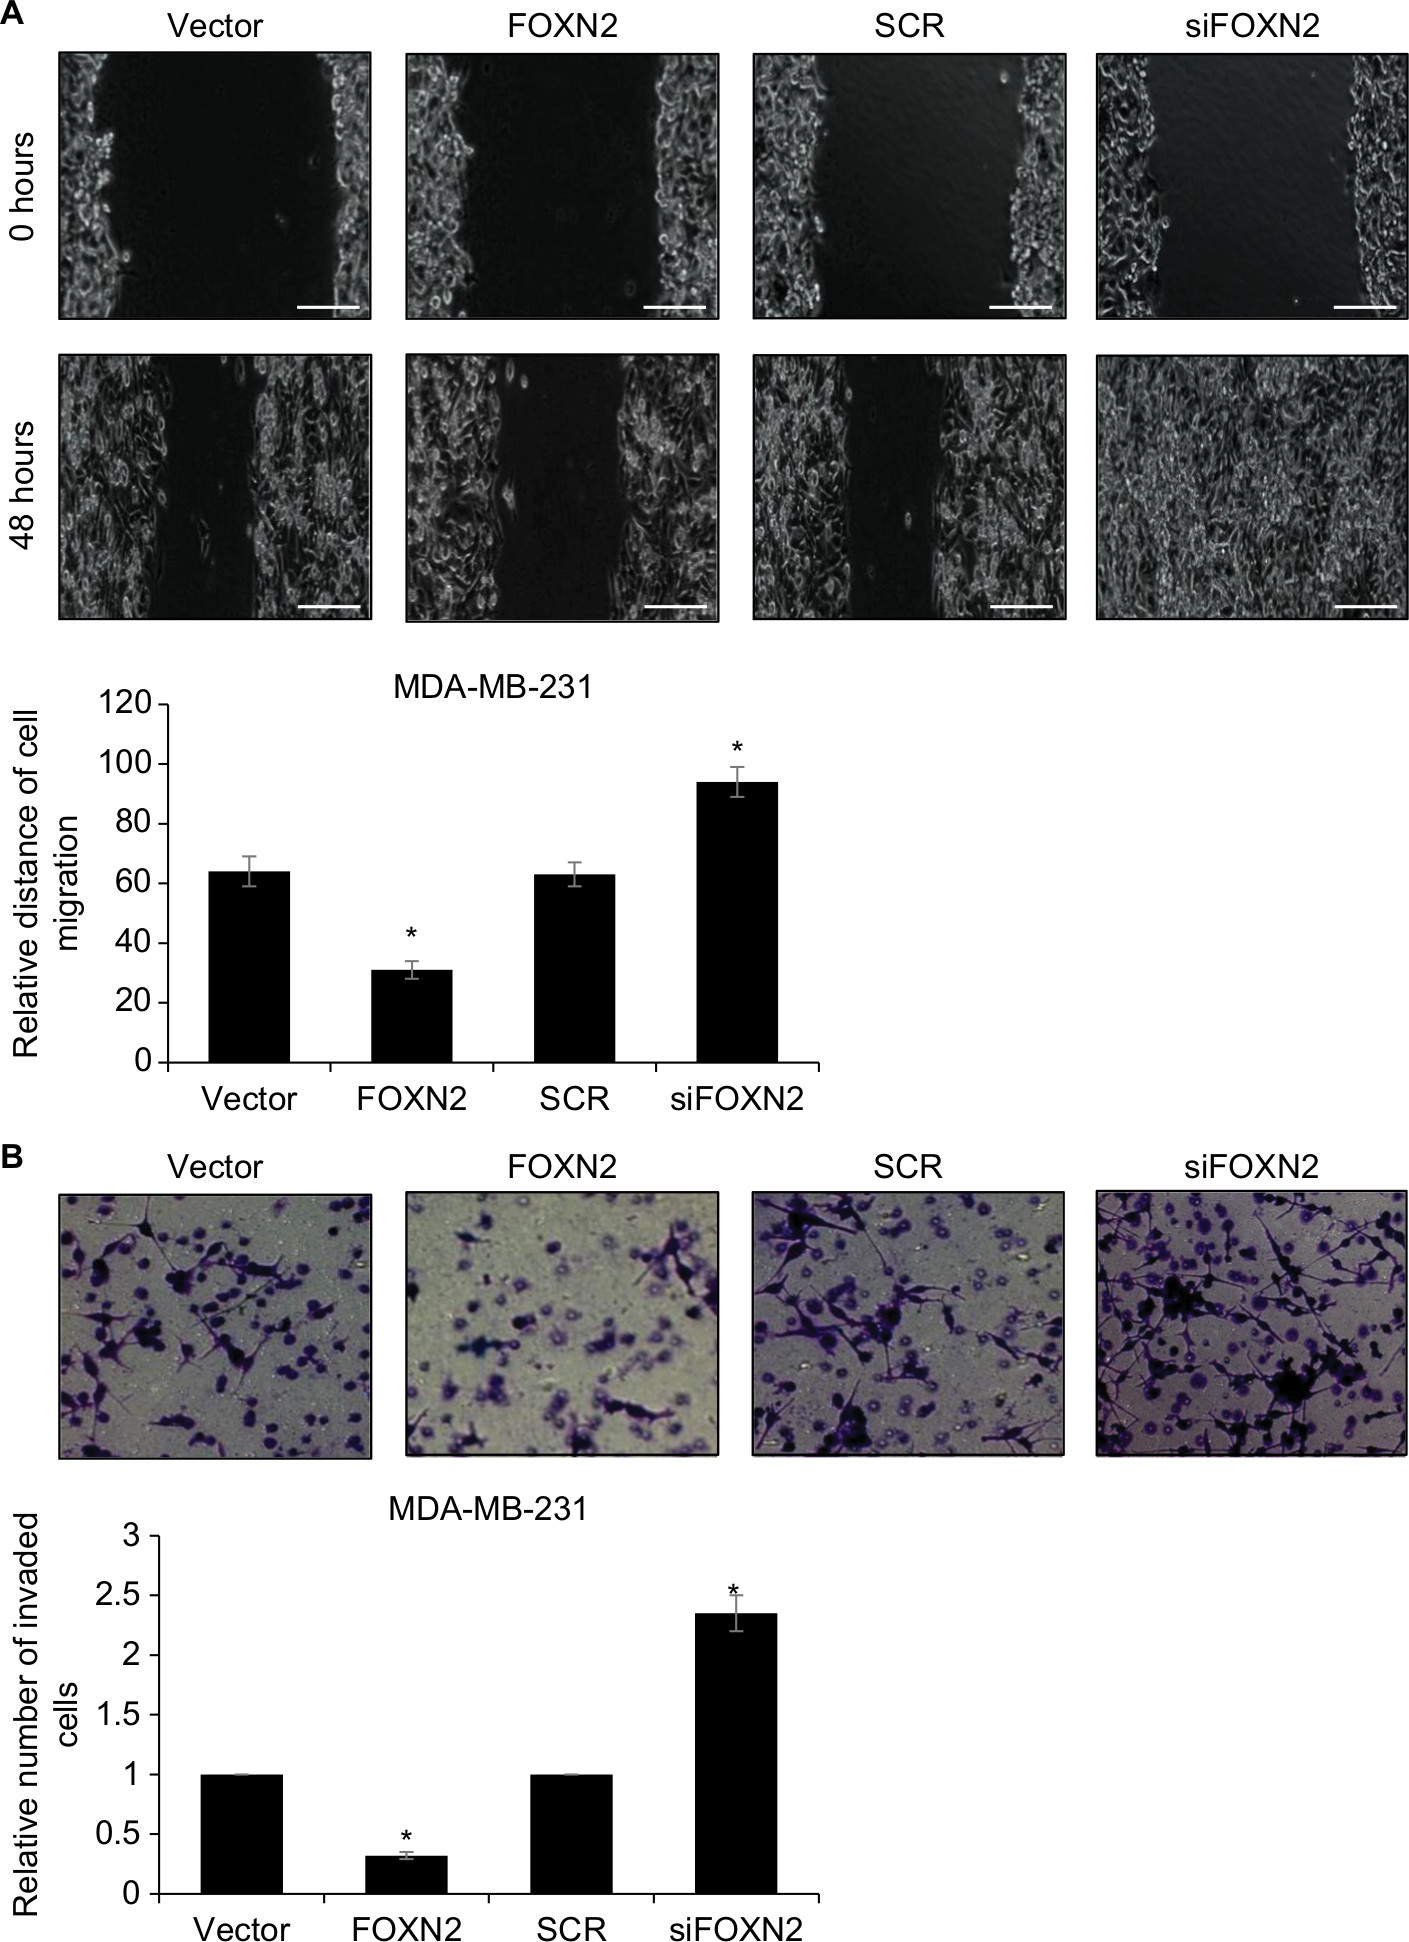 | Figure 3 Overexpression of FOXN2 suppresses the migration and invasion of breast cancer cells. Notes: (A) FOXN2 was overexpressed or knocked down in MDA-MB-231 cells; after transfection for 48 hours, wound healing assay was performed to detect the effect of FOXN2 on cell migration, revealing that ectopic expression of FOXN2 in MDA-MB-231 cell resulted in a reduced relative distance of cellular wound, and inhibition of FOXN2 led to an elevated relative distance of cellular wound, compared with individual control groups. *P<0.05 vs vector or SCR group. Magnification: 40×. (B) FOXN2 was overexpressed or knocked down in MDA-MB-231 cells; after transfection for 48 hours, transwell invasion assay was performed to detect the effect of FOXN2 on cell invasion, indicating that upregulation of FOXN2 in MDA-MB-231 cell resulted in a reduced number of invaded cells, and inhibition of FOXN2 led to an elevated number of invaded cells, compared with individual control groups. *P<0.05 vs vector or SCR group. Magnification: 40×. Abbreviations: FOXN2, forkhead box N2; SCR, scramble siRNA; siFOXN2, FOXN2 siRNA. |
FOXN2 represses EMT in breast cancer through regulation of SLUG
Furthermore, we explored the effect of FOXN2 on EMT-related markers expression in MCF-7 and MDA-MB-231 cells. As shown in Figure 4A and B, FOXN2 overexpression led to an elevated expression of epithelial marker E-cadherin and reduced expression of mesenchymal markers, such as N-cadherin and vimentin (Figure 4A and B). Meanwhile, FOXN2 inhibition obviously downregulated the expression of epithelial marker E-cadherin and upregulated the expression of mesenchymal markers, such as N-cadherin and vimentin, in MCF-7 and MDA-MB-231 cells (Figure 4A and B). Subsequently, we further examined whether FOXN2 regulated EMT in breast cancer through regulation of EMT-associated transcription factors, including snail, SLUG, and ZEB1. The results of RT-qPCR and Western blotting analyses demonstrated that both mRNA and protein levels of SLUG were increased after treating with siFOXN2, whereas the expression of SLUG was decreased when FOXN2 was overexpressed (Figure 4C and D). However, the expression of FOXN2 had no effect on snail and ZEB1 expression (Figure 4C).
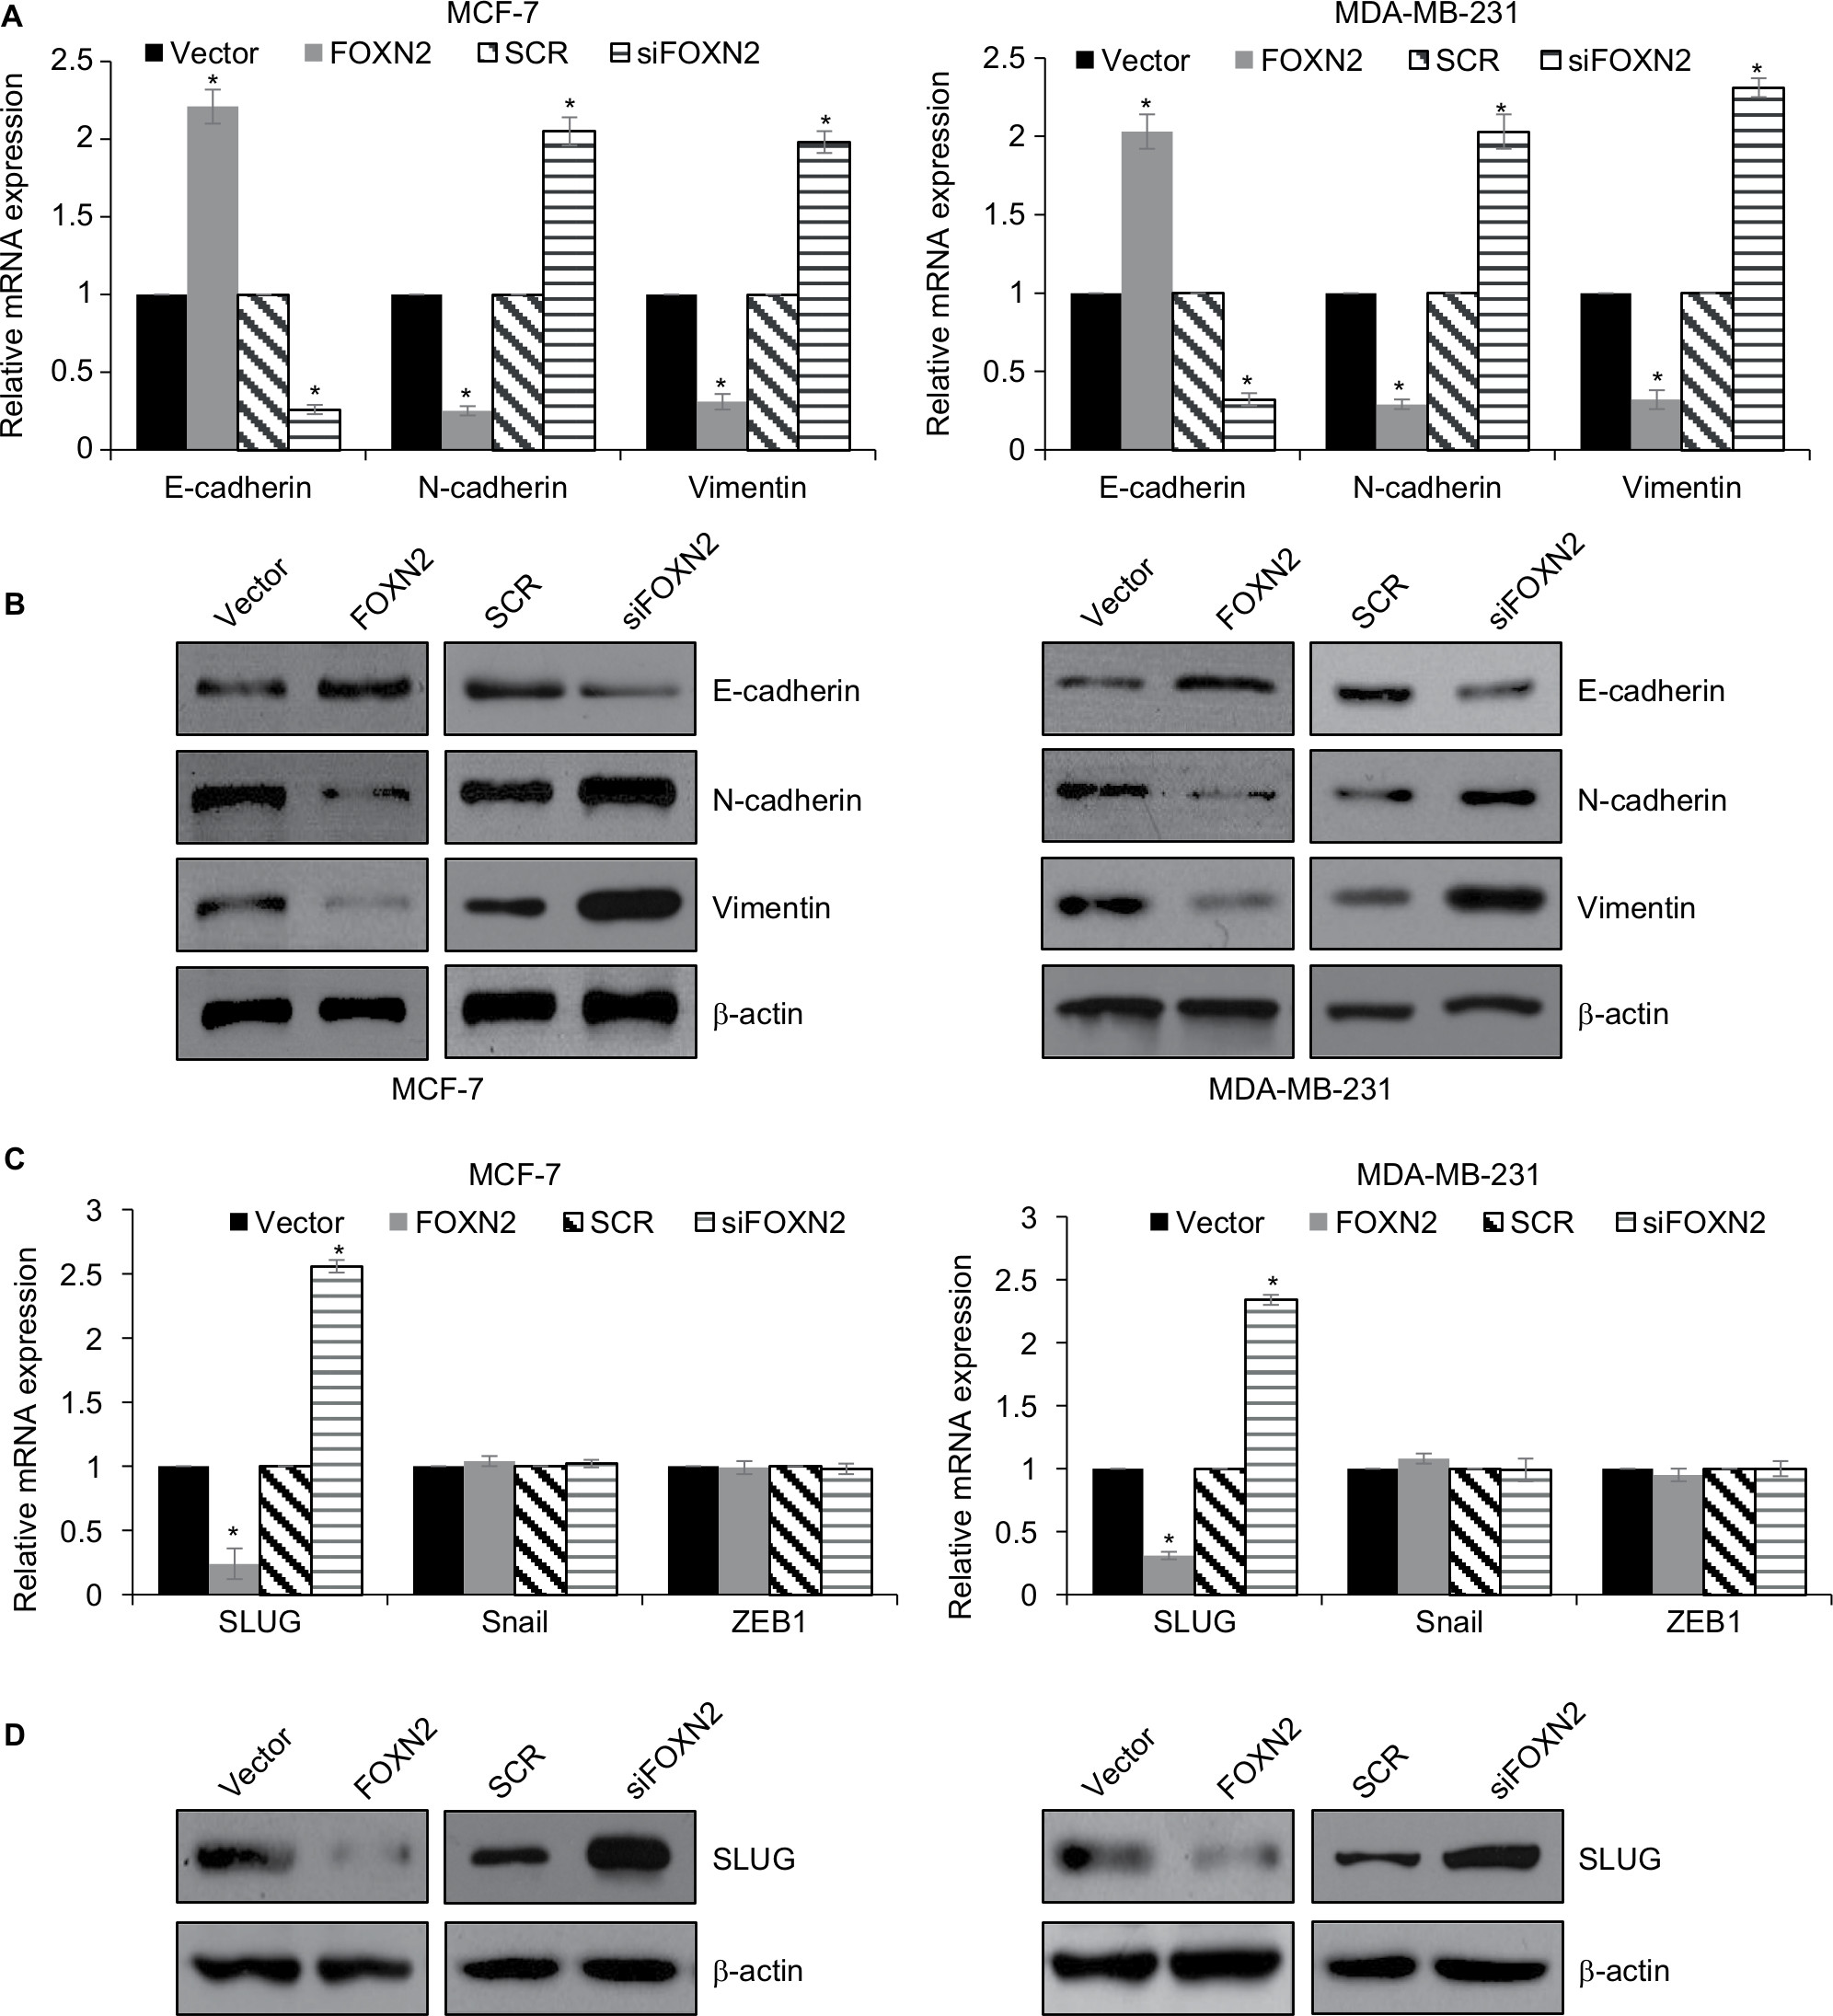 | Figure 4 FOXN2 represses EMT in breast cancer through regulation of SLUG. Notes: (A) and (B) FOXN2 was overexpressed or knocked down in MCF-7 and MDA-MB-231 cells. RT-qPCR (A) and Western blotting (B) analyses demonstrated that ectopic expression of FOXN2 resulted in increased E-cadherin expression levels and reduced expression of N-cadherin and vimentin; however, inhibition of FOXN2 resulted in decreased E-cadherin expression levels and increased expression of N-cadherin and vimentin. *P<0.05 vs vector or SCR group. (C) FOXN2 was overexpressed or knocked down in MCF-7 and MDA-MB-231 cells. RT-qPCR analysis demonstrated that ectopic expression or inhibition of FOXN2 had no significant effect on snail and ZEB1 expression, while SLUG expression was regulated by FOXN2. *P<0.05 vs vector or SCR group. (D) FOXN2 was overexpressed or knocked down in MCF-7 and MDA-MB-231 cells. Western blotting analysis demonstrated that the SLUG expression was regulated by FOXN2. Abbreviations: EMT, epithelial–mesenchymal transition; FOXN2, forkhead box N2; RT-qPCR, quantitative reverse transcription PCR; SCR, scramble siRNA; si, siRNA. |
SLUG is a direct target of FOXN2 in breast cancer cells
Our present study showed that both mRNA and protein levels of SLUG were regulated by FOXN2, indicating that FOXN2 might transcriptionally regulate SLUG expression. To verify our hypothesis, we first performed ChIP and qChIP assays to detect whether FOXN2 could bind the promoter region of SLUG. As shown in Figure 5A, when compared to IgG group, the fold of enrichment was increased almost fourfold, suggesting that FOXN2 could bind the promoter region of SLUG (Figure 5A). Subsequently, dual luciferase assay was performed, showing that the relative luciferase activity in MCF-7 and MDA-MB-231 cells was notably decreased after FOXN2 was overexpressed in cells; however, the relative luciferase activity in MCF-7 and MDA-MB-231 cells was notably increased after FOXN2 was knocked down (Figure 5B). However, FOXN2 had no effect on mutant type SLUG (Figure 5B). In addition, we also detected the expression of SLUG in breast cancer tissues using qRT-PCR, and the result indicated that the expression of FOXN2 was negatively correlated with the expression of SLUG (Table 1). The above finding suggests that FOXN2 directly regulates SLUG expression in breast cancer cells.
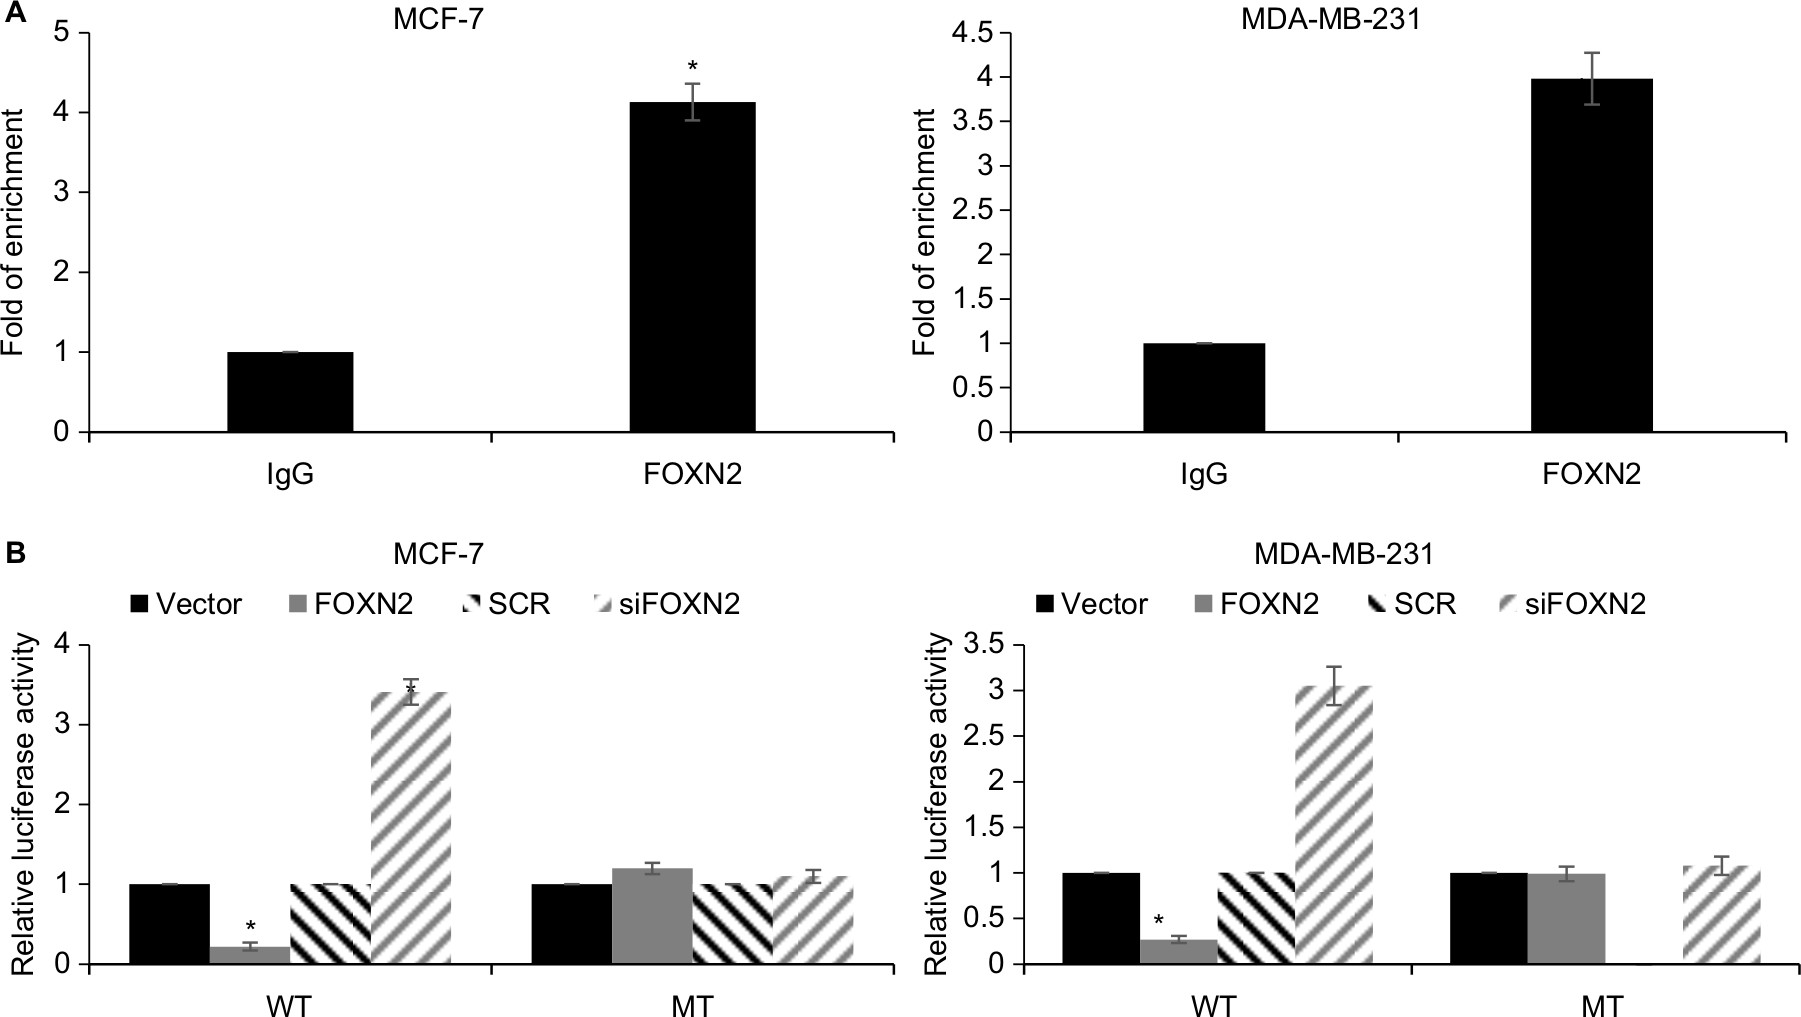 | Figure 5 SLUG is a direct target of FOXN2 in breast cancer cells. Notes: (A) ChIP and qChIP assays were performed using anti-FOXN2 and anti-IgG antibodies, demonstrating that FOXN2 could bind the promoter region of SLUG in MCF-7 and MDA-MB-231 cells. *P<0.05 vs IgG. (B) Compared with the vector or SCR, transfection of FOXN2 plasmid or siFOXN2 induced the luciferase activity in MCF-7 and MDA-MB-231 cells. *P<0.05 vs vector or SCR group. Abbreviations: FOXN2, forkhead box N2; IgG, Immunoglobulin G; MT mutate type; SCR, scramble siRNA; si, siRNA; WT, wild type. |
FOXN2 suppresses the migration and invasion of breast cancer by regulating SLUG
To address directly whether the effects of FOXN2 in regulating breast cancer cell migration and invasion can be attributed to its regulation of SLUG, a rescue experiment was performed. SLUG was knocked down in FOXN2-depleted cells using a SLUG siRNA, and this effect was confirmed using RT-qPCR and Western blotting analyses (Figure 6A). SLUG downregulation decreased the siFOXN2-mediated migration of MDA-MB-231 cells using a wound healing assay (Figure 6B). We next investigated the functional roles of FOXN2 and SLUG in breast cancer cell invasion. SLUG knockdown in FOXN2-deplete cells led to a decrease in the invasion potentials of MDA-MB-231 cells in vitro (Figure 6C). These results suggest that the effects of FOXN2 in mediating the migration and invasion of breast cancer cells were mediated by SLUG.
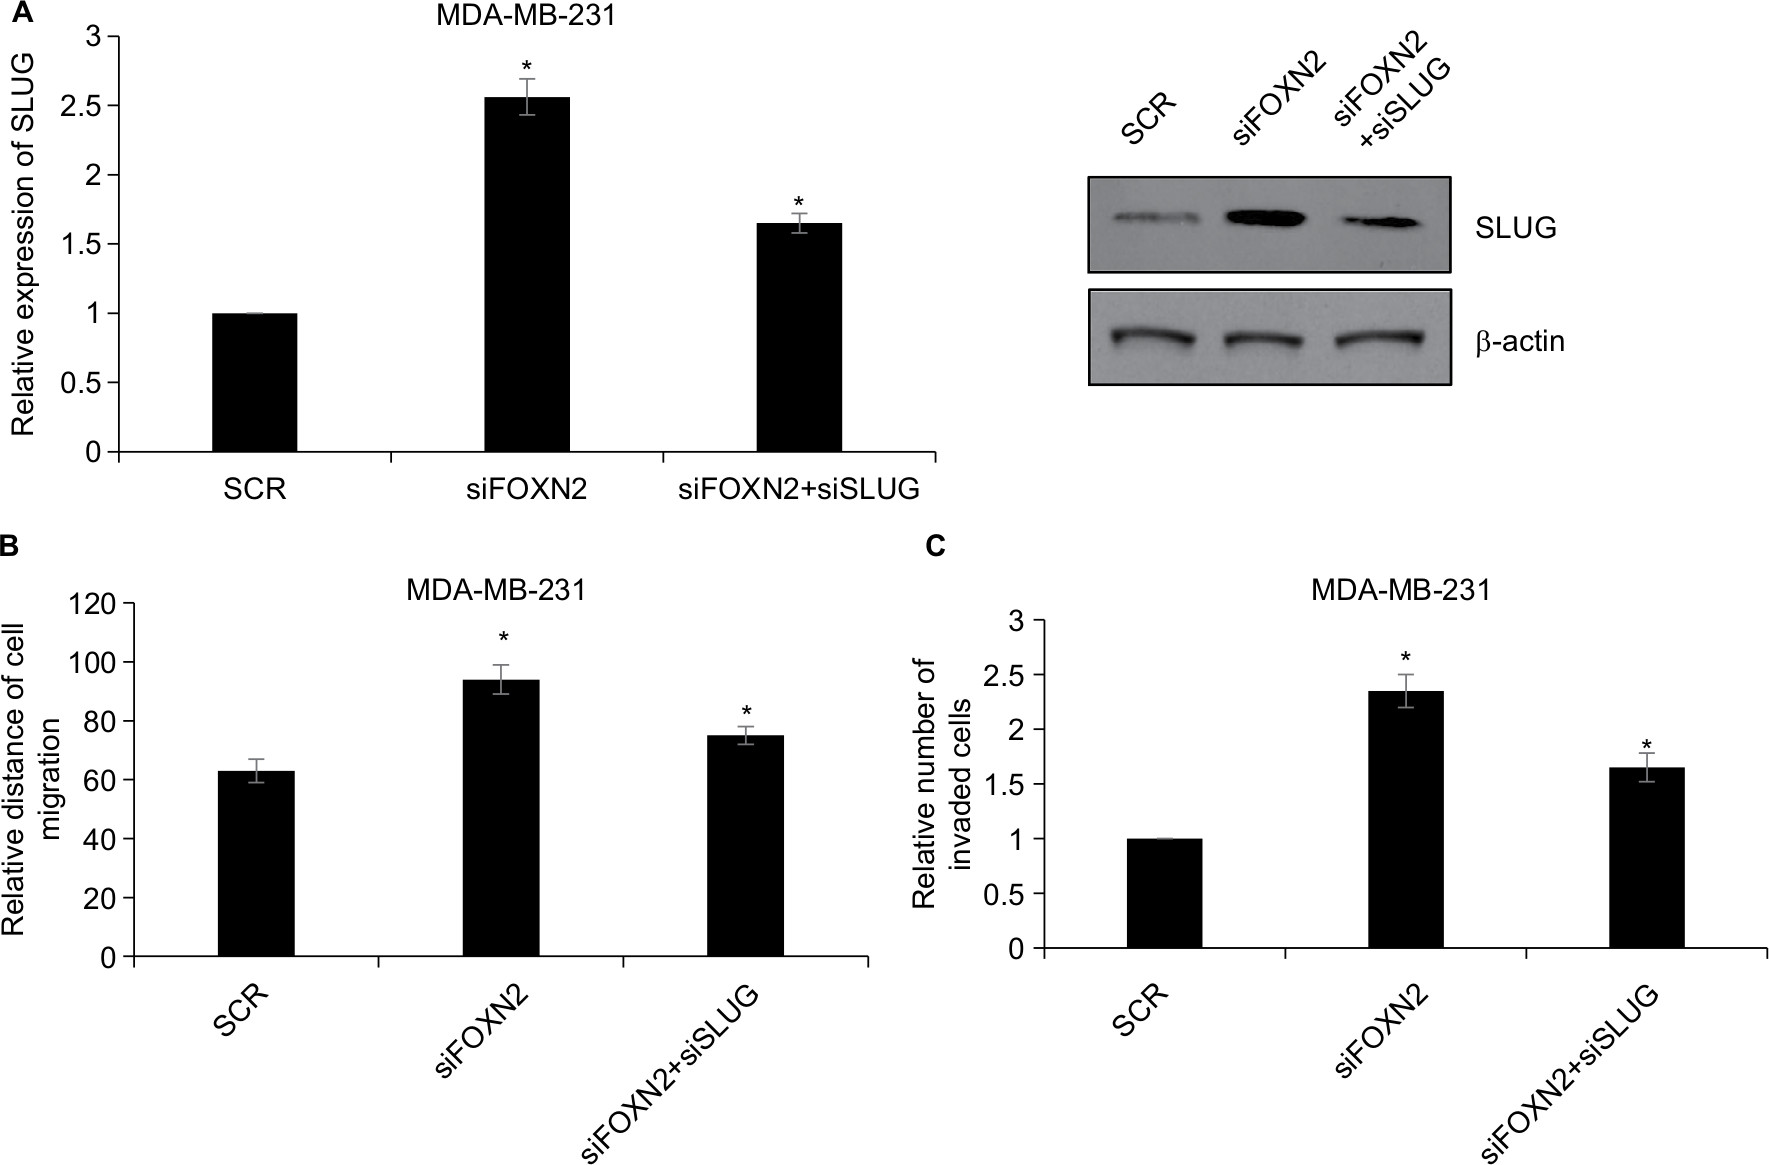 | Figure 6 FOXN2 represses the migration and invasion of breast cancer by regulating SLUG. Notes: (A) FOXN2 or/and SLUG was knocked down using siRNA in MDA-MB-231 cells, and the expression of SLUG was determined by RT-qPCR and Western blotting analyses. *P<0.05 vs SCR or siFOXN2 group. (B) FOXN2 or/and SLUG was knocked down using siRNA in MDA-MB-231 cells, and wound healing assay revealed that inhibition of FOXN2 led to an elevated relative distance of cellular wound, compared with individual control groups. However, inhibition of SLUG offset the effect of FOXN2 inhibition. *P<0.05 vs SCR or siFOXN2 group. (C) FOXN2 and/or SLUG was knocked down using siRNA in MDA-MB-231 cells, and transwell invasion assay indicated that the inhibition of FOXN2 led to an elevated number of invaded cells, compared with individual control groups. However, inhibition of SLUG offset the effect of FOXN2 inhibition. *P<0.05 vs SCR or siFOXN2 group. Abbreviations: FOXN2, forkhead box N2; RT-qPCR, quantitative reverse transcription PCR; SCR, scramble siRNA. |
Discussion
Aberrant expression of FOXN2 has been observed in some types of tumors. A recent report has indicated that FOXN2 is downregulated and serves as a tumor suppressor in T-cell leukemia.6 Moreover, FOXN2 also inhibits tumorigenesis and radioresistance in lung cancer.7 In addition, downregulation of FOXN2 is closely associated with adverse prognosis in adult glioblastoma multiforme treated with radiotherapy or chemotherapy.8 In line with these reports, in the current study, we found that FOXN2 was downregulated in breast cancer cell lines, and ectopic expression of FOXN2 significantly suppressed the proliferation and migration as well as invasion of breast cancer cells. Our work suggests that FOXN2 may act as a tumor suppressor in the progression of breast cancer.
Metastatic potential is a hallmark of the advanced breast cancer. EMT has been reported to play an essential role in the metastasis of many types of cancers, including breast cancer.19–21 EMT is characterized by inhibition of epithelial markers, such as E-cadherin, and induction of mesenchymal markers, such as N-cadherin. Generally, EMT significantly increases the motility and invasion of cancer cells. The previous work has indicated that snail, twist, FOXN2/3, FOXB, and FOXO are required for EMT.22 Moreover, silencing of FOXN2 has been found to repress cancer stem cells and the mesenchymal phenotype.23 In the current study, we found that the ectopic expression of FOXN2 dramatically suppressed breast cancer cell migration and invasion and altered expression of EMT markers, such as E-cadherin and N-cadherin. In addition, we found that FOXN2 could transcriptionally regulate SLUG expression, and the expression of FOXN2 was negatively correlated with the expression of SLUG in breast cancer tissues. These results reveal that FOXN2 might be an essential contributor to EMT progression, thereby promoting the migration and invasion of breast cancer cells.
Recently, Ma et al indicated that FOXN2 silencing promotes cell cycle redistribution and tumorigenesis in lung cancer.7 In the present work, we found that FOXN2 also inhibited cell proliferation in breast cancer. However, there are some limitations in this study. The detailed mechanism of FOXN2 on cell proliferation was still unknown. ChIP-seq assay and tumorigenesis in vivo assay need to be performed. Moreover, the expression of FOXN2 in each breast cancer type, such as luminal A, luminal B, and Her2, need to be further investigated. It is interesting to decipher the roles of FOXN2 in different types of breast cancers.
Taken together, our results revealed for the first time that FOXN2 plays a critical role in cell proliferation and migration as well as invasion, at least in part, through inhibiting the EMT attractive therapeutic target for the treatment of breast cancer.
Disclosure
The authors report no conflicts of interest in this work.
References
Ban KA, Godellas CV. Epidemiology of breast cancer. Surg Oncol Clin N Am. 2014;23(3):409–422. | ||
Tao Z, Shi A, Lu C, Song T, Zhang Z, Zhao J. Breast Cancer: Epidemiology and Etiology. Cell Biochem Biophys. 2015;72(2):333–338. | ||
Myatt SS, Lam EW. The emerging roles of forkhead box (Fox) proteins in cancer. Nat Rev Cancer. 2007;7(11):847–859. | ||
Wijchers PJ, Burbach JP, Smidt MP. In control of biology: of mice, men and Foxes. Biochem J. 2006;397(2):233–246. | ||
Katoh M, Igarashi M, Fukuda H, Nakagama H, Katoh M. Cancer genetics and genomics of human FOX family genes. Cancer Lett. 2013;328(2):198–206. | ||
Nagel S, Pommerenke C, Meyer C, Kaufmann M, MacLeod RAF, Drexler HG. Identification of a tumor suppressor network in T-cell leukemia. Leuk Lymphoma. 2017;58(9):2196–2207. | ||
Ma J, Lu Y, Zhang S, et al. β-Trcp ubiquitin ligase and RSK2 kinase-mediated degradation of FOXN2 promotes tumorigenesis and radioresistance in lung cancer. Cell Death Differ. 2018;25(8):1473–1485. | ||
Robertson E, Perry C, Doherty R, Madhusudan S. Transcriptomic profiling of Forkhead box transcription factors in adult glioblastoma multiforme. Cancer Genomics Proteomics. 2015;12(3):103–112. | ||
Nieto MA, Huang RY, Jackson RA, Thiery JP. EMT: 2016. Cell. 2016;166(1):21–45. | ||
Gonzalez DM, Medici D. Signaling mechanisms of the epithelial-mesenchymal transition. Sci Signal. 2014;7(344):re8. | ||
Weber CE, Li NY, Wai PY, Kuo PC. Epithelial-mesenchymal transition, TGF-β, and osteopontin in wound healing and tissue remodeling after injury. J Burn Care Res. 2012;33(3):311–318. | ||
Kalluri R, Weinberg RA. The basics of epithelial-mesenchymal transition. J Clin Invest. 2009;119(6):1420–1428. | ||
Thiery JP, Acloque H, Huang RY, Nieto MA. Epithelial-mesenchymal transitions in development and disease. Cell. 2009;139(5):871–890. | ||
Christofori G. New signals from the invasive front. Nature. 2006;441(7092):444–450. | ||
Wu Y, Zhou BP. Snail: More than EMT. Cell Adh Migr. 2010;4(2):199–203. | ||
Zeisberg M, Neilson EG. Biomarkers for epithelial-mesenchymal transitions. J Clin Invest. 2009;119(6):1429–1437. | ||
Eriksson JE, Dechat T, Grin B, et al. Introducing intermediate filaments: from discovery to disease. J Clin Invest. 2009;119(7):1763–1771. | ||
Taube JH, Herschkowitz JI, Komurov K, et al. Core epithelial-to-mesenchymal transition interactome gene-expression signature is associated with claudin-low and metaplastic breast cancer subtypes. Proc Natl Acad Sci U S A. 2010;107(35):15449–15454. | ||
Yu Y, Luo W, Yang ZJ, et al. miR-190 suppresses breast cancer metastasis by regulation of TGF-β-induced epithelial-mesenchymal transition. Mol Cancer. 2018;17(1):70. | ||
Hou P, Li L, Chen F, et al. PTBP3-Mediated Regulation of ZEB1 mRNA Stability Promotes Epithelial-Mesenchymal Transition in Breast Cancer. Cancer Res. 2018;78(2):387–398. | ||
Tang CP, Zhou HJ, Qin J, Luo Y, Zhang T. MicroRNA-520c-3p negatively regulates EMT by targeting IL-8 to suppress the invasion and migration of breast cancer. Oncol Rep. 2017;38(5):3144–3152. | ||
Saunders LR, McClay DR. Sub-circuits of a gene regulatory network control a developmental epithelial-mesenchymal transition. Development. 2014;141(7):1503–1513. | ||
Hardy K, Wu F, Tu W, et al. Identification of chromatin accessibility domains in human breast cancer stem cells. Nucleus. 2016;7(1):50–67. |
 © 2019 The Author(s). This work is published and licensed by Dove Medical Press Limited. The full terms of this license are available at https://www.dovepress.com/terms.php and incorporate the Creative Commons Attribution - Non Commercial (unported, v3.0) License.
By accessing the work you hereby accept the Terms. Non-commercial uses of the work are permitted without any further permission from Dove Medical Press Limited, provided the work is properly attributed. For permission for commercial use of this work, please see paragraphs 4.2 and 5 of our Terms.
© 2019 The Author(s). This work is published and licensed by Dove Medical Press Limited. The full terms of this license are available at https://www.dovepress.com/terms.php and incorporate the Creative Commons Attribution - Non Commercial (unported, v3.0) License.
By accessing the work you hereby accept the Terms. Non-commercial uses of the work are permitted without any further permission from Dove Medical Press Limited, provided the work is properly attributed. For permission for commercial use of this work, please see paragraphs 4.2 and 5 of our Terms.