Back to Journals » Diabetes, Metabolic Syndrome and Obesity » Volume 14
Foveal Avascular Zone Does Not Correspond to Choroidal Characteristics in Patients with Diabetic Retinopathy: A Single-Center Cross-Sectional Analysis
Authors Sidorczuk P, Pieklarz B, Konopinska J ![]() , Saeed E, Mariak Z, Dmuchowska D
, Saeed E, Mariak Z, Dmuchowska D ![]()
Received 6 May 2021
Accepted for publication 22 May 2021
Published 28 June 2021 Volume 2021:14 Pages 2893—2903
DOI https://doi.org/10.2147/DMSO.S318860
Checked for plagiarism Yes
Review by Single anonymous peer review
Peer reviewer comments 2
Editor who approved publication: Prof. Dr. Juei-Tang Cheng
Patryk Sidorczuk, Barbara Pieklarz, Joanna Konopinska, Emil Saeed, Zofia Mariak, Diana Dmuchowska
Department of Ophthalmology, Medical University of Bialystok, Bialystok, 15-276, Poland
Correspondence: Diana Dmuchowska
Department of Ophthalmology, Medical University of Białystok, 24a M. Sklodowskiej-Curie, Bialystok, 15-276, Poland
Tel +48857468372
Fax +48857468604
Email [email protected]
Purpose: The aim of the study was to compare two non-overlapping blood supply systems of the retina to obtain a better insight into the relation between diabetic macular retinopathy and choroidopathy. Specifically, the study focused on the relationships between (1) retinal vascular changes around the fovea in fluorescein angiography (FA) and (2) choroidal thickness, volume and other parameters assessed by optical coherence tomography (OCT).
Patients and Methods: The retrospective cross-sectional single-center study included 210 eyes from 152 patients with diabetic retinopathy (mean age 60.7± 12.4 years, 49.3% of women; foveal avascular zone [FAZ] outline: 44.3% grade ≤ 2, 55.7% grade ≥ 3). The outline of FAZ, a measure of capillary loss due to ischemic processes, was analyzed on FA according to the Early Treatment Diabetic Retinopathy Study Research Group (ETDRS) standards. The eyes were stratified according to the FAZ outline and size and the presence of clinically significant diabetic macular edema (CSME). Then, resultant groups were compared in terms of the spectral domain OCT parameters: choroidal thickness and volume (within ETDRS subfields), luminal, stromal and total choroidal areas and choroidal vascularity index (based on the foveal scan). Statistical analysis was based on univariate models with the choroidal parameters as independent variables, and age, sex, panretinal photocoagulation, the severity of diabetic retinopathy and CSME as covariates.
Results: No significant relationships were found between the FAZ outline and area and choroidal characteristics of patients with diabetic retinopathy. In patients without CSME, no correlation was observed between the FAZ area and choroidal characteristics. In patients with CSME, no correlation was found between the FAZ area and choroidal characteristics other than the choroidal vascularity index.
Conclusion: In patients with diabetic retinopathy, damage to the macular retinal vasculature (FAZ) does not seem to be associated with changes in the choroidal vasculature, and these two processes appear to occur independently.
Keywords: choroid, choroidal thickness, choroidal volume, choroidal vascularity index, OCT
Introduction
Retina receives blood from two independent systems. The outer retina is supplied via diffusion from the choriocapillaris, whereas the inner retina receives blood from the central retinal artery. The outer plexiform layer constitutes the border. Foveal avascular zone (FAZ), best visualized on fluorescein angiography (FA) or optical coherence tomography (OCT) angiography, is a capillary-free area in the central macula with high photoreceptor density and high metabolic activity.1 There is no retinal circulation in the foveola (avascular zone). Choriocapillaris circulation is the major source of oxygen and nutrients for the outer retina and the only source of blood for the avascular fovea.2
FAZ has regular boundaries in healthy persons. In pathologic conditions associated with retinal capillary dropout, such as diabetes mellitus, FAZ margins can be enlarged and irregular (Figure 1).1 Diabetic macular ischemia (DMI) is characterized by the occlusion and loss of the macular capillary network or capillary dropout.3,4 Diabetes may also lead to choroidal abnormalities, similar to those observed in the retina, such as microaneurysms, dilatation and obstruction of the choriocapillaris, vascular remodeling with increased vascular tortuosity, vascular dropout, focal vascular non-perfusion and choroidal vascularization.5–7 Hence, diabetes affects both retinal and choroidal vasculature. However, it is unclear if the choroidal changes observed in diabetes are predictive, modulatory, causative, or independent for diabetic retinopathy.6,8–10
 |
Figure 1 Representative fluorescein angiograms with FAZ outlines: (A) grade ≤2; (B) grade ≥3 according to the ETDRS report number 11.15 The same angiograms with FAZ area boundaries and sizes: (C and D). |
Unlike commercially available OCT angiography that visualizes only the choriocapillaris layer of the choroid, enhanced depth imaging (EDI) and swept-source (SS)-OCT are suitable for the evaluation of the entire cross-sectional image of the choroid. Published data about choroidal thickness in diabetic retinopathy are inconclusive, and this parameter seems to be also influenced by diabetic macular edema (DME).6 To address this problem, the choroidal vascular index (CVI), an OCT-based choroidal quantitative parameter, was introduced. CVI specifically analyzes the vascular component of the choroid, including all choroidal vessel layers, ie choriocapillaris, Sattler’s and Haller’s layer. CVI is defined as the ratio of the luminal area (LA) to the total choroidal area (TCA). Compared with choroidal thickness, this parameter appears to be less dependent on various confounding factors.11,12 CVI proved to be useful in the early diagnosis of various retinal and choroidal diseases, as well as in the monitoring of their progression and patient stratification.11 In the present study, CVI was calculated complementarily to the evaluation of the choroidal thickness and volume.
Little is known about the temporal relationship between diabetic retinopathy (DR) and diabetic choroidopathy. A better insight into the relationship between retinal and choroidal vasculature would shed new light on the pathogenesis of these two conditions and improve patient stratification in terms of the disease progression or treatment responses. Our present study centered primarily on the evaluation of the macula. Macular changes do not reflect the severity of DR; for example, DME may develop at any stage of the DR.13 Thus, in this study, we focused specifically on the macular retinal and choroidal vasculatures. Aside from the severity of DR, we also analyzed FAZ to estimate the degree of macular ischemia. The aim of this study was to analyze a unique relationship between the FA-assessed degree of DMI and OCT-based choroidal characteristics in patients with DR.
Materials and Methods
Study Design, Participants, Eligibility Criteria and Ethics
This retrospective single-center cross-sectional study included 210 eyes from 152 patients with type 1 and 2 diabetes mellitus, who underwent same-day FA and OCT at the Department of Ophthalmology, University Teaching Hospital of Bialystok (Poland) between March 22, 2017, and November 13, 2020. All patients presented with DR. The patients’ eyes were stratified according to the FAZ outline and size, with clinically significant diabetic macular edema (CSME) taken into account.
Patients were not eligible for the study if they had a history of prior posterior segment surgery or intravitreal injections, macular laser photocoagulation, ametropia ≥3.0 diopters, macular changes resulting from other ocular diseases, glaucoma, known ocular or systemic pathology potentially able to affect choroidal vasculature and insufficient quality of fluorescein angiograms or OCT images. Controls were recruited among non-diabetic patients scheduled for routine ocular examination.
The protocol of the study followed the provisions of the Declaration of Helsinki and was approved by the Local Bioethics Committee at the Medical University of Bialystok (decision no. APK.002.216.2020). Written informed consent was sought from all patients involved in the study.
Fluorescein Angiograms Acquisition and Analysis
OCT and FA images were acquired one after another in mydriasis, between 8 am and 11 am. The images were independently assessed by two investigators (D.A.D. and P.S.), blinded to the clinical characteristics of the examined eyes.
FA remains the gold standard in the evaluation of retinal perfusion status and potential leakage and in the detection of macular ischemia in patients with DR. FA was performed with Spectralis HRA+OCT imaging device (Heidelberg Engineering, Heidelberg, Germany) according to the standard procedure. The FA images were used to assess the severity of DR, to detect CSME and to characterize FAZ according to the Early Treatment Diabetic Retinopathy Study Research Group (ETDRS) criteria.14–17
An early phase frame (after 20–30 seconds) and a late frame (after 3–5 minutes) were selected for further analysis. CSME was defined as the dye leakage within 500 µm radius from the fovea or 1500 µm radius in cases with hard exudate in this area. The severity of perifoveal capillary occlusion was characterized based on the FAZ outline graded according to the ETDRS report number 11 (grade 0 = normal; grade 1 = questionable, outline not smoothly round or oval, but visible irregularities not definitely abnormal; grade 2 = outline definitely destroyed in less than one half of the original circumference; grade 3 = outline definitely destroyed for one half or more of the original circumference, but some remnants remain; grade 4 = capillary outline completely destroyed; grade 8 = cannot be graded). Angiograms with grade 8 FAZ outline were excluded from the analysis.15 Representative images of FAZ outlines are shown in Figure 1. The examined eyes were divided into two groups according to the severity of damage to the FAZ outline: grade ≤2 and grade ≥3. FAZ boundaries were delineated manually, and the area was measured automatically.
Optical Coherence Tomography Images Acquisition and Analysis
SD-OCT was carried out with a Spectralis HRA+OCT imaging device (Heidelberg Engineering, Heidelberg, Germany). The protocol of SD-OCT imaging comprised of 25 horizontal raster scans (20 x 20°) and a linear B-scan centered at the fovea, as shown in Figure 2.
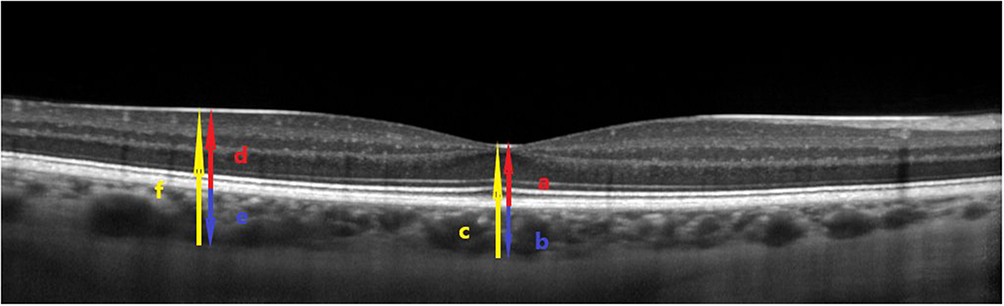 |
Figure 2 Representative OCT scan across the fovea. ILM and BM were detected automatically, while the choroidal-scleral junction was marked manually. SFCT was defined as the distance between the BM and the choroidal-scleral junction at the fovea (blue arrow b). The SFCT was obtained as a difference between the total thickness (retinal + choroidal thickness, from the ILM to the choroidal-scleral junction) (yellow arrow c) and the central foveal thickness (red arrow a). Analogically, the choroidal thickness outside the fovea (blue arrow e) was calculated by subtracting the retinal thickness (red arrow d) from the total thickness (retinal + choroidal thickness, from the ILM to the choroidal-scleral junction) (yellow arrow f). |
The internal limiting membrane (ILM) and Bruch’s membrane (BM) were detected automatically, and the choroidal-scleral junction was marked manually on each scan by the same grader. The retinal parameters were calculated from the ILM to the BM while the choroidal parameters from the BM to the choroidal-scleral junction.
Averaged thickness and volume maps were created automatically according to the conventional ETDRS grid with nine subfields: central macular subfield (a central field within a 500 µm radius), four inner subfields (within a 500–1500 µm radius) and four outer subfields (within a 1500–3000 µm radius).14 There were separate maps for the retinal thickness/volume as well as for the sum of the retinal and choroidal thickness/volume. The values of the choroidal parameters were calculated by subtracting retinal parameters from the summed retinal and choroidal parameters.
Subfoveal choroidal thickness (SFCT) was defined as the distance between the BM and the choroidal-scleral junction at the fovea.
CVI quantifies the vascular status of the choroid.11,18 To calculate CVI, choroidal areas on the OCT scans were binarized with a modified Niblack method, as described by Sonoda et al.12,19 Briefly, the entire horizontal scan (6 mm) across the fovea was assessed, with the BM as an upper margin and the choroidal-scleral junction as the lower margin. Binarization and segmentation of the images were done with ImageJ software (http://imagej.nih.gov/ij, version 1.49). TCA, LA and stromal area (SA) were calculated, and CVI was determined as the LA to TCA ratio.
Statistical Analysis
Statistical analyses were carried out with R software, version 3.5.1 (http://cran.r-project.org). Descriptive statistics included numbers (% of each group) for nominal variables and means ± standard deviations (SD) or medians with lower and upper quartiles (Q1; Q3) for continuous variables, depending on the data distribution. The normality of the distribution was verified with the Shapiro–Wilk test, on the basis of skewness and kurtosis values, as well as based on visual inspection of histograms. Between-group comparisons were carried out with a chi-square test for nominal variables and t-test or Mann–Whitney U-test for continuous variables, whichever appropriate. Linear mixed-effects models were created for the comparisons of FAZ outlines (grade ≤2 vs grade ≥3) and FAZ areas (<0.355 vs >0.355 mm2 based on median), with random effects for the correlation of two eyes from the same patient. A range of univariate models with choroidal parameters as independent variables and age, sex, panretinal photocoagulation (PRP), DR severity and CSME as covariates was developed as well. Finally, the relationships between pairs of continuous variables were verified on Spearman correlation analysis. All tests were two-tailed with α = 0.05.
Results
Baseline Characteristics
Demographic and clinical characteristics of the study patients are shown in Table 1. The groups selected according to the FAZ outline and CSME were age-, sex- and refractive error-matched. The groups identified based on the FAZ area was age- and sex-matched (see Supplementary Material, Table S1).
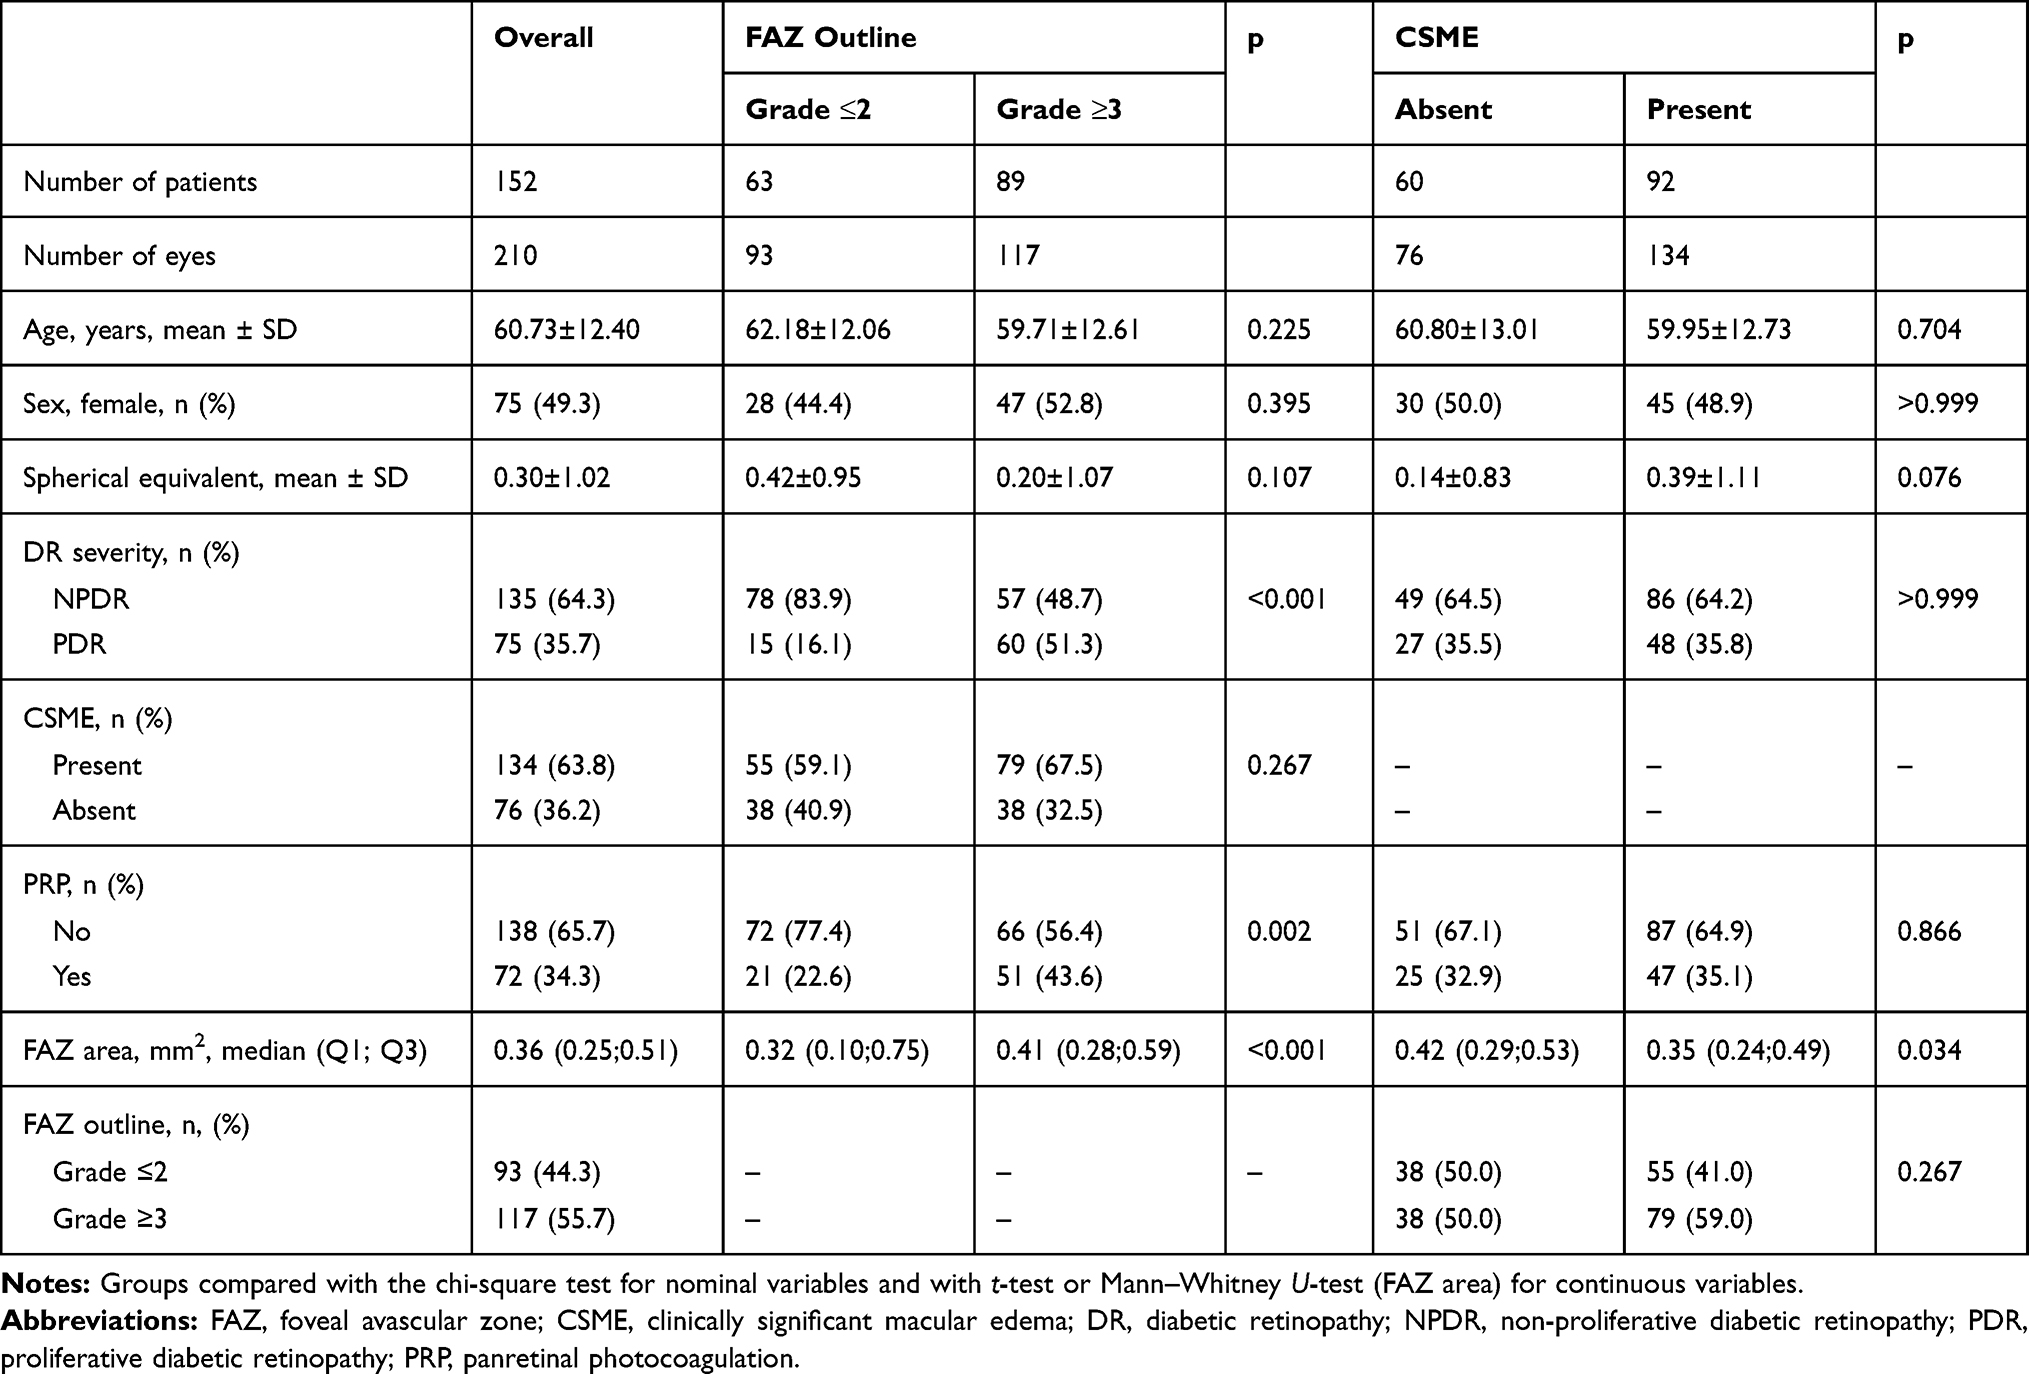 |
Table 1 Baseline Characteristics of Patients with Diabetic Retinopathy |
FAZ Outline and Choroidal Characteristics of Patients with Diabetic Retinopathy
Choroidal thickness, volume and other choroidal parameters, stratified according to the FAZ outline and size, are presented in Table 2. No significant differences in the analyzed parameters were found between the eyes with grade ≤2 and grade ≥3 FAZ outline. The two groups did not also differ significantly when potential confounders, such as sex, age, CSME, DR severity, and PRP, were included in the model (Table 3).
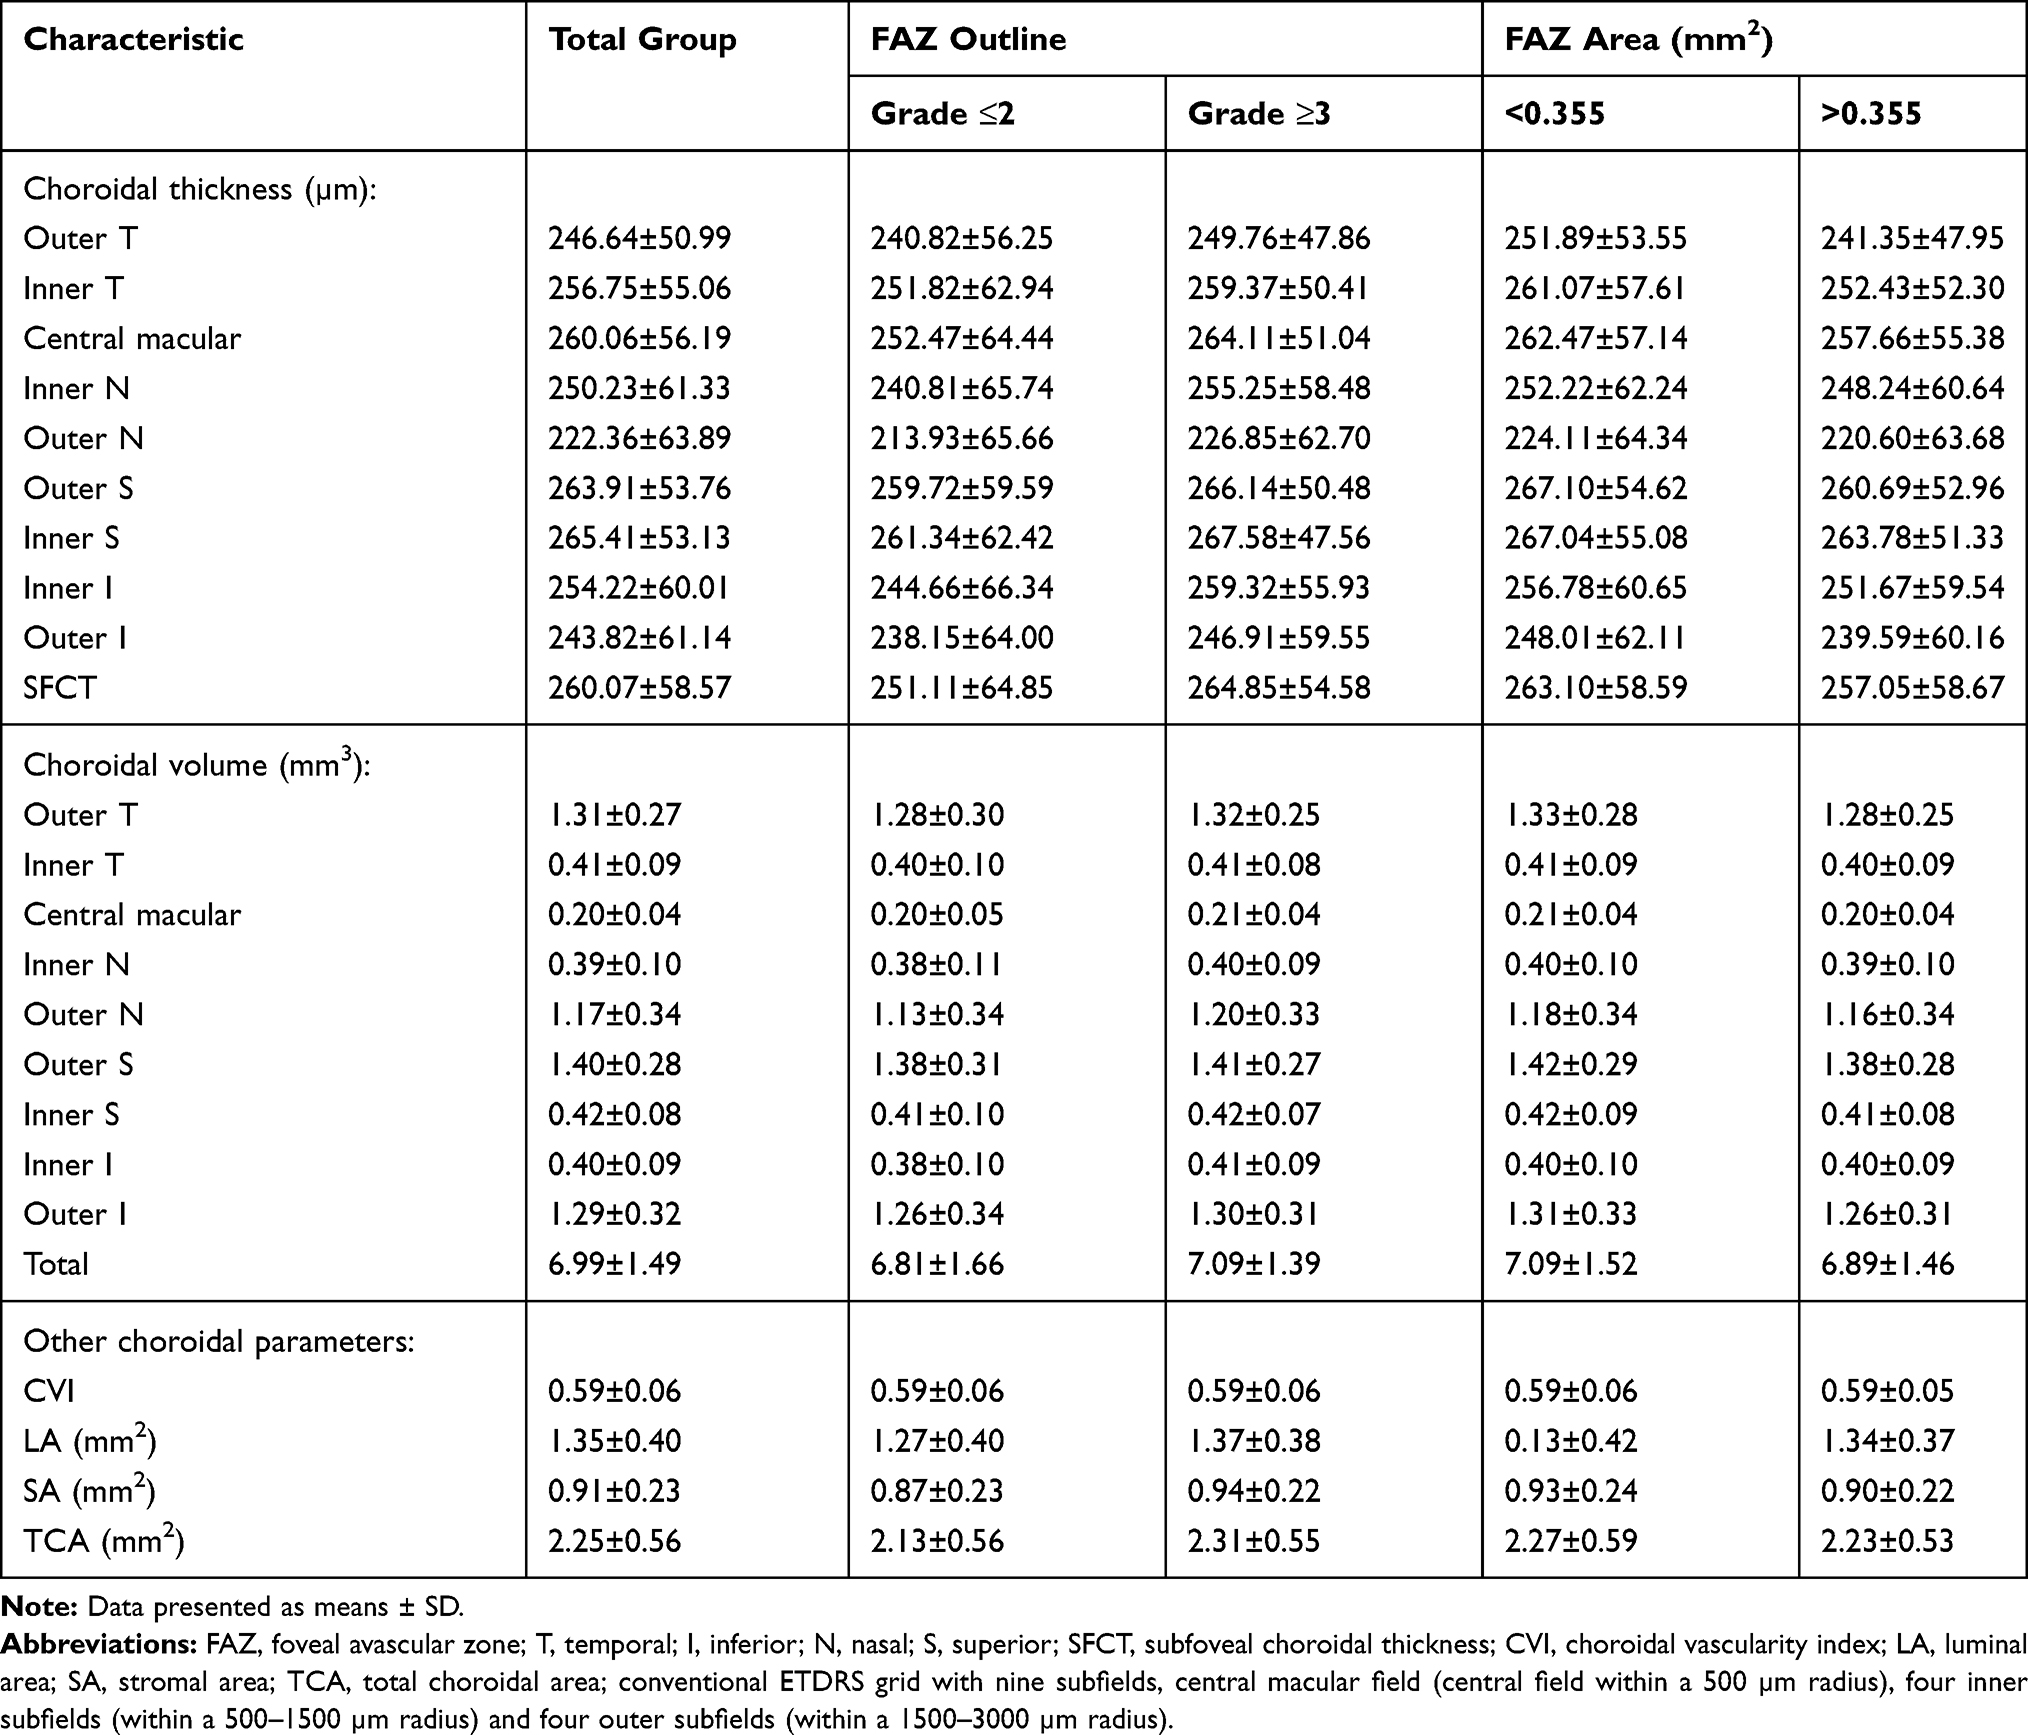 |
Table 2 Choroidal Parameters in Patients with Diabetic Retinopathy |
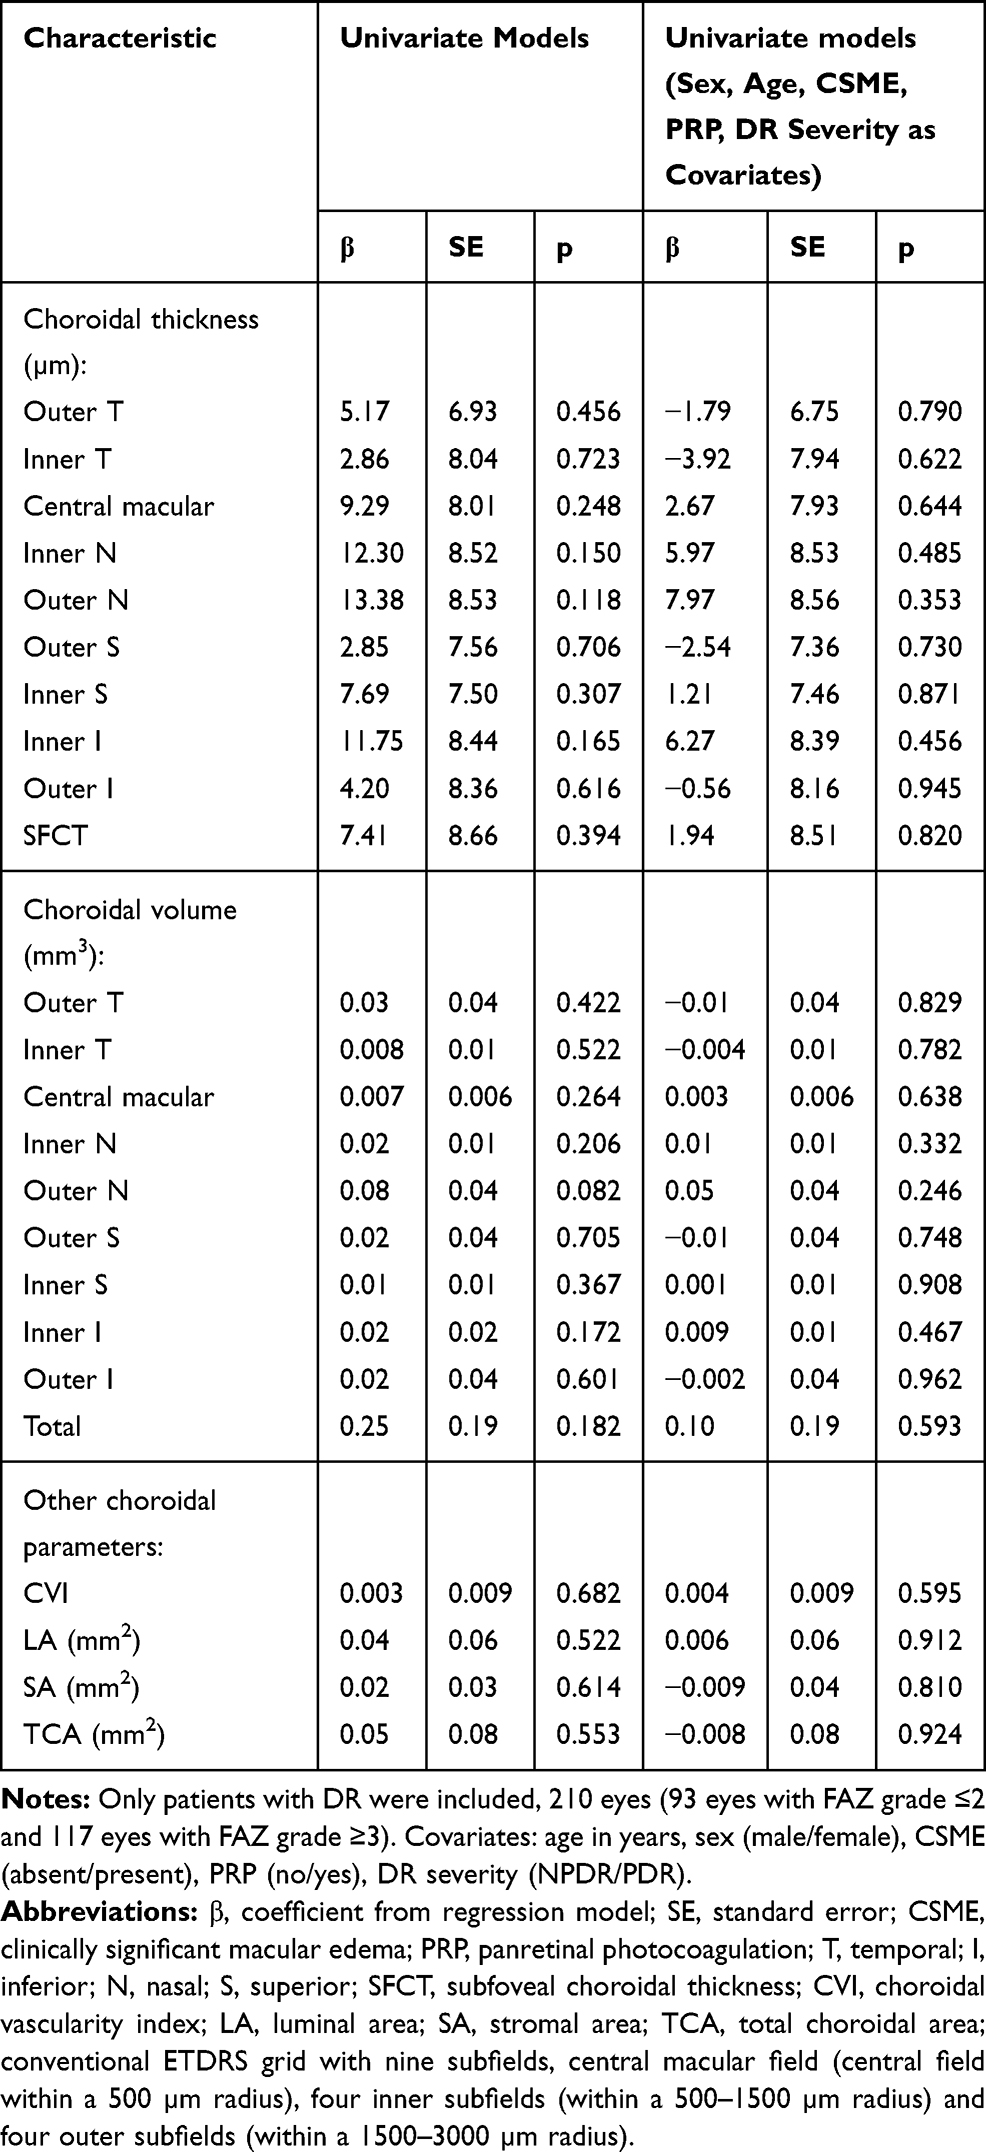 |
Table 3 Univariate Models to Analyze Relationships Between Choroidal Parameters and FAZ Outline in Patients with Diabetic Retinopathy |
FAZ Area and Choroidal Characteristics in Patients with Diabetic Retinopathy
In the entire group of patients with DR, FAZ area did not correlate significantly with choroidal thickness, volume and other choroidal parameters (Tables 2 and 4). Given a significant difference in the FAZ area in patients with CSME and without (Table 1), a subgroup analysis was carried out as well. The analysis did not demonstrate significant correlations between the FAZ area and the choroidal parameters other than CVI in patients with CSME (Table 4).
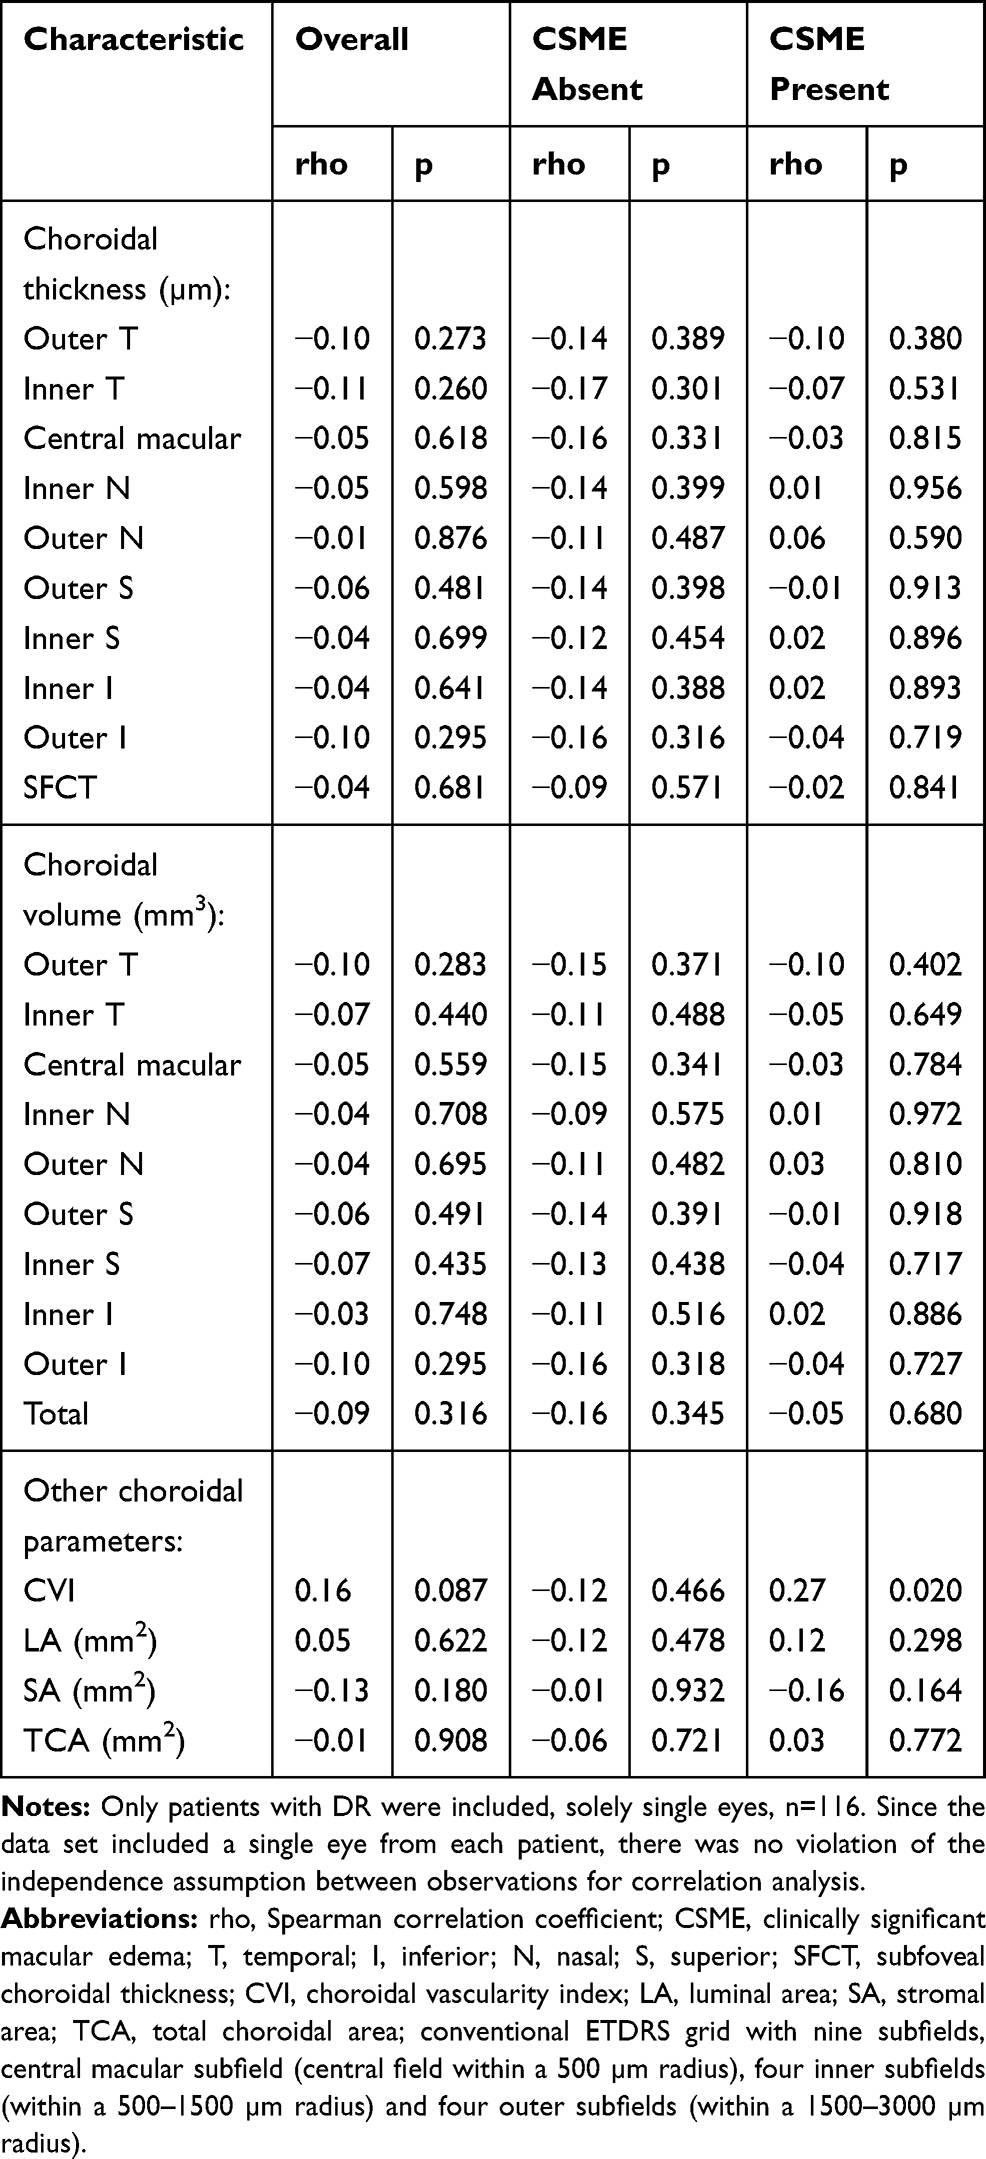 |
Table 4 Correlations Between FAZ Area and Choroidal Parameters in Patients with Diabetic Retinopathy Overall and in Patients with CSME and Without |
The study patients were further stratified according to their FAZ area, with the median of 0.355mm2 as a cut-off level. The groups did not differ in terms of the choroidal thickness, volume and other parameters. Similarly, no significant between-group differences were found when potentially confounding factors such as sex, age, CSME, DR severity and PRP were included in the model (Table 5).
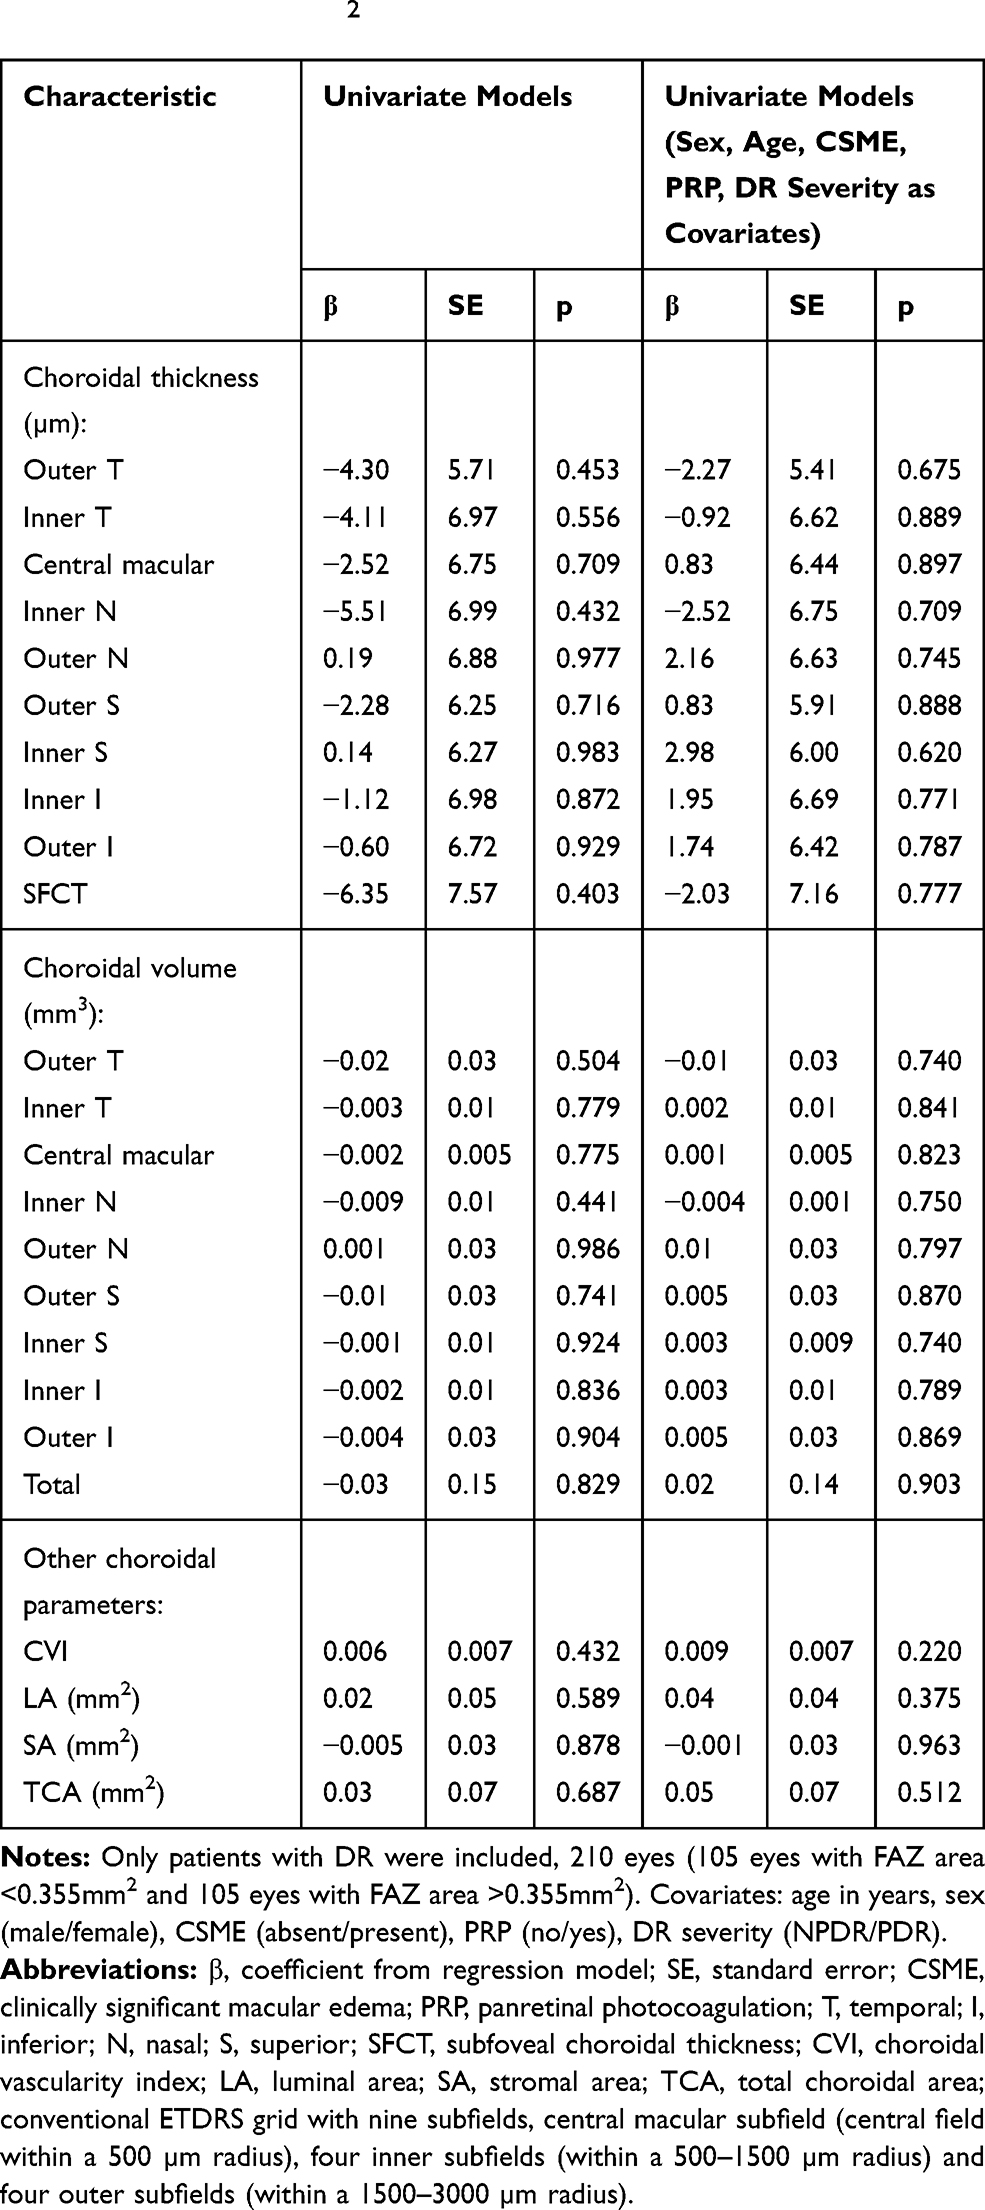 |
Table 5 Univariate Mixed-Effect Models to Compare Choroidal Parameters in Patients with Diabetic Retinopathy and FAZ Area >0.355 and <0.355mm2 |
Discussion
In the present study, the angiographically-identified status of the FAZ was compared with the OCT-based choroidal characteristics in patients with DR. In general, no significant associations were found between the FAZ outline/area and choroidal parameters, such as thickness and volume (within the ETDRS subfields), LA, SA, TCA and CVI (based on the foveal scan). This observation is consistent with the results published by Gerendas et al.20 and Adhi et al.21 according to whom choroidal changes did not correlate with the level of retinal pathology in patients with DR; however, it needs to be stressed that those authors used different methodological approach than in the present study.
We analyzed two FAZ parameters, outline and size. FAZ outline might be a better indicator of ischemia given the heterogeneity in the size of FAZ in healthy persons (as reviewed by Sun et al.7). Johannesen et al postulated to determine FAZ area as a part of the diagnostic process but emphasized that this parameter might be unsuitable if used alone.22 Therefore, our study was mainly focused on the FAZ outline; this parameter reflects capillary loss and ischemic processes and seems to be a more reliable measure of potential impairment of blood supply to the inner retina than the FAZ area. Choroidal characteristics analyzed in this study included not only the thickness and volume but also a novel parameter, CVI. The latter quantifies the vascular component of the choroid. In previous studies, CVI was determined not only in ocular pathologies but also in systemic disorders, including inflammatory conditions, whereby it was implicated as a biomarker of disease activity.11 Choroidal thickness depends on various physiological and pathological factors, including age, ethnicity, sex, refraction, axial length and time of the day.23 In contrast, CVI is modulated solely by SFCT.24 According to Campos et al, choroidal thickness (and consequently volume) may be affected by age, sex, CSME, DR severity and PRP. Thus, we included all these variables as potential confounding factors in linear mixed-effects models of FAZ.25
One previous study analyzed a relation between the FAZ and choriocapillaris visualized with OCT angiography.9 Associations of DR with choroidal thickness6,23,25 and CVI26–28 have been studied as well, but the results are inconclusive. To the best of our knowledge, the present study was the first to analyze the relation between FAZ and choroidal parameters, not only the thickness and volume but also other vascular indices, in patients with DR.
Our study confirmed that the FAZ area’s enlargement was associated with DR progression3,7,22 and that the FAZ area was significantly larger in eyes with higher FAZ outline grades.15,29
Similar to Sim et al.30 we found no association between the FAZ outline and choroidal thickness. Also, no significant correlation was observed between the FAZ enlargement and choroidal thickness, which is consistent with the findings published by Lee et al.31 We also found no significant relationships between choroidal volume and FAZ outline/area. Furthermore, no associations between the FAZ area and other choroidal parameters, such as LA, SA, TCA and CVI, were observed, other than a correlation between the FAZ area and CVI in patients with CSME (rho=0.27, p=0.02). This could be either due to luminal area increase and/or due to a decrease in TCA. However, the latter two parameters did not correlate significantly with the FAZ area in patients with CSME and hence, this finding should be interpreted with caution. Unlike Oh et al, we did not find an inverse correlation between CVI with FAZ area.32 This discrepancy might be associated with the fact that those authors examined a group of healthy persons, whereas our study included patients with already established diabetes-related vascular damage.
We speculate that the unparallel rate of macular vascular damage to the retina and choroid might reflect the multifactorial impact of diabetes on these vessels. First, the rate of development and progression of microangiopathy may vary, and the changes within the choroid seem to occur at early stages.8,33 Second, not only the vascular mechanism should be considered, as autonomic neuropathy also seems to be implicated in choroidopathy.34,35 Choroidal vascular tone does not depend solely on local regulation but autonomic innervation as well. Third, some other factors, such as VEGF and inflammation,5 might affect both vascular systems differently. Those factors might also contribute to changes in morphometric choroidal parameters analyzed in the present study. Fourth, macular changes may occur independently of peripheral changes in DR.13 Similarly, submacular choroidal changes might not necessarily correspond to the peripheral ones. Some location-based differences in the choriocapillaris structure are probably related to the different vulnerability of these vessels to diabetes, with the mid-peripheral vessels being affected first.36,37 These factors could explain the variable rate of diabetes-related damage in different vascular regions. Fifth, unlike the relatively stable FAZ patterns, the choroidal patterns might vary considerably even in healthy persons. Examples of such individual variability are the irregularities of the choroidal-scleral junction and the differences in the number and distribution of the posterior ciliary arteries.38 Also, this factor might contribute to interpersonal and regional variability in choroidal characteristics and their relation to FAZ.
This study has some strengths, among them the inclusion of DME treatment-naïve patients and the analysis of age-, sex- and refractive error-matched groups. All measurements were taken between 8 am and 11 am to avoid diurnal variations. Only patients with spherical equivalent refractive error <3.0 diopters were included. Compared with previous studies, we included a larger number of patients with proliferative DR, often underrepresented in clinical research. We also conducted a subgroup analysis with the presence of CSME as a grouping factor. Importantly, we analyzed not only the FAZ area but the FAZ outline as well. Further, we considered not only the choroidal thickness but also the choroidal volume over a 6 mm diameter in the macula to obtain a better insight into the characteristics of the choroid. According to Singh et al, even an accurate estimate of choroidal thickness at a few sampling points could be inadequate in assessing choroidal involvement due to the irregularities in the choroidal-scleral junction. Hence, volumetric analysis of the choroid is preferable.23 To evaluate the choroid even further, we focused on its luminal and stromal components too.
We are well aware of the potential limitations of this study. Due to its retrospective design, the data on the type of diabetes mellitus, duration of the disease, glycated hemoglobin (HbA1C) and fasting blood glucose levels were not available. However, according to Agrawal et al, none of these parameters correlates with CVI.11 Regarding retinal imaging, OCT angiography would provide more detailed information about the retinal circulation as it visualizes both superficial and deep capillary plexus. However, obtaining OCT angiographic images in patients with DME could be technically challenging as the presence of cystic spaces might be detrimental to the image quality. This problem does not refer to the fluorescein angiograms, though. Additionally, OCT angiography and FA provide comparable results in terms of the FAZ area measurements.3 In the present study, we determined CVI based on a single foveal scan; this is a relatively common practice given that CVI is similar across all the ETDRS subfields.23
FA visualizes the superficial capillary plexus. In future studies involving OCT angiography, it would be interesting to compare FAZ at the deep capillary plexus level with the choroidal parameters. The deep capillary plexus seems to be affected first in the course of diabetes.26,39 However, technical problems related to fluid accumulation that may interfere with the imaging and segmentation capabilities of OCT angiography in patients with DME would need to be taken into account. Furthermore, the evaluation of choroidal vasculature across all layers, not merely the choriocapillaris, would contribute to a better understanding of the pathogenesis of diabetic choroidopathy. Unfortunately, none of the currently commercially available OCT angiography devices is suitable for this purpose. Another direction of future research could be the application of the wide-field spectral-domain OCT. As suggested by Ferrara et al, a standard cross-sectional OCT limited to the macular area may be insufficient to capture the full spectrum of manifestations in diabetes, especially considering the topographical differences.40 Regarding future improvements of CVI assessment, a fully automated CVI algorithm integrated into the OCT device might help to standardize this valuable parameter, as highlighted by Agrawal et al.41
Conclusion
This study demonstrated that in patients with DR:
- No relation exists between the FAZ outline/area and choroidal characteristics, such as thickness and volume (within the ETDRS subfields), LA, SA and TCA, and CVI (based on foveal scan).
- In patients without CSME, no association exists between the FAZ area and the choroidal parameters.
- In patients with CSME, the FAZ area does not correlate with the choroidal characteristics except for the CVI.
To summarize, this study did not identify a link between macular retinal and choroidal vasculature damage in patients with DR. Hence, these two processes seem to occur independently from one another.
Data Sharing Statement
All the materials and information will be available upon an e-mail request to the corresponding author. Names and exact data of the participants of the study may not be available owing to patient confidentiality and privacy policy.
Ethics Approval and Informed Consent
The protocol of the study followed the provisions of the Declaration of Helsinki and was approved by the Local Bioethics Committee at the Medical University of Bialystok (decision no. APK.002.216.2020). Written informed consent was sought from all patients involved in the study.
Consent for Publication
The participants have consented for the submission of results of the study to the journal.
Author Contributions
PS and DD worked on the conception, study design, execution, acquisition of data, and main text with figures and tables. BP, JK, ES, ZM worked on the main text. All authors contributed to data analysis, drafting or revising the article, have agreed on the journal to which the article will be submitted, gave final approval of the version to be published, and agree to be accountable for all aspects of the work.
Funding
There is no funding to report.
Disclosure
The authors have no commercial or proprietary interest in any of the products or companies mentioned in this article.
References
1. Byeon SH, Kim M, Kwon OW. Ischemia. In: Bernardes R, Cunha-Vaz J, editors. Optical Coherence Tomography a Clinical and Technical Update. Vols. 24–26. Springer-Verlag; 2012:chap 2.
2. Nickla DL, Wallman J. The multifunctional choroid. Prog Retin Eye Res. 2010;29(2):144–168. doi:10.1016/j.preteyeres.2009.12.002
3. Garcia JM, Lima TT, Louzada RN, Rassi AT, Isaac DL, Avila M. Diabetic macular ischemia diagnosis: comparison between optical coherence tomography angiography and fluorescein angiography. J Ophthalmol. 2016;2016:3989310. doi:10.1155/2016/3989310
4. Dmuchowska DA, Krasnicki P, Mariak Z. Can optical coherence tomography replace fluorescein angiography in detection of ischemic diabetic maculopathy? Graefes Arch Clin Exp Ophthalmol. 2014;252(5):731–738. doi:10.1007/s00417-013-2518-x
5. Lutty GA. Diabetic choroidopathy. Vision Res. 2017;139:161–167. doi:10.1016/j.visres.2017.04.011
6. Melancia D, Vicente A, Cunha JP, Abegão Pinto L, Ferreira J. Diabetic choroidopathy: a review of the current literature. Graefes Arch Clin Exp Ophthalmol. 2016;254(8):1453–1461. doi:10.1007/s00417-016-3360-8
7. Sun Z, Yang D, Tang Z, Ng DS, Cheung CY. Optical coherence tomography angiography in diabetic retinopathy: an updated review. Eye (Lond). 2021;35(1):149–161. doi:10.1038/s41433-020-01233-y
8. Kim M, Ha MJ, Choi SY, Park YH. Choroidal vascularity index in type-2 diabetes analyzed by swept-source optical coherence tomography. Sci Rep. 2018;8(1):70. doi:10.1038/s41598-017-18511-7
9. Ryu G, Kim I, Sagong M. Topographic analysis of retinal and choroidal microvasculature according to diabetic retinopathy severity using optical coherence tomography angiography. Graefes Arch Clin Exp Ophthalmol. 2021;259(1):61–68. doi:10.1007/s00417-020-04785-7
10. Krasnicki P, Dmuchowska DA, Proniewska-Skretek E, Dobrzycki S, Mariak Z. Ocular haemodynamics in patients with type 2 diabetes and coronary artery disease. Br J Ophthalmol. 2014;98(5):675–678. doi:10.1136/bjophthalmol-2013-304224
11. Agrawal R, Ding J, Sen P, et al. Exploring choroidal angioarchitecture in health and disease using choroidal vascularity index. Prog Retin Eye Res. 2020;77:100829. doi:10.1016/j.preteyeres.2020.100829
12. Sonoda S, Sakamoto T, Yamashita T, et al. Luminal and stromal areas of choroid determined by binarization method of optical coherence tomographic images. Am J Ophthalmol. 2015;159(6):1123–1131.e1. doi:10.1016/j.ajo.2015.03.005
13. Daruich A, Matet A, Moulin A, et al. Mechanisms of macular edema: beyond the surface. Prog Retin Eye Res. 2018;63:20–68. doi:10.1016/j.preteyeres.2017.10.006
14. Early Treatment Diabetic Retinopathy Study Research Group. Grading diabetic retinopathy from stereoscopic color fundus photographs–an extension of the modified Airlie House classification. ETDRS report number 10. Ophthalmology. 1991;98(5 Suppl):786–806. doi:10.1016/S0161-6420(13)38012-9
15. Early Treatment Diabetic Retinopathy Study Research Group. Classification of diabetic retinopathy from fluorescein angiograms. ETDRS report number 11. Ophthalmology. 1991;98(5 Suppl):807–822. doi:10.1016/S0161-6420(13)38013-0
16. Early Treatment Diabetic Retinopathy Study Research Group. Photocoagulation for diabetic macular edema. Early Treatment Diabetic Retinopathy Study report number 1. Arch Ophthalmol. 1985;103(12):1796–1806. doi:10.1001/archopht.1985.01050120030015
17. Early Treatment Diabetic Retinopathy Study Research Group. Fundus photographic risk factors for progression of diabetic retinopathy. ETDRS report number 12. Ophthalmology. 1991;98(5 Suppl):823–833. doi:10.1016/S0161-6420(13)38014-2
18. Agrawal R, Gupta P, Tan KA, Cheung CM, Wong TY, Cheng CY. Choroidal vascularity index as a measure of vascular status of the choroid: measurements in healthy eyes from a population-based study. Sci Rep. 2016;6(1):21090. doi:10.1038/srep21090
19. Sonoda S, Sakamoto T, Yamashita T, et al. Choroidal structure in normal eyes and after photodynamic therapy determined by binarization of optical coherence tomographic images. Invest Ophthalmol Vis Sci. 2014;55(6):3893–3899. doi:10.1167/iovs.14-14447
20. Gerendas BS, Waldstein SM, Simader C, et al. Three-dimensional automated choroidal volume assessment on standard spectral-domain optical coherence tomography and correlation with the level of diabetic macular edema. Am J Ophthalmol. 2014;158(5):1039–1048. doi:10.1016/j.ajo.2014.08.001
21. Adhi M, Brewer E, Waheed NK, Duker JS. Analysis of morphological features and vascular layers of choroid in diabetic retinopathy using spectral-domain optical coherence tomography. JAMA Ophthalmol. 2013;131(10):1267–1274. doi:10.1001/jamaophthalmol.2013.4321
22. Johannesen SK, Viken JN, Vergmann AS, Grauslund J. Optical coherence tomography angiography and microvascular changes in diabetic retinopathy: a systematic review. Acta Ophthalmol. 2019;97(1):7–14. doi:10.1111/aos.13859
23. Singh SR, Vupparaboina KK, Goud A, Dansingani KK, Chhablani J. Choroidal imaging biomarkers. Surv Ophthalmol. 2019;64(3):312–333. doi:10.1016/j.survophthal.2018.11.002
24. Iovino C, Pellegrini M, Bernabei F, et al. Choroidal vascularity index: an in-depth analysis of this novel optical coherence tomography parameter. J Clin Med. 2020;9(2):Feb. doi:10.3390/jcm9020595
25. Campos A, Campos EJ, Martins J, Ambrósio AF, Silva R. Viewing the choroid: where we stand, challenges and contradictions in diabetic retinopathy and diabetic macular oedema. Acta Ophthalmol. 2017;95(5):446–459. doi:10.1111/aos.13210
26. Kim M, Choi SY, Park YH. Quantitative analysis of retinal and choroidal microvascular changes in patients with diabetes. Sci Rep. 2018;8(1):12146. doi:10.1038/s41598-018-30699-w
27. Gupta C, Tan R, Mishra C, et al. Choroidal structural analysis in eyes with diabetic retinopathy and diabetic macular edema-A novel OCT based imaging biomarker. PLoS One. 2018;13(12):e0207435. doi:10.1371/journal.pone.0207435
28. Tan KA, Laude A, Yip V, Loo E, Wong EP, Agrawal R. Choroidal vascularity index - a novel optical coherence tomography parameter for disease monitoring in diabetes mellitus? Acta Ophthalmol. 2016;94(7):e612–e616. doi:10.1111/aos.13044
29. Conrath J, Giorgi R, Raccah D, Ridings B. Foveal avascular zone in diabetic retinopathy: quantitative vs qualitative assessment. Eye (Lond). 2005;19(3):322–326. doi:10.1038/sj.eye.6701456
30. Sim DA, Keane PA, Fung S, et al. Quantitative analysis of diabetic macular ischemia using optical coherence tomography. Invest Ophthalmol Vis Sci. 2014;55(1):417–423. doi:10.1167/iovs.13-12677
31. Lee DH, Kim JT, Jung DW, Joe SG, Yoon YH. The relationship between foveal ischemia and spectral-domain optical coherence tomography findings in ischemic diabetic macular edema. Invest Ophthalmol Vis Sci. 2013;54(2):1080–1085. doi:10.1167/iovs.12-10503
32. Oh J, Baik DJ, Ahn J. Inter-relationship between retinal and choroidal vasculatures using optical coherence tomography angiography in normal eyes. Eur J Ophthalmol. 2020;30(1):48–57. doi:10.1177/1120672118816225
33. Nesper PL, Roberts PK, Onishi AC, et al. Quantifying microvascular abnormalities with increasing severity of diabetic retinopathy using optical coherence tomography angiography. Invest Ophthalmol Vis Sci. 2017;58(6):BIO307–BIO315. doi:10.1167/iovs.17-21787
34. Yazici A, Sogutlu Sari E, Koc R, et al. Alterations of choroidal thickness with diabetic neuropathy. Invest Ophthalmol Vis Sci. 2016;57(4):1518–1522. doi:10.1167/iovs.15-17966
35. Gärtner J, Fischer F. Experimental autonomic neuropathy in the choroid of streptozotocin-diabetic rats. Electron microscopic observations. Retina. 1989;9(1):49–58. doi:10.1097/00006982-198909010-00007
36. Fryczkowski AW, Sato SE, Hodes BL. Changes in the diabetic choroidal vasculature: scanning electron microscopy findings. Ann Ophthalmol. 1988;20(8):299–305.
37. Markan A, Agarwal A, Arora A, Bazgain K, Rana V, Gupta V. Novel imaging biomarkers in diabetic retinopathy and diabetic macular edema. Ther Adv Ophthalmol. 2020;12:2515841420950513. doi:10.1177/2515841420950513
38. Hayreh SS. In vivo choroidal circulation and its watershed zones. Eye (Lond). 1990;4(Pt 2):273–289. doi:10.1038/eye.1990.39
39. Rosen RB, Andrade Romo JS, Krawitz BD, et al. Earliest evidence of preclinical diabetic retinopathy revealed using optical coherence tomography angiography perfused capillary density. Am J Ophthalmol. 2019;203:103–115. doi:10.1016/j.ajo.2019.01.012
40. Ferrara D, Waheed NK, Duker JS. Investigating the choriocapillaris and choroidal vasculature with new optical coherence tomography technologies. Prog Retin Eye Res. 2016;52:130–155. doi:10.1016/j.preteyeres.2015.10.002
41. Agrawal R, Seen S, Vaishnavi S, et al. Choroidal vascularity index using swept-source and spectral-domain optical coherence tomography: a Comparative Study. Ophthalmic Surg Lasers Imaging Retina. 2019;50(2):e26–e32. doi:10.3928/23258160-20190129-15
 © 2021 The Author(s). This work is published and licensed by Dove Medical Press Limited. The
full terms of this license are available at https://www.dovepress.com/terms
and incorporate the Creative Commons Attribution
- Non Commercial (unported, 3.0) License.
By accessing the work you hereby accept the Terms. Non-commercial uses of the work are permitted
without any further permission from Dove Medical Press Limited, provided the work is properly
attributed. For permission for commercial use of this work, please see paragraphs 4.2 and 5 of our Terms.
© 2021 The Author(s). This work is published and licensed by Dove Medical Press Limited. The
full terms of this license are available at https://www.dovepress.com/terms
and incorporate the Creative Commons Attribution
- Non Commercial (unported, 3.0) License.
By accessing the work you hereby accept the Terms. Non-commercial uses of the work are permitted
without any further permission from Dove Medical Press Limited, provided the work is properly
attributed. For permission for commercial use of this work, please see paragraphs 4.2 and 5 of our Terms.