")
Back to Journals » International Journal of Nanomedicine » Volume 19
Folic Acid Functionalized AQ4N/Gd@PDA Nanoplatform with Real-Time Monitoring of Hypoxia Relief and Enhanced Synergistic Chemo/Photothermal Therapy in Glioma
Authors Zhou L, Xiang H, Liu S, Chen H, Yang Y, Zhang J, Cai W
Received 8 December 2023
Accepted for publication 27 March 2024
Published 8 April 2024 Volume 2024:19 Pages 3367—3386
DOI https://doi.org/10.2147/IJN.S451921
Checked for plagiarism Yes
Review by Single anonymous peer review
Peer reviewer comments 2
Editor who approved publication: Dr Xing Zhang
Longjiang Zhou,1,* Haitao Xiang,2,* Susu Liu,3 Honglin Chen,4 Yuanwei Yang,4 Jianyong Zhang,4 Wei Cai4
1Department of Neurology, The Affiliated Hospital of Yangzhou University, Yangzhou University, Yangzhou, 225012, People’s Republic of China; 2Suzhou Kowloon Hospital, Shanghai Jiao Tong University School of Medicine, Suzhou, 215028, People’s Republic of China; 3School of Life Science and Technology, Xidian University and Engineering Research Center of Molecular and Neuro Imaging, Ministry of Education, Xi’an, 710126, People’s Republic of China; 4Department of Neurosurgery, Suqian First Hospital, Suqian, 223800, People’s Republic of China
*These authors contributed equally to this work
Correspondence: Wei Cai; Jianyong Zhang, Department of Neurosurgery, Suqian First Hospital, No. 120, Suzhi Road, Sucheng District, Suqian, Jiangsu Province, People’s Republic of China, Tel +86 15162908957 ; +86 15261296169, Fax +86 527 80766363 ; +86 527 80766155, Email [email protected]; [email protected]
Purpose: Hypoxia is often associated with glioma chemoresistance, and alleviating hypoxia is also crucial for improving treatment efficacy. However, although there are already some methods that can improve efficacy by alleviating hypoxia, real-time monitoring that can truly achieve hypoxia relief and efficacy feedback still needs to be explored.
Methods: AQ4N/Gd@PDA-FA nanoparticles (AGPF NPs) were synthesized using a one-pot method and were characterized. The effects of AGPF NPs on cell viability, cellular uptake, and apoptosis were investigated using the U87 cell line. Moreover, the effectiveness of AGPF NPs in alleviating hypoxia was explored in tumor-bearing mice through photoacoustic imaging. In addition, the diagnosis and treatment effect of AGPF NPs were evaluated by magnetic resonance imaging (MRI) and bioluminescent imaging (BLI) on orthotopic glioma mice respectively.
Results: In vitro experiments showed that AGPF NPs had good dispersion, stability, and controlled release. AGPF NPs were internalized by cells through endocytosis, and could significantly reduce the survival rate of U87 cells and increase apoptosis under irradiation. In addition, we monitored blood oxygen saturation at the tumor site in real-time through photoacoustic imaging (PAI), and the results showed that synergistic mild-photothermal therapy/chemotherapy effectively alleviated tumor hypoxia. Finally, in vivo anti-tumor experiments have shown that synergistic therapy can effectively alleviate hypoxia and inhibit the growth of orthotopic gliomas.
Conclusion: This work not only provides an effective means for real-time monitoring of the dynamic feedback between tumor hypoxia relief and therapeutic efficacy, but also offers a potential approach for the clinical treatment of gliomas.
Keywords: gliomas, hypoxia relief, photothermal therapy, real-time monitoring, photoacoustic imaging
Introduction
Gliomas are the most common primary malignant tumor derived from glial cells in the brain.1,2 They have a high incidence, recurrence rate, and mortality rate.3 Surgical treatment is currently the primary approach for clinical management of gliomas.4 However, gliomas often exhibit invasive growth within the brain tissue, with irregular shape and no clear boundaries,5,6 which are difficult to completely surgically remove and often require combined use with other therapies.7,8 Chemotherapy is the most common synergistic approach. Saran et al found that postoperative chemotherapy significantly improved the survival of glioma patients with minimal safety and toxicity.9 However, nearly all patients experience chemoresistance, leading to poor prognosis.10,11 Multiple factors contribute to chemoresistance, including drug efflux,12,13 DNA repair alterations,5 drug metabolism changes,14 overexpression of anti-apoptotic genes,9 and tumor hypoxia,15–17 of which hypoxia is one of the key factors contributing to patient resistance to conventional chemotherapy. Hypoxia induces the upregulation of drug-resistant genes in tumors, promotes drug efflux, and decreases intracellular drug concentration, thereby increasing chemotherapy tolerance in tumor cells.18–20 Basso et al found that HIF-1 induced high expression of MGMT under hypoxic conditions, resulting in glioma resistance to TMZ.21 Therefore, effectively alleviating hypoxia is essential for coping with chemoresistance in gliomas.
Many effective strategies have been proposed to alleviate tumor hypoxia, including enhancing oxygen supply to the tumor site,22 catalyzing the decomposition of endogenous H2O2 to generate oxygen,23 and utilizing photothermal agents to alleviate the tumor hypoxic microenvironment.24 Among these strategies, photothermal therapy has gained attention due to its high spatiotemporal precision and non-invasiveness.25,26 Mild photothermal therapy, as an effective adjuvant treatment, can promote blood flow at the tumor site and increase oxygen supply, thereby alleviating tumor hypoxia.27,28 In our previous research, we designed a tumor photothermal therapy using IR780&TMZ@LipA nanoparticles. The results showed a significant reduction in the expression of HIF-1 in the photothermal therapy group, indicating that mild photothermal therapy can effectively alleviate hypoxia.29 Li et al designed nanoparticles loaded with Ce6 and found that mild photothermal therapy reduced tumor mechanical stress, leading to normalization of the tumor vasculature and facilitating the external oxygen supply to the tumor.24 Yang et al designed GA-PB@MONs@LA nanoparticles, which achieved on-demand release of GA and mild photothermal therapy through near-infrared laser irradiation, effectively alleviating tumor hypoxia and inducing tumor cell apoptosis.30 Therefore, the degree of tumor hypoxia is closely related to the therapeutic effect, and that real-time monitoring of tumor hypoxia can effectively enhance the therapeutic effect. However, existing studies often rely on ex vivo detection after treatment to assess tumor hypoxia,28 which cannot provide real-time and effective monitoring of the hypoxic status at the tumor site. Our previous study showed that real-time monitoring of blood oxygen saturation in the tumor region using photoacoustic imaging can indirectly reflect hypoxia status.30,31 Therefore, it is critical to explore a strategy to monitor feedback between hypoxia relief and efficacy.
In this paper, we designed a folic acid functionalized AQ4N/Gd@PDA-FA nanoplatform, which can real-time monitor hypoxia relief and enhance the synergistic chemo/photothermal therapy in glioma. AGPF NPs are synthesized by the one-pot method, in which AQ4N, Gd, and PDA were self-assembled, and folate was cross-linked on the surface of the nanoparticles for targeting gliomas, as shown in Scheme 1. AGPF NPs enable both MR and PA imaging, which can be used for in vivo monitoring of orthotopic gliomas. Due to the strong near-infrared light absorption of polydopamine,32 AGPF NPs are able to achieve mild-temperature photothermal therapy (PTT), which can effectively alleviate tumor hypoxia. At the same time, we monitored blood oxygen saturation at the tumor site in real-time through PAI, which achieved feedback between hypoxia and the efficacy of glioma treatment. In addition, in vivo effects in orthotopic glioma mice have shown that AGPF NPs can alleviate tumor hypoxia and effectively inhibit tumor growth through synergistic chemotherapy and photothermal therapy. In summary, this study provides a potential method for the clinical treatment of glioma and monitoring feedback between hypoxia relief and efficacy.
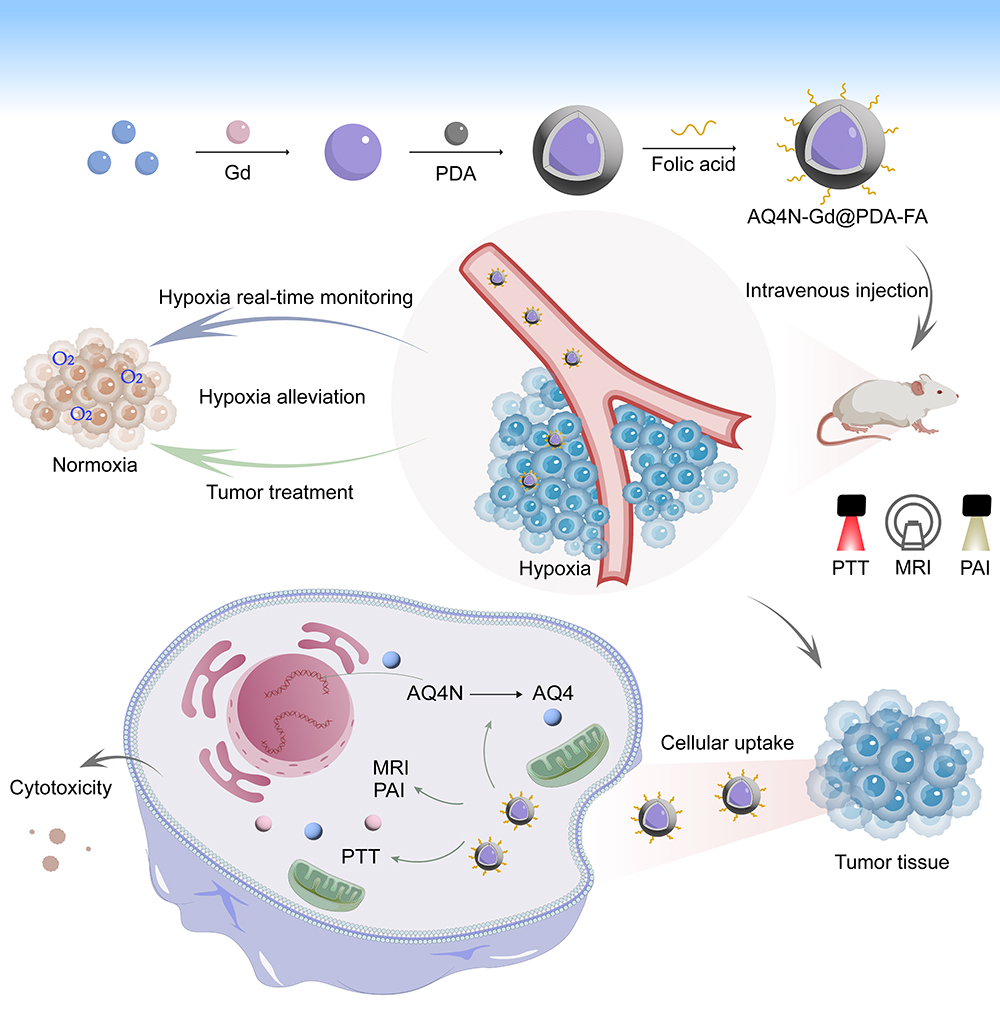 |
Scheme 1 Schematic diagram of the synthesis and synergistic therapy to alleviate hypoxia of AGPF NPs. |
Materials and Methods
Chemicals and Consumables
Banoxantrone dihydrochloride (AQ4N) was purchased from MedChemExpress (MCE), dopamine (DA) from Aladdin, Tris HCl from CWBio Kangwei Century Biotechnology Co., Ltd., HCl from Luoyang Haohua Chemical Reagent Co., Ltd., fetal bovine serum (FBS) from Gibco, culture medium (DMEM) from Hyclone, dimethyl sulfoxide (DMSO) from Tianjin Tianli, L-glutamine (L-G) from Solarbio, HEPES from Solarbio, Double antibody (A/P) was purchased from Biosharp, pancreatic enzyme was purchased from HyClone, DAPI staining solution was purchased from PhD Biotech, the kit Counting Kit-8 (CCK-8) was purchased from Dojindo, 4% paraformaldehyde fixed solution was purchased from Beyotime, xylene from Shanghai Lingfeng Chemical Reagent Co., Ltd., anhydrous ethanol from China National Pharmaceutical Group Chemical Reagent Co., Ltd., TM-100 medical ultrasound coupling agent from Tianjin Jinya Technology Development Co., Ltd., isoflurane from Rayward, 4% paraformaldehyde fixed solution from Beyotime, Tunel reagent kit from Wuhan Servicebio Technology, and hematoxylin eosin reagent kit from Wuhan Servicebio Technology. Sheep red blood cells (4%) were purchased from Shanghai Yuanye Bio-Technology. U87 cells (human astrocytes) were purchased from Wuhan Servicebio Technology.
Synthesis of AGPF NPs
The synthetic method of AGPF NPs used a one-pot approach. Mix 50 μL of AQ4N solution (5 mM), 125 μL of GdCl3 solution (20 mM), and 75 μL Tris-HCl solution (pH 8.5, 0.01 mM) together, where the ratio of the amounts of AQ4N to Gd is 1:10. The total volume of the reaction system was 250 μL, and it was reacted at room temperature for 6 hours using a thermostatic mixer. After the reaction concluded, unreacted Gd3+ was removed by utilizing a 3KD specification ultrafiltration tube. The solution was added to the tube and placed in a high-speed centrifuge. The centrifugation was carried out at 4000 rpm for 5 minutes. The liquid under the ultrafiltration tube was discarded, and an appropriate amount of Tris-HCl solution was added to the top of the tube. The centrifugation process was repeated three times, and the solution collected at the top of the ultrafiltration tube was used to obtain AQ4N/Gd NPs (AG NPs). To obtain AQ4N/Gd@PDA NPs (AGP NPs), 500 μL of AG NPs solution and 500 μL of a 1.5 mg/mL dopamine hydrochloride solution were mixed and placed in a 2 mL centrifuge tube. The reaction was conducted at room temperature for 3 hours using a thermostatic mixer. After completion of the reaction, the mixture was centrifuged at 12,000 rpm for 20 minutes using a high-speed centrifuge to obtain AGP NPs. A 1:1 molar ratio of AGP NPs and FA was used to obtain AQ4N/Gd@PDA-FA NPs (AGPF NPs). The reaction was carried out at room temperature for 3 hours in a thermostatic mixer using Tris-HCl with pH 8.5 as the reaction solvent.
Characterization of AGPF NPs
Morphological and size observations were made on AGPF NPs. The solution was dropped onto a copper mesh and observed under a transmission electron microscope. The hydrodynamic size and zeta potential of AG NPs, AGP NPs, and AGPF NPs were measured using a Malvern particle size analyzer. The UV characteristic peaks of AG NPs, AGP NPs, and AGPF NPs were detected and characterized using a UV-visible spectrophotometer. Energy-dispersive X-ray spectroscopy (EDS) and X-ray photoelectron spectroscopy (XPS) were used to analyze the elements of AGPF NPs. The NPs were dispersed in PBS and 10% FBS, and stored at 37°C and 4°C respectively. The hydrodynamic size of the nanoparticles was continuously measured for seven days using the Malvern particle size analyzer to observe their stability. The release curves of AQ4N, AGPF NPs, and AGPF NPs+Laser in a 37°C water bath were also assessed.
In vitro and in vivo Photothermal Experiments
The photothermal conversion ability and stability of the constructed nanoparticles were investigated using an 808 nm laser as the light source. First, the photothermal conversion ability of AGP NPs and AGPF NPs was tested. Deionized water was used as a control. The laser power was set to 2 W/cm2, the height was 5 cm, and continuous irradiation was performed for 5 minutes. The solution temperature was recorded using a near-infrared thermal imager every 30 seconds. The photothermal conversion performance of different concentrations of AGPF NPs (AQ4N concentrations of 15, 30, 60, and 120 μg/mL) was tested with deionized water as a control. The laser was continuously irradiated, and the solution temperature was recorded every 30 seconds using a thermal imager. The photothermal conversion performance of AGPF NPs under different laser irradiation powers was also tested. In addition, to study the photothermal stability of AGPF NPs, the samples were continuously exposed to 808 nm laser irradiation for 5 minutes to increase the temperature, and then allowed to cool naturally to room temperature. The temperature of the solution was recorded after undergoing 5 irradiation cycles.
Nine tumor-bearing mice were used, with one set as the PBS group, one as the AGP NPs group, and one as the AGPF NPs group (AQ4N concentration of 60 μg/mL). The samples from each group were injected into the mice via tail vein injection, and thermal images were captured using a near-infrared thermal imager before injection and 6 hours after injection followed by laser irradiation (808 nm; 2 W/cm2; 5 minutes). In addition, the mice were irradiated every three days and the survival rate of each group of mice within 15 days was calculated.
In vitro PA/MR Imaging
The T1 MR imaging ability of AGPF NPs was detected using a 3.0-T magnetic resonance imager. AGPF NPs were lyophilized and dispersed into different concentrations using deionized water (AQ4N concentrations of 7.5, 15, 30, 60, 60 and 120 μg/mL). The samples were placed in the detection area and scanned using the magnetic resonance imaging scanner. Additionally, the T1 relaxation time of AGPF NPs was measured. After imaging, ImageJ software was used for quantitative analysis of the grayscale values, and the r1 value was calculated. The PA imaging ability of AGPF NPs was detected using the MSOT Invision photoacoustic imaging system. Agarose was used to prepare a photoacoustic imaging phantom, and the photoacoustic imaging ability of different concentrations of AGPF NPs solutions (AQ4N concentrations of 7.5, 15, 30, 60, and 120 μg/mL) was measured.
In vitro Cell Culture Studies
In vitro Cell Viability
U87 cells were cultured in a DMEM medium containing 10% FBS under a 5% CO2 atmosphere at 37°C. The cells were seeded into a 96-well plate, with 100 µL per well, and incubated at 37°C in a 5% CO2 incubator until the cells adhered and reached a confluence of approximately 85%. Then, the culture medium was replaced, and PBS, AQ4N, AG NPs, AGP NPs, and AGPF NPs (with AQ4N concentrations of 1, 3, 9, 27, and 81 μg/mL) were added to the corresponding wells. The cells were further incubated in the CO2 incubator for 48 hours. Each sample was divided into two groups: a control group and a laser irradiation group. The laser irradiation group was exposed to 5 minutes of laser irradiation (808 nm; 2 W/cm2). Afterward, 10 µL of CCK-8 solution was added to each well, and the plate was incubated for 2 hours. The 96-well plate was then taken out, and the absorbance at 450 nm of each well was measured using an enzyme-linked immunosorbent assay (ELISA) reader to calculate the cell viability.

Fluorescent Confocal Cell Imaging
U87 cells in good culture condition were prepared into a cell suspension with a concentration of 105 cells/mL. One mL of the cell suspension was seeded in a confocal-specific dish and placed in a 37°C, 5% CO2 incubator. When the cells adhered and reached 75% confluence, the culture medium was discarded, and the cells were washed three times with PBS. Then, serum-free culture medium containing AGPF NPs at a concentration of 60 μg/mL were added, and the cells were incubated for 1, 2, 4, 8, and 12 hours, respectively. After incubation, the confocal-specific dish was taken out from the incubator, and the culture medium was gently aspirated using a pipette. After washing with PBS three times, the cells were fixed and stained. First, 500 µL of 4% paraformaldehyde was added for cell fixation. After fixation, the cells were washed three times with deionized water, and then 100 µL of DAPI staining solution was added to stain the cell nuclei. After staining, DAPI was aspirated using a pipette, and then the cells were washed three times with PBS. The internalization of AGPF NPs was observed under a laser confocal microscope, and the fluorescence intensity of the cell internalization images was quantitatively analyzed using Image J.
To study cell affinity, U87 cells were seeded into confocal-specific dishes and incubated for 12 hours at 37°C with 5% CO2. The dishes were then taken out, and the culture medium was discarded. The cells were washed three times with PBS and fresh medium was added. AGP NPs and AGPF NPs with the same concentration (AQ4N concentration of 60 μg/mL) were added to the cells in the confocal-specific dishes and incubated for 4 hours. After discarding the medium, the cells were washed three times with PBS. Then, the cells were fixed with 4% paraformaldehyde for 20 minutes and washed with PBS to remove the paraformaldehyde. Subsequently, DAPI staining solution was added to stain the cell nuclei for 15 minutes, followed by three washes with water. The cells were then ready for observation using confocal laser scanning microscopy (CLSM).
Flow Cytometry
Flow cytometry was used to detect the effects of AGPF NPs on apoptosis in U87 cells under laser irradiation and non-irradiation conditions. Annexin-V-FITC and propidium iodide (PI) staining were used to quantitatively detect phosphatidylserine on the surface of apoptotic cells. Four groups were set: AGPF NPs (30 µL) and AGPF NPs+Laser (10 µL, 20 µL, and 30 µL) with an AQ4N concentration of 60 μg/mL. First, the cells were incubated with different doses of AGPF NPs for 48 hours. After incubation, the laser irradiation groups were exposed to 5 minutes of laser irradiation (808 nm) with a power of 2 W/cm2. After laser irradiation, the cells were centrifuged, washed with PBS, and then resuspended in PBS. Annexin-V-FITC staining was performed for 1 hour, followed by PI staining for 30 minutes. Flow cytometric analysis was performed using the BD Accuri C6 system.
Hemolysis and Acute Toxicity Test
Four % sheep blood cells were prepared to obtain a red blood cell suspension. In separate test tubes, 20 μL of Triton X-100 (1%) for the positive control group, PBS for the negative control group, PDA group, AQ4N group, GdCl3 group, and AGPF NPs group (30 mM and 90 mM) were added, along with 500 μL of sheep blood and 480 μL of PBS. The mixtures were gently mixed and incubated at 37°C for 2 hours in a water bath. Three independent replicate experiments were performed for each group. After incubation, the liquid in each test tube was centrifuged at 12,000 rpm for 5 minutes. The absorbance of the supernatant of each group at 545 nm was measured using a UV-visible spectrophotometer (UV2900, Shanghai), and the hemolysis rate of each group was calculated according to the formula:

Acute toxicity assay refers to the toxic reactions and mortality observed in animals after a single high-dose administration. Eighteen healthy mice were fed under SPF conditions. PBS, PDA, GdCl3, AQ4N, and AGPF NPs (30 mM and 90 mM) were injected into the mice via the tail vein, each with a volume of 200 μL. The mice were observed for signs of life for 14 days and the mortality rate was calculated. During the determination of the lethal dose, adverse reactions such as piloerection, proptosis, muscle paralysis, difficulty breathing, coma, and convulsions were carefully observed. After 14 days, the mice were euthanized and the heart, liver, spleen, lung, and kidneys of each group were collected for H&E staining. Blood from the orbital cavity was collected for blood biochemical analysis.
Construction of the Orthotopic Glioma Mice Model
All animal experiments were performed in accordance with the animal ethics of the Institute of Comparative Medicine Yangzhou University (No. 202311007). Every operation conducted in animals complied with the Animal Welfare Act, the Guide for the Care and use of Laboratory Animals, and the Office of Laboratory Animal Welfare. Healthy server combined immune-deficiency (SCID) mice were kept in an SPF grade environment. After anesthetizing the SCID mice, their heads were fixed on a cranial localizer. After the head was sterilized with iodophor, 5 μL of 1×10⁵ U87 cell suspension was injected with a microsyringe for 5 min, and the needle was left in place for 2 min. After the needle was removed vertically and slowly, the skin on both sides was reset with forceps, and then sewn up with suture needles. After the operation, the in situ tumor model mice were closely observed and given high nutrient feed.
In vivo PA/MR Imaging
The orthotopic glioma mice model was randomly divided into three groups: the AGP NPs non-targeted group, and the AGPF NPs targeted group. The samples were injected into the tumor-bearing mice via tail vein injection, with a concentration of 60 μg/mL AQ4N. After adjusting the temperature control and parameters of the instrument, the mice were anesthetized using isoflurane and placed in the magnetic resonance imaging scanner. Magnetic resonance imaging of the mice was performed at different time points (pre-injection, 1, 2, 3, 6, 12, and 24 hours). After obtaining T1-weighted MR images, Image J software was used for quantitative analysis of the grayscale values of the magnetic resonance images. In vivo photoacoustic imaging of the mice at each corresponding time point was performed using a photoacoustic imaging system. Image J software was used for quantitative analysis of the photoacoustic signals at the tumor site of the mice.
In vivo Hypoxia Monitoring
U87 cells were used to construct subcutaneous tumor mice, and MSOT was used for PA imaging. Mice with moderate-sized tumors were divided into five groups: PBS, AQ4N, Laser, AGPF NPs, and AGPF NPs+Laser. The concentration of AQ4N was 60 μg/mL, and an 808 nm laser (power of 2 W/cm2, continuous irradiation for 5 minutes) was used. PAI of deoxy/oxyhemoglobin was captured at 0, 2, 4, 6, and 8 days before administration, and the blood oxygen saturation sO2 was calculated.
In vivo Synergistic Chemotherapy/PTT
Immunodeficient mice bred under aseptic SPF conditions were injected with a bioluminescent substrate on the first day to perform in vivo bioluminescent imaging and detect tumor signals. On the second day, the mice in each group were injected with 200 μL of AQ4N/Gd NPs, AGP NPs, or AGPF NPs (at a concentration of 60 μg/mL AQ4N). The control group was injected with the same dose of saline. Each sample was injected into two groups, divided into the normal experimental group and the group with laser irradiation. Six hours after injection, the group with laser irradiation was treated with an 808 nm laser (power of 2 W/cm2, continuous irradiation for 5 minutes). Tumor signals and mouse body weight were recorded regularly every three days. After 15 days, the mice were euthanized, and the tumor tissues, as well as the heart, liver, spleen, lung, and kidneys, were extracted for H&E staining, fluorescence TUNEL section observation, and HIF-1 immunohistochemical analysis.
Statistical Methods
The data obtained from the experiments were expressed as the mean (standard deviation, SD). A one-way analysis of variance (ANOVA) was performed to determine the statistical significance, and the level was set at P < 0.05 (*), P < 0.01 (**), and P < 0.001 (***).
Results and Discussion
Synthesis and Characterization of AGPF NPs
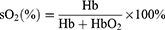
AQ4N is a chemotherapy drug commonly used to effectively alleviate hypoxic conditions in tumor sites. It is reported that the combination of photothermal therapy and chemotherapy yields promising anti-tumor effects.27 In view of this, the development of nanoparticles containing AQ4N, Gd3+, and PDA enables chemotherapy combined with photothermal therapy to mitigate hypoxia in glioma and achieve improved anti-tumor efficacy. AGPF NPs were synthesized via a one-pot method (Figure 1a). As shown in Figure S1, AG NPs were first formed by coordinating AQ4N with Gd3+, then DA was used to grow AG NPs into AGP NPs, which were finally cross-linked with FA to obtain AGPF NPs. Transmission electron microscopy (TEM) images revealed the self-assembling of AGPF NPs into spherical nanoparticles (Figure 1b and c) with a diameter of approximately 100 nm, indicating the successful synthesis of nanoparticles for tumor therapy. To confirm the composition of AGPF NPs, UV-Vis spectra of AG NPs, AGP NPs, and AGPF NPs were obtained (Figure 1d). The UV characteristic absorption peaks of AQ4N and FA were observed at 612 nm and 350 nm, respectively. AGP NPs and AGPF NPs showed the same characteristic absorption peaks of AQ4N and FA. Additionally, energy-dispersive X-ray spectroscopy (EDS) analysis and X-ray photoelectron spectroscopy (XPS) confirmed the presence of Gd3+ in AGPF NPs (Figures 1g, S1 and S2). These results demonstrate the successful assembly of AQ4N, Gd3+, and FA. The particle size of AGPF NPs was measured using dynamic light scattering (DLS) (Figure 1e). The particle sizes of AG NPs, AGP NPs, and AGPF NPs were 105.7±8.21 nm (PDI=0.194), 122.4±5.3 nm (PDI=0.193), and 141.8±6.8 nm (PDI=0.172), respectively, which were slightly larger than those obtained by TEM due to the limitations of particle size analysis. The zeta potentials of AG NPs, AGP NPs, and AGPF NPs were also measured (Figure 1f). The zeta potential of AG NPs was negative, and it became more negative after loading PDA. After adding FA, the zeta potential remained at −1.1±0.23 mV, which is advantageous for reducing protein adsorption and improving the circulation of anti-tumor drugs in vivo. The release curves of AGPF NPs, AGPF NPs+Laser and free AQ4N were measured (Figure 1h). AGPF NPs degrade in the acidic environment of the tumor, allowing AQ4N to be released, and in our experiments we have shown that the release of AQ4N from AGPF NPs can also be facilitated by laser irradiation. The release rate of free AQ4N was very fast, reaching almost 100% at 5 hours. In contrast, the release of AGPF NPs was slower and reached equilibrium at 6 hours. The maximum release of AGPF NPs was only 20.04% of that for free AQ4N, indicating that AGPF NPs can control drug release, thereby enhancing their therapeutic efficacy in vivo. The stability of AGPF NPs was evaluated in vitro by dispersing AQ4N NPs in PBS (Figure 1i) and 10% FBS solution (Figure 1j), and measuring the hydrated particle size of nanoparticles using DLS for 7 consecutive days. Although AGPF NPs exhibited slight fluctuations in size, they remained within an acceptable size range for tumor therapy and showed good stability in PBS and 10% FBS solutions, providing the possibility of enhanced permeability and retention (EPR) effect for a significant targeting effect in vivo.
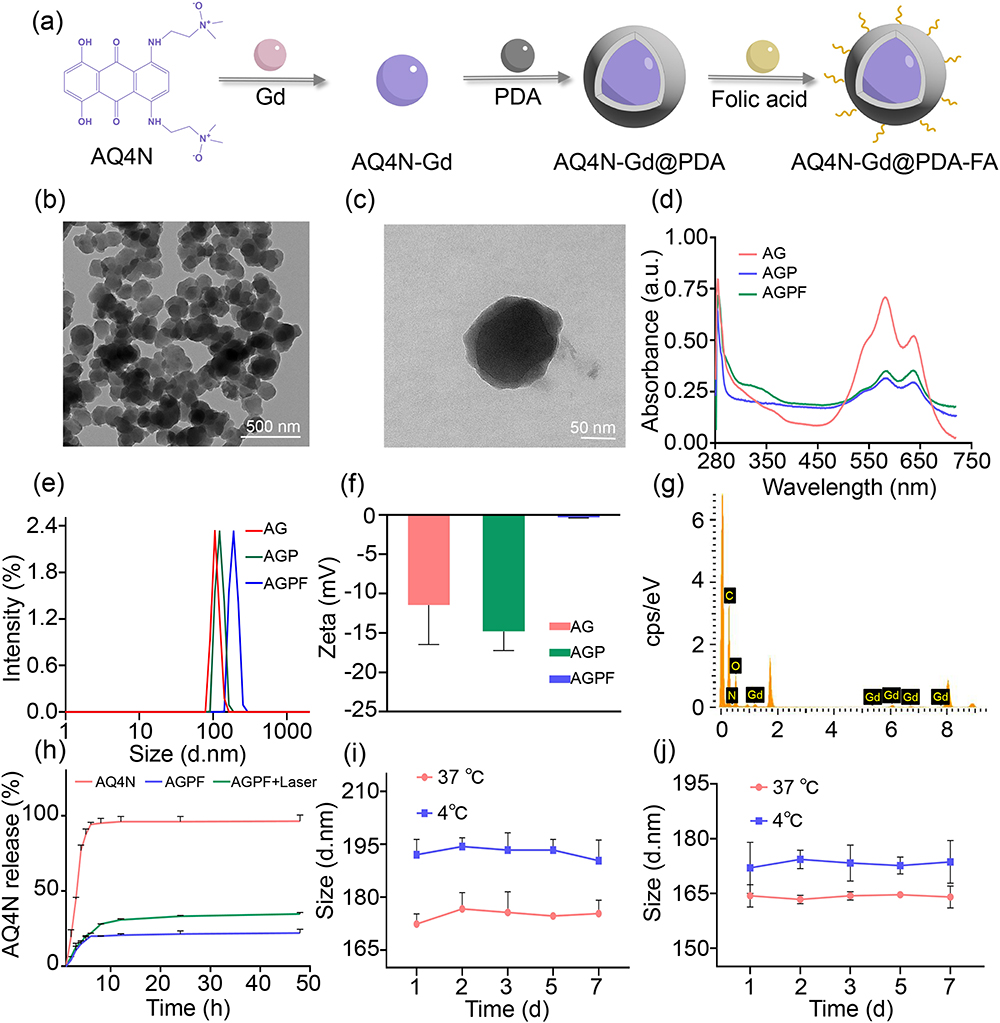 |
Figure 1 Characterization and performance study of AGPF NPs. (a) Schematic illustration of AGFP NP preparation. (b and c) Transmission electron microscopy (TEM) images of AGPF NPs, scale bar = 500 nm/50 nm. (d) UV-Vis absorption spectra of AG NPs, AGP NPs, and AGPF NPs. (e) Particle size distribution of AG NPs, AGP NPs, and AGPF NPs characterized by dynamic light scattering. (f) Zeta potential of AG NPs, AGP NPs, and AGPF NPs characterized by dynamic light scattering. (g) EDS spectrum of AGPF NPs. (h) In vitro release curves of AGPF NPs, AGPF NPs+L and AQ4N. (i) Stability evaluation of AGPF NPs in 10% FBS for 7 days. (j) Stability evaluation of AGPF NPs in PBS for 7 days. |
In vitro/ vivo Photothermal Evaluation of AGPF NPs
Photothermal therapy (PTT) is an effective approach to alleviate hypoxia, offering spatial and temporal precision as well as a non-invasive nature compared to other strategies targeting hypoxia. PTT utilizes a photothermal agent to convert near-infrared (NIR) light energy into heat, thereby promoting blood flow and increasing oxygen supply to the tumor site, thus relieving tumor hypoxia.33 PDA was formed through a series of oxidation and reduction reactions and self-polymerization of DA in water, resulting in the solution changing from transparent to black. PDA exhibited strong spectral absorption, indicating the excellent photothermal effect of AGPF NPs. To investigate the photothermal properties of NPs, we utilized an 808 nm NIR laser and real-time infrared thermal imaging to monitor the temperature increase of AGPF NPs. As shown in Figure 2a, after 5 minutes of irradiation with the 808 nm laser, the temperature of the AGPF NPs solution increased rapidly, and the infrared thermal image intuitively demonstrated good photothermal efficiency of AGPF NPs. As shown in Figure 2b, we further studied the temperature changes of AG NPs and AGPF NPs under irradiation with an 808 nm laser, with ultrapure water serving as a control. Within 5 minutes, the temperature of AGPF NPs rapidly increased to 70.9°C, while AG NPs and ultrapure water only reached 30.3°C and 24.2°C, respectively, with a slower temperature rise. In addition, the temperature changes of AGPF NPs at different concentrations (15, 30, 60, and 120 μg/mL) and different power densities (1, 1.5, and 2 W/cm2) were measured. As shown in Figure 2c, the AGPF NPs at concentrations of 15, 30, 60, and 120 μg/mL reached temperatures of 59.8°C, 63°C, 65.6°C, and 70.9°C, respectively, within 5 minutes. The photothermal efficiency of AGPF NPs exhibited a high dependence on concentration. Under different power densities, the temperature of AGPF NPs gradually increased with the increasing power. When the power density reached 2 W/cm2, the AGPF NPs reached a temperature of 70.9°C within 5 minutes (Figure 2d), while under 1.5 W/cm2 and 1 W/cm2 irradiation, the AGPF NPs only reached temperatures of 46.6°C and 55.6°C, respectively. Therefore, a power density of 2 W/cm2 was chosen for subsequent irradiation. Furthermore, the photothermal stability of the AGPF NPs solution was evaluated, as shown in Figure 2f. After each cycle, the temperature of the AGPF NPs solution could still reach the highest temperature observed in the first cycle, indicating good photothermal stability of AGPF NPs. We conducted further in vivo studies on the photothermal performance in a subcutaneous mice model of gliomas (Figure 2g). Six hours before the experiment, PBS, AGP NPs, and AGPF NPs were intravenously injected into the mice. The tumor site was then irradiated with an 808 nm laser for 5 minutes. It was found that the tumor temperature of the mice in the PBS group and AGP NPs group reached 38.9°C and 40.2°C, respectively, while the tumor temperature of the mice in the AGPF NPs group reached 45.3°C (Figure 2e), demonstrating good photothermal conversion performance of AGPF NPs for in vivo temperature and photothermal therapy. Next, each group of mice was continuously irradiated for three days as a cycle. Within 15 days, the survival rate of mice in each group was 100% (Figure S3), indicating that laser irradiation did not cause significant harm to the mice.
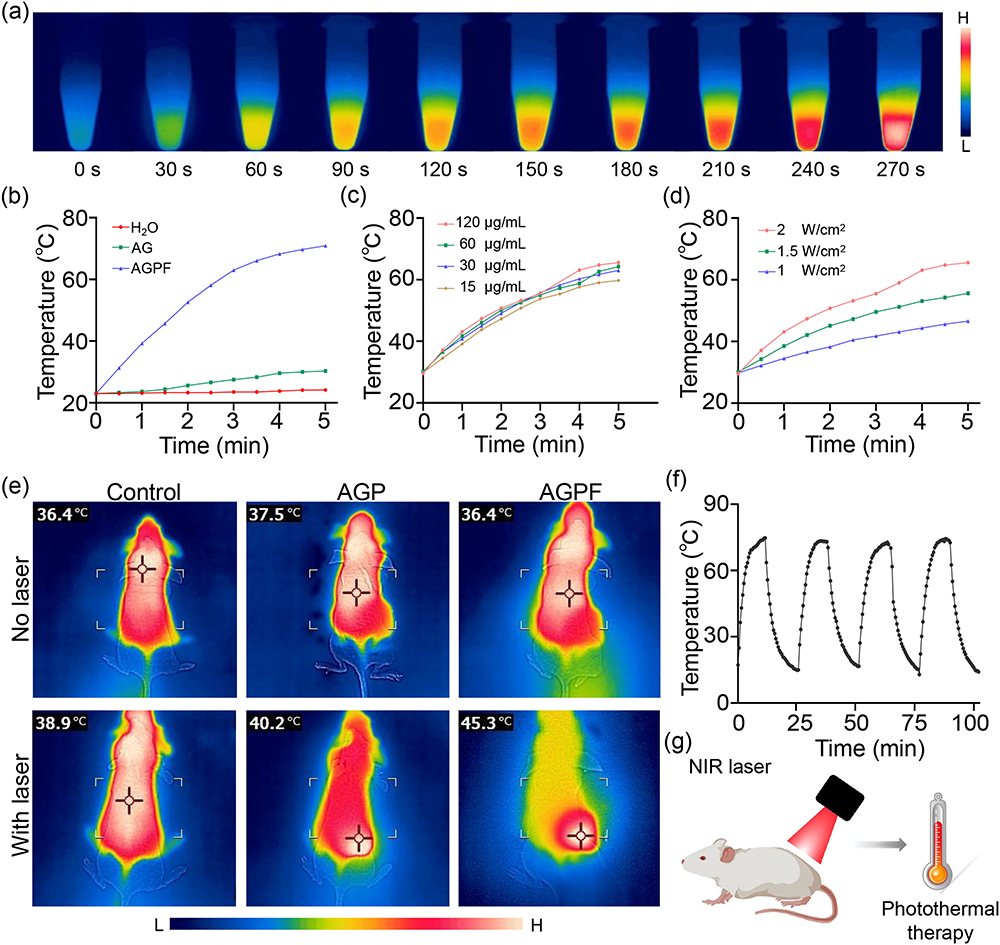 |
Figure 2 Study of photothermal properties of AGPF NPs. (a) Near-infrared images of AGPF NPs in photothermal conversion. (b) Temperature changes of AG NPs and AGPF NPs under 808 nm laser irradiation, with deionized water as the control. (c) Temperature changes of AGPF NPs at different concentrations under 808 nm laser irradiation. (d) Temperature changes of AGPF NPs under different power settings. (e) Near-infrared images of AGPF NPs in tumor-bearing mice under 808 nm laser irradiation. (f) Temperature changes of AGPF NPs solution under cyclic irradiation from an 808 nm laser. (g) Schematic of photothermal therapy. |
In vitro PA/MR Imaging of AGPF NPs
To verify that AGPF NPs can be used for effective in vivo imaging monitoring, we investigated the in vitro PA/MR imaging properties. AQ4N has photoacoustic imaging performance and can provide high-resolution and high-contrast tissue images as a photoacoustic signal source.34 As shown in Figure 3a, with the increase of AGPF NPs concentration, the PAI signal gradually strengthened, and the PAI signal strength was positively correlated with nanoparticle concentration. As shown in Figure 3c, the PAI signal also showed a good linear relationship with the increase in AGPF NPs concentration (from 7.5 μg/mL to 120 μg/mL), while ultra-pure water showed almost no PAI signal, confirming the good photoacoustic imaging ability of AGPF NPs as a signal source.
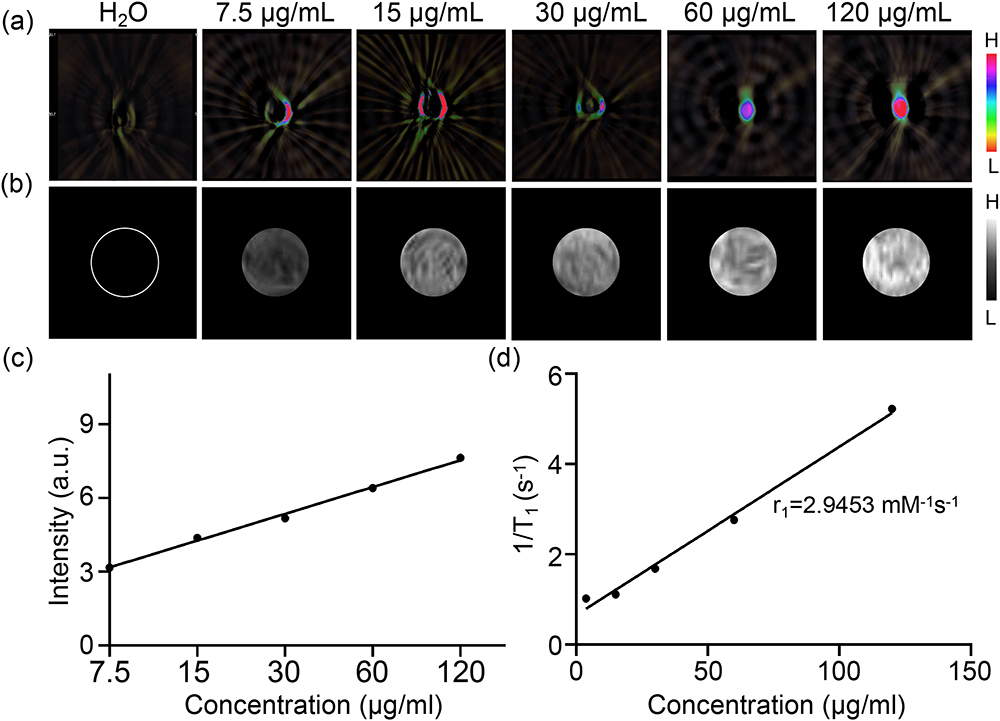 |
Figure 3 In vitro imaging study of AGPF NPs. (a) PA images of AGPF NPs at different concentrations. (b) T1-MR images of AGPF NPs at different concentrations. (c) PA quantitative intensity analysis. (d) r1 relaxation rate. |
In previous work, Gd3+ has been proven to be an excellent MRI contrast agent.35 To study the MR imaging capability of AGPF NPs, T1-weighted MR images of AGPF NPs at different concentrations were measured. As shown in Figure 3b, the MRI signal of AGPF NPs increased with the increase in sample concentration, and the T1 relaxation time showed a regular linear increase. After linear fitting of the Gd3+ concentration in AGPF NPs as the horizontal axis and 1/T1 as the vertical axis, the r1 value of AGPF NPs was calculated to be 2.9453 mM−1s−1 (Figure 3d). AGPF NPs have excellent T1-weighted MRI performance and can be used for subsequent in vivo MR imaging.
Cell Culture Studies of AGPF NPs
Cytotoxicity is one of the important mechanisms of nanoparticle-based tumor therapy. As shown in Figure 4a, to detect the cytotoxicity and photothermal cytotoxicity of AQ4N, AG NPs, AGP NPs, and AGPF NPs, the CCK-8 assay was used for cytotoxicity evaluation. When AQ4N, AG NPs, AGP NPs, and AGPF NPs were incubated alone without laser irradiation, the cell viability in each group was relatively high, indicating good biocompatibility and low toxicity of AQ4N, AG NPs, AGP NPs, and AGPF NPs. However, under laser irradiation, the cell viability of the AQ4N and AG NPs groups was relatively high (Figure 4b), whereas the cell viability of the AGP NPs and AGPF NPs groups significantly decreased, indicating good photothermal effects of AGP NPs and AGPF NPs. In particular, the cell viability of the AGPF NPs plus laser group was 36%, indicating strong photothermal cytotoxicity of this material, which can be used for subsequent in vivo treatment.
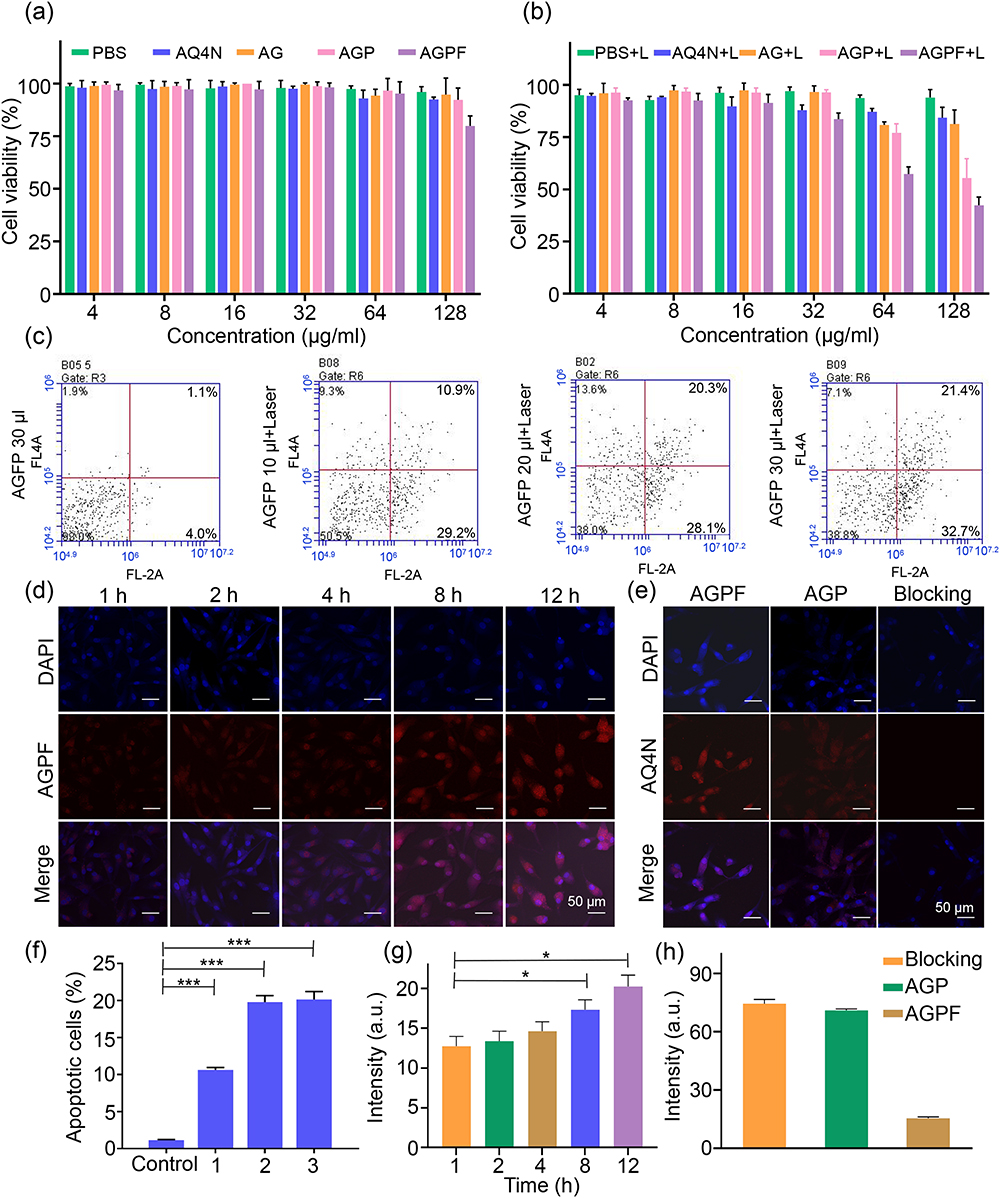 |
Figure 4 In vitro cell culture studies. Cell toxicity of PBS, AQ4N, AG NPs, AGP NPs, and AGPF NPs at different concentrations (a) and photothermal cytotoxicity analysis (b). (c) Flow cytometry analysis of the effect of AGPF NPs at different concentrations on U87 cell apoptosis under laser irradiation. (d) Intracellular uptake analysis of AGPF NPs, scale bar = 50 μm. (e) Cell affinity analysis of AGP NPs and AGPF NPs, scale bar = 50 μm. (f) Quantitative analysis of apoptosis inhibition. (g) Quantitative fluorescence intensity analysis of AQ4N cellular uptake. (h) Quantitative fluorescence intensity analysis of AQ4N cellular affinity. P < 0.05 (*), P < 0.001 (***). |
It is crucial for the nanoplatform to be able to enter the tumor cells in order to exert their therapeutic effects. As shown in Figure 4d, DAPI was used to stain the cell nucleus (blue fluorescence), and AQ4N exhibited red fluorescence mainly distributed in the cytoplasm. Over time, AGPF NPs gradually accumulate in the cytoplasm. This indicates that AGPF NPs can be effectively delivered into cells and accumulate in the cytoplasm. Figure 4g shows the quantitative analysis of the fluorescence intensity of AQ4N in the cytoplasm during the internalization of AGPF NPs. It can be seen that the signal of AQ4N in the cytoplasm gradually increased over time and continued to accumulate in the cytoplasm at 12 hours, confirming the effectiveness of cellular uptake of AGPF NPs. In addition, we compared the binding of AGP NPs and AGPF NPs to determine if the nanoparticles possess good tumor targeting specificity. As shown in Figure 4e, red fluorescence (AQ4N) was observed around the blue fluorescence (DAPI staining) of the cell nucleus, indicating the localization of AGPF NPs in cancer cells. In contrast, cells treated with AGP NPs showed weak fluorescent signals, indicating lower cell affinity. Compared with AGP NPs, the quantitative fluorescence intensity of cells treated with AGPF NPs was higher, as shown in Figure 4h, indicating that FA-modified NPs increased their affinity for tumor cells. This allows drugs to be more effectively delivered into cells, resulting in more effective cancer treatment. Therefore, AGPF NPs provide a promising approach for targeted cancer therapy.
Apoptosis, which can directly lead to tumor cell death, is an important assessment method to validate the efficacy of nanoparticle therapy for tumor treatment. As shown in Figure 4c, we validated the induction of apoptosis in tumor cells by photothermal therapy using AGPF NPs. Figure 4f shows that the apoptosis rate of U87 cells treated with AGPF NPs was 1.1% without laser irradiation, while under 808 nm laser irradiation, the apoptosis rates of U87 cells were 28.1%, 29.2%, and 32.7% with different concentrations of AGPF NPs. The apoptosis rate of cells increased with an increase in the concentration of AGPF NPs, indicating that AGPF NPs can effectively induce cell apoptosis under laser irradiation.
Hemolysis and Acute Toxicity Test
Since nanoparticles are used for in vivo studies, their biosafety needs to be evaluated. As shown in Figure S4, significant hemolysis was observed in the Triton X-100 treatment group. In contrast, no significant hemolysis was observed in the PBS group, PDA group, GdCl3 group, AQ4N group, and AGPF NPs group, with the solutions remaining clear. The hemolysis rates were 2.09%, 1.78%, 1.04%, 1.92%, and 1.16% respectively, indicating their suitability for in vivo studies. AGPF NPs demonstrated low hemolytic toxicity, suggesting good biocompatibility and a high safety profile for in vivo injection experiments in animals.
Acute toxicity testing and histopathological analysis were performed by intravenous injection of PBS, PDA, GdCl3, AQ4N, and AGPF NPs into healthy mice. The in vivo acute toxicity experiment showed that no deaths occurred in any of the groups within 14 days, with a survival rate of 100% (Figure S5), indicating a high safety profile for the use of AGPF NPs in tumor treatment. After the acute toxicity experiment, histopathological analysis of mouse tissues was conducted using H&E staining. The results (Figure S6) showed that tissue sections from all groups displayed no significant damage to the heart, liver, kidneys, spleen, and lung. This indicates that the AGPF NPs constructed in this study have high biological safety and can be further applied in in vivo tumor treatment. Additionally, blood biochemistry analysis was performed (Figures S7, and S8). The levels of various indicators in blood biochemistry were within the normal range, indicating minimal impact of AGPF NPs on the metabolism of the liver and kidneys. Thus, AGPF NPs exhibit good biological safety and can be utilized for in vivo therapy.
In vivo PA/MR Imaging of Orthotopic Gliomas
In order to achieve effective treatment of gliomas, it is important to monitor gliomas in vivo. We conducted an imaging performance investigation on the orthotopic glioma mice model. As shown in Figure 5a, 1h after intravenous injection of the same concentration of AGP NPs and AGPF NPs, we observed magnetic resonance signals at the tumor location, and the signal intensity of AGPF NPs was significantly higher than that of AGP NPs. With the increase in circulation time of nanoparticles, the signal intensity of AGPF NPs gradually increased, while the signal intensity of AGP NPs remained weak throughout the imaging period. Quantitative analysis of the grayscale values of MR images (Figure 5c) showed that the signal of AGPF NPs reached their peak at 3 hours, while the signal intensity of AGP NPs remained weak during the imaging period. This indicates that the modification with FA enables AGPF NPs to target tumors effectively. As shown in Figure 5b, after intravenous injection of AGP NPs and AGPF NPs at the same concentration, PA imaging was performed on the orthotopic glioma mice model. A photoacoustic signal at the tumor location was observed at 1 hour in the AGPF NPs group, and the signal persisted for 12 hours. Quantitative analysis (Figure 5d) showed that the signal reached its peak at 3 hours. In the AGP NPs group, the signal reached its peak at 3 hours as well, but compared to the AGPF NPs group, the signal was significantly weaker, further confirming the excellent targeting ability of AGPF NPs. Therefore, AGPF NPs can be considered as a promising PA/MR dual-mode imaging contrast agent.
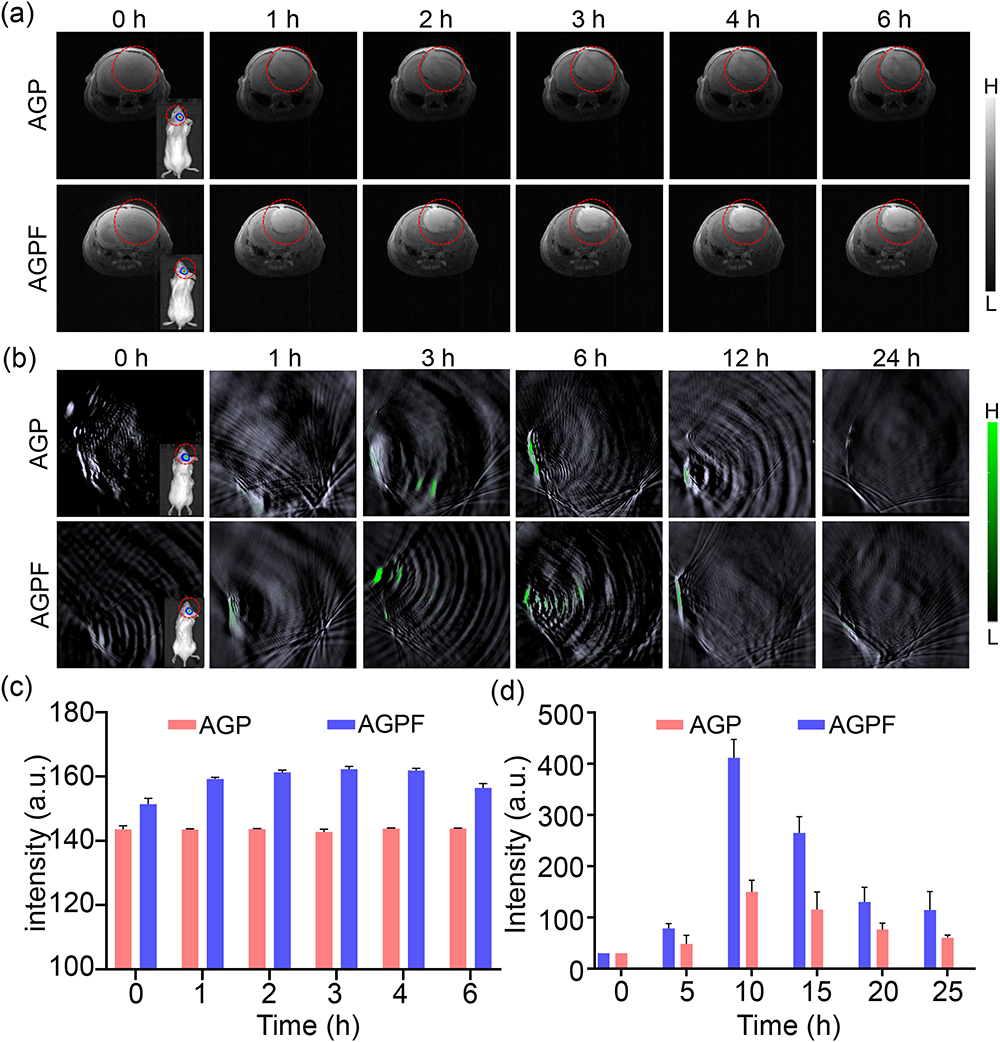 |
Figure 5 In vivo PA/MA imaging studies. (a) In vivo T1-weighted MR imaging post-intravenous injection of AGP NPs and AGPF NPs. (b) In vivo PA imaging post-intravenous injection of AGP NPs and AGPF NPs. (c) Quantitative analysis of the in vivo MR imaging intensity. (d) Quantitative analysis of the in vivo PA imaging intensity. |
In vivo Real-Time Hypoxia Monitoring
Real-time monitoring of tumor hypoxia can provide dynamic feedback for tumor treatment, which is helpful for the implementation of treatment strategies. As shown in Figure 6a, we established a subcutaneous glioma mice model. On the first day, PBS, AQ4N, and AGPF NPs were intravenously injected via the tail vein, followed by 808 nm laser irradiation 6 hours later. On the second day, PA imaging was performed to detect Hb and HbO2 levels (Figure 6b) and calculate the blood oxygen saturation (sO2). As shown in Figure 6c, Hb levels in the PBS group, AQ4N group, and laser irradiation group remained high, indicating that the tumor was consistently hypoxic. When AGPF NPs were injected without laser irradiation, Hb levels initially decreased and then increased, and there was a slight increase in HbO2 levels (Figure 6d), indicating a slight improvement in tumor oxygenation, which suggested that AGPF NPs alone can alleviate hypoxia to some extent; however, the effect is not strong, indicating that combined treatment with other therapies is needed to achieve therapeutic effects. In the AGPF NPs group under 808 nm laser irradiation, Hb levels gradually decreased over time, and HbO2 levels gradually increased. In contrast, HbO2 levels in the other groups remained almost unchanged, and the blood oxygen saturation (Figure 6e) showed a gradual increase, which was significantly higher than the other groups. This indicates that the hypoxic condition of the tumor was gradually alleviated by the photothermal therapy of AGPF NPs, confirming the strong photothermal effect of AGPF NPs and laying the foundation for subsequent tumor treatment experiments.
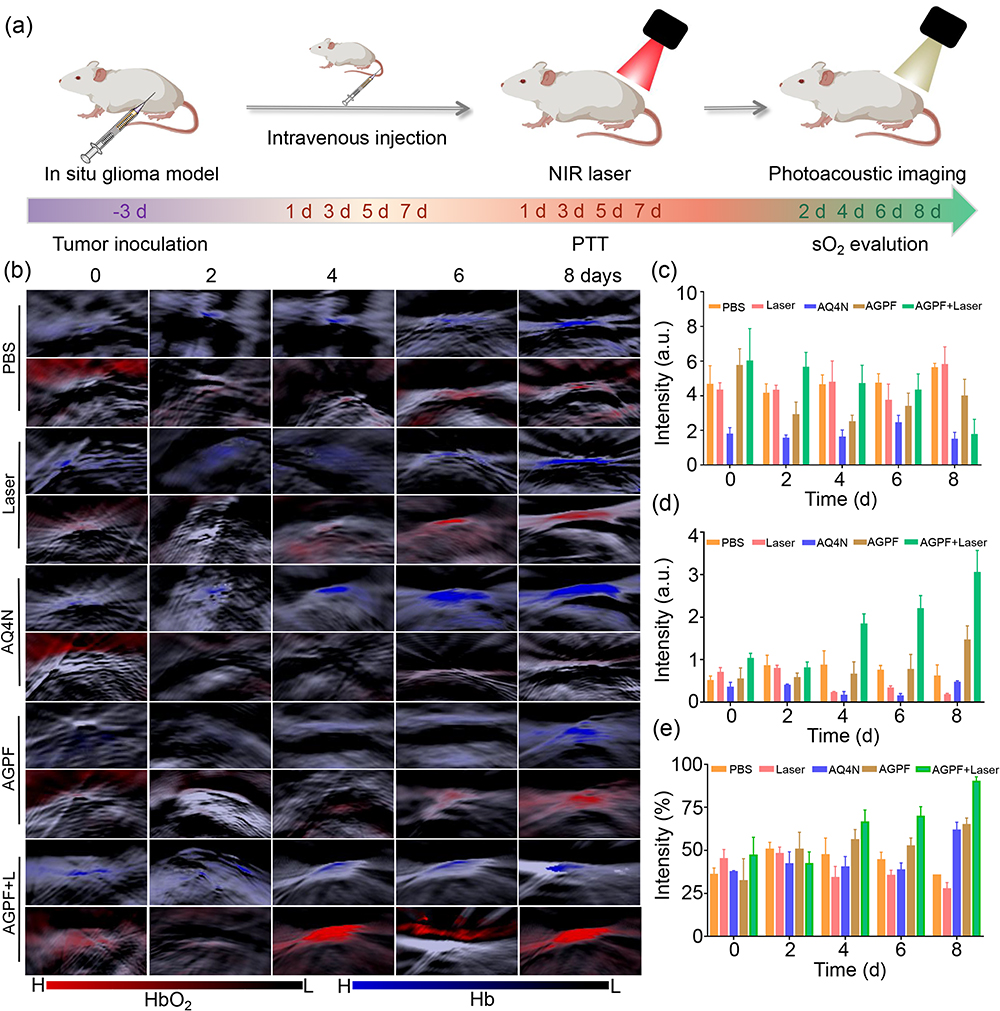 |
Figure 6 In vivo hypoxia detection of AGPF NPs. (a) Schematic diagram of hypoxia monitoring. (b) PA imaging of PBS, laser irradiation, AQ4N, AGPF NPs and laser irradiation AGPF NPs for 0–8 days. (c) Quantitative analysis of PA imaging intensity of Hb in vivo. (d) Quantitative analysis of PA imaging intensity of HbO2 in vivo. (e) Quantitative analysis of sO2 intensity. |
In vivo Synergistic Chemotherapy/PTT of AGPF NPs
In order to study the in vivo synergistic photothermal therapy (PTT) and chemotherapy anticancer effect of AGPF NPs, bioluminescence imaging was performed on mice to monitor tumor growth. The experimental protocol is shown in Figure 7a. To evaluate the in vivo antitumor effect of AGPF NPs in the orthotopic glioma mice model, mice were injected with PBS, AQ4N, and AGPF NPs through the tail vein and were irradiated with an 808 nm laser 6 hours later, with each cycle lasting three days. As shown in Figure 7b, tumors in the PBS group and the PBS+Laser group continued to grow, and the tumor signals were consistently stronger than those in other groups until the end of treatment, indicating that gliomas develop very rapidly and are difficult to control. The luminescence intensity of AGPF NPs and AGPF NPs groups under 808 nm laser irradiation was significantly lower than that of the other groups, especially the AGPF NPs group under laser irradiation, indicating that AGPF NPs displayed a good antitumor effect under laser irradiation, and particles could have a more effective photothermal therapy under the targeting effect of FA. The tumor inhibition rates of PBS+Laser, AGP, AGP+Laser, AGPF, and AGPF+Laser were 2.44%, 27.16%, 66.11%, 40.69%, and 81.03%, respectively, compared with the control group, and the tumor growth inhibition rates of AGPF, AGP+Laser, and AGPF+Laser groups were ≥40%, which had a dramatic anti-tumor effect. It is also evident from the tumor size of the mice at the end of treatment that AGPF NPs have some chemotherapeutic effect (Figure 7c), but the effect is much less than that of the combined photothermal treatment, confirming the necessity of chemotherapy combined with photothermal treatment that we used here. The quantified bioluminescent signals of mice in each group during treatment are shown in Figure 7e. The tumor signals of the PBS group and the laser group continued to increase, while the tumor signals of the AGP NPs group, AGP NPs+Laser group, and AGPF NPs group increased slowly. The bioluminescent signals of tumors in the AGPF NPs group remained at a low level, with significant differences compared to the control group (***P < 0.001), indicating that chemotherapy combined with photothermal therapy had a good effect. To evaluate the biological safety of the treatment, the weight of the tumor-bearing mice was monitored during treatment. The weight of the mice during treatment is shown in Figure 7d. The weight of the mice treated with AGP NPs and AGPF NPs under laser irradiation changed slightly, while the weight of the other groups decreased to a certain extent with the growth of tumors, indicating that the AGPF NP nanocarrier system has good biological safety and has a therapeutic effect. The pathological histological analysis of the heart, liver, spleen, lung, and kidneys of mice in each group after the treatment experiment was performed using the H&E staining method. The results are shown in Figure 8a, and the tissue sections of each treatment group showed no obvious damage to their heart, liver, kidneys, spleen, and lung, proving that AGPF NPs have good biological safety.
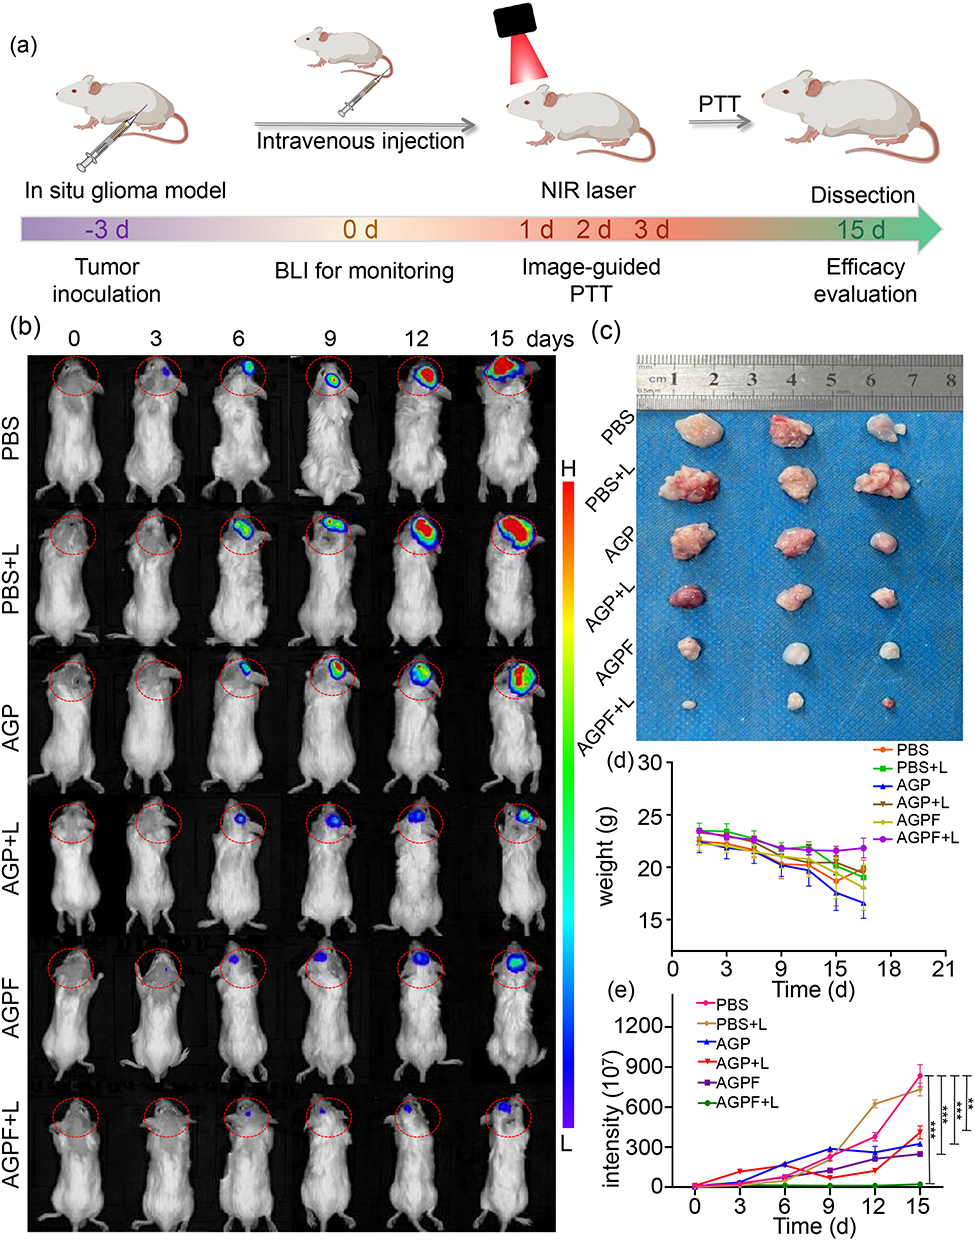 |
Figure 7 In vivo synergistic chemotherapy/PTT of AGPF NPs. (a) Scheme of combined chemotherapy/PTT strategy. (b) In vivo bioluminescence imaging of orthotopic glioblastoma model on day 0–15. (c) Images of tumors after dissection from treated mice. (d) Weight curves of the treated mice. (e) Quantitative analysis of the in vivo bioluminescence signal. P < 0.01 (**), P < 0.001 (***). |
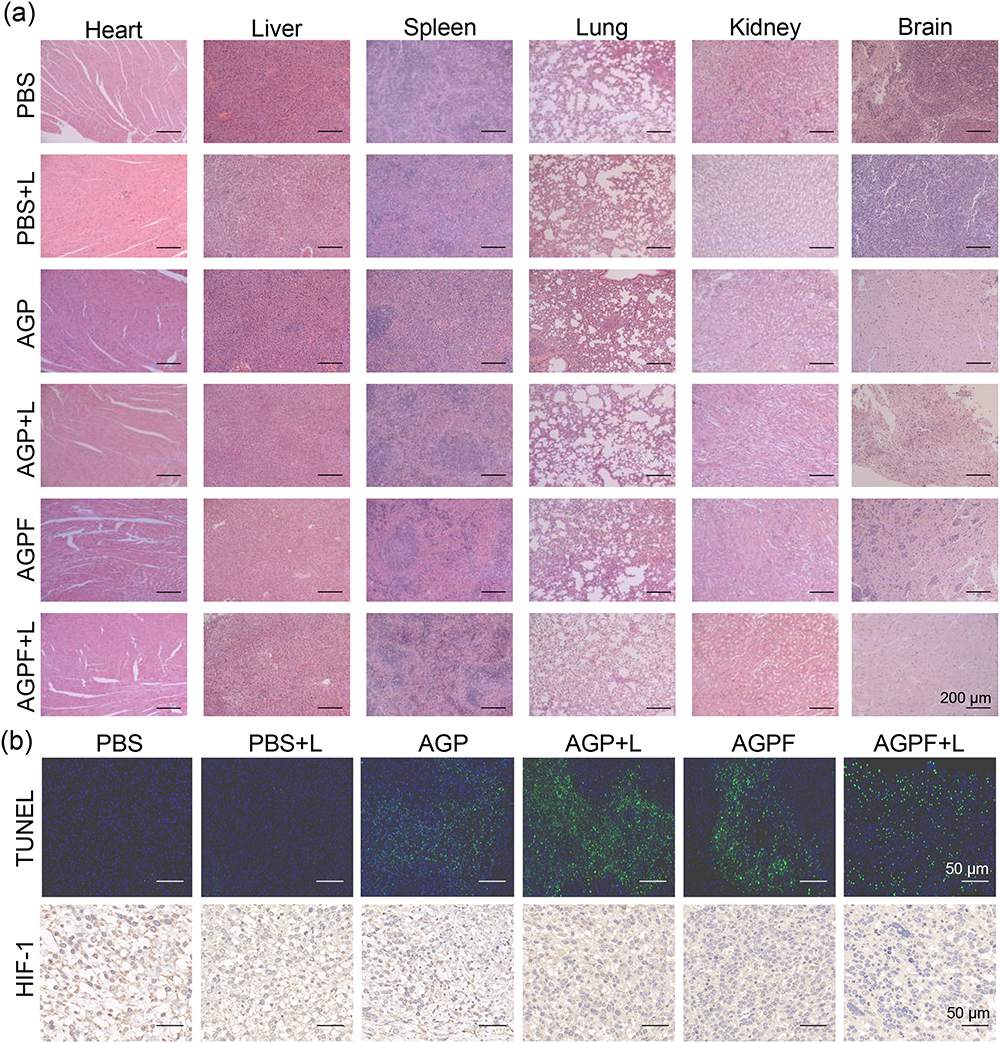 |
Figure 8 Histological analysis of excised tumor tissues from the treated mice. (a) H&E-stained sections of main organs from mice, scale bar = 200 μm. (b) Immunohistochemistry sections of HIF-1 and TUNEL stain images, scale bar = 50 μm. |
Image Analysis of Tissue Sections
TUNEL staining can be used for quantitative and locational analysis of the effect of AGPF NPs on inducing tumor cell apoptosis. We performed the TUNEL staining analysis on mouse tumor tissue after treatment to understand the mechanism of tumor treatment Fluorescent TUNEL staining of tumor paraffin sections as shown in Figure 8b. Nearly all the cell nuclei in the mouse tumor tissues in the PBS group and PBS+Laser group were stained with DAPI, and no obvious apoptosis was observed. The AGP NPs group showed some green fluorescent apoptotic regions, and the green fluorescent areas in the mouse tumor tissues of AGPF NPs and AGP NPs under laser irradiation gradually increased, with the degree of apoptosis gradually increasing. This indicates that AGPF NPs have a good in vivo anti-tumor effect and can maximize the promotion of tumor apoptosis. HIF-1 (hypoxia-inducible factor 1) is a transcription factor that plays a key role in cellular responses to low oxygen levels. The level of HIF-1 factor is commonly used to assess the hypoxic state of tumors. To understand the alleviation of tumor hypoxia by AGPF NPs, tumor HIF-1 analysis was performed. The HIF-1 immunohistochemical results are shown in Figure 8b. A large amount of brownish-yellow substance was present in the PBS group, indicating severe tumor hypoxia. The brownish-yellow substance in AGPF NPs and AGP NPs under laser irradiation was slightly reduced, and the brownish-yellow particles in AGPF NPs under laser irradiation were significantly reduced, indicating that AGPF NPs and AGP NPs under laser irradiation can alleviate tumor hypoxia. The effect of alleviating tumor hypoxia is most obvious in AGPF NPs under laser irradiation, indicating that the chemotherapy combined with photothermal therapy mediated by AGPF NPs can effectively alleviate tumor hypoxia.
Conclusion
In conclusion, we synthesized integrated diagnostic and therapeutic nanoparticles that can alleviate tumor hypoxia and provide real-time hypoxia monitoring. In vitro/in vivo near-infrared photothermal imaging confirmed excellent photothermal stability and performance of AGPF NPs, which rapidly increased the body temperature of tumor-bearing mice to 45.3°C. Confocal laser scanning microscopy fluorescence imaging studies demonstrated excellent cellular uptake of AGPF NPs, and in vivo PA/MR imaging showed that AGPF NPs accumulated well at the tumor site. Real-time monitoring of hypoxia status in vivo was achieved using the photoacoustic imaging capabilities of AGPF NPs, providing real-time feedback for in vivo treatment of gliomas. In vivo anti-tumor experiments showed that AGPF NPs could alleviate tumor hypoxia and effectively inhibit tumor growth through synergistic chemotherapy and photothermal therapy. In conclusion, AGPF NPs can accurately monitor the hypoxia status of gliomas, provide dynamic feedback on the in vivo therapeutic efficacy, and synergistically alleviate tumor hypoxia and significantly inhibit tumor growth by combining chemotherapy and photothermal therapy. Therefore, it is expected to be a potential therapeutic approach for the clinical treatment of gliomas.
Acknowledgments
This work was supported, in part, by the Medical Research Project of Jiangsu Provincial Health Commission (Grant No.M2022005), the Jiangsu Provincial Medical Key Discipline Cultivation Unit (JSDW202251), and Suqian Sci&Tech Program (Grant No.K202213).
Disclosure
The authors report no conflicts of interest in this work.
References
1. Dumas AA, Pomella N, Rosser G, et al. Microglia promote glioblastoma via mTOR-mediated immunosuppression of the tumour microenvironment. EMBO J. 2020;39(15):e103790. doi:10.15252/embj.2019103790
2. Carlsson SK, Brothers SP, Wahlestedt C. Emerging treatment strategies for glioblastoma multiforme. EMBO Mol Med. 2014;6(11):1359–1370. doi:10.15252/emmm.201302627
3. Batash R, Asna N, Schaffer P, et al. Glioblastoma multiforme, diagnosis and treatment; recent literature review. Curr Med Chem. 2017;24(27):3002–3009. doi:10.2174/0929867324666170516123206
4. McMahon DJ, Gleeson JP, O’Reilly S, et al. Management of newly diagnosed glioblastoma multiforme: current state of the art and emerging therapeutic approaches. Med Oncol. 2022;39(9):129. doi:10.1007/s12032-022-01708-w
5. Fan Y, Sun Y, Chang W, et al. Bioluminescence imaging and two-photon microscopy guided laser ablation of GBM decreases tumor burden. Theranostics. 2018;8(15):4072–4085. doi:10.7150/thno.25357
6. Dai X, Shao Y, Tian X, et al. Fusion between glioma stem cells and mesenchymal stem cells promotes malignant progression in 3D-bioprinted models. ACS Appl Mater Interfaces. 2022;14(31):35344–35356. doi:10.1021/acsami.2c06658
7. Yang J, Shi Z, Liu R, et al. Combined-therapeutic strategies synergistically potentiate glioblastoma multiforme treatment via nanotechnology. Theranostics. 2020;10(7):3223–3239. doi:10.7150/thno.40298
8. Dai XL, Ye L, Li HX, et al. Crosstalk between microglia and neural stem cells influences the relapse of glioblastoma in GBM immunological microenvironment. Clin Immunol. 2023;251:109333. doi:10.1016/j.clim.2023.109333
9. Saran F, Welsh L, James A, et al. Afatinib and radiotherapy, with or without temozolomide, in patients with newly diagnosed glioblastoma: results of a Phase I trial. J Neuro-oncol. 2021;155(3):307–317. doi:10.1007/s11060-021-03877-6
10. El-khayat SM, Arafat WO. Therapeutic strategies of recurrent glioblastoma and its molecular pathways ‘Lock up the beast’. Ecancermedicalscience. 2021;15:1176. doi:10.3332/ecancer.2021.1176
11. Nguyen H-M, Guz-Montgomery K, Lowe DB, et al. Pathogenetic features and current management of glioblastoma. Cancers. 2021;13(4):856. doi:10.3390/cancers13040856
12. Gote V, Nookala AR, Bolla PK, et al. Drug resistance in metastatic breast cancer: tumor targeted nanomedicine to the rescue. Int J Mol Sci. 2021;22(9):4673. doi:10.3390/ijms22094673
13. Li B, Jiang J, Assaraf YG, et al. Surmounting cancer drug resistance: new insights from the perspective of N6-methyladenosine RNA modification. Drug Resist Updates. 2020;53:100720. doi:10.1016/j.drup.2020.100720
14. Rani V, Deep G, Singh RK, Palle K, Yadav UCS. Oxidative stress and metabolic disorders: pathogenesis and therapeutic strategies. Life Sci. 2016;148:183–193. doi:10.1016/j.lfs.2016.02.002
15. Gammon L, Mackenzie IC. Roles of hypoxia, stem cells and epithelial–mesenchymal transition in the spread and treatment resistance of head and neck cancer. J Oral Pathol Med. 2015;45(2):77–82. doi:10.1111/jop.12327
16. Muzi M, Wolsztynski E, Fink JR, et al. Assessment of the prognostic value of radiomic features in 18F-FMISO PET imaging of hypoxia in postsurgery brain cancer patients: secondary analysis of imaging data from a single-center study and the multicenter ACRIN 6684 trial. Tomography. 2020;6(1):14–22. doi:10.18383/j.tom.2019.00023
17. Laurenti G, Benedetti E, D’Angelo B, et al. Hypoxia induces peroxisome proliferator-activated receptor α (PPARα) and lipid metabolism peroxisomal enzymes in human glioblastoma cells. J Cell Biochem. 2011;112(12):3891–3901. doi:10.1002/jcb.23323
18. Rashid M, Zadeh LR, Baradaran B, et al. Up-down regulation of HIF-1α in cancer progression. Gene. 2021;798:145796. doi:10.1016/j.gene.2021.145796
19. Qiu L-Y, Chen H-P, Yan Y-F, et al. Sasanquasaponin promotes cellular chloride efflux and elicits cardioprotection via the PKCε pathway. Mol Med Rep. 2016;13(4):3597–3603. doi:10.3892/mmr.2016.4984
20. Chen Z, Han F, Du Y, et al. Hypoxic microenvironment in cancer: molecular mechanisms and therapeutic interventions. Signal Transduct Target Ther. 2023;8(1):70. doi:10.1038/s41392-023-01332-8
21. Persano L, Pistollato F, Rampazzo E, et al. BMP2 sensitizes glioblastoma stem-like cells to Temozolomide by affecting HIF-1α stability and MGMT expression. Cell Death Dis. 2012;3(10):e412–e412. doi:10.1038/cddis.2012.153
22. Song L, Wang G, Hou X, et al. Biogenic nanobubbles for effective oxygen delivery and enhanced photodynamic therapy of cancer. Acta Biomater. 2020;108:313–325. doi:10.1016/j.actbio.2020.03.034
23. Zhang Z, Wang Z, Xiong Y, et al. A two-pronged strategy to alleviate tumor hypoxia and potentiate photodynamic therapy by mild hyperthermia. Biomater Sci. 2023;11(1):108–118. doi:10.1039/D2BM01691E
24. Du C, Wu X, He M, et al. Polymeric photothermal agents for cancer therapy: recent progress and clinical potential. J Mat Chem B. 2021;9(6):1478–1490. doi:10.1039/D0TB02659J
25. Chen Y, Meng W, Chen M, et al. Biotin-decorated hollow gold nanoshells for dual-modal imaging-guided NIR-II photothermal and radiosensitizing therapy toward breast cancer. J Mat Chem B. 2023;11(41):10003–10018. doi:10.1039/D3TB01736B
26. Liu D, Dai X, Zhang W, et al. Liquid exfoliation of ultrasmall zirconium carbide nanodots as a noninflammatory photothermal agent in the treatment of glioma. Biomaterials. 2023;292:121917. doi:10.1016/j.biomaterials.2022.121917
27. Zhao S, Yan L, Cao M, et al. Near-infrared light-triggered lysosome-targetable carbon dots for photothermal therapy of cancer. ACS Appl Mater Interfaces. 2021;13(45):53610–53617. doi:10.1021/acsami.1c15926
28. Zeng Y, Zhao L, Li K, et al. Aptamer-functionalized nanoplatforms overcoming temozolomide resistance in synergistic chemo/photothermal therapy through alleviating tumor hypoxia. Nano Res. 2023;16(7):9859–9872. doi:10.1007/s12274-023-5742-7
29. Tian B, Wang C, Du Y, et al. Near infrared-triggered theranostic nanoplatform with controlled release of HSP90 inhibitor for synergistic mild photothermal and enhanced nanocatalytic therapy with hypoxia relief. Small. 2022;18(28):2200786. doi:10.1002/smll.202200786
30. Zeng Y, Chang P, Ma J, et al. DNA origami–anthraquinone hybrid nanostructures for in vivo quantitative monitoring of the progression of tumor hypoxia affected by chemotherapy. ACS Appl Mater Interfaces. 2022;14(5):6387–6403. doi:10.1021/acsami.1c22620
31. Chen D, Wang W, Zhu Q, et al. In vivo real-time monitoring of the development of hypoxia and angiogenesis in cervical cancer. Chem Eng J. 2023;473:145498. doi:10.1016/j.cej.2023.145498
32. Zhu H, Huang C, Di J, et al. Doxorubicin-Fe(III)-Gossypol Infinite Coordination Polymer@PDA: CuO2 composite nanoparticles for cost-effective programmed photothermal-chemodynamic-coordinated dual drug chemotherapy trimodal synergistic tumor therapy. ACS Nano. 2023;17(13):12544–12562. doi:10.1021/acsnano.3c02401
33. Wang J, Liu L, You Q, et al. All-in-one theranostic nanoplatform based on hollow MoSx for photothermally-maneuvered oxygen self-enriched photodynamic therapy. Theranostics. 2018;8(4):955–971. doi:10.7150/thno.22325
34. Sun T, Li J, Zeng C, et al. Banoxantrone coordinated metal−organic framework for photoacoustic imaging-guided high intensity focused ultrasound therapy. Adv Healthc Mater. 2022;12(2):2202348. doi:10.1002/adhm.202202348
35. Feshitan JA, Vlachos F, Sirsi SR, et al. Theranostic Gd(III)-lipid microbubbles for MRI-guided focused ultrasound surgery. Biomaterials. 2012;33(1):247–255. doi:10.1016/j.biomaterials.2011.09.026
 © 2024 The Author(s). This work is published and licensed by Dove Medical Press Limited. The full terms of this license are available at https://www.dovepress.com/terms.php and incorporate the Creative Commons Attribution - Non Commercial (unported, v3.0) License.
By accessing the work you hereby accept the Terms. Non-commercial uses of the work are permitted without any further permission from Dove Medical Press Limited, provided the work is properly attributed. For permission for commercial use of this work, please see paragraphs 4.2 and 5 of our Terms.
© 2024 The Author(s). This work is published and licensed by Dove Medical Press Limited. The full terms of this license are available at https://www.dovepress.com/terms.php and incorporate the Creative Commons Attribution - Non Commercial (unported, v3.0) License.
By accessing the work you hereby accept the Terms. Non-commercial uses of the work are permitted without any further permission from Dove Medical Press Limited, provided the work is properly attributed. For permission for commercial use of this work, please see paragraphs 4.2 and 5 of our Terms.