")
Back to Journals » International Journal of Nanomedicine » Volume 17
Fluorophore Localization Determines the Results of Biodistribution of Core-Shell Nanocarriers
Authors Hinz A , Szczęch M , Szczepanowicz K , Bzowska M
Received 14 October 2021
Accepted for publication 16 December 2021
Published 8 February 2022 Volume 2022:17 Pages 577—588
DOI https://doi.org/10.2147/IJN.S343266
Checked for plagiarism Yes
Review by Single anonymous peer review
Peer reviewer comments 3
Editor who approved publication: Dr Farooq A. Shiekh
Alicja Hinz,1 Marta Szczęch,2 Krzysztof Szczepanowicz,2 Monika Bzowska1
1Department of Cell Biochemistry, Faculty of Biochemistry, Biophysics and Biotechnology, Jagiellonian University, Kraków, Poland; 2Jerzy Haber Institute of Catalysis and Surface Chemistry Polish Academy of Sciences, Kraków, Poland
Correspondence: Monika Bzowska
Department of Cell Biochemistry, Faculty of Biochemistry, Jagiellonian University in Kraków, Biophysics and Biotechnology, 7 Gronostajowa Street, Kraków, 30-387, Poland, Tel/Fax +48 12 664 63 88, Email [email protected]
Krzysztof Szczepanowicz
Jerzy Haber Institute of Catalysis and Surface Chemistry Polish Academy of Sciences, Niezapominajek 8 Street, Kraków, 30-239, Poland, Tel/Fax +48 12 639 51 21, Email [email protected]
Introduction: Biodistribution of nanocarriers with a structure consisting of core and shell is most often analyzed using methods based on labeling subsequent compartments of nanocarriers. This approach may have serious limitations due to the instability of such complex systems under in vivo conditions.
Methods: The core-shell polyelectrolyte nanocarriers were intravenously administered to healthy BALB/c mice with breast cancer. Next, biodistribution profiles and elimination routes were determined post mortem based on fluorescence measurements performed for isolated blood, tissue homogenates, collected urine, and feces.
Results: Despite the surface PEGylation with PLL-g-PEG, multilayer polyelectrolyte nanocarriers undergo rapid degradation after intravenous administration. This process releases the shell components but not free Rhodamine B. Elements of polyelectrolyte shells are removed by hepatobiliary and renal clearance.
Conclusion: Multilayer polyelectrolyte nanocarriers are prone to rapid degradation after intravenous administration. Fluorophore localization determines the obtained results of biodistribution and elimination routes of core-shell nanomaterials. Therefore, precise and reliable analysis of in vivo stability and biodistribution of nanomaterials composed of several compartments requires nanomaterials labeled within each compartment.
Keywords: in vivo studies, fluorescently labeled nanomaterials, stealth polymers, pharmacokinetics, routes of elimination, nanocarriers stability and degradation
Introduction
Evaluation of nanomaterial pharmacokinetics, biodistribution, and clearance is essential in preclinical studies of all nanomedicines, regardless of their route of administration and proposed use. Determining the half-life of nanoparticles in the serum, the degree of their accumulation in organs, and elimination routes allows predicting tissues exposed to the potentially toxic nanocarriers and verify nanoparticles retention in the diseased tissues. Moreover, the analysis of pharmacokinetics, especially in serum, provides indirect information on the stability of nanoparticles since the short half-life in serum often results from premature nanomaterial breakdown in the bloodstream immediately after administration.1
The pharmacokinetics and biodistribution of nanocarriers are determined primarily by their chemical structure, physical properties, the administration route, and the unique biological properties of tissues that, after administration, have direct contact with nanomaterials.2 For example, Enhance Permeability and Retention phenomenon (EPR) allows the accumulation of nanomaterials in these tumors characterized by blood vessels with increased permeability and reduced lymphatic drainage.3
Analysis of the nanomaterial retention in tissues or body fluids often involves measurements of the active agent concentration transported by the nanocarriers (eg anti-cancer drug).4 Another approach requires labeling nanomaterials with various isotopes, fluorophores, or metals. Pharmacokinetics and biodistribution are then determined using radiation or fluorescence measurements, magnetic resonance imaging, or computed tomography. To further complicate, the signal may be detected either intravitally or postmortem.5 In the case of intravital imaging, anesthesia is required, which may influence the results of pharmacokinetic analysis (anesthesia lowers, eg the cardiac index).6
The molecules employed for nanomaterial labeling are attached within the nanoparticle by covalent bonds, electrostatic interactions, or immobilized in the nanomaterial compartment to which they have increased affinity (eg hydrophilic molecules inside liposomes). Additionally, some nanocarriers are made of more than one compartment (eg core-shell nanoparticles); thus, the label may be located in a different part of the nanoparticle. Nanomaterials of this type can be made of organic and inorganic components, as exemplified by silica-coated core-shell nanoparticles.7 Such nanomaterials have unique multifunctional properties, but their structure makes it difficult to track the whole nanosystem.8
It should be noted that both the label type, the method of its attachment, and its location in the nanomaterial structure affect the obtained result of the biodistribution profile. For example, the observations published by Hirsjärvi et al indicate that, depending on the use of an isotopic or fluorescent dye, lipid nanocapsules’ biodistribution results are quantitatively divergent (fluorescent signal indicates a greater degree of accumulation in specific organs than the signal coming from an isotope).9 The Liu et al team confirmed this phenomenon using nanomaterials labeled with the Texas Red fluorescent dye or isotopes. Their studies demonstrated that fluorescently labeled nanocarriers were detected mainly in the tumor, while the use of an isotopic tracer indicated nanomaterial accumulation primarily in the spleen and liver.10 The main reasons for the discrepancy in the obtained biodistribution results are the fluorescent, absorbing, and scattering properties of tissues and body fluids.11,12 At the same time, there is no data in the literature that would address the problem of the label’s location or the selected method of its attachment to nanoparticles. This phenomenon makes it difficult to compare the biodistribution results obtained by different groups, even for the same type of nanoparticles.
Our previous studies concerned the synthesis, chemical, and biological characterization of core-shell polyelectrolyte nanocapsules produced by encapsulating nanoemulsion in polymeric shells formed of poly-
Materials and Methods
Preparation and Characterization of Core-Shell Polyelectrolyte Nanocarriers
Biocompatible polyelectrolytes used to prepare core-shell nanocarriers were: polycation poly-
The core-shell polyelectrolyte nanocarriers differing in the core composition and fluorophore localization were synthesized by encapsulating selected nanocores (nanoemulsion droplets, PCL nanoparticles, and polystyrene latex beads) in a polyelectrolyte multilayer shell. The preparation methods of nanoemulsion droplets and PCL nanoparticles have been described in detail in our previous reports. At the same time, polystyrene latex beads, as well as fluorescently labeled polystyrene latex beads, were commercially purchased.15,16 The multilayer shells were formed by the saturation technique of sequential adsorption of charged nanoobjects method called layer by layer.17 The procedure was as follows: a fixed volume of nanocores/nanocarriers was added to the oppositely charged polyelectrolyte solution during continuous mixing. The zeta potential measurements followed the multilayer shell formation. Then, the deposition of polyelectrolyte layers was repeated until a required number of layers in the multilayer shell was formed. The synthesized nanocarriers were characterized by measurements of their size, zeta potential, and concentration by Dynamic Light Scattering (DLS), Laser Doppler Electrophoresis (LDV), and Nanoparticle Tracking Analysis (NTA) techniques using Zetasizer Nano Series from Malvern Panalytical Instruments and NanoSight NS500 also Malvern Panalytical Instruments, respectively. The measurements were performed at 25°C in 0.9% NaCl.
Biodistribution Studies
Animals and Cells Used in Experiments
BALB/c female, six-week-old mice were purchased from the Center of Experimental Medicine of the Medical University of Białystok, Poland. Animals were housed under controlled conditions, 12–12h light–dark cycle, and provided with food and water ad libitum. According to Polish law, all animal procedures were performed specifically to the Act on the Protection of Animals used for Scientific or Educational Purposes (D20150266L), which implements the Directive of the European Parliament and the Council (2010/63/EU). Furthermore, the experimental protocols were in agreement with the guidelines of the Institutional Animal Care and Use Committee (IACUC) and had the approval of the 2nd Local Institutional Animal Care and Use Committee in Kraków, Institute of Pharmacology Polish Academy of Sciences in Krakow, Smetna 12, 31–343 Krakow.
4T1 cell line (murine mammary carcinoma that stably expresses a firefly luciferase) was purchased from Dr Gary Sahagian’s lab (Tufts University, Boston). The use of the cell line was approved by institutional research ethics committee (committee at the Faculty of Biochemistry, Biophysics and Biotechnology of Jagiellonian University).
Orthotopic Breast Cancer Model
4T1-luc cells were grown in 10 cm dishes at approximately 60% confluency (DMEM, 10% FBS, LONZA). The day before the experiment, BALB/c mice were weighed. Immediately before administration, cells were harvested with trypsin (LONZA) and rinsed once with 10 mL of PBS solution. 5×10⁵ viable cells resuspended in 50 µL of sterile PBS were administered to BALB/c mice orthotopically directly into the fourth mammary gland. The size of the resulting tumors was monitored by palpation or using a caliper every other day. The biodistribution experiments were carried out when the diameter of the tumors was approximately 7 mm.
Analysis of the Degree of Vascularization and the Amount of Extracellular Matrix of 4T1 Tumors
The isolated tumors were weighed, and 4-µm-thick tissue sections were obtained using a microtome (Thermo Scientific). Tissue sections were prepared using standard procedure, and Masson trichrome staining was performed using a commercially available kit according to the manufacturer’s recommendations (Sigma-Aldrich).18 The slides were mounted with a xylene-based reagent. After drying, the degree of vascularization and the extracellular matrix was observed under the Leica DM6B fluorescent microscope in a bright field.
Administration of Fluorescent Samples
To compare the biodistribution of free RhB, PLL-RhB, NC-RhB-PEG, PCL-RhB-PEG, LX(RED)-PEG, and LX-RhB-PEG, similar fluorescence intensity was confirmed for the set of samples (Figure S2 in the Supplementary Materials) used in subsequent experiments (fluorescence intensity was measured at 590 nm after excitation at 560 nm using Synergy H1 hybrid reader and analyzed with Gene5 Software, BIOTEK Instruments). Free RhB, PLL-RhB, or tested nanocarriers were injected into a tail vein of BALB/c mice (depending on the experiment, animals were healthy or had mammary gland tumors formed after injection of 4T1-luc cells). Immediately before dosing, the animals were weighed and then received 100 µL of free RhB, PLL-RhB, or nanocarrier suspension per 10 g of body weight. Mice were sacrificed 3, 30 minutes, or 24 hours after administration of the fluorescent samples. Control mice, whose organs and body fluids served as autofluorescence control, received 0.09% NaCl (100 µL per 10 g body weight). The number of animals in the experimental groups was n = 3. The fluorescence intensity of all samples was expressed in RFU (relative fluorescence unit).
Isolation of Bile, Serum, and Internal Organs for Biodistribution Analysis
Blood was collected from the heart and transferred to an Eppendorf tube after intraperitoneal administration of the ketamine/xylazine mixture (dose 50 mg/kg and 5 mg/kg) to mice. First, the tubes were centrifuged after observing the clot formed (800 × g, 10 minutes, RT). Next, the collected supernatant was centrifuged again (800 × g, 10 minutes, RT), and 100 µL of the obtained serum was transferred directly to the well of a black 96-well plate dedicated to fluorescence measurements. Next, the gallbladder was withdrawn with a needle and syringe. Then, internal organs such as the liver, spleen, kidneys, or tumors (formed after 4T1-luc cells were administered to the mammary gland) were isolated, weighed, and subjected to the homogenization process (described below). Next, the bile samples were diluted 100-fold in PBS buffer, and then 100 µL of the diluted solution was transferred to a black 96-well plate. All obtained tissue homogenates and body fluids (undiluted) were analyzed for fluorescence intensity immediately after collection.
Analysis of the Excretion Routes (Collection of Urine and Feces) of Polyelectrolyte Nanocarriers and Their Biodistribution Using Metabolic Cages
The animals were placed individually in metabolic cages (Tecniplast) to collect urine and feces at different times post the administration of nanocarriers. Urine or feces samples were collected approximately every 30 minutes to 10 hours after administration and after 14 hours (an overnight collection of urine and feces). The volume of collected urine and the weight of the feces were measured. Urine samples obtained at the individual measurement points (animals urinated spontaneously; therefore, the time points obtained vary from animal to animal) were transferred to a well of a 96-well black plate in a volume of 100 µL. After analyzing the fluorescence intensity, all urine samples from the intermediate points were collected in one Eppendorf tube. This urine sample corresponded to the amount of urine excreted by the mouse during the 24h after administering the fluorescent samples. The feces samples collected for 24 hours after weighing were incubated in PBS to dissolve them (100 µL was added per 0.1 g of feces) for 30 minutes at 37°C. The samples were vigorously mixed using a vortex shaker every 15 minutes. The feces suspensions were then centrifuged (1500 × g, 5 minutes, RT), and 100 µL of the supernatant was transferred to the well of a 96-well black plate. After analyzing the fluorescence intensity of samples collected at individual measurement points, all solutions were transferred to a fresh tube, obtaining a sample corresponding to the feces released by the mouse for 24 hours after the administration of nanocarriers. Mice transferred to metabolic cages were sacrificed 30 minutes or 24 hours after administration of nanocarriers’ solution or 0.09% NaCl. Then, the body fluids (blood and bile) and organs were isolated according to the procedure described above. In the case of biodistribution studies, the changes in collected samples’ RFU/g (the parameter corresponding to fluorescence intensity measured for isolated fluid or tissue homogenate and calculated taking into account weight of isolated fluid or tissue) at different times from the administration of nanocarriers were assessed. Then, to present the result of the 24-hour accumulation of nanocarriers, a parameter called “% of the detected dose” was introduced. The so-called “Total detected dose” summing the RFU/g values measured for all isolated tissues and body fluids obtained 3 minutes after administration of labeled nanocarriers (at that time, animals did not urinate, and the highest serum RFU/g was measured compared to other tissues). Obtained “Total detected dose” are presented in Table S1 (in the Supplementary Materials). The “% of detected dose” was calculated by dividing RFU/g (calculated after 24 h) by “Total detected dose” and multiplying by 100%.
Homogenization of Isolated Tissues
Immediately after isolating organs or tumors, the tissues were rinsed with PBS solution, weighed, and transferred to gentleMACS ™ M tubes (Miltenyi Biotec). Next, 1 mL of PBS solution was added per 0.1 g of tissue, and the isolated tissues were homogenized (using the gentleMACS ™ Dissociator device, the RNA_02.1 program). Finally, the obtained tissue homogenates (undiluted) were transferred to a black 96-well plate in a volume of 100 µL, and the fluorescence intensity was measured using a Synergy H1 microplate reader (BIOTEK Instruments).
Results
Synthesis and Characterization of Core-Shell Polyelectrolyte Nanocarriers
The core-shell polyelectrolyte nanocarriers were prepared by the formation of multilayer shells on various nanocores by sequential adsorption of charged nanoobjects with a method called layer by layer (LbL). For our investigation, three types of nanocores were chosen: nanoemulsion core formed by spontaneous emulsification method, the biodegradable polymeric core formed by spontaneous emulsification solvent evaporation method, and commercial non-biodegradable polystyrene latex nanoparticles. Polyelectrolyte multilayer shell was formed with the biocompatible polyelectrolytes poly-
Since our investigation focused on biodistribution, proper labeling techniques should be performed to visualize tested nanocarriers after iv administration. One of the simple and effective visualization methods is the optical method based on fluorescence; therefore, RhB as fluorescence dye was chosen for that purpose. There are two main ways of labeling (within shell or core) considering the structure of core-shell nanocarriers. The universality of the layer-by-layer method of forming a multilayer shell allows using fluorescently labeled polyelectrolyte to form fluorescently labeled core-shell nanocarriers. For that preparation, fluorescently labeled polycation (PLL-RhB) was used instead of the PLL layer (Figure S1 in the Supplementary Materials). Such an approach was applied to form multilayer shells on nanoemulsion core, biodegradable polymeric core, and non-biodegradable polystyrene latex nanoparticles.
On the other hand, core of such nanocarriers can also be fluorescently labeled; therefore, commercially available non-biodegradable fluorescently (RED) labeled polystyrene latex nanoparticles were used. The synthesized core-shell nanocarriers were characterized by measurements of their size, concentration, and zeta potential, as summarized in Table 1. We confirmed that the sizes of all synthesized nanocarriers were comparable, approximately 100 to 140 nm, while zeta potential ranges from +3 mV to +9 mV.
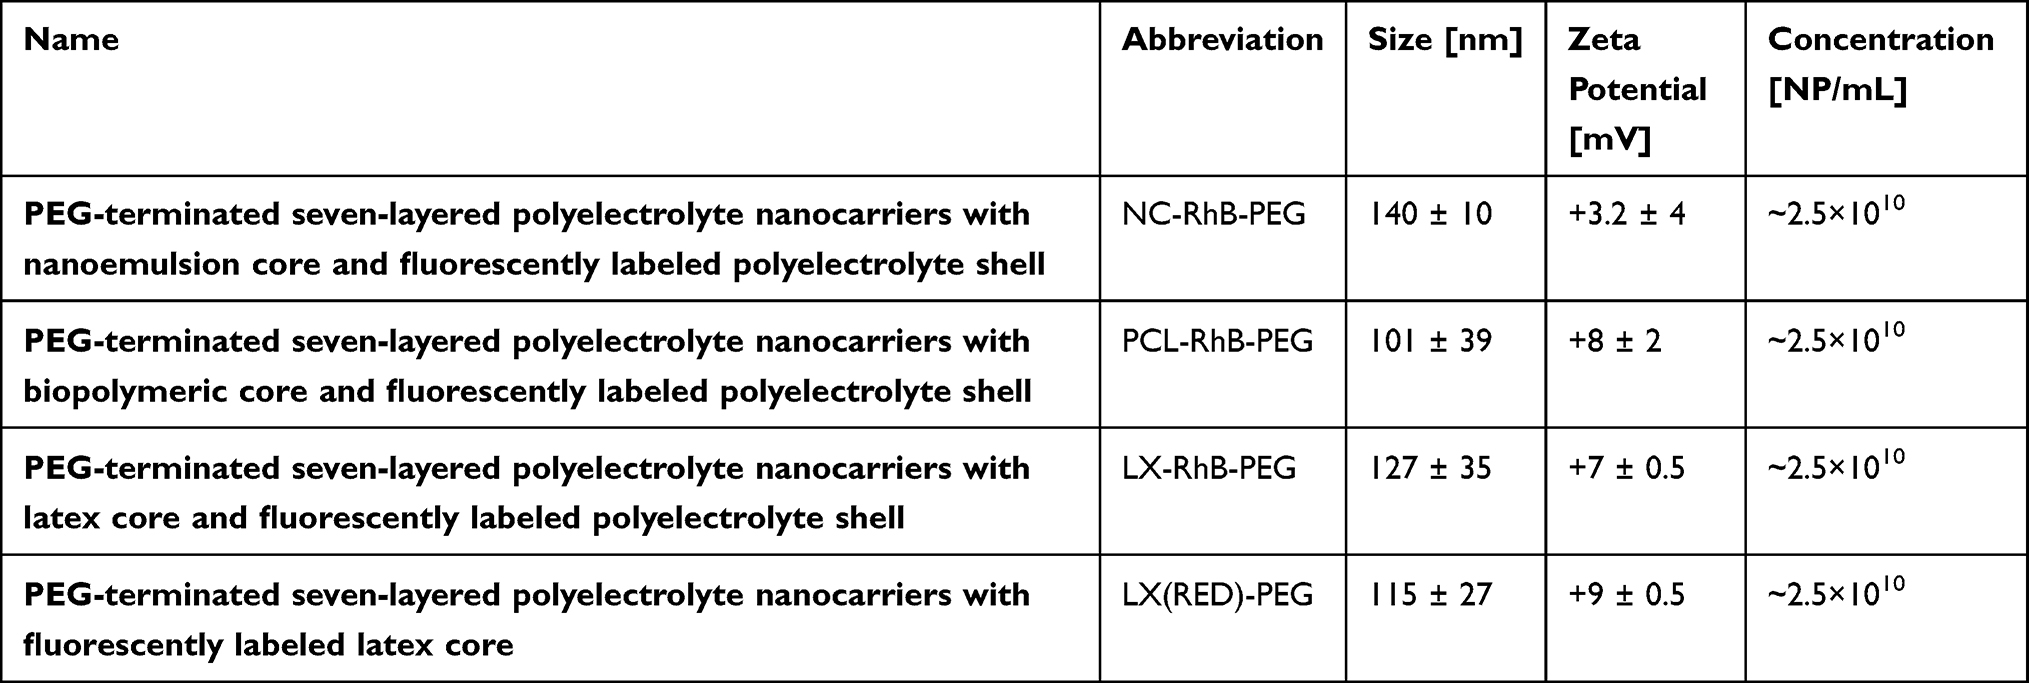 |
Table 1 Characterization of Tested Nanocarriers |
Biodistribution of Core-Shell Polyelectrolyte Nanocarriers
Our previous results showed intravenously injected polyelectrolyte multilayer nanocarriers with an external layer formed with poly poly-
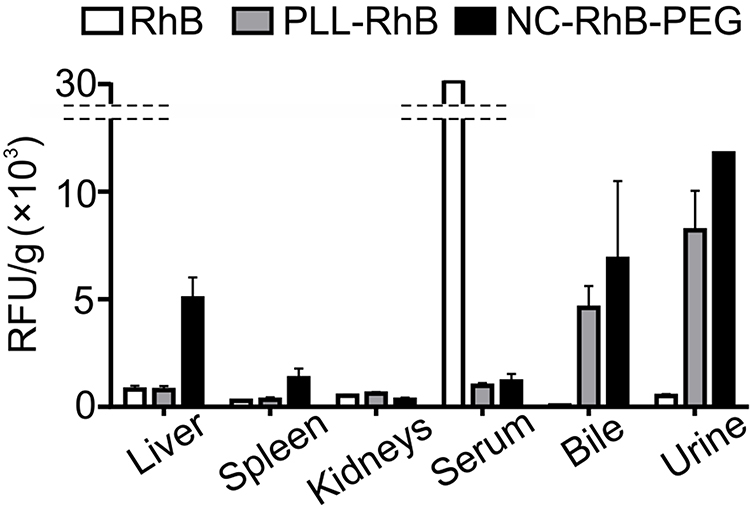 |
Figure 1 Biodistribution of core-shell polyelectrolyte nanocarriers and fluorescent products of their degradation. Abbreviation: RFU/g, the parameter corresponding to fluorescence intensity measured for isolated fluid or tissue homogenate and calculated taking into account weight of isolated fluid or tissue. Notes: BALB/c mice were injected with free Rhodamine B (RhB), poly- |
Next, we analyzed the biodistribution of core-shell nanocarriers differing in the core composition and labeling fluorophore localization. We used core-shell nanocarriers with biodegradable liquid core (NC-RhB-PEG), biodegradable solid core (PCL-RhB-PEG), and non-biodegradable solid polystyrene latex cores. Additionally, two types of non-biodegradable latex-based nanocarriers were tested: 1) as in previous experiments, with labeled multilayer shell (after incorporation of PLL-RhB) - LX-RhB-PEG or 2) within the labeled core - LX(RED)-PEG. We used mice with the 4T1-luc tumor, which enabled determining the accumulation of nanocarriers in neoplastic tissue. It is crucial in the context of using tested nanocarriers as an anti-cancer drug delivery system. Preliminary to biodistribution analysis, we characterized the architecture of neoplastic tissue formed seven days after orthotopic injection of 4T1-luc cells. As shown in Figure S3, a blood vessel network has already formed in the tumor, which should facilitate nanocarrier retention based on the EPR phenomenon. In addition, we observed densely arranged cancer cells and many collagen fibers in the extracellular matrix what may be an obstacle to nanocarriers’ penetration into the deeper area of the tumor (Figure S3 in the Supplementary Materials). We observed that the biodistribution profiles and elimination routes of NC-RhB-PEG, PCL-RhB-PEG, and LX-RhB-PEG were similar (Figures 2 and 3). However, the initial fluorescence of LX-RhB-PEG compared to NC-RhB-PEG and PCL-RhB-PEG was four times lower (Figure S2 in the Supplementary Materials); therefore, we could not provide a quantitative comparison between these experimental groups. As shown in Figures 2A and 3A, the highest nanocarrier accumulation was observed in the liver (~10% of the detected dose for NC-RhB-PEG and PCL-RhB-PEG or ~3% for LX-RhB-PEG) and lower in the spleen and kidneys (between ~3–0.8% for NC-RhB-PEG, PCL-RhB-PEG, and LX-RhB-PEG). In addition, most of the tested nanocarriers (NC-RhB-PEG, PCL-RhB-PEG, and LX-RhB-PEG) or their degradation products are excreted in the feces (~15–26% of the detected dose) or the urine (~4–9% of the detected dose). Moreover, the highest observed dose of these types of nanocarriers is removed with the feces about 4 hours after administration or to a lesser extent with the first spontaneously excreted urine (most often between 30–60 minutes) (Figures 2B and C and 3B and C). Finally, we observed that NC-RhB-PEG, PCL-RhB-PEG, and LX-RhB-PEG or their degradation products accumulate in the tumor at less than 1% of the detected dose (Figures 2A and 3A). In contrast to core-shell nanocarriers labeled by incorporation of PLL-RhB into multilayer shell LX(RED)-PEG nanocarriers with fluorescently labeled polystyrene latex core show different biodistribution profiles and elimination routes. We observed that after iv injection, LX(RED)-PEG nanocarriers accumulated in the liver (80% of the detected dose), then in the spleen (approximately 16% of the detected dose) and kidneys (about 2% of the detected dose) (Figure 3A). Additionally, LX(RED)-PEG was not excreted in the feces or urine within 24 hours of their intravenous administration (Figure 3B and C). However, despite such significant differences in biodistribution in healthy tissues, the observation of the fluorescence intensity from the LX(RED)-PEG showed a similar degree of accumulation in the tumor (approximately 1.5% of the detected dose) compared to the nanocarriers labeled within the shell (NC-RhB-PEG, PCL-RhB-PEG, and LX-RhB-PEG).
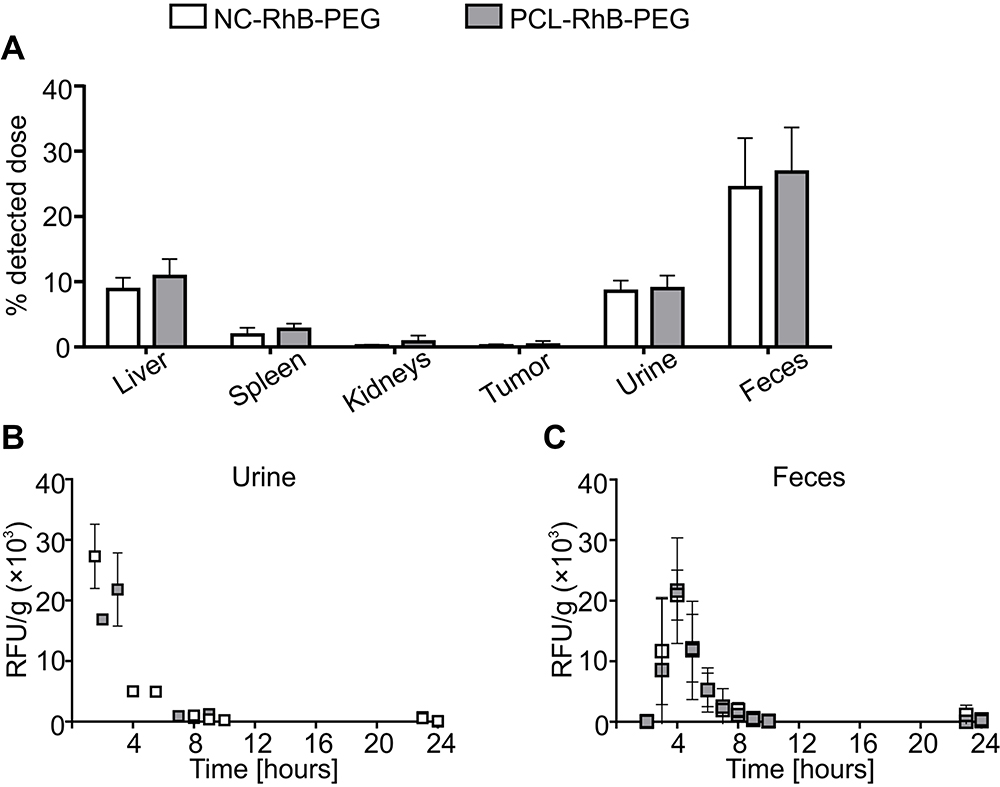 |
Figure 2 Biodistribution profiles and elimination routes of polyelectrolytes nanocarriers with the different core structure. Abbreviation: RFU/g, the parameter corresponding to fluorescence intensity measured for isolated fluid or tissue homogenate and calculated taking into account weight of isolated fluid or tissue. Notes: Tumor-bearing BALB/c mice were injected with PEG-terminated polyelectrolyte nanocarriers with liquid core (NC-RhB-PEG) or PEG-terminated polyelectrolyte nanocarriers with solid polycaprolactone core (PCL-RhB-PEG) with fluorescently labeled shell. (A) Mice were sacrificed 24 hours after administration, and serum, homogenates of liver, spleen, kidney, and tumor were obtained. The detected dose parameter was calculated (see Methods). Before the euthanasia, animals were then placed in metabolic cages, and (B) urine or (C) feces were collected over 24 hours. The samples were analyzed for the fluorescence intensity at λ 560/590 nm. Bars or points represent the mean ± SD (n = 3). |
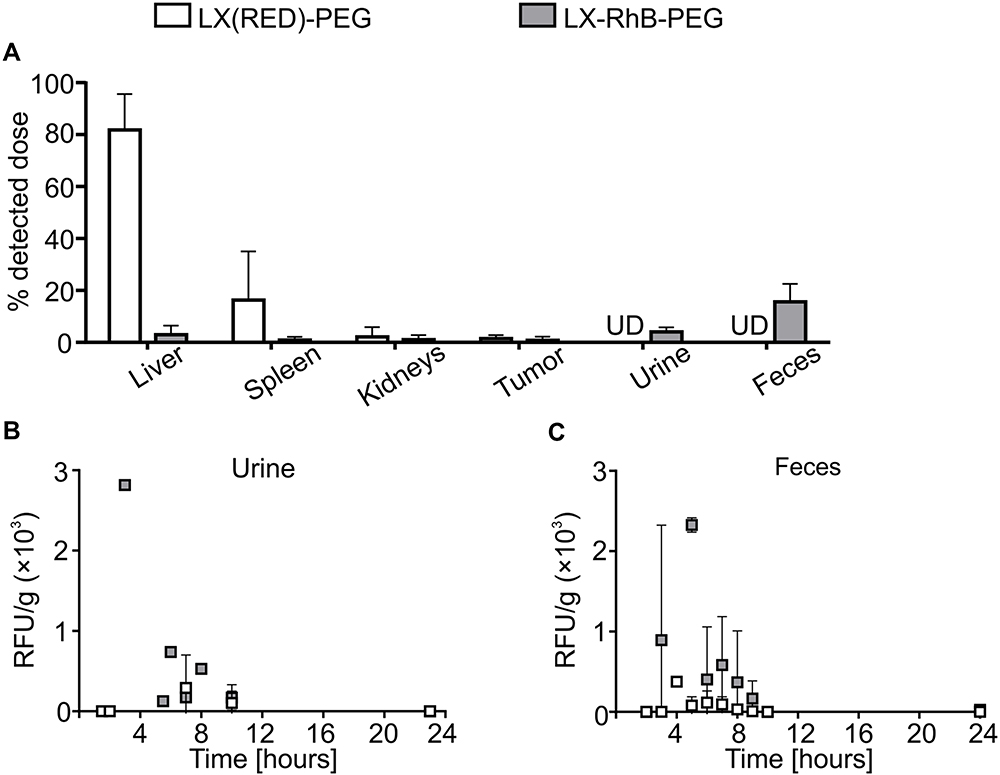 |
Figure 3 Biodistribution profiles and elimination routes of differently labeled latex-based nanocarriers. Abbreviations: RFU/g, the parameter corresponding to fluorescence intensity measured for isolated fluid or tissue homogenate and calculated taking into account weight of isolated fluid or tissue; UD, under the detection limit. Notes: Tumor-bearing BALB/c mice were injected with PEG-terminated polyelectrolyte latex nanocarriers fluorescently labeled in core (LX(RED)-PEG) or shell (LX-RhB-PEG). (A) Mice were sacrificed 24 hours after administration, and serum, homogenates of liver, spleen, kidney, and tumor were obtained. The detected dose parameter was calculated (see Methods). Before the euthanasia, animals were then placed in metabolic cages, and (B) urine or (C) feces were collected over 24 hours. The samples were analyzed for the fluorescence intensity at λ 560/590 nm. Bars or points represent the mean ± SD (n = 3). |
Discussion
Here, we were focused on the biodistribution study of core-shell polyelectrolyte nanocarriers. Proper labeling techniques have to be performed to visualize tested nanocarriers after iv administration for that type of investigation. Among various modalities/techniques, one of the simple, safe, and effective is the optical method based on fluorescence. Background autofluorescence is a major issue for the bio-imaging of cells and tissues.11,21 The natural emission of light by molecules can interfere with detecting fluorescently labeled nanocarriers. Red or even NIR fluorescence is generally preferred for in vivo imaging; to address the problem of autofluorescence in bio-imaging; therefore, RhB as fluorescence dye was chosen for that purpose. There are two main places of labeling: core or/and shell, considering the structure of core-shell polyelectrolyte nanocarriers. The layer by layer (LbL) method allows using synthesized RhB-labeled poly-
Our results show no correlation between the biodistribution of core-shell polyelectrolyte nanocarriers and their core structure (liquid or solid). Similar results indicating no effect of core stiffness on the biodistribution of nanocarriers were presented for different PEGylated core-shell nanoparticles.30 On the contrary, Guo et al showed that nanolipogels with a lower Young’s modulus (softer nanoparticles) accumulate better in the tumor than harder nanoparticles. The authors explain that cancer cells can internalize soft nanoparticles by endocytosis and fusion with the cell membrane, while hard nanoparticles only by endocytosis. Consequently, in total more soft nanoparticles are taken up by neoplastic cells.31 However, the results of our experiments provided precise information only about the biodistribution of nanoparticles’ outer shell or their degradation product, not about the biodistribution of whole nanocarriers or the core in particular. Therefore, we further examined the influence of the fluorophore location within the same core-shell nanoparticles on the biodistribution and routes of nanoparticles’ exertion. We used non-biodegradable polystyrene latex nanoparticles with a polyelectrolyte shell that have been labeled in the core (LX(RED)-PEG) or as previously in the shell (LX-RhB-PEG). The obtained results show that different conclusions could be drawn from the conducted analyses depending on the fluorophore location. Thus, the core and shell undergo other processes after in vivo administration. We confirmed that the component excreted with urine and faces comes from the fluorescently labeled shell. At the same time, the core of nanocarriers strongly accumulates in the liver and to a lesser extent in the spleen (about 80% - in the liver and 16% of detected dose - in the spleen). Our results indicate that in core-shell polyelectrolyte nanocarriers (obtained by the LbL method), the multilayer shell formed with biodegradable polyelectrolytes PLL-RhB and PGA and PLL-g-PEG is detached/degraded and then removed from the body. However, it is challenging to conclude where this phenomenon occurs – in the bloodstream or the cells of individual tissues and how many polyelectrolyte layers are disassembled. It is worth mentioning that despite the use of stealth polymer, LX(RED)-PEG strongly accumulates in the liver (80% of the detected dose). Stolnik et al also observed no effect of PEGylation on the biodistribution of polystyrene nanospheres.32 However, we postulate that the PEG is detached from the outer polyelectrolyte shell and could no longer function as a stealth polymer. Consequently, eg Kupffer cells can readily recognize and internalized injected nanocarriers. This hypothesis is also supported by the poor tumor accumulation of all tasted nanocarriers. The integrity of nanoparticles after intravenous administration to mice was also discussed in terms of PEGylated liposomes. Plassat et al investigated the biodistribution of liposomes labeled with Rhodamine B within the lipid bilayer. Magnetic nanoparticles were enclosed within these liposomes; thus, the integrity of the nanosystem was confirmed by the collocation of fluorescence and magnetic resonance signals. The authors observed whole nanoparticles in the serum, as well as in the examined tissues.33 Considering all performed experiments with various types of core-shell polyelectrolyte nanocarriers with biodegradable liquid or polymeric core and non-biodegradable polystyrene latex core, obtained results indicate that after intravenous administration, the core-shell polyelectrolyte nanocarriers are disintegrated through the degradation of the polyelectrolyte shell. Therefore, on this basis, it is impossible to conclude the location of the all components of tested nanocarriers.
Conclusion
Fluorophore localization determines the results of biodistribution and elimination routes of core-shell nanocarriers. Therefore, labeling only one component of complex core-shell nanocarriers allows predicting biodistribution of this component but not the whole nanocarrier. Precise and reliable analysis of in vivo stability and biodistribution of nanomaterials composed of several compartments requires nanomaterials labeled within each compartment.
Acknowledgments
In addition, this work was supported by the Diamond Grant number 0014/DIA/2014/43 to AH, funded by the Polish Ministry of Science and Higher Education and by the statutory research fund of ICSC PAS.
Disclosure
The authors report no conflicts of interest in this work.
References
1. Maeda H, Bharate GY, Daruwalla J. Polymeric drugs for efficient tumor-targeted drug delivery based on EPR-effect. Eur J Pharm Biopharm. 2009;71(3):409–419. doi:10.1016/j.ejpb.2008.11.010
2. Blanco E, Shen H, Ferrari M. Principles of nanoparticle design for overcoming biological barriers to drug delivery. Nat Biotechnol. 2015;33(9):941–951. doi:10.1038/nbt.3330
3. Prabhakar U, Maeda H, Jain K, et al. Challenges and key considerations of the enhanced permeability and retention effect for nanomedicine drug delivery in oncology. Cancer Res. 2013;73(8):2412–2417. doi:10.1158/0008-5472.CAN-12-4561
4. Rafiei P, Haddadi A. Docetaxel-loaded PLGA and PLGA-PEG nanoparticles for intravenous application: pharmacokinetics and biodistribution profile. Int J Nanomedicine. 2017;12:935–947. doi:10.2147/IJN.S121881
5. Seo HJ, Nam SH, Im H-J, et al. Rapid hepatobiliary excretion of micelle-encapsulated/radiolabeled upconverting nanoparticles as an integrated form. Sci Rep. 2015;5(1):15685. doi:10.1038/srep15685
6. Janssen BJA, De Celle T, Debets JJM, Brouns AE, Callahan MF, Smith TL. Effects of anesthetics on systemic hemodynamics in mice. Am J Physiol Heart Circ Physiol. 2004;287(4):1618–1624. doi:10.1152/ajpheart.01192.2003
7. Lv R, Yang P, Chen G, Gai S, Xu J, Prasad PN. Dopamine-mediated photothermal theranostics combined with up-conversion platform under near infrared light. Sci Rep. 2017;7(1):1–13. doi:10.1038/s41598-017-13284-5
8. Karabasz A, Bzowska M, Szczepanowicz K. Biomedical applications of multifunctional polymeric nanocarriers: a review of current literature. Int J Nanomedicine. 2020;15:8673–8696. doi:10.2147/IJN.S231477
9. Hirsjärvi S, Sancey L, Dufort S, et al. Effect of particle size on the biodistribution of lipid nanocapsules: comparison between nuclear and fluorescence imaging and counting. Int J Pharm. 2013;453:594–600. doi:10.1016/j.ijpharm.2013.05.057
10. Liu Y, Tseng Y, Huang L. Biodistribution studies of nanoparticles using fluorescence. Pharm Res. 2013;29(12):3273–3277. doi:10.1007/s11095-012-0818-1
11. Roy M, Wilson BC. An accurate homogenized tissue phantom for broad spectrum autofluorescence studies: a tool for optimizing quantum dot-based contrast agents. In: Nordstrom RJ, editor. Design and Performance Validation of Phantoms Used in Conjunction with Optical Measurements of Tissue. Vol. 6870. SPIE; 2008:68700E. doi:10.1117/12.764639
12. Whittington NC, Wray S. Suppression of red blood cell autofluorescence for immunocytochemistry on fixed embryonic mouse tissue. Curr Protoc Neurosci. 2017;81(1):
13. Karabasz A, Szczepanowicz K, Cierniak A, et al. In vivo studies on pharmacokinetics, toxicity and immunogenicity of polyelectrolyte nanocapsules functionalized with two different polymers: poly-L-glutamic acid or PEG. Int J Nanomedicine. 2019;14:9587–9602. doi:10.2147/IJN.S230865
14. Hermanson GT. Bioconjugate Techniques. Elsevier Academic Press; 2008.
15. Szczepanowicz K, Hoel HJ, Szyk-Warszynska L, et al. Formation of biocompatible nanocapsules with emulsion core and pegylated shell by polyelectrolyte multilayer adsorption. Langmuir. 2010;26(15):12592–12597. doi:10.1021/la102061s
16. Szczęch M, Szczepanowicz K. Polymeric core-shell nanoparticles prepared by spontaneous emulsification solvent evaporation and functionalized by the layer-by-layer method. Nanomaterials. 2020;10(3):496. doi:10.3390/nano10030496
17. Sukhorukov GB, Donath E, Lichtenfeld H, et al. Layer-by-layer self assembly of polyelectrolytes on colloidal particles. Colloids Surf a Physicochem Eng Asp. 1998;137(1–3):253–266. doi:10.1016/S0927-7757(98)00213-1
18. Berry R, Church CD, Gericke MT, Jeffery E, Colman L, Rodeheffer MS. Imaging of adipose tissue. In: Methods in Enzymology. Vol. 537. Academic Press Inc.;2014:47–73. doi:10.1016/B978-0-12-411619-1.00004-5
19. Szczepanowicz K, Bzowska M, Kruk T, Karabasz A, Bereta J, Warszynski P. Pegylated polyelectrolyte nanoparticles containing paclitaxel as a promising candidate for drug carriers for passive targeting. Colloids Surf B Biointerfaces. 2016;143:463–471. doi:10.1016/j.colsurfb.2016.03.064
20. Karabasz A, Szczepanowicz K, Cierniak A, Bereta J, Bzowska M. In vitro toxicity studies of biodegradable, polyelectrolyte nanocapsules. Int J Nanomedicine. 2018;13:5159–5172. doi:10.2147/IJN.S169120
21. Cordina NM, Sayyadi N, Parker LM, Everest-Dass A, Brown LJ, Packer NH. Reduced background autofluorescence for cell imaging using nanodiamonds and lanthanide chelates. Sci Rep. 2018;8(1):1–14. doi:10.1038/s41598-018-22702-1
22. Lukasiewicz S, Szczepanowicz KP, Blasiak E, Dziedzicka-Wasylewska M. Biocompatible polymeric nanoparticles as promising candidates for drug delivery. Langmuir. 2015;31(23):64156425. doi:10.1021/acs.langmuir.5b01226
23. Polomska A, Gauthier MA, Leroux J-C. In vitro and in vivo evaluation of PEGylated layer-by-layer polyelectrolyte-coated paclitaxel nanocrystals. Small. 2017;13(2):1602066. doi:10.1002/smll.201602066
24. Cardoso MJ, Caridade SG, Costa RR, Mano JF. Enzymatic degradation of polysaccharide-based layer-by-layer structures. Biomacromolecules. 2016;17(4):1347–1357. doi:10.1021/ACS.BIOMAC.5B01742
25. Johnston TP, Kuchimanchi KR, Alur H, Chittchang M, Mitra AK. Inducing a change in the pharmacokinetics and biodistribution of poly-l-lysine in rats by complexation with heparin. J Pharm Pharmacol. 2003;55(8):1083–1090. doi:10.1211/0022357021530
26. Mahadevan K, Patthipati VS, Han S, et al. Highly fluorescent resorcinarene cavitand nanocapsules with efficient renal clearance. Nanotechnology. 2016;27(33):335101. doi:10.1088/0957-4484/27/33/335101
27. Hirsjärvi S, Belloche C, Hindré F, Garcion E, Benoit JP. Tumour targeting of lipid nanocapsules grafted with cRGD peptides. Eur J Pharm Biopharm. 2014;87(1):152–159. doi:10.1016/j.ejpb.2013.12.006
28. Li L, Song L, Yang X, et al. Multifunctional “core-shell” nanoparticles-based gene delivery for treatment of aggressive melanoma. Biomaterials. 2016;111:124–137. doi:10.1016/j.biomaterials.2016.09.019
29. Cun X, Ruan S, Chen J, et al. A dual strategy to improve the penetration and treatment of breast cancer by combining shrinking nanoparticles with collagen depletion by losartan. Acta Biomater. 2016;31:186–196. doi:10.1016/j.actbio.2015.12.002
30. Sun X, Rossin R, Turner JL, et al. An assessment of the effects of shell cross-linked nanoparticle size, core composition, and surface PEGylation on in vivo biodistribution. Biomacromolecules. 2005;6(5):2541–2554. doi:10.1021/bm050260e
31. Guo P, Liu D, Subramanyam K, et al. Nanoparticle elasticity directs tumor uptake. Nat Commun. 2018;9(1):1–9. doi:10.1038/s41467-017-02588-9
32. Stolnik S, Dunn SE, Garnett MC, et al. Surface modification of poly(lactide-co-glycolide) nanospheres by biodegradable poly(lactide)-poly(ethylene glycol) copolymers. Pharm Res. 1994;11(12):1800–1808. doi:10.1023/A:1018931820564
33. Plassat V, Martina MS, Barratt G, Ménager C, Lesieur S. Sterically stabilized superparamagnetic liposomes for MR imaging and cancer therapy: pharmacokinetics and biodistribution. Int J Pharm. 2007;344(1–2):118–127. doi:10.1016/j.ijpharm.2007.05.018
 © 2022 The Author(s). This work is published and licensed by Dove Medical Press Limited. The
full terms of this license are available at https://www.dovepress.com/terms.php
and incorporate the Creative Commons Attribution
- Non Commercial (unported, v3.0) License.
By accessing the work you hereby accept the Terms. Non-commercial uses of the work are permitted
without any further permission from Dove Medical Press Limited, provided the work is properly
attributed. For permission for commercial use of this work, please see paragraphs 4.2 and 5 of our Terms.
© 2022 The Author(s). This work is published and licensed by Dove Medical Press Limited. The
full terms of this license are available at https://www.dovepress.com/terms.php
and incorporate the Creative Commons Attribution
- Non Commercial (unported, v3.0) License.
By accessing the work you hereby accept the Terms. Non-commercial uses of the work are permitted
without any further permission from Dove Medical Press Limited, provided the work is properly
attributed. For permission for commercial use of this work, please see paragraphs 4.2 and 5 of our Terms.