Back to Journals » International Journal of Nanomedicine » Volume 10 » Issue 1
Fluorescent graphene quantum dots as traceable, pH-sensitive drug delivery systems
Authors Qiu J, Zhang R, Li J, Sang Y, Tang W, Rivera Gil P, Liu H
Received 6 July 2015
Accepted for publication 16 September 2015
Published 28 October 2015 Volume 2015:10(1) Pages 6709—6724
DOI https://doi.org/10.2147/IJN.S91864
Checked for plagiarism Yes
Review by Single anonymous peer review
Peer reviewer comments 4
Editor who approved publication: Professor Lei Yang
Jichuan Qiu,1 Ruibin Zhang,2 Jianhua Li,1 Yuanhua Sang,1 Wei Tang,3 Pilar Rivera Gil,4 Hong Liu1,5
1Center of Bio and Micro/Nano Functional Materials, State Key Laboratory of Crystal Materials, Shandong University, 2Blood Purification Center, Jinan Central Hospital, 3Department of Pathogenic Biology, Shandong University School of Medicine, Jinan, People’s Republic of China; 4Institute of Chemistry, Rovira i Virgili University, Tarragona, Spain; 5Beijing Institute of Nanoenergy and Nanosystems, Chinese Academy of Sciences, Beijing, People’s Republic of China
Abstract: Graphene quantum dots (GQDs) were rationally fabricated as a traceable drug delivery system for the targeted, pH-sensitive delivery of a chemotherapeutic drug into cancer cells. The GQDs served as fluorescent carriers for a well-known anticancer drug, doxorubicin (Dox). The whole system has the capacity for simultaneous tracking of the carrier and of drug release. Dox release is triggered upon acidification of the intracellular vesicles, where the carriers are located after their uptake by cancer cells. Further functionalization of the loaded carriers with targeting moieties such as arginine-glycine-aspartic acid (RGD) peptides enhanced their uptake by cancer cells. DU-145 and PC-3 human prostate cancer cell lines were used to evaluate the anticancer ability of Dox-loaded RGD-modified GQDs (Dox-RGD-GQDs). The results demonstrated the feasibility of using GQDs as traceable drug delivery systems with the ability for the pH-triggered delivery of drugs into target cells.
Keywords: graphene quantum dots, drug delivery, pH-sensitive, controlled release, traceable
Introduction
In the past decades, nanoparticle-based drug delivery systems (DDSs) have shown promising impact on cancer treatments due to the improved performance of the carried drugs as a result of better pharmacokinetics and biodistribution profiles of the drug.1–5 This is achieved because nanoparticle-based carriers can easily be modified according to the demand to realize, for example, spatial and temporal control of drug delivery and release, which finally improves the drug efficiency.6,7 Furthermore, a nanoparticle’s surface can be functionalized with targeting molecules such as arginine-glycine-aspartic acid (RGD), folic acid, or antibodies to improve drug delivery to target tumor cells, which additionally will reduce the side effects of drugs reaching healthy cells.1,8–10
In general, most nanoparticles are internalized via endocytosis and end up in endo/lysosomal compartments,11,12 which are rather acidic (pH 4.5–5.5) in nature compared with the extracellular environment (pH 7.4).13 Furthermore, some tumors are slightly more acidic than healthy tissue or the blood.14,15 Taking advantage of such differences, a DDS with an internal trigger (pH) can be designed to perform drug release only inside tumor cells, which will have a great impact on the availability of the drug to cancer cells.2,16–20 Tracking the whole process (eg, with fluorescence) is crucial not only to biologically characterize the performance of the nanomaterial (ie, uptake, drug release, metabolism, the fate of the carrier and of the drug, etc), but also to provide metrics for the efficacy of the treatment response.21,22 Traditionally, semiconductor quantum dots with excellent intrinsic tunable fluorescence properties compared with organic fluorophores have been widely used in bioimaging.6,7 Recently, semiconductor quantum dots have also been used as traceable DDSs.6,7,23
Carbon-based nanomaterials, such as fullerene, carbon nanotubes, and graphene (or graphene oxide [GO]) have been widely used as light-emitting diode materials and as efficient visible light-active photocatalysts, because of their unique mechanical, electronic, and optical properties.24–27 In addition, in the biomedical field, the use of carbon-based materials as biosensors, imaging probes, and DDSs is increasing.26,28 With regard to drug delivery, carbon nanotubes are the most investigated materials due to their excellent loading capabilities.26,28–31 However, the potential use of GO as a DDS has recently received increased attention.32–35 For example, Sun et al not only demonstrated the potential of GO as a DDS for the pH-sensitive release of doxorubicin (Dox) into cancer cells, but also specified the concomitant use of this material as an imaging agent.34 Regardless of this first proof-of-concept, carbon nanotubes and GO lack or have very low fluorescence efficiencies, which limit the tracking of these materials within complex living organisms and even within individual cells. Furthermore, due to the relatively large sizes of carbon nanotubes and GO, in vivo applications where the carrier can end up in the circulatory system might be compromised due to the high risk of blocked arteries.
Graphene quantum dots (GQDs) are a new type of carbon-based nanomaterial. They are considered as the next generation of green nanomaterials with enormous potential as biocompatible imaging probes due to their unique optical properties.36,37 In the same way as semiconductor nanocrystals, GQDs have tunable emission peaks37 and can be conjugated with different functional blocks to impart multifunctionality to the nanomaterial. Furthermore, the presence of more active groups for the attachment of bioactive molecules (eg, drugs) than in the case of carbon nanotubes makes them ideal carrier probes for the simultaneous treatment and tracking of cancer cells.
Based on this gap in knowledge, a multifunctional GQD-based DDS for the simultaneous tracking and targeted treatment of prostate cancer cells was fabricated (Figure 1). First, the targeting possibilities are provided by RGD peptides covalently linked to the surface of the GQDs. These peptides specifically bind to “αvβ3” integrins, which are overexpressed in cancer cells.38 Second, a well-known anticancer drug, Dox, is loaded into the GQDs, taking advantage of the excellent absorption properties of carbon nanomaterials.29–35 Third, the intrinsic fluorescence properties of the GQDs allow the surveillance of the whole process of internalization, intracellular distribution, and release. Finally, the acidification of the internalizing vesicles will trigger the release of Dox from the GQDs. The fluorescence of Dox will help in monitoring the drug release process and the fate of the drug.
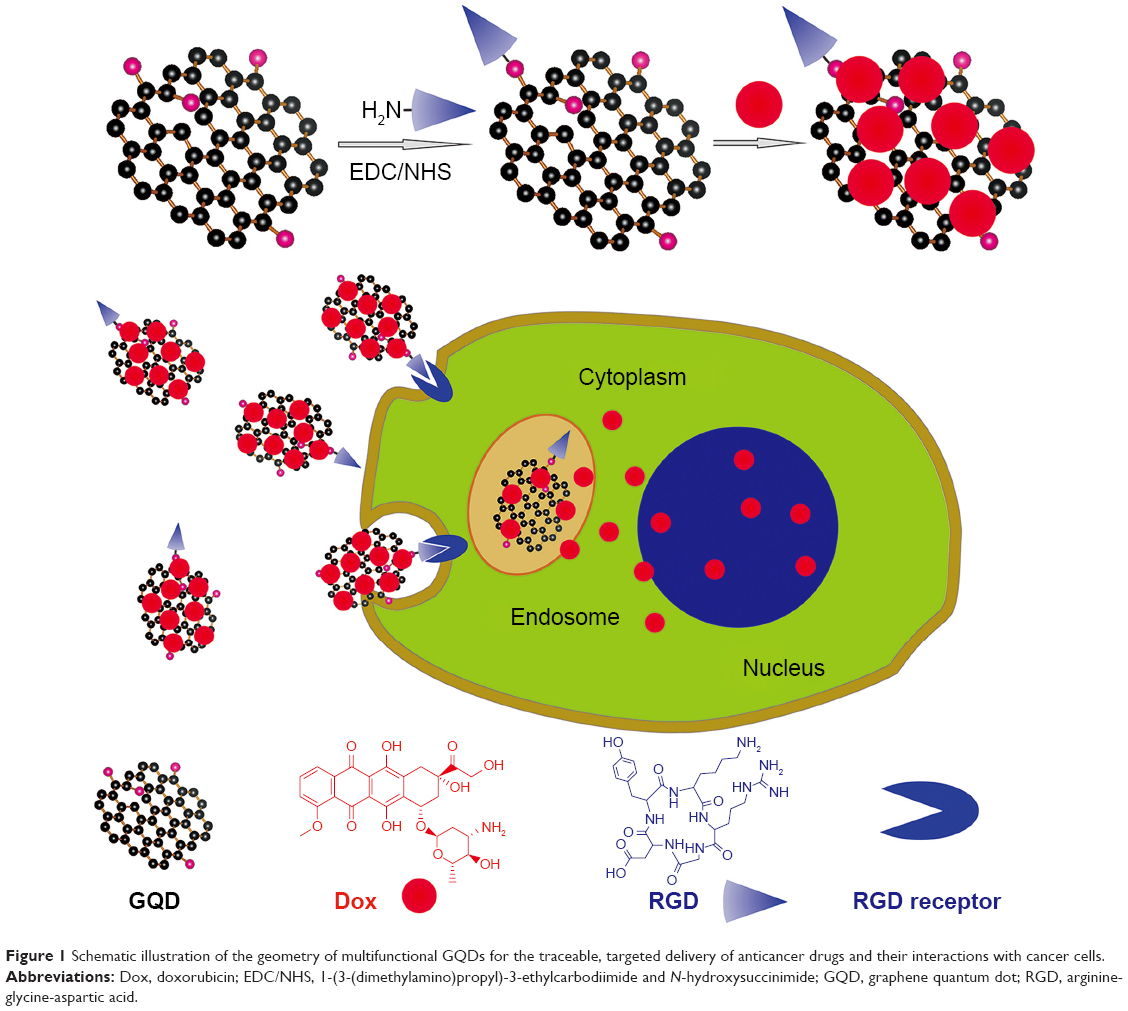 | Figure 1 Schematic illustration of the geometry of multifunctional GQDs for the traceable, targeted delivery of anticancer drugs and their interactions with cancer cells. |
Materials and methods
Synthesis of GO
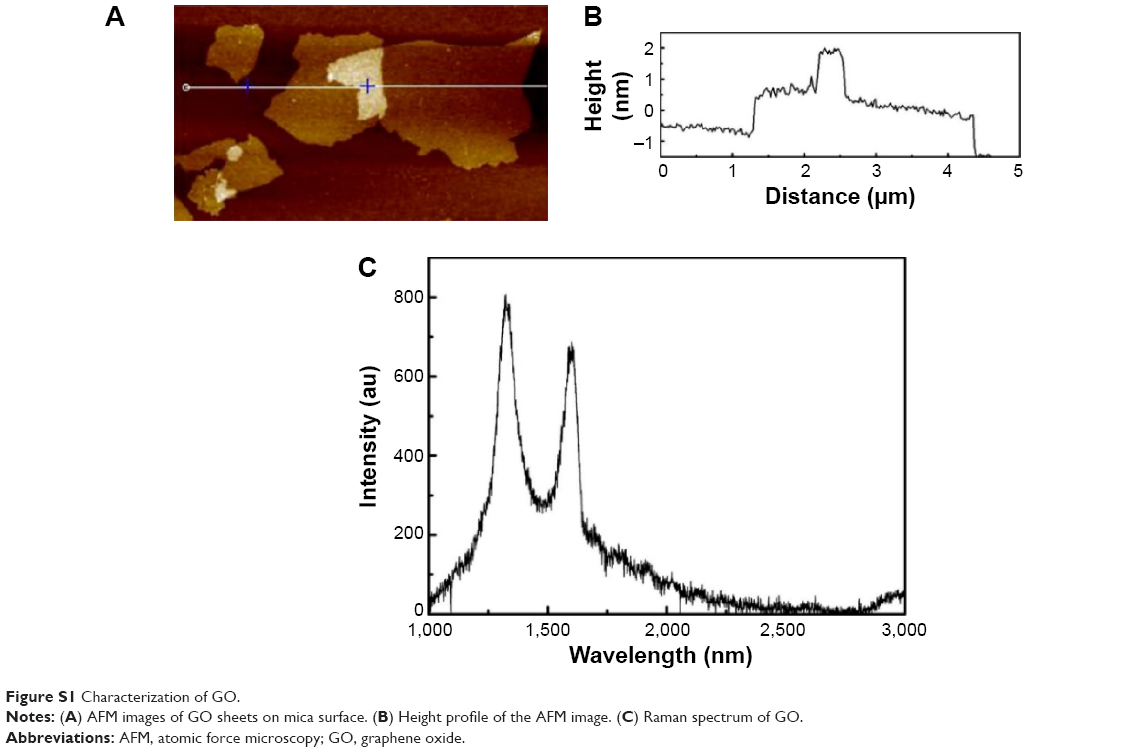
GO was prepared from graphite using an improved synthesis method.37 Briefly, a mixture of concentrated H2SO4–H3PO4 (360:40 mL) was added to a mixture of 3.0 g graphite flakes (Alfa Aesar, Ward Hill, MA, USA) and 18.0 g KMnO4. The reaction was heated to 50°C and stirred for 12 hours, then cooled to room temperature and poured onto ~350 g ice chips. Then, 3.0 mL of 30% H2O2 was slowly added to obtain a bright yellow dispersion. The suspension was then centrifuged (4,000× g for 4 hours), and the supernatant was decanted away. The obtained deposit was washed repeatedly with deionized water and then dialyzed (molecular weight cutoff [MWCO] ~3,000) for 2 weeks to obtain a clear dispersion of GO. Finally, the GO suspension was lyophilized at −60°C for 12 hours. GO was characterized by atomic force microscopy (ScanAsyst-enabled Dimension Icon, Bruker Corporation, Billerica, MA, USA) and Raman-scattering spectroscopy (Horiba Jobin Yvon LabRAM HR, Horiba Ltd., Kyoto, Japan).
Synthesis of GQDs
GQDs were synthesized using the method by Zhu et al, with a little modification.37 GO was dissolved in N, N-dimethylmethanamide (DMF) with a concentration of 150 mg/10 mL. The GO–DMF solutions were placed under ultrasonication for 30 minutes and then transferred to a polytetrafluoroethylene container in a stainless autoclave (30 mL), and heated at 200°C for 5 hours. Then, the reactors were cooled to room temperature naturally. The product was filtered using a 220-nm filter (Merck Millipore, Billerica, MA, USA). A brown transparent suspension containing the GQDs was obtained. The solvent of the suspension was removed with the aid of a rotary evaporator. The final products were dissolved in phosphate-buffered saline (PBS) with a concentration of 5 mg/mL. The GQDs were characterized using a fluorescence spectrophotometer (Hitachi F-4500, Hitachi Ltd., Tokyo, Japan) in the solution. They were dropped onto a cover glass and an ultrathin carbon supporting film and examined using high-resolution transmission electron microscopy (JEM2100F, JEOL, Tokyo, Japan). GQD powder was also characterized using Fourier transform infrared spectroscopy (Nicolet Nexus 670; Thermo Fisher Scientific, Inc, Waltham, MA, USA).
Modification of GQDs with RGD
The combination between amino group-terminated RGDyk and carboxyl group-containing GQDs was realized by the 1-(3-(dimethylamino)propyl)-3-ethylcarbodiimide and N-hydroxysuccinimide (EDC/NHS) coupling reaction. Briefly, 4 mg of EDC and 6 mg of NHS were added into 5 mL of GQD PBS solution under stirring. After adding 5 mg of RGDyk (RGD, SBS Genetech, Beijing, People’s Republic of China) into the solution, the reaction was performed for 2 hours under stirring at room temperature. Then, the final solution was dialyzed (MWCO ~500–1,000) for 48 hours (dialysate was replaced every 6 hours) to remove residual EDC and NHS molecules.
Dox loading and release from GQDs
Five milliliters of Dox solution with a concentration of 1 mg/mL was added into the GQD solution (or the obtained RGD-modified GQD solution) under stirring. After 24 hours of reaction, the solution was dialyzed (MWCO ~500–1,000) in PBS for 48 hours (dialysate was replaced every 6 hours) to remove unloaded Dox molecules. The Dox-loading content was quantified by ultraviolet-visible spectroscopy. The pH-responsive Dox release behavior was studied using a fluorescence spectrophotometer (Hitachi F-4500, Hitachi Ltd.). Dox release from the GQDs at pH =5 was performed as follows: 5 mL of Dox-loaded GQDs was transferred into a dialysis tube (MWCO ~500–1,000), then the tube was immersed into 50 mL of an acetate buffer (pH =5) bath at 37°C. At each time point, the outer dialysate was collected and replaced with fresh acetate buffer. Dox release at pH =7.4 was similar, except that the dialysate buffer was changed to PBS (pH =7.4) solution. The Dox release was analyzed by fluorescence spectroscopy at 590 nm.
Cell culture
DU-145, PC-3, and MC3T3-E1 cell lines were purchased from the Cell Bank of the Chinese Academy of Sciences (Shanghai, People’s Republic of China) and cultured in Roswell Park Memorial Institute (RPMI) 1640 medium (Gibco, product line of Thermo Fisher Scientific) supplemented with 10% fetal bovine serum (HyClone, Waltham, MA, USA), and 1% penicillin and streptomycin. Cells were maintained in a humidified atmosphere of 5% CO2 at 37°C. The culture medium was changed every 2 days. Cell experiments were approved by the ethics committee of Shandong University.
Cytotoxicity evaluation
Cells (1×10⁴) were seeded in 96-well plates and incubated for 24 hours in RPMI 1640 medium. After washing the cells twice with PBS, fresh medium or medium containing quantum dots at different concentrations, or free Dox, Dox-loaded GQDs, or Dox-loaded RGD-modified GQDs at different Dox concentrations was added into the plate wells and incubated for 24 hours. Thereafter, we replaced the growth medium with RPMI 1640 containing 10% Cell Counting Kit-8 (Dojindo Molecular Technology, Kumamoto, Japan) solution to quantitatively evaluate the cell viability. After 4 hours of incubation at 37°C, the medium containing water-soluble formazan dye, which has an absorption at a wavelength of 450 nm, was assayed by a microplate reader (Multiscan MK3; Thermo Fisher Scientific, Waltham, MA, USA). Five parallel replicates were used for each sample. The cell viability of the GQDs was further assessed using a LIVE/DEAD® Viability/Cytotoxicity Kit (Invitrogen™; Life Technologies, Carlsbad, CA, USA). The kit can quickly discriminate live from dead cells by simultaneously staining with green-fluorescent acetomethoxy calcein ester (calcein-acetoxymethyl ester) to indicate the intracellular esterase activity and red-fluorescent ethidium homodimer-1 to indicate the loss of plasma membrane integrity. After 24 hours of incubation with GQDs at a concentration of 200 μg/mL, the culture medium was removed. Then, 200 μL of LIVE/DEAD stain was added per well and the wells were incubated for 30 minutes at 37°C. Finally, the samples were observed using a fluorescence microscope.
GQD distribution in cells
The GQD distribution in cells was evaluated by staining cell lysosomes using LysoTracker® Red DND-99 (Invitrogen). Cells (1×10⁵) were seeded on glass coverslips and cultured for 24 hours with normal culture medium. Then, the culture medium was replaced with a new medium containing 200 μg/mL GQDs. After 16 hours of incubation, the glass coverslips were washed three times with PBS, stained with LysoTracker Red DND-99 for 30 minutes, and washed with PBS for fluorescence imaging by a confocal laser scanning microscope (CLSM, TCS SP8, Leica Microsystems, Wetzlar, Germany) at excitation wavelengths of 405 and 543 nm.
Observation of Dox release from GQDs in cells
First, cells (1×10⁵) were seeded on glass coverslips and cultured for 24 hours with normal culture medium. Then, the culture medium was replaced with culture medium containing free Dox, Dox-loaded GQDs, or Dox-loaded RGD-modified GQDs at a Dox concentration of 2.5 μg/mL. After incubation for different times, the glass coverslips were washed three times with PBS, and subjected to fluorescence imaging using a CLSM (TCS SP8). To avoid the influence of fluorescence cross-talk between the GQDs and Dox, the GQDs were excited by a 405 nm laser and signals were collected from 480 to 520 nm, and Dox was excited by a 488 nm laser and signals were collected from 600 to 650 nm. For DAPI (4′,6-diamidino-2-phenylindole) staining experiments, before imaging by CLSM, cells were first incubated with DAPI (Invitrogen) for 10 minutes.
Results and discussion
Synthesis and characterization of GQDs
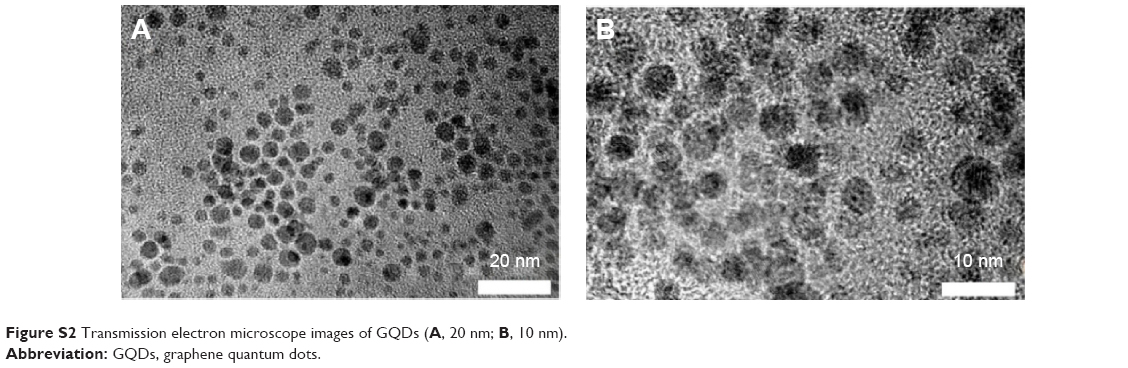
Decomposition of GO (characterization of GO in Figure S1) in DMF by a solvothermal method produces highly fluorescent GQDs.37 The nanoparticles have good colloidal stability in physiological media such as PBS, which is characterized by a high ionic strength, and form a transparent solution with a yellow color (Figure 2A). Under UV light irradiation, the color of the GQD dispersion changes to blue–green. The photoluminescence (PL) spectra (Figure 2B) show that when excited at wavelengths from 365 to 420 nm, the GQD dispersion exhibits a strong peak at 510 nm, indicating the size uniformity of the GQDs. However, when excited at higher wavelengths (450 and 488 nm), the PL peak redshifts to 527 and 550 nm, respectively, and the PL intensity decreases remarkably, while under 499 and 543 nm excitation, the GQDs showed almost no fluorescence. Furthermore, the GQDs showed good fluorescence stability at different pH values from 3 to 11 (Figure 2C). Transmission electron microscope images (Figures 2D and S2) showed that the GQDs were well dispersed with uniform lateral size, whereas the high-resolution transmission electron microscopy image and the corresponding fast Fourier transform pattern indicated that the GQDs contained a good crystalline graphene structure (Figure 2D). Their average size determined on a typical transmission electron microscope image (Figure S2A) was 4.0±0.9 nm (Figure 2E). The Fourier transform infrared spectrum in Figure 2F shows that the GQDs contain many chemical groups, including –OH, C=O, epoxy/ether, and –CO–NR2. The nitrogen elements appearing in the spectrum originate from DMF during the decomposition of GO.37 The presence of such a variety of functional groups can explain why the GQDs have good solubility and excellent fluorescence properties. Furthermore, these functional groups clearly facilitate the post-modification of the GQDs, for example, with targeting moieties and/or drugs, for the fabrication of a multifunctional DDS.
 | Figure 2 Physicochemical characterization of GQDs. |
Biocompatibility of GQDs
The toxicity of the as-synthesized GQDs was evaluated in two prostate cancer cell lines, DU-145 (Figure 3A–C) and PC-3 (Figure 3D–F), by Cell Count Kit-8 and the LIVE/DEAD Viability/Cytotoxicity Kit. As shown in Figure 3A, the threshold for toxicity in the DU-145 cells is 100 μg/mL. Below this threshold, no signs of impaired viability can be observed, however, above this threshold, the cell viability decreases with increasing concentration. Nevertheless, at concentration values as high as 400 μg/mL, the cell viability is still nearly 80% compared with untreated cells. Exposure of PC-3 to GQDs shows the same trend (Figure 3D). Using a two-color fluorescence viability assay for the simultaneous discrimination of live and dead cells, other toxicity markers, such as membrane damage and esterase activity, can be measured in parallel. Exposure for 24 hours of both cell lines, DU-145 (Figure 3B and C) and PC-3 (Figure 3E and F) to 200 μg/mL GQDs had almost no effect on the viability of both cell types. These can be assessed for enhanced esterase activity (live cells labeled in green, dead cells labeled in red) compared with reduced membrane damage. These results demonstrate that the GQDs are quite viable for both cell types and therefore, provide an ideal platform for biomedical applications.
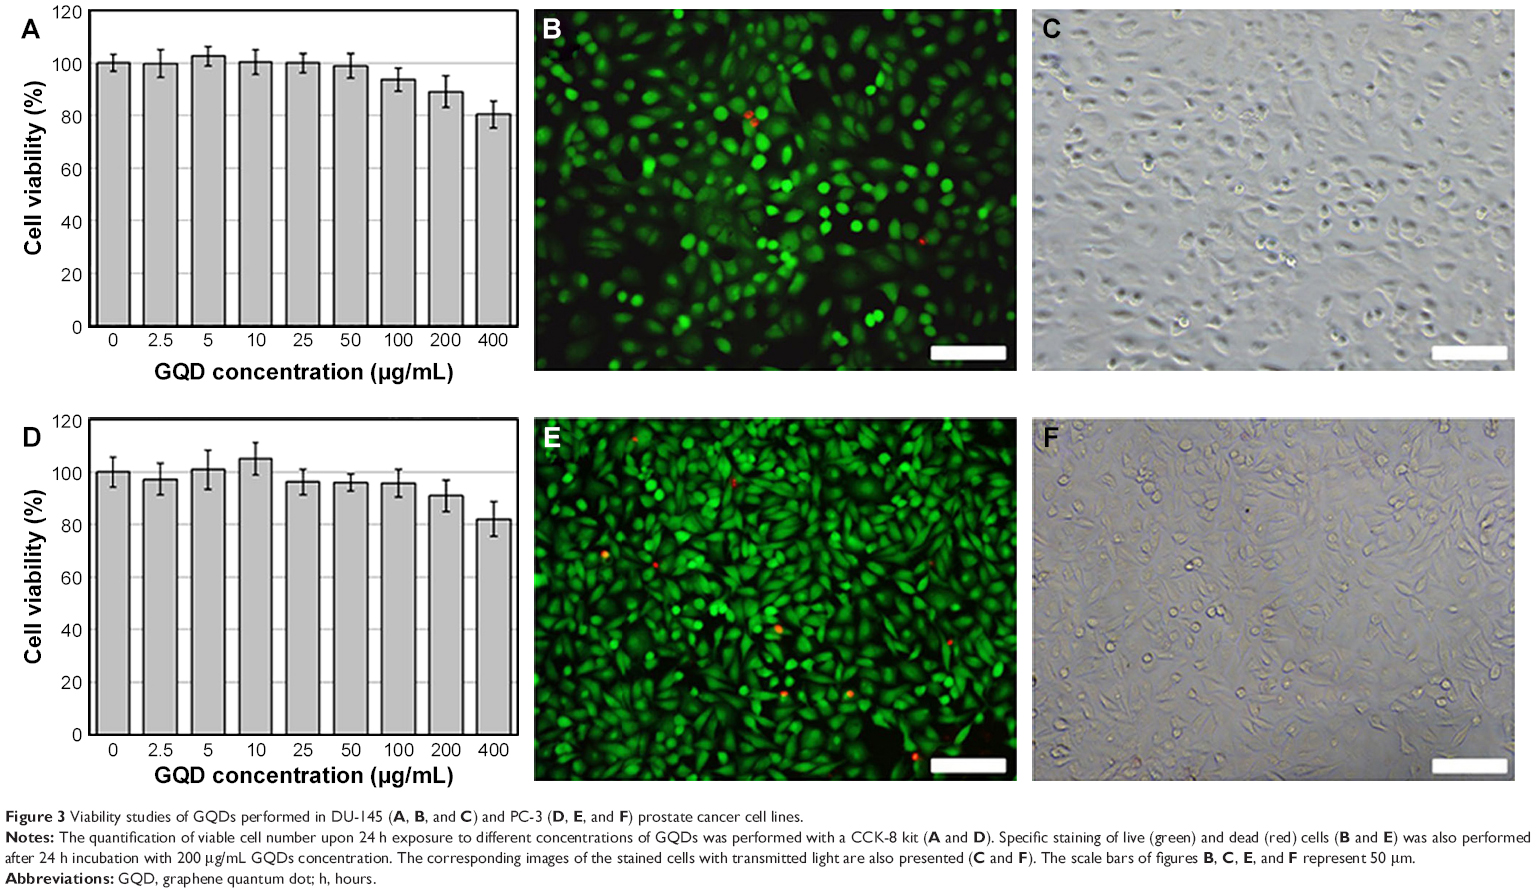 | Figure 3 Viability studies of GQDs performed in DU-145 (A, B, and C) and PC-3 (D, E, and F) prostate cancer cell lines. |
The good biocompatibility associated with their good optical properties makes these particles ideal candidates for particle tracking. In this way, the uptake and distribution of GQDs inside the cells can easily be monitored by fluorescence microscopy. The fluorescence microscopy images show plenty of particles that have been taken up by the cells (Figure S3).
Drug loading and pH-triggered release
Dox adsorption by GQDs was assessed via ultraviolet-visible spectroscopy, taking advantage of the spectral resolution of the absorption peaks of Dox and GQDs. Both systems, Dox-GQDs and Dox-RGD-GQDs, exhibited a characteristic absorption peak at 481 nm, corresponding to free Dox, and a sharp absorption around 300 nm originating from the GQDs (Figure 4A). These results indicated that Dox is successfully loaded onto the GQDs and RGD-GQDs. The amount of loaded Dox was determined with the help of a calibration curve (Figure S4). The amount of Dox contained within Dox-GQDs and Dox-RGD-GQDs was 109 μg/mg and 101 μg/mg GQDs, respectively (Table S1). The PL spectrum of the Dox-RGD-GQDs also supports this conclusion (Figure 4B). When the Dox-RGD-GQDs were excited at 400 nm, there was a strong emission at 510 nm corresponding to the GQDs (Figure 2C), whereas at 499 nm excitation, there was an additional emission peak around 590 nm, which was caused by Dox (Figure S5). Summarizing, Dox-RGD-GQDs (or Dox-GQDs) give two fluorescence emission peaks around 480–530 nm (excitation at 400 nm) and 550–630 nm (excitation at 499 nm) that are caused by the GQDs and Dox, respectively. This provides a basis for the simultaneous tracking of the drug carriers on their way into cells and the drug release behavior from the carriers inside the cells.
 | Figure 4 Optical properties of plain and functionalized GQDs. |
The cytosol of the cells has a pH value of around 7.4, whereas the endocytic vesicles, where the particles are entrapped upon internalization, have a lower pH that can reach values of 4.5–5.50.13 Furthermore, if in vivo applications are envisaged, some tumors are characterized by a slightly more acidic environment than healthy tissue or blood.11,12 Therefore, using pH as a trigger for the controlled release of anticancer drugs appears highly advantageous but also feasible.16–20
Dox-RGD-GQDs were dialyzed in PBS (pH 7.4) for 48 hours to remove unloaded Dox. Quantification of the Dox release from the GQDs was performed with help of a calibration curve (Figure S6) under acidic conditions (acetate buffer at pH 5) and alkaline conditions (PBS pH 7.4), mimicking the environment of intracellular vesicles or of the cytosol, respectively. The results shown in Figure 5 indicate the same behavior for the release of Dox from the Dox-RGD-GQDs, but with different amounts of Dox depending on the pH. At both pH values, there is a continuous release with time and a plateau is reached after 72 hours. However, at neutral pH (7.4), the release increases slowly, reaching a maximum value of 13%. This might be due to uncontrolled release of Dox due to non-covalent binding to the GQDs.39,40 On the other hand, under acidic conditions (pH 5), the release significantly increases within the first hours, reaching a maximum value of nearly 60% after 72 hours.
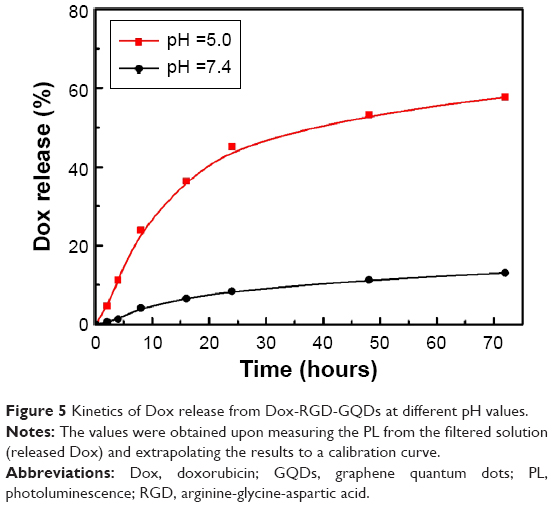 | Figure 5 Kinetics of Dox release from Dox-RGD-GQDs at different pH values. |
There are two main reasons for the high release at pH 5.0 and the relatively low release at pH 7.4. One is attributed to the increased hydrophilicity and solubility of Dox at pH 5.0.35,39 The other is the different degree of hydrogen-bonding interaction between Dox and the GQDs under different pH conditions.29,30,40 Under acidic conditions, the hydrogen-bonding interactions between the H+ in the solution and the –COOH, –OH, and –NH2 groups of the GQDs and the –OH and –NH2 groups of Dox are stronger than those occurring at neutral pH. At low pH (high H+ concentration), the NH2 groups of Dox and the GQDs interact with the H+ of the environment to form NH3+ and therefore they are not available to participate in the stabilization of Dox within the GQDs. This weakens the Dox-GQDs hydrogen-bonding interactions in favor of a steady release of Dox.
The results show the possibility of using pH as an internal trigger for GQDs to efficiently perform drug release; however, the in vitro demonstration still needs to be verified.
Cellular distribution of GQDs
Before assessing the in vitro release of Dox from Dox-RGD-GQDs, the uptake and fate of the particles was studied. The cells were exposed to the fluorescent lysosomotropic marker, LysoTracker Red DND-99, in combination with the fluorescent particles. By identifying the location of both fluorescence signals, the fate of the particles can be elucidated. Considering the cross-talk signals between Dox and the lysosomal marker, bare GQDs were tested for their distribution within the cells. As shown in Figure S7, the GQDs are effectively internalized by both cell types and exhibited a perinuclear distribution pattern. Due to the colocalization of the fluorescence signal from the GQDs with the signal from the lysosomotropic marker, the final fate of the particles was concluded to be the lysosomes. These results verify the acidic environment of the particles necessary to trigger the Dox release from the GQDs.
Lethal effect of Dox-RGD-GQDs
Once the uptake of GQDs, the localization in acidic vesicles, and the use of pH as a trigger for the release of Dox from the GQDs was established, the performance of the GQD-based DDS was evaluated in vitro in model prostate cancer cell lines. To this end, DU-145 and PC-3 cells were exposed to Dox-RGD-GQDs and for comparison, also to Dox-GQDs and free Dox. Dox release was assessed by measuring the degree of cell death. As shown in Figure 6A and B, all systems showed a concentration-dependent toxicity induced by Dox. The highest concentration (5 μg/mL) of Dox corresponds to about 50 μg/mL GQDs (Table S1), which is in the safe region of the viability assay performed in Figure 3; thus, a toxic effect derived by GQDs can be excluded. Dox-GQDs and Dox-RGD-GQDs showed a slightly lower lethal effect compared with free Dox. This can be attributed to the diffusion abilities of free, but not of conjugated Dox,41,42 which accelerates the internalization of Dox and its availability inside the cells. Figure 6A and B also show a consistently higher lethal effect for Dox-RGD-GQDs than for Dox-GQDs (RGD-free), which could be attributed to the enhanced cellular uptake that the RGD peptides provide to the Dox-RGD-GQDs, thus indirectly confirming the efficacy of RGD to locally accumulate the DDS within cancer cells, thereby facilitating uptake and increasing the availability of Dox to the cells. To further evaluate the targeting ability of Dox-RGD-GQDs for killing cancer cells, a healthy pre-osteoblast cell, MC3T3-E1,43 was used to test the lethal effects of Dox, Dox-GQDs, and Dox-RGD-GQDs. As Figure 6C shows, 2.0 μg/mL free Dox caused about 55% MC3T3-E1 death, with about 40% death for DU-145 and PC-3, which suggests that free Dox caused more damage to healthy cells than to cancer cells. Furthermore, for MC3T3-E1, Dox-GQDs, and Dox-RGD-GQDs showed no significant difference in killing cell behavior, and had an obviously lower lethal effect compared with free Dox, which demonstrated the targeting effect of Dox-RGD-GQDs toward cancer cells and the efficiency of Dox-RGD-GQDs for killing cancer cells while protecting normal cells.
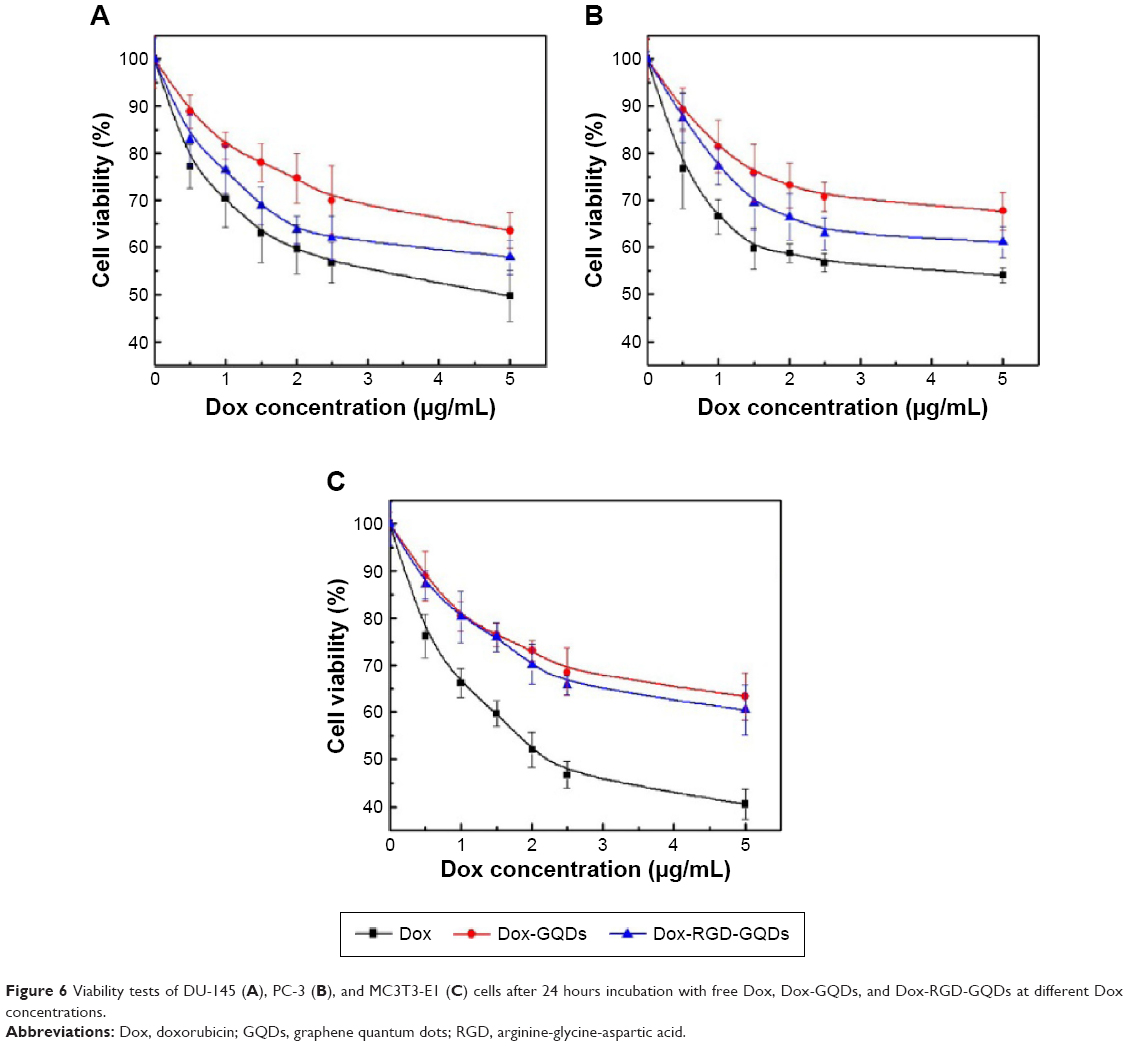 | Figure 6 Viability tests of DU-145 (A), PC-3 (B), and MC3T3-E1 (C) cells after 24 hours incubation with free Dox, Dox-GQDs, and Dox-RGD-GQDs at different Dox concentrations. |
Monitoring drug release inside cells
One extra advantage that GQDs add to this novel DDS is the possibility to track the particles and the cells in a safe and reliable manner due to their biocompatible nature and their optimal optical properties. In this regard, not only the GQDs but also Dox release (due to their inherent fluorescence) could be tracked (Figure 7). Dox is toxic upon intercalation with DNA and therefore performs its action in the nucleus. The free Dox PL spectrum and internalization within DU-145 and PC-3 is shown in Figures S3, S5, and S7. Free Dox reached the nuclei of DU-145 and PC-3 after 2 and 8 hours of incubation (Figure S8). On the other hand, the conjugated Dox of Dox-RGD-GQDs after 2 hours of incubation is outside the cell nuclei and colocalized with the GQDs, indicating that the Dox-RGD-GQDs was digested by the cells and Dox was still not released from Dox-RGD-GQDs (Figure 7A and D). After 8 hours of incubation, as Figure 7B and E show, a little Dox started penetrating the cell nuclei, while the GQDs are still outside the cell nuclei, suggesting that some Dox is released from the Dox-RGD-GQDs. After 16 hours of incubation, more Dox is distributed in the cell nuclei, indicating that more Dox was released from the Dox-RGD-GQDs and penetrated into the cell nuclei (Figure 7C and F). These results confirm the pH-mediated release of Dox from entrapped acidic vesicles (where the GQDs are) to the cytosol and its diffusion to its target site, the nucleus.
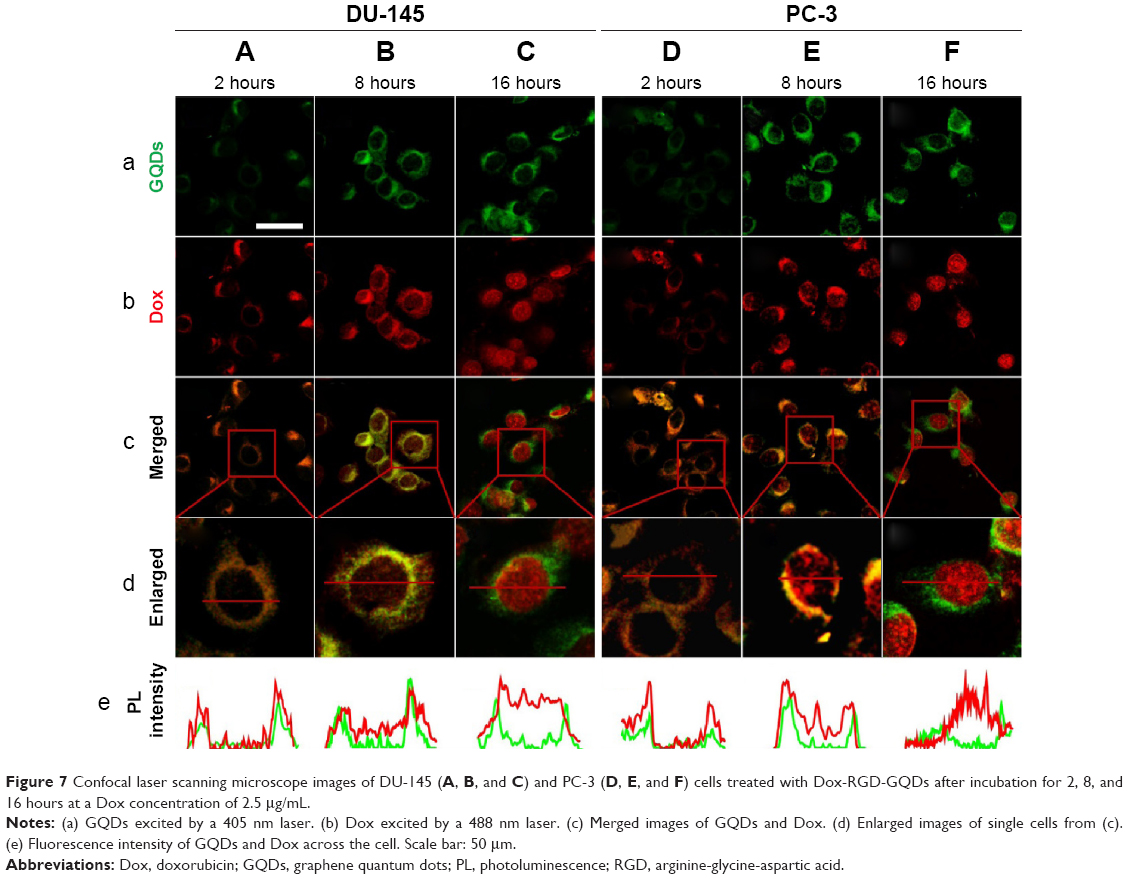 | Figure 7 Confocal laser scanning microscope images of DU-145 (A, B, and C) and PC-3 (D, E, and F) cells treated with Dox-RGD-GQDs after incubation for 2, 8, and 16 hours at a Dox concentration of 2.5 μg/mL. |
To finally confirm the nuclear localization of the released Dox, a fluorescent nuclear marker (DAPI) was used in the same way as described before for the lysosome. As shown in Figure 8, most of the Dox is still in the cytoplasm and is not colocalized with the nucleus after 2 and 8 hours of incubation, while after 16 hours of incubation, a clear overlap between both signals appears. These results confirm the transport of Dox from the cytoplasm of the cell to the nucleus, where it is translocated. It is worth mentioning that DAPI and GQDs are both excited by a 405 nm laser, but the fluorescence intensity of DAPI is higher than that of the GQDs. Therefore, imaging of both markers, GQDs, and the nucleus could not be performed simultaneously. Within the images shown in this work, the GQDs maintained their perinuclear localization over the time frames investigated, while Dox was steadily translocated away from the particles and moved into the nucleus.
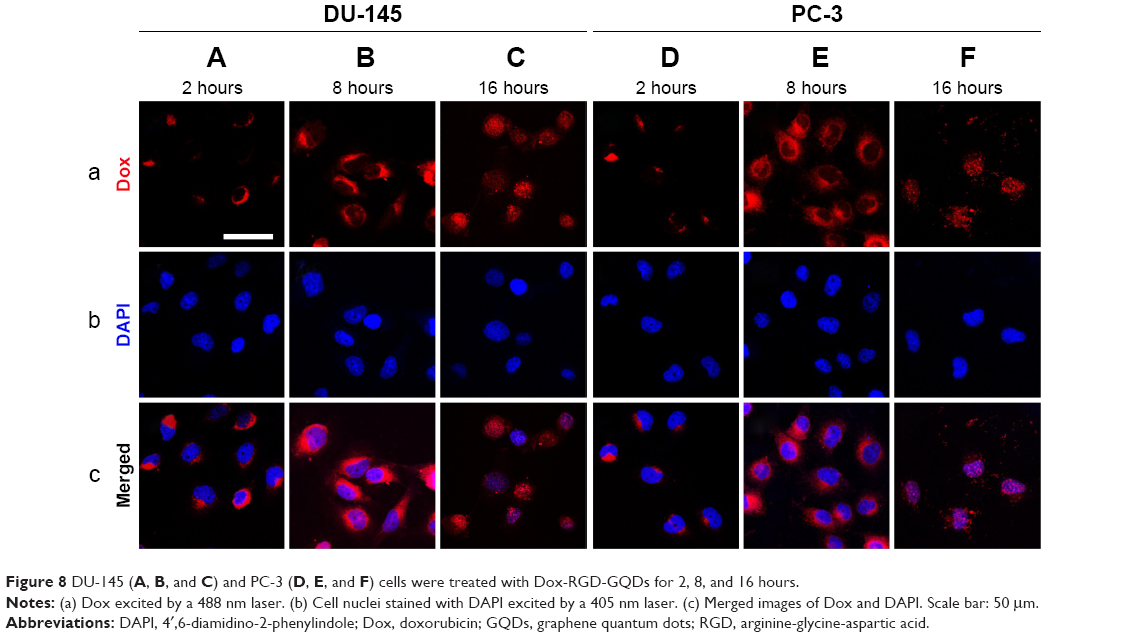 | Figure 8 DU-145 (A, B, and C) and PC-3 (D, E, and F) cells were treated with Dox-RGD-GQDs for 2, 8, and 16 hours. |
Conclusion
In conclusion, this work has demonstrated the fabrication of a multifunctional and biocompatible DDS based on highly fluorescent GQDs for the efficient tracking and treatment of cancer cells in vitro. Modification of the GQD-based DDS with targeting (RGD) peptides facilitated the uptake of GQDs and consequentially enhanced the availability and effect of the carried anticancer drug (Dox). Taking advantage of the dependence of the conjugation of Dox on the GQDs on pH, Dox release was only performed inside the cells. Furthermore, based on the intrinsic fluorescent properties of GQDs (carrier) and Dox (drug), the controlled drug release behavior was successfully monitored and confirmed. Dox was released from the lysosome-entrapped GQDs and translocated to the cell nucleus, where Dox had a lethal effect.
In general, the controlled release of drugs carried within DDSs can improve the performance of drugs by preventing their degradation before reaching their target, and by enhancing the uptake at the target. In this regard, such an approach will certainly diminish unwanted side effects derived by the incorporation of the drug into healthy cells. Moreover, the use of drug carriers may have the potential to bypass multidrug resistance issues because they enter cells via endocytosis, avoiding in this way the cell-surface protein pumps.44,45 In vivo experiments will be carried out in future to further demonstrate the presented proof-of-concept.
Acknowledgments
The authors are thankful for the Fundamental Research Funds of Shandong University (2014QY003; 2014JC019), the National Natural Science Foundation of People’s Republic of China (81102229), and the Innovation Research Group (IRG: 51321091).
Disclosure
The authors report no conflicts of interest in this work.
References
Peer D, Karp JM, Hong S, Farokhzad OC, Margalit R, Langer R. Nanocarriers as an emerging platform for cancer therapy. Nat Nanotechnol. 2007;2(12):751–760. | ||
Du JZ, Du XJ, Mao CQ, Wang J. Tailor-made dual pH-sensitive polymer-doxorubicin nanoparticles for efficient anticancer drug delivery. J Am Chem Soc. 2011;133(44):17560–17563. | ||
Farokhzad OC, Langer R. Impact of nanotechnology on drug delivery. ACS Nano. 2009;3(1):16–20. | ||
Wang JJ, Zeng ZW, Xiao RZ, et al. Recent advances of chitosan nanoparticles as drug carriers. Int J Nanomedicine. 2011;6:765–774. | ||
De Jong WH, Borm PJ. Drug delivery and nanoparticles: applications and hazards. Int J Nanomedicine. 2008;3(2):133–149. | ||
Biju V. Chemical modifications and bioconjugate reactions of nanomaterials for sensing, imaging, drug delivery and therapy. Chem Soc Rev. 2014;43(3):744–764. | ||
Zrazhevskiy P, Sena M, Gao XH. Designing multifunctional quantum dots for bioimaging, detection, and drug delivery. Chem Soc Rev. 2010;39(11):4326–4354. | ||
Lu YJ, Low PS. Folate-mediated delivery of macromolecular anticancer therapeutic agents. Adv Drug Deliv Rev. 2012;64:342–352. | ||
Brannon-Peppas L, Blanchette JO. Nanoparticle and targeted systems for cancer therapy. Adv Drug Deliv Rev. 2004;56(11):1649–1659. | ||
Zhao D, Zhao X, Zu Y, et al. Preparation, characterization, and in vitro targeted delivery of folate-decorated paclitaxel-loaded bovine serum albumin nanoparticles. Int J Nanomedicine. 2010;5:669–677. | ||
Rivera Gil P, Vazquez Vazquez C, Giannini V, et al. Plasmonic nanoprobes for real-time optical monitoring of nitric oxide inside living cells. Angew Chem. 2013;125(51):13939–13943. | ||
Schweiger C, Hartmann R, Zhang F, Parak WJ, Kissel TH, Rivera Gil P. Quantification of the internalization patterns of superparamagnetic iron oxide nanoparticles with opposite charge. J Nanobiotechnology. 2012;10:28. | ||
Rivera Gil P, Nazarenus M, Ashraf S, Parak WJ. pH-Sensitive capsules as intracellular optical reporters for monitoring lysosomal pH changes upon stimulation. Small. 2012;8(6):943–948. | ||
Lee ES, Gao Z, Bae YH. Recent progress in tumor pH targeting nanotechnology. J Control Release. 2008;132(3):164–170. | ||
Ganta S, Devalapally H, Shahiwala A, Amiji M. A review of stimuli-responsive nanocarriers for drug and gene delivery. J Control Release. 2008;126(3):187–204. | ||
Wu H, Zhu L, Torchilin VP. pH-Sensitive poly(histidine)-PEG/DSPE-PEG co-polymer micelles for cytosolic drug delivery. Biomaterials. 2013;34(4):1213–1222. | ||
Kost J, Langer R. Responsive polymeric delivery systems. Adv Drug Deliv Rev. 2012;64:327–341. | ||
Zhang H, Wang C, Chen B, Wang X. Daunorubicin-TiO2 nanocomposites as a “smart” pH-responsive drug delivery system. Int J Nanomedicine. 2012;7:235–242. | ||
Ashwanikumar N, Kumar NA, Nair SA, Kumar GV. Methacrylic-based nanogels for the pH-sensitive delivery of 5-fluorouracil in the colon. Int J Nanomedicine. 2012;7:5769–5779. | ||
Gu Y-J, Cheng J, Jin J, Cheng SH, Wong W-T. Development and evaluation of pH-responsive single-walled carbon nanotube-doxorubicin complexes in cancer cells. Int J Nanomedicine. 2011;6:2889–2898. | ||
Basuki JS, Duong HTT, Macmillan A, et al. Using fluorescence lifetime imaging microscopy to monitor theranostic nanoparticle uptake and intracellular doxorubicin release. ACS Nano. 2013;7(11):10175–10189. | ||
Jana A, Devi KSP, Maiti TK, Singh NDP. Perylene-3-ylmethanol: fluorescent organic nanoparticles as a single-component photoresponsive nanocarrier with real-time monitoring of anticancer drug release. J Am Chem Soc. 2012;134(18):7656–7659. | ||
Probst CE, Zrazhevskiy P, Bagalkot V, Gao XH. Quantum dots as a platform for nanoparticle drug delivery vehicle design. Adv Drug Deliv Rev. 2013;65(5):703–718. | ||
Zhu YW, Murali S, Cai WW, et al. Graphene and graphene oxide: synthesis, properties, and applications. Adv Mater. 2010;22(35):3906–3924. | ||
Babu SS, Mohwald H, Nakanishi T. Recent progress in morphology control of supramolecular fullerene assemblies and its applications. Chem Soc Rev. 2010;39(11):4021–4035. | ||
Saito N, Usui Y, Aoki K, et al. Carbon nanotubes: biomaterial applications. Chem Soc Rev. 2009;38(7):1897–1903. | ||
Geim AK, Novoselov KS. The rise of graphene. Nat Mat. 2007;6(3):183–191. | ||
Yang WR, Ratinac KR, Ringer SP, Thordarson P, Gooding JJ, Braet F. Carbon nanomaterials in biosensors: should you use nanotubes or graphene? Angew Chem Int Ed Engl. 2010;49(12):2114–2138. | ||
Liu ZA, Sun XM, Nakayama-Ratchford N, Dai HJ. Supramolecular chemistry on water-soluble carbon nanotubes for drug loading and delivery. ACS Nano. 2007;1(1):50–56. [Erratum in ACS Nano. 2010;4(12):7726]. | ||
Bhirde AA, Patel V, Gavard J, et al. Targeted killing of cancer cells in vivo and in vitro with EGF-directed carbon nanotube-based drug delivery. ACS Nano. 2009;3(2):307–316. | ||
Madani SY, Naderi N, Dissanayake O, Tan A, Seifalian AM. A new era of cancer treatment: carbon nanotubes as drug delivery tools. Int J Nanomedicine. 2011;6:2963–2979. | ||
Yang XY, Wang YS, Huang X, et al. Multi-functionalized graphene oxide based anticancer drug-carrier with dual-targeting function and pH-sensitivity. J Mater Chem. 2011;21(10):3448–3454. | ||
Zhang LM, Xia JG, Zhao QH, Liu LW, Zhang ZJ. Functional graphene oxide as a nanocarrier for controlled loading and targeted delivery of mixed anticancer drugs. Small. 2010;6(4):537–544. | ||
Sun XM, Liu Z, Welsher K, et al. Nano-graphene oxide for cellular imaging and drug delivery. Nano Res. 2008;1(3):203–212. | ||
Liu Z, Robinson JT, Sun XM, Dai HJ. PEGylated nanographene oxide for delivery of water-insoluble cancer drugs. J Am Chem Soc. 2008;130(33):10876–10877. | ||
Shen J, Zhu Y, Yang X, Li C. Graphene quantum dots: emergent nanolights for bioimaging, sensors, catalysis and photovoltaic devices. Chem Commun. 2012;48(31):3686–3699. | ||
Zhu SJ, Zhang JH, Qiao CY, et al. Strongly green-photoluminescent graphene quantum dots for bioimaging applications. Chem Commun. 2011;47(24):6858–6860. | ||
Danhier F, Breton AL, Préat Vr. RGD-based strategies to target alpha (v) beta (3) integrin in cancer therapy and diagnosis. Mol Pharm. 2012;9(11):2961–2973. | ||
Liu Z, Sun XM, Nakayama-Ratchford N, Dai HJ. Supramolecular chemistry on water-soluble carbon nanotubes for drug loading and delivery. ACS Nano. 2007;1(1):50–56. | ||
Depan D, Shah J, Misra RDK. Controlled release of drug from folate-decorated and graphene mediated drug delivery system: synthesis, loading efficiency, and drug release response. Mat Sci Eng C-Mater. 2011;31(7):1305–1312. | ||
Yang XQ, Grailer JJ, Rowland IJ, et al. Multifunctional stable and pH-responsive polymer vesicles formed by heterofunctional triblock copolymer for targeted anticancer drug delivery and ultrasensitive MR imaging. ACS Nano. 2010;4(11):6805–6817. | ||
Yang XY, Zhang XY, Liu ZF, Ma YF, Huang Y, Chen Y. High-efficiency loading and controlled release of doxorubicin hydrochloride on graphene oxide. J Phys Chem C. 2008;112(45):17554–17558. | ||
Qiu J, Li J, Wang G, et al. In vitro Investigation on the biodegradability and biocompatibility of genipin cross-linked porcine acellular dermal matrix with intrinsic fluorescence. ACS Appl Mater Interfaces. 2012;5(2):344–350. | ||
Davis ME, Shin DM, Chen ZG. Nanoparticle therapeutics: an emerging treatment modality for cancer. Nat Rev Drug Discov. 2008;7(9):771–782. | ||
Zhao Z, Huang D, Yin Z, Chi X, Wang X, Gao J. Magnetite nanoparticles as smart carriers to manipulate the cytotoxicity of anticancer drugs: magnetic control and pH-responsive release. J Mater Chem. 2012;22(31):15717–15725. |
Supplementary materials
 | Figure S1 Characterization of GO. |
 | Figure S2 Transmission electron microscope images of GQDs (A, 20 nm; B, 10 nm). |
 | Figure S3 Confocal laser scanning microscope images of DU-145 (A and B) and PC-3 (C and D) cells after 24 hours incubation with GQDs at a concentration of 200 μg/mL. |
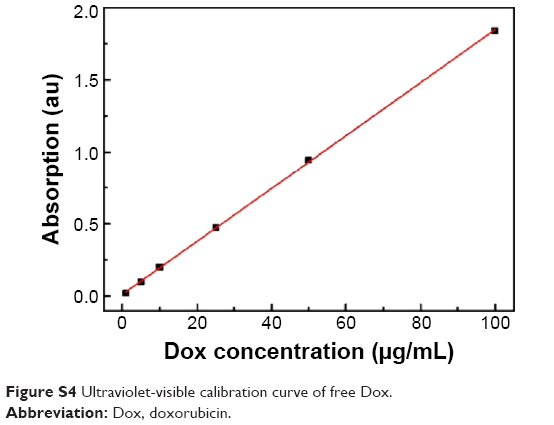 | Figure S4 Ultraviolet-visible calibration curve of free Dox. |
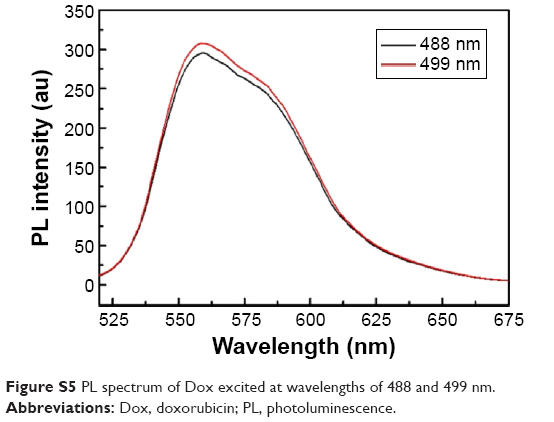 | Figure S5 PL spectrum of Dox excited at wavelengths of 488 and 499 nm. |
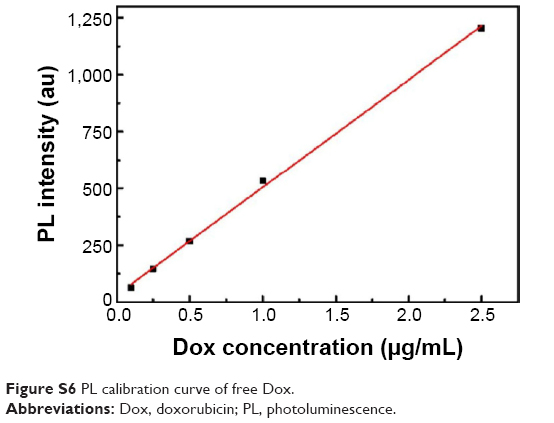 | Figure S6 PL calibration curve of free Dox. |
 | Figure S7 Confocal laser scanning microscope images of DU-145 (A, B, and C) and PC-3 (D, E, and F) cells after 16 hours incubation with GQDs. |
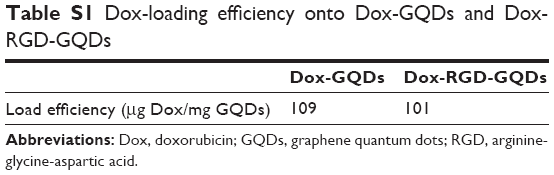 | Table S1 Dox-loading efficiency onto Dox-GQDs and Dox-RGD-GQDs |
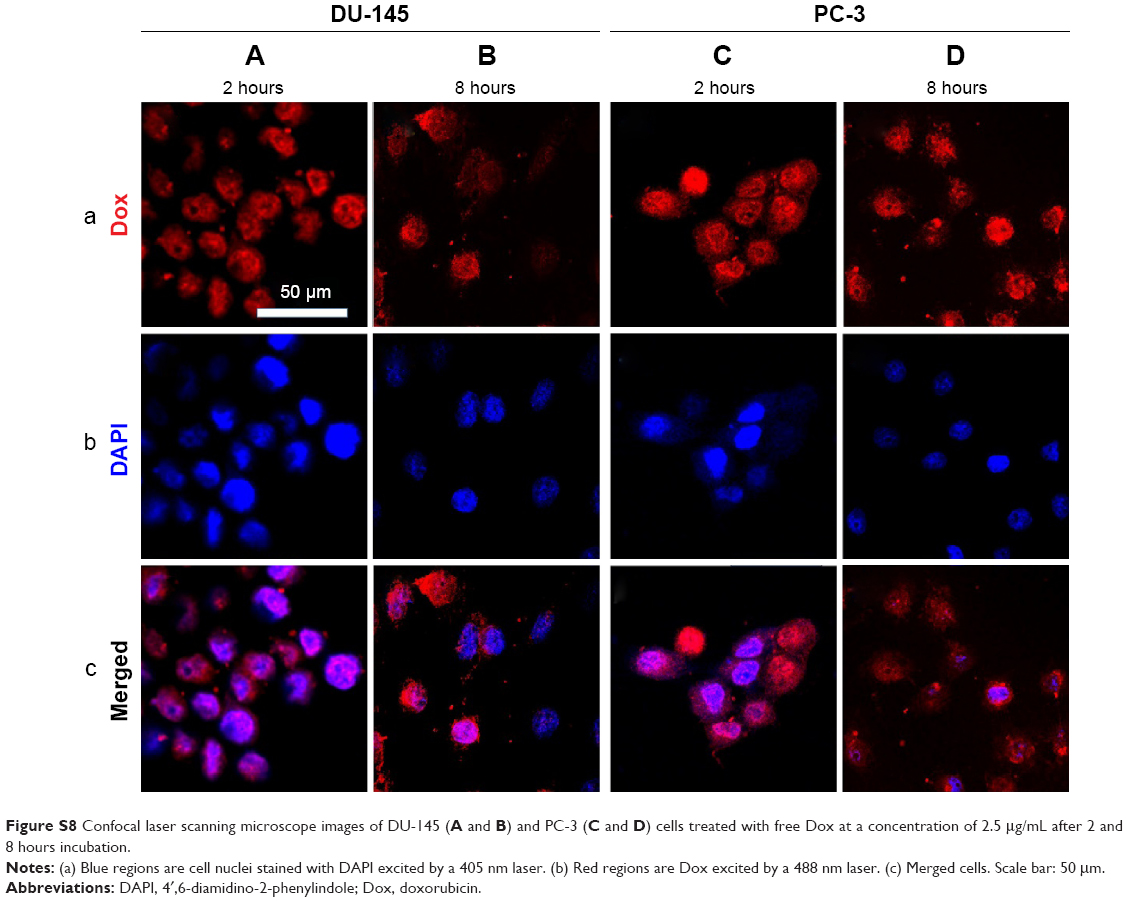 | Figure S8 Confocal laser scanning microscope images of DU-145 (A and B) and PC-3 (C and D) cells treated with free Dox at a concentration of 2.5 μg/mL after 2 and 8 hours incubation. |
 © 2015 The Author(s). This work is published and licensed by Dove Medical Press Limited. The
full terms of this license are available at https://www.dovepress.com/terms
and incorporate the Creative Commons Attribution
- Non Commercial (unported, 3.0) License.
By accessing the work you hereby accept the Terms. Non-commercial uses of the work are permitted
without any further permission from Dove Medical Press Limited, provided the work is properly
attributed. For permission for commercial use of this work, please see paragraphs 4.2 and 5 of our Terms.
© 2015 The Author(s). This work is published and licensed by Dove Medical Press Limited. The
full terms of this license are available at https://www.dovepress.com/terms
and incorporate the Creative Commons Attribution
- Non Commercial (unported, 3.0) License.
By accessing the work you hereby accept the Terms. Non-commercial uses of the work are permitted
without any further permission from Dove Medical Press Limited, provided the work is properly
attributed. For permission for commercial use of this work, please see paragraphs 4.2 and 5 of our Terms.