")
Back to Journals » Journal of Multidisciplinary Healthcare » Volume 7
Five-year tracking of Plasmodium falciparum allele frequencies in a holoendemic area with indistinct seasonal transitions
Authors Akala H, Achieng AO, Eyase F, Juma D, Ingasia L, Cheruiyot A, Okello C, Omariba D, Owiti E, Muriuki C, Yeda R, Andagalu B, Johnson J, Kamau E
Received 6 May 2014
Accepted for publication 27 June 2014
Published 6 November 2014 Volume 2014:7 Pages 515—523
DOI https://doi.org/10.2147/JMDH.S67252
Checked for plagiarism Yes
Review by Single anonymous peer review
Peer reviewer comments 2
Hoseah M Akala, Angela O Achieng, Fredrick L Eyase, Dennis W Juma, Luiser Ingasia, Agnes C Cheruiyot, Charles Okello, Duke Omariba, Eunice A Owiti, Catherine Muriuki, Redemptah Yeda, Ben Andagalu, Jacob D Johnson, Edwin Kamau
Global Emerging Infections Surveillance Program, United States Army Medical Research Unit-Kenya, Kenya Medical Research Institute, Walter Reed Project, Kisumu and Nairobi, Kenya
Background: The renewed malaria eradication efforts require an understanding of the seasonal patterns of frequency of polymorphic variants in order to focus limited funds productively. Although cross-sectional studies in holoendemic areas spanning a single year could be useful in describing parasite genotype status at a given point, such information is inadequate in describing temporal trends in genotype polymorphisms. For Plasmodium falciparum isolates from Kisumu District Hospital, Plasmodium falciparum chloroquine-resistance transporter gene (Pfcrt-K76T) and P. falciparum multidrug resistance gene 1 (PfMDR1-N86Y), were analyzed for polymorphisms and parasitemia changes in the 53 months from March 2008 to August 2012. Observations were compared with prevailing climatic factors, including humidity, rainfall, and temperature.
Methods: Parasitemia (the percentage of infected red blood cells per total red blood cells) was established by microscopy for P. falciparum malaria-positive samples. P. falciparum DNA was extracted from whole blood using a Qiagen DNA Blood Mini Kit. Single nucleotide polymorphism identification at positions Pfcrt-K76T and PfMDR1-N86Y was performed using real-time polymerase chain reaction and/or sequencing. Data on climatic variables were obtained from http://www.tutiempo.net/en/.
Results: A total of 895 field isolates from 2008 (n=169), 2009 (n=161), 2010 (n=216), 2011 (n=223), and 2012 (n=126) showed large variations in monthly frequency of PfMDR1-N86Y and Pfcrt-K76T as the mutant genotypes decreased from 68.4%±15% and 38.1%±13% to 29.8%±18% and 13.3%±9%, respectively. The mean percentage of parasitemia was 2.61%±1.01% (coefficient of variation 115.86%; n=895). There was no correlation between genotype or parasitemia and climatic factors.
Conclusion: This study shows variability in the frequency of Pfcrt-K76T and PfMDR1-N86Y polymorphisms during the study period, bringing into focus the role of cross-sectional studies in describing temporal genotype trends. The lack of correlation between genotypes and climatic changes, especially precipitation, emphasizes the cost of investment in genotype change.
Keywords: PfMDR1-N86Y, Pfcrt-K76T, polymorphism, parasitemia
Introduction
There has been a steady increase in funding from the international community to tackle malaria in the last few years.1,2 This has led to a rapid scaling up of malaria control measures in many countries, especially Africa.3,4 This has supported the expansion of malaria control interventions, such as the procurement and distribution of artemisinin-based combination therapy and other antimalarial drugs, insecticide-treated bed nets, and other mosquito vector control strategies.5 Without a licensed vaccine, chemoprophylaxis and chemotherapy play a central role in combating malaria infections,6 and will continue to do so for the foreseeable future.7 Emergence of rapid drug resistance has proven challenging and tends to derail progress made towards malaria control, despite changes in policies that govern treatment of uncomplicated malaria.8–10 Therapeutic efficacy studies are the gold standard for measuring antimalarial drug resistance and drug efficacy. However, the simplicity, robustness, and scalability of molecular resistance markers make them an attractive substitute for efficacy studies. Molecular markers have been used by policy makers as part of evidence in decision-making for malaria drug treatment policies11–15 and to monitor changes in parasite drug susceptibility following implementation of new policies.16
Mutations that confer resistance can lower the fitness of resistant parasites relative to sensitive ones when drug pressure declines, imposing a genetic “cost” of resistance to the mutant population.17 Studies have demonstrated that a rapid shift in the genetic parasite populations does occur once the drug pressure is withdrawn.17–19 This event is most likely to be explained by the fitness cost incurred as a result of drug resistance. The genetic changes that occur during the period when drug treatment policy for specific drug regimens is changed or implemented20 define a critical role of drug pressure in evolutionary host–parasite adaptation. Another factor that might play a critical role in this evolutionary adaptation is the environment. In areas of seasonal malaria transmission, studies have shown seasonal fluctuation in the frequencies of drug-resistant alleles, which tend to be lower during the wet season when compared with the dry season.21–24
Understanding of persistence and fluctuation of drug-resistant and drug-sensitive parasites during the dry season (especially in an almost therapy-free environment) in areas of seasonal transmission is of great importance and particularly relevant to the question of costs of drug resistance.22,23 This information is useful in establishing disease eradication interventions. However, similar data from holoendemic regions with year-round transmission that would be useful in accounting for other factors that influence drug resistance polymorphisms besides drug pressure are lacking.
Diversity of the Plasmodium falciparum population in the natural environment plays a critical role in facilitating immune escape and overcoming chemotherapeutic agents.25–29 Parasite diversity is influenced by the transmission intensity and level of endemicity,30,31 and the inherent polymorph flexibility is mediated by rapid allele changes.28 The parasite population structure in holoendemic areas shows multiplicity of infections owing to elevated host immunity and chemotherapeutic drug pressure. Theoretical studies describe the emergence of resistance in South East Asia as a product of low immunity selecting resistant strains.32 These factors influence the parasite’s attempt to establish a balance of fitness and virulence across seasons,28,33 implying a resource allocation dilemma34 as exemplified by delayed clearance of drug-resistant genotypes during treatment follow-up.35,36
We have previously reported P. falciparum genotype prevalence as either cross-section or trends within stipulated periods of time.37–40 Data from these studies were reported as clusters of periods between 2 and 5 years. Similarly, studies generating data that form the basis of mathematical modeling are usually reported as intercepts within broad linear correlates, summarizing trends and depicting gradual changes in drug susceptibility or prevalence of single nucleotide polymorphisms (SNPs).41–43 In most studies, temporal changes are depicted in clusters of periods, mostly 1 year or more. In addition, most of these data do not explicitly indicate the months of the year when the data were collected, so might not capture real-time transitions or dynamics of a parasite population throughout the year or over the cluster of a stipulated period. Such data just give an endpoint result, fail to capture real-time transitions or the dynamics of a parasite population, and might not depict accurate genetic events taking place. Such data also underestimate the role of natural environmental conditions (which fluctuate even in holoendemic areas) in outlining parasite–host interaction despite innovation of accurate disease prediction.33,44
In the current study, we monitored the persistence and/or fluctuation of drug-resistant and drug-sensitive parasite polymorphisms in a holoendemic region of Western Kenya from 2008 to 2012 on a monthly basis. Mutation analysis was done for P. falciparum multidrug resistance gene 1 (PfMDR1-N86Y) and chloroquine resistance transporter gene (Pfcrt-K76T) in samples collected from subjects presenting with noncomplicated malaria at Kisumu District Hospital. Polymorphisms in these positions have been shown to influence treatment outcomes.16 Environmental factors, including humidity, rainfall, and mean daily temperature, were also considered in the analysis. Previously, we reported dramatic changes in PfMDR1-N86Y and Pfcrt-K76T polymorphisms,38 but the role of weather and parasitemia was not addressed.
Materials and methods
Protocol, sites, subjects, and sample collection
This study was part of an epidemiology of malaria drug sensitivity pattern study approved by the Kenya Medical Research Institute and Walter Reed Army Institute of Research institutional review boards (protocols KEMRI 1330 and WRAIR 1384). The study site was the Kisumu District Hospital located in a lowland area holoendemic for malaria.45 Other site characteristics, subject enrollment, sample collection, and subject follow-ups have been published elsewhere.37
Data collection
Upon reaching the malaria drug resistance laboratory, P. falciparum DNA was extracted from whole blood using a Qiagen DNA Blood Mini Kit (Qiagen Inc., Alameda, CA, USA), according to the manufacturer’s instructions. SNP identification at positions K76T of the Pfcrt gene and N86Y, W184F, S1034C, and N1042D of the PfMDR1 gene were performed as previously described.37 Diagnosis of malaria and quantification of parasitemia was performed as described earlier in literature.46 Data on climatic variables were obtained from Tutiempo,47 as measurements of mean daily temperature, percentage humidity, and precipitation.
Data analysis
Prism version 4.0 software for Windows (Graphpad Software, San Diego, CA, USA) and Sigma Plot 12 (Systat Software Inc., Chicago, IL, USA) were used to perform the data analysis, including descriptive and correlation statistics. Descriptive statistics were used to describe changes in climatic variables and genotype prevalence. For correlation, logistic regression was performed between each climatic variable versus parasite genotype or parasitemia using Stata version 12 software (Stata Corporation, College Station, TX, USA). The univariate and multivariate models were run with the 76 mutant (M) and 86 M set as reference.
Results
Longitudinal monthly distribution of parasite drug resistance polymorphism
Eight hundred and ninety-five field isolates from Kisumu District Hospital were analyzed for polymorphism at codon 76 and 86 for 53 continuous months starting March 2008 through August 2012. The numbers of isolates analyzed per year were as follows: 2008 (n=169), 2009 (n=161), 2010 (n=216), 2011 (n=223), and 2012 (n=126). The analysis revealed that most isolates contained either wild-type (W), M or a mixture of both (WM) alleles. The mean percentage isolates that contained W, M, or WM at codon 76 in each month over the 53-month period were 17.22, 37.32, and 32.92, respectively, whereas for codon 86, these figures were 62.98, 16.67, and 13.59, respectively. Codon 76 had a higher frequency of mutant alleles than codon 86. The 76 W allele showed higher fluctuation (coefficient of variation 106%) than the 86 W allele (coefficient of variation 36%). Other PfMDR1 gene codons showed low variation (data not shown).
Trends in codon 76 single nucleotide polymorphisms
The data show that the frequency of 76 M declined over the 53 months of the study. The mean percentage aggregate polymorphisms (± standard deviation) for the entire period for codon 76 was as follows: 23.19±24.49, 43.98±28.51, and 32.8±21.43 for W, M, and WM, respectively. The mean percentage (± standard deviation) for 2008 was 5.2±4, 68.4±15, and 26.5±16, whereas for 2012, it was 26.9±25, 29.8±18, and 43.3±15 for W, M, and WM, respectively, as shown in Table 1. There was a dramatic increase in the 76 W allele and a decrease in the 76 M allele from 2008 to 2012, as shown by the strong negative relationship coefficient of correlation (−0.7920). However, the monthly distribution of the polymorphism for parasite drug resistance varied from month to month (Figure 1). For example, the frequency of the 76 W allele was 48% in June 2010 but dropped to 8% in August, and to 0% in the following 2 months. This was followed by an increase to 100% in November of the same year. The frequency of the 76 W allele decreased from 41% to 3% between November 2011 and January 2012, before increasing to 67% 3 months later. The frequency of the 76 M allele dropped from 89% in May 2009 to 21% in June 2009, only to increase again to 55% the following month. Another large variation was seen in September and October 2010, when 76 M was at 100% for 2 months, only to drop to 0% in November. In 2011, the frequency of 76 M increased from 0% in September to 67% in December.
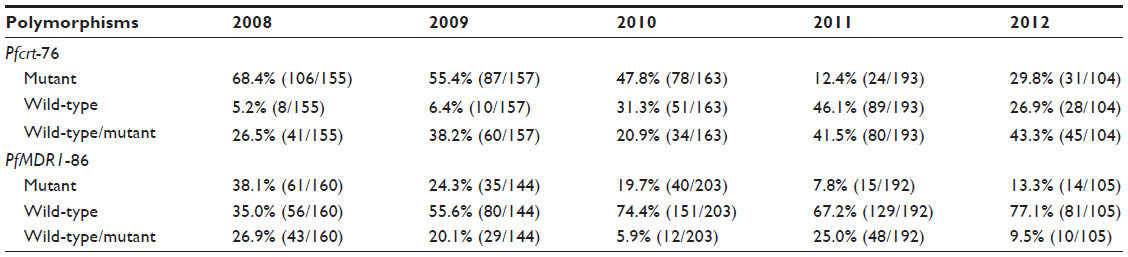 | Table 1 Percentage genotype frequencies of Pfcrt-76 and PfMDR1-86 polymorphisms between March 2008 and July 2012 with number of samples/total annual samples |
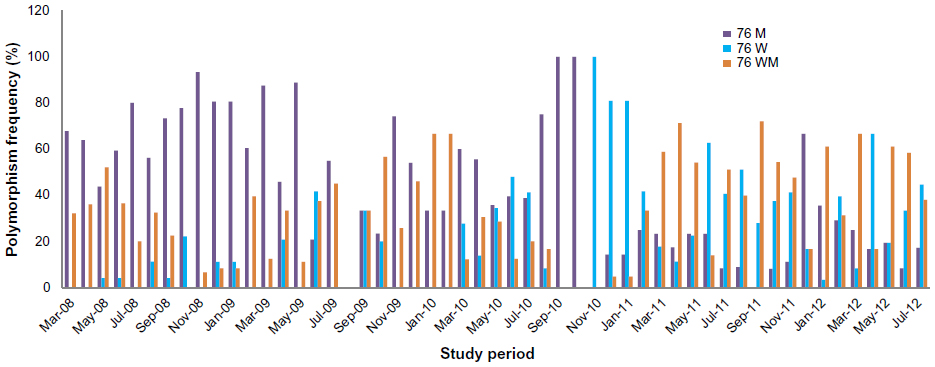 | Figure 1 Monthly frequency of genetic polymorphisms in codon 76 of the Pfcrt gene. |
Trends in codon 86 single nucleotide polymorphisms
The frequency of the codon 86 polymorphism showed a trend similar to that of the codon Pfcrt-76 polymorphism over the 53 months of the study. The mean percentage (± standard deviation) for the study period was 61.30±19.8, 21.39±12.69, and 17.43±14.54 for W, M, and WM, respectively. In 2008 (a total of 10 months), the mean percentage (± standard deviation) was 35.0%±10, 38.1±13, and 26.9±8, whereas for 2012, it was 77.1±17, 13.3±9, and 9.5±5 for W, M, and WM, respectively. The 86 W allele was at 80% in July 2008, but dropped to 14% in August before gradually rising to 32% and 55% in September and October, respectively. In May 2009, the 86 W frequency again fell to 16% before rising to 100% 2 months later. In March 2012, the frequency of 86 W was 100% but dropped to 50% by June. In March 2012, the frequency of 86 M decreased to 0% from 13% in the previous month but rose to 31% by July 2012. Similar wide variations were present for the 86 WM allele. For example, in December 2011, the frequency of 86 WM was 0%, rising to 17% in January 2012, only to drop again to 0% in the months of March and April in 2012. This increased dramatically to 25% by June, only to drop back to 0% by July 2012.
Parasitemia
Parasitemia for the 891 samples over the study period was evaluated as the percentage of infected red blood cells per total red blood cells. The mean percentage parasitemia was 2.61%±1.01% (coefficient of variation 115.86%) for the entire study period. Mean parasitemia was comparable at the beginning and end of the study (P>0.05); in 2008, it was 2.80%±0.8% whereas in 2012 it was 2.56%±0.95%. Assessment of monthly parasitemia showed wide fluctuation, with May 2010 and October 2010 being the lowest and highest, respectively.
Changes in climatic conditions
The climatic conditions for Kisumu during the study period are summarized in Table 2 as the annual mean ± standard deviation. The temperature, humidity, and precipitation were 29.2°C±0.9°C, 70.4%±3.9%, and 125.7±61.7 mm, respectively, at the beginning of the study in 2008 and 29.9°C±2.1°C, 65.9%±11.1%, and 113.7±108.1 mm, at the end of the study in 2012.
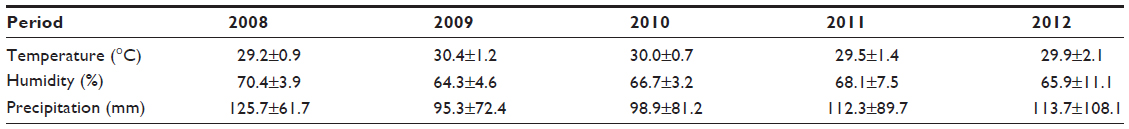 | Table 2 Summary of climatic conditions in Kisumu between March 2008 and July 2012 |
Correlation between parasitemia and climatic factors
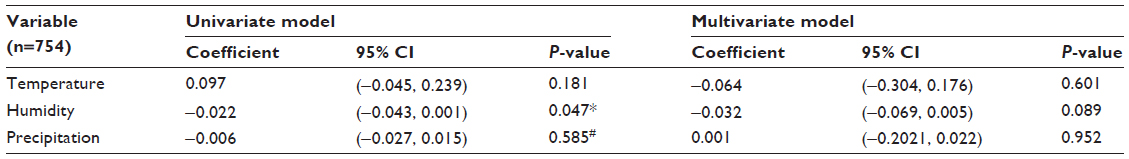
Tables 3–5 show the linear regression performed using the Spearman rank correlation to test for a correlation between initial parasitemia and climatic conditions, including the precipitation, temperature, and humidity prevailing at the time of sample collection. These factors influence disease transmission, and were investigated alongside parasitemia at the onset of clinical symptoms of the disease. Parasitemia and humidity profiles for the period are summarized in Figure 2. In a univariate model, initial parasitemia correlated significantly with humidity (Spearman rank coefficient −0.022, P=0.047).
 | Table 3 Regression analysis for climatic factors and initial parasitemia |
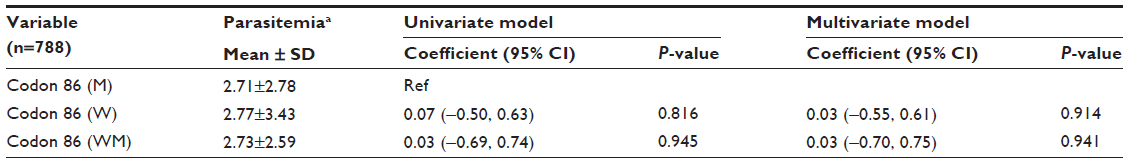 | Table 4 Regression analysis for initial parasitemia and parasite genotype (codon 86) |
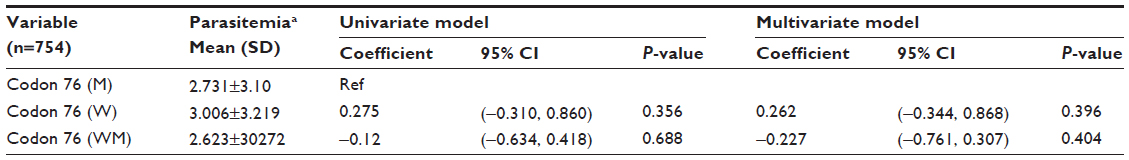 | Table 5 Regression analysis for initial parasitemia and parasite genotype (codon 76) |
 | Figure 2 Humidity and parasitemia between March 2008 and July 2012. |
Precipitation and SNP prevalence
Of the 53 months, January 2012 (0 mm), July 2010 (7.62 mm), and June 2010 (16.77 mm) were the driest, while August 2011 (349 mm), April 2012 (307.08 mm), and April 2010 (303.27 mm) were the wettest. Thus, apart from June and July 2010, there were no back to back dry months exceeding one month that went without precipitation. No correlation was observed between climatic factors present at the time of sample collection and codon 76 and 86 allele polymorphisms (P>0.05).
Linear regression was performed to test for an independent association between parasitemia and codon 86 and 76 polymorphisms. There was no correlation between parasitemia and polymorphism at codon 86. Similar trends were observed with codon 76 M and 76 WM. However, codon 76 W showed elevated mean parasitemia compared with 76 M and 76 WM (3.006%±3.219%; Table 5). This observation shows that no specific allele was associated with elevated parasitemia.
Discussion
P. falciparum polymorphisms
P. falciparum infections exhibit genetic diversity that is an aggregate of ecological factors and host–parasite interactions.28,30,48 Although a common origin has been proposed for P. falciparum,49–51 parasite traits are in a state of continual change, unique to disease habitat.18,22,28,52 Understanding trends in genotype frequency is useful in disease management.20,51 Our data on the real-time dynamics of the PfMDR1 gene codon 86 and Pfcrt gene codon 76 allele frequencies in a natural environment reveals dramatic fluctuations across time in the course of their decline or ascension.
PfMDR1-86 and Pfcrt-76 polymorphisms
Longitudinal monitoring of codon 76 and 86 alleles across 53 months showed high fluctuation, indicative of immense P. falciparum genotype variability (coefficient of variation 36–106, Table 1 and Figure 1). The net change in allele frequency, described as the difference between the frequency at the beginning and end of the study, was five-fold and two-fold for 76 W and 86 W, with an inverse two-fold reduction for 76 M and 86 M, respectively. PfMDR1 codons 184, 1034 showed similar trends (data not shown). Concurrently, 76 WM had a two-fold increase in frequency while 86 WM decreased two-fold. The gross effect of these changes indicated a transition towards wild-type for both alleles. However, it is noteworthy that there were months with a more than 50-fold fluctuation in frequency for both alleles. This observation is somewhat interesting in the view of the perception that genotype frequency changes during a drug policy period are the product of drug pressure,16,51,53 precipitating a perception of a somewhat linear trend.
During the 53 months, the codon 76 W allele was lost for 14 months, 76 WM for 4 months, 86 M for 4 months, and 86 WM for 9 months, while 76 M and 86 W were stable at variable frequencies (Figure 1). Most conspicuous was K76, which was lost in October 2009 and reappeared in March 2010, gradually rising to 100% in the subsequent 6 months. The 6-month period of increasing 76 W caused changes in allele frequencies. Similar tendencies were observed for codon 86 in December 2010 to March 2011, separated with the fact that this genotype passed difference in the wild-type genotype to mixed infection rather that the mutant genotype. The scale of changes and the rate at which they occurred in this study area are somewhat dramatic (Figures 1 and 2, Table 1), bringing into focus the validity of findings from cross-sectional studies in high transmission that span across few months.
Climatic factors and malaria
The Lake Victoria basin of Kenya is classified as a holoendemic malaria zone with an asymptomatic malaria rate of 50%.54 The high mean parasitemia of 2.6% indicates high immunity. Interestingly, parasitemia remained stable during the study period, despite increased access to Coartem® (an artemether/lumefantrine combination) during this period.55,56 Parasitemia has been shown to be protective and to prevent development of clinical malaria,57,58 confirmed by development of symptoms upon emergence of new strains.59,60 For the results of the current study, we suggest that humidity could be a confounder in the development of clinical malaria or treatment-seeking habits in Kisumu due to the significant negative correlation (P=0.047).
Rainfall and temperature showed no correlation with parasitemia. Shanks et al reported that, although temperature is useful in vector longevity, parasite development in vector and transmission to humans; it does not correlate with parasitemia or clinical symptoms of malaria.61 It has also been established that although precipitation modulates humidity and temperature that are key in transmission, it does not affect the parasite directly.62 The lack of change across rainy seasons suggests genotype stability. Although environmental factors have been associated with changes in P. falciparum genotype in areas with distinct seasons, it is apparent that holoendemic areas need other factors to warrant genotype change.
Genetic changes that occur during the policy period of specific drug regimens and are lost upon withdrawal18,20 have defined the central role of drug pressure in host–parasite evolutionary adaptation. The role of environmental factors in shaping parasite genetics has been described by studies in regions with distinct transmission seasons.52,63 This study bridges the gap by providing real-time information on gene dynamics in a holoendemic, high transmission area with short erratic dry spells. Interestingly, it shows that there is no association between precipitation and PfMDR1-86 or Pfcrt-76 polymorphisms.
Conclusion
Fluctuation in SNPs occurred in Kenya during the study period, although there was only one policy that recommended medication as the principal source of drug pressure. This fluctuation suggests that there could be other factors besides drug pressure driving changes in PfMDR1-86 and Pfcrt-76 polymorphisms. Due to high variability, apparent from the monthly changes in frequencies, it is imperative that data originating from cross-sectional studies spanning across a limited number of months in a year be reported as a specific period status, and not intercepts of a predictable trend.
This study was based in a hospital outpatient department, and recruited individuals seeking treatment for symptomatic malaria. The mean parasitemia of 2.6% was rather high, and did not decrease across the study period despite increased access to Coartem during this time. This confirms that the rate of asymptomatic malaria is rather high, adding to empirical evidence suggesting that the malaria parasite has evolved alongside humanity in the region for centuries. In holoendemic areas, it has been shown that the parasite is capable of remaining in the blood system without causing symptoms of disease, subject to changes in factors influencing the host–parasite ecosystem equilibrium interface.58 This is underscored by the fact that parasitemia remained high during the study period, despite increased penetration of Coartem treatment.
Acknowledgments
We thank Dr R Rashid, KEMRI Center for Clinical Research, Dr Tom Logan, USAMRU-K, and John M Vulule, KEMRI Center for Global Health Research, for supporting this study and giving their permission to publish these data. We also thank all clinical staff at Kisumu East District Hospitals for their assistance. This work was supported by the US Department of Defense, Global Emerging Infections Surveillance and Response System, Silver Spring, MD, USA.
Author contributions
HMA participated in study design, laboratory oversight, manuscript writing, and data analysis and interpretation.
AOA carried out molecular assays, drafting the manuscript or revising it critically for important intellectual content, and final manuscript approval. FLE participated in laboratory oversight, revising manuscript critically for important intellectual content, and final manuscript approval.
DWJ and LI participated in data analysis and molecular assays, manuscript revision, and final approval of the version to be published. ACC performed data analysis, revising the manuscript critically for important intellectual content, and final approval of the version to be published. DO undertook sample processing, manuscript revising, study design, and final approval of manuscript. EAO and CM undertook manuscript revision, acquisition of data, manuscript revising, and final approval of the version to be published. CO performed molecular assays, acquisition of data, manuscript revising, and final approval of version to be published. RY undertook data analysis and molecular assays, manuscript revising, and final approval of version to be published. BA undertook protocol oversight, manuscript writing, conception and design, data analysis and interpretation, and final approval of the version to be published. JDJ and EK participated in protocol oversight, manuscript writing and revision, final approval of version to be published, conception and design of study, and data analysis and interpretation. All authors are in agreement to be accountable for all aspects of the work in ensuring that questions related to the accuracy or integrity of any part of the work are appropriately investigated and resolved.
Disclosure
The authors report no competing interests in this work. The opinions and assertions contained in this work are the private views of the authors and are not to be construed as official or as reflecting the views of the US Department of the Army or the Department of Defense.
References
Institute for Health Metrics and Evaluation. Financing Global Health 2010: Development assistance and country spending in economic uncertainty. Seattle, WA, USA: Institute for Health Metrics and Evaluation; 2010. Available from: http://www.healthdata.org/policy-report/financing-global-health-2010-development-assistance-and-country-spending-economic. Accessed August 12, 2014. | |
Ravishankar N, Gubbins P, Cooley RJ, et al. Financing of global health: tracking development assistance for health from 1990 to 2007. Lancet. 2009;373(9681):2113–2124. | |
Flaxman AD, Fullman N, Otten MW Jr, et al. Rapid scaling up of insecticide-treated bed net coverage in Africa and its relationship with development assistance for health: a systematic synthesis of supply, distribution, and household survey data. PLoS Med. 2010;7(8):e1000328. | |
World Health Organization. World Malaria Report 2010. Available from: http://www.who.int/malaria/world_malaria_report_2010/worldmalariareport2010.pdf. Accessed March 10, 2013. | |
Johansson E, Cibulskis R, Steketee R. Malaria funding and resource utilization: the first decade of roll back malaria. In: Roll Back Malaria Progress and Impact Series. Number 1. Geneva, Switzerland: World Health Organization; 2010. Available from: http://www.rollbackmalaria.org/ProgressImpactSeries/docs/RBMMalariaFinancingReport-en.pdf. Accessed August 13, 2014. | |
D’Alessandro U. Existing antimalarial agents and malaria-treatment strategies. Expert Opin Pharmacother. 2009;10(8):1291–1306. | |
Muller IB, Hyde JE. Antimalarial drugs: modes of action and mechanisms of parasite resistance. Future Microbiol. 2011;5(12):1857–1873. | |
Bloland PB, Lackritz EM, Kazembe PN, Were JB, Steketee R, Campbell CC. Beyond chloroquine: implications of drug resistance for evaluating malaria therapy efficacy and treatment policy in Africa. J Infect Dis. 1993;167(4):932–937. | |
Mubyazi GM, Gonzalez-Block MA. Research influence on antimalarial drug policy change in Tanzania: case study of replacing chloroquine with sulfadoxine-pyrimethamine as the first-line drug. Malar J. 2005;4:51. | |
Talisuna AO, Bloland P, D’Alessandro U. History, dynamics, and public health importance of malaria parasite resistance. Clin Microbiol Rev. 2004;17(1):235–254. | |
Denis MB, Tsuyuoka R, Lim P, et al. Efficacy of artemether-lumefantrine for the treatment of uncomplicated falciparum malaria in northwest Cambodia. Trop Med Int Health. 2006;11(12):1800–1807. | |
Djimde AA, Dolo A, Ouattara A, Diakite S, Plowe CV, Doumbo OK. Molecular diagnosis of resistance to antimalarial drugs during epidemics and in war zones. J Infect Dis. 2004;190(4):853–855. | |
Mugittu K, Ndejembi M, Malisa A, et al. Therapeutic efficacy of sulfadoxine-pyrimethamine and prevalence of resistance markers in Tanzania prior to revision of malaria treatment policy: Plasmodium falciparum dihydrofolate reductase and dihydropteroate synthase mutations in monitoring in vivo resistance. Am J Trop Med Hyg. 2004;71(6):696–702. | |
Rojanawatsirivej C, Vijaykadga S, Amklad I, Wilairatna P, Looareesuwan S. Monitoring the therapeutic efficacy of antimalarials against uncomplicated falciparum malaria in Thailand. Southeast Asian J Trop Med Public Health. 2003;34(3):536–541. | |
Alker AP, Lim P, Sem R, et al. Pfmdr1 and in vivo resistance to artesunate-mefloquine in falciparum malaria on the Cambodian-Thai border. Am J Trop Med Hyg. 2007;76(4):641–647. | |
Kublin JG, Cortese JF, Njunju EM, et al. Reemergence of chloroquine-sensitive Plasmodium falciparum malaria after cessation of chloroquine use in Malawi. J Infect Dis. 2003;187(12):1870–1875. | |
Hastings IM, Donnelly MJ. The impact of antimalarial drug resistance mutations on parasite fitness, and its implications for the evolution of resistance. Drug Resist Updat. 2005;8(1–2):43–50. | |
Laufer MK, Takala-Harrison S, Dzinjalamala FK, Stine OC, Taylor TE, Plowe CV. Return of chloroquine-susceptible falciparum malaria in Malawi was a reexpansion of diverse susceptible parasites. J Infect Dis. 2006;202(5):801–808. | |
Walliker D, Hunt P, Babiker H. Fitness of drug-resistant malaria parasites. Acta Trop. 2005;94(3):251–259. | |
Laufer MK, Plowe CV. Withdrawing antimalarial drugs: impact on parasite resistance and implications for malaria treatment policies. Drug Resist Updat. 2004;7(4–5):279–288. | |
Abdel-Muhsin AM, Mackinnon MJ, Ali E, et al. Evolution of drug-resistance genes in Plasmodium falciparum in an area of seasonal malaria transmission in Eastern Sudan. J Infect Dis. 2004;189(7):1239–1244. | |
Babiker HA, Hastings IM, Swedberg G. Impaired fitness of drug-resistant malaria parasites: evidence and implication on drug-deployment policies. Expert Rev Anti Infect Ther. 2009;7(5):581–593. | |
Babiker HA, Satti G, Ferguson H, Bayoumi R, Walliker D. Drug resistant Plasmodium falciparum in an area of seasonal transmission. Acta Trop. 2005;94(3):260–268. | |
Ord R, Alexander N, Dunyo S, et al. Seasonal carriage of pfcrt and pfmdr1 alleles in Gambian Plasmodium falciparum imply reduced fitness of chloroquine-resistant parasites. J Infect Dis. 2007;196(11):1613–1619. | |
Ferreira MU, da Silva Nunes M, Wunderlich G. Antigenic diversity and immune evasion by malaria parasites. Clin Diagn Lab Immunol. 2004;11(6):987–995. | |
Imwong M, Dondorp AM, Nosten F, et al. Exploring the contribution of candidate genes to artemisinin resistance in Plasmodium falciparum. Antimicrob Agents Chemother. 2010;54(7):2886–2892. | |
Mackinnon MJ, Marsh K. The selection landscape of malaria parasites. Science. 2010;328(5980):866–871. | |
Rich SM, Ayala FJ. Population structure and recent evolution of Plasmodium falciparum. Proc Natl Acad Sci USA. 2000;97(13):6994–7001. | |
Volkman SK, Sabeti PC, DeCaprio D, et al. A genome-wide map of diversity in Plasmodium falciparum. Nat Genet. 2007;39(1):113–119. | |
Anderson TJ, Haubold B, Williams JT, et al. Microsatellite markers reveal a spectrum of population structures in the malaria parasite Plasmodium falciparum. Mol Biol Evol. 2000;17(10):1467–1482. | |
Mwingira F, Nkwengulila G, Schoepflin S, et al. Plasmodium falciparum msp1, msp2 and glurp allele frequency and diversity in sub-Saharan Africa. Malar J. 2011;10:79. | |
Artzy-Randrup Y, Alonso D, Pascual M. Transmission intensity and drug resistance in malaria population dynamics: implications for climate change. PLoS One. 2010;5(10):e13588. | |
Williams PD. Darwinian interventions: taming pathogens through evolutionary ecology. Trends Parasitol. 2010;26(2):83–92. | |
Reece SE, Ali E, Schneider P, Babiker HA. Stress, drugs and the evolution of reproductive restraint in malaria parasites. Proc Biol Sci. 2010;277(1697):3123–3129. | |
Bretscher MT, Valsangiacomo F, Owusu-Agyei S, Penny MA, Felger I, Smith T. Detectability of Plasmodium falciparum clones. Malar J. 2010;9:234. | |
Lee SA, Yeka A, Nsobya SL, et al. Complexity of Plasmodium falciparum infections and antimalarial drug efficacy at 7 sites in Uganda. J Infect Dis. 2006;193(8):1160–1163. | |
Akala HM, Eyase FL, Cheruiyot AC, et al. Antimalarial drug sensitivity profile of Western Kenya Plasmodium falciparum field isolates determined by a SYBR Green I in vitro assay and molecular analysis. Am J Trop Med Hyg. 2011;85(1):34–41. | |
Eyase FL, Akala HM, Ingasia L, et al. The role of Pfmdr1 and Pfcrt in changing chloroquine, amodiaquine, mefloquine and lumefantrine susceptibility in Western-Kenya. P. falciparum samples during 2008–2011. PLoS One. 2013;8(5):e64299. | |
Mbaisi A, Liyala P, Eyase F, et al. Drug susceptibility and genetic evaluation of Plasmodium falciparum isolates obtained in four distinct geographical regions of Kenya. Antimicrob Agents Chemother. 2004;48(9):3598–3601. | |
Spalding MD, Eyase FL, Akala HM, et al. Increased prevalence of the pfdhfr/phdhps quintuple mutant and rapid emergence of pfdhps resistance mutations at codons 581 and 613 in Kisumu, Kenya. Malar J. 2010;9:338. | |
Iriemenam NC, Shah M, Gatei W, et al. Temporal trends of sulphadoxine-pyrimethamine (SP) drug-resistance molecular markers in Plasmodium falciparum parasites from pregnant women in western Kenya. Malar J. 2012;11:134. | |
Klein EY, Smith DL, Laxminarayan R, Levin S. Superinfection and the evolution of resistance to antimalarial drugs. Proc Biol Sci. 2012;279(1743):3834–3842. | |
Menard S, Morlais I, Tahar R, et al. Molecular monitoring of Plasmodium falciparum drug susceptibility at the time of the introduction of artemisinin-based combination therapy in Yaounde, Cameroon: implications for the future. Malar J. 2012;11:113. | |
Githeko AK, Ototo EN, Guiyun Y. Progress towards understanding the ecology and epidemiology of malaria in the western Kenya highlands: opportunities and challenges for control under climate change risk. Acta Trop. 2012;121(1):19–25. | |
Malakooti MA, Biomndo K, Shanks GD. Reemergence of epidemic malaria in the highlands of western Kenya. Emerg Infect Dis. 1998;4(4):671–676. | |
Planche T, Krishna S, Kombila M, et al. Comparison of methods for the rapid laboratory assessment of children with malaria. Am J Trop Med Hyg. 2001;65(5):599–602. | |
TuTiempo.net. Climate Kisumu. Available from: http://www.tutiempo.net/en/Climate/Kisumu/01-2008/637080.htm. Accessed August 12, 2014. | |
Manske M, Miotto O, Campino S, et al. Analysis of Plasmodium falciparum diversity innatural infections by deep sequencing. Nature. 2012;487(7407):375–379. | |
Joy DA, Feng X, Mu J, et al. Early origin and recent expansion of Plasmodium falciparum. Science. 2003;300(5617):318–321. | |
Tanabe K, Mita T, Jombart T, et al. Plasmodium falciparum accompanied the human expansion out of Africa. Curr Biol. 2010;20(14):1283–1289. | |
Tanabe K, Mita T, Palacpac NM, et al. Within-population genetic diversity of Plasmodium falciparum vaccine candidate antigens reveals geographic distance from a Central sub-Saharan African origin. Vaccine. 2013;31(9):1334–1339. | |
Babiker HA. Seasonal fluctuation of drug-resistant malaria parasites: a sign of fitness cost. Trends Parasitol. 2009;25(8):351–352. | |
Laufer MK, Thesing PC, Eddington ND, et al. Return of chloroquine antimalarial efficacy in Malawi. N Engl J Med. 2006;355(19):1959–1966. | |
Zhou G, Afrane YA, Vardo-Zalik AM, et al. Changing patterns of malaria epidemiology between 2002 and 2010 in Western Kenya: the fall and rise of malaria. PLoS One. 2011;6(5):e20318. | |
Kangwana BB, Njogu J, Wasunna B, et al. Malaria drug shortages in Kenya: a major failure to provide access to effective treatment. Am J Trop Med Hyg. 2009;80(5):737–738. | |
Smith N, Obala A, Simiyu C, Menya D, Khwa-Otsyula B, O’Meara WP. Accessibility, availability and affordability of anti-malarials in a rural district in Kenya after implementation of a national subsidy scheme. Malar J. 2011;10:316. | |
Jakobsen PH, McKay V, N’Jie R, et al. Decreased antitoxic activities among children with clinical episodes of malaria. Infect Immun. 1998;66(4):1654–1659. | |
Ntoumi F, Contamin H, Rogier C, Bonnefoy S, Trape JF, Mercereau-Puijalon O. Age-dependent carriage of multiple Plasmodium falciparum merozoite surface antigen-2 alleles in asymptomatic malaria infections. Am J Trop Med Hyg. J 1995;52(1):81–88. | |
Contamin H, Fandeur T, Rogier C, et al. Different genetic characteristics of Plasmodium falciparum isolates collected during successive clinical malaria episodes in Senegalese children. Am J Trop Med Hyg. 1996;54(6):632–643. | |
Farnert A, Rooth I, Svensson, Snounou G, Bjorkman A. Complexity of Plasmodium falciparum infections is consistent over time and protects against clinical disease in Tanzanian children. J Infect Dis. 1999;179(4):989–995. | |
Shanks G, Biomndo K, Hay S, Snow R. Changing patterns of clinical malaria since 1965 among a tea estate population located in the Kenyan highlands. Trans R Soc Trop Med Hyg. 2000;94(3):253–255. | |
Ye Y, Louis VR, Simboro S, Sauerborn R. Effect of meteorological factors on clinical malaria risk among children: an assessment using village-based meteorological stations and community-based parasitological survey. BMC Public Health. 2007;7:101. | |
Roca-Feltrer A, Schellenberg JR, Smith L, Carneiro I. A simple method for defining malaria seasonality. Malar J. 2009;8:276. |
 © 2014 The Author(s). This work is published and licensed by Dove Medical Press Limited. The
full terms of this license are available at https://www.dovepress.com/terms.php
and incorporate the Creative Commons Attribution
- Non Commercial (unported, v3.0) License.
By accessing the work you hereby accept the Terms. Non-commercial uses of the work are permitted
without any further permission from Dove Medical Press Limited, provided the work is properly
attributed. For permission for commercial use of this work, please see paragraphs 4.2 and 5 of our Terms.
© 2014 The Author(s). This work is published and licensed by Dove Medical Press Limited. The
full terms of this license are available at https://www.dovepress.com/terms.php
and incorporate the Creative Commons Attribution
- Non Commercial (unported, v3.0) License.
By accessing the work you hereby accept the Terms. Non-commercial uses of the work are permitted
without any further permission from Dove Medical Press Limited, provided the work is properly
attributed. For permission for commercial use of this work, please see paragraphs 4.2 and 5 of our Terms.