Back to Journals » OncoTargets and Therapy » Volume 12
Five Hub Genes Can Be The Potential DNA Methylation Biomarkers For Cholangiocarcinoma Using Bioinformatics Analysis
Authors Chen D, Wu H, He B, Lu Y ![]() , Wu W, Liu H, Feng X, Chen J
, Wu W, Liu H, Feng X, Chen J ![]() , Wu J
, Wu J
Received 29 January 2019
Accepted for publication 20 September 2019
Published 11 October 2019 Volume 2019:12 Pages 8355—8365
DOI https://doi.org/10.2147/OTT.S203342
Checked for plagiarism Yes
Review by Single anonymous peer review
Peer reviewer comments 2
Editor who approved publication: Dr Sanjeev K. Srivastava
Diyu Chen,1–4 Hao Wu,1–3 Bin He,1–3 Yuejie Lu,1–3 Wenxuan Wu,1–3 Hua Liu,1–3 Xiaode Feng,1–3 Jianzhong Chen,4 Jian Wu1,5
1Division of Hepatobiliary and Pancreatic Surgery, Department of Surgery, First Affiliated Hospital, School of Medicine, Zhejiang University, Hangzhou 310003, Zhejiang, People’s Republic of China; 2Key Laboratory of Combined Multi-organ Transplantation, Ministry of Public Health, Hangzhou 310003, Zhejiang, People’s Republic of China; 3Key Laboratory of Organ Transplantation, Hangzhou 310003, Zhejiang, People’s Republic of China; 4Institute of Immunology, School of Medicine, Zhejiang University, Hangzhou 310058, Zhejiang, People’s Republic of China; 5Collaborative Innovation Center for Diagnosis Treatment of Infectious Diseases, Hangzhou 310003, Zhejiang, People’s Republic of China
Correspondence: Jianzhong Chen
Institute of Immunology, School of Medicine, Zhejiang University, No. 338 Yuhangtang Road, Hangzhou 310058, Zhejiang Province, People’s Republic of China
Tel/fax +86-57187342564
Email [email protected]
Jian Wu
Department of Hepatobiliary Surgery, The First Affiliated Hospital, Zhejiang University School of Medicine, No.79 Qingchun Road, Hangzhou 310003, Zhejiang Province, People’s Republic of China
Tel/fax +86-57187346656
Email [email protected]
Background: Cholangiocarcinoma (CCA) is a subtype of highly malignant hepatic tumor, which has low 5-year survival rate and poor clinical outcome. Only a few patients can be detected early and accepted with the surgery. Most of CCA patients are diagnosed in advanced stage, and the treatments are limited. As for the inoperable, advanced CCA patients, chemotherapy is the main treatment, due to lacking molecular targets, therapeutic effect is limited.
Materials and methods: To explore potential therapeutic targets for CCA, we analyzed three microarray datasets derived from the Gene Expression Omnibus (GEO) database. Then, we used GEO2R tools of NCBI to discover the differentially expressed genes (DEGs) from the CCA and normal liver tumor microarrays (TMA). Subsequently, we used the Database for Annotation, Visualization and Integrated Discovery (DAVID GO) to perform the Gene Ontology function (GO) and Kyoto Encyclopedia of Genes and Genomes (KEGG) analysis. Then, we carried out the Cytoscape software to search for the hub genes downregulated in CCA and identify the protein–protein interaction (PPI) of these genes. Besides, we used the GEPIA tool to evaluate the differential expressions of hub genes in CCA patients. Then, we also used MEXPRESS database to detect the promoter methylation levels of hub genes in CCA and normal tissue samples. In addition, we evaluated the expression of these genes in CCA lines and normal bile tract cells after 5-AZA (DNA methyltransferase inhibitor) treatment.
Results: A total of 115 downregulated DEGs were identified. Among them, 10 hub genes with a high degree of connectivity were picked out. Among these 10 hub genes, F2, AHSG, ALDH8A1, SERPIND1 and AGXT showed higher DNA methylation levels of promoter in CCA compared with normal liver tissues. Therefore, these 5 genes may be the potential DNA methylation biomarkers and therapeutic targets in CCA.
Keywords: cholangiocarcinoma, hub genes, expression profiling data, methylation
Introduction
Cholangiocarcinoma is featured with biliary epithelial differentiation. As the second most primary hepatic cancer, cholangiocarcinoma is rising globally.1 Nowadays, we classify CCA into three types based on anatomical location: intrahepatic cholangiocarcinoma (ICC), hilar cholangiocarcinoma and extrahepatic cholangiocarcinoma (ECC).2 ICC is a special cholangiocarcinoma kind which is located proximally to the bile ducts, identified to be a highly aggressive malignancy worldwide. Though the overall incidence is low, treatment options for ICC patients are limited.3 For advanced CCA patients, the chemotherapy regimen of gemcitabine and cisplatin is the main treatment. Unfortunately, most CCAs showed resistant to chemotherapy and relapse or metastasize quickly after chemotherapy treatment.4,5 Thus, it is for us to ascertain novel therapeutic targets and effective treatment options for this disease.
In carcinogenesis, methylation could be a symbolic event through epigenetic studies.6,7 Several kinds of methylation, such as promoter methylation and CpG island methylation, are strongly associated with CCA.8 Therefore, we tried to discover novel DNA methylation biomarkers in CCA patients and provide potential therapeutic targets for this indicating disease. Through analyzing GEO expression profiling data, we detected the downregulated genes between CCA and normal liver tissues. Gene Ontology (GO) functional annotation analysis and Kyoto Encyclopedia of Genes and Genomes (KEGG) pathway enrichment analyses were performed for the screened DEGs. Next, we used a protein–protein interaction (PPI) network to identify hub suppress genes related to CCA. Then, through MEXPRESS database, we performed methylation levels detection to find out that F2, AHSG, ALDH8A1, SERPIND1 and AGXT were higher methylated in promoter in CCA compared to normal samples. Besides, these results were also further proved in CCA cell lines using RT-PCR. Therefore, we put forward that these five genes may be the DNA methylation biomarkers in CCA.
Methods And Materials
Cell Culture
In this study, we used four kinds of CCA cell lines (CCLP-1, HuCCT-1, HCCC-9810, and RBE) and a normal human biliary epithelial cell line (HIBEC). We purchased these cell lines from Cell Bank of Type Culture Collection of Chinese Academy of Sciences (Shanghai, China). According to their supplier’s protocol, all cell lines were cultured in RPMI-1640 complete medium (Biological Industries, Kibbutz Beit-Haemek, Israel) supplied with 10% fetal bovine serum (FBS; Moregate Biotech, Brisbane, Australia) and were cultured in an incubator of 37°C and 5% CO2 environment.
Data Source
Datasets we analyzed in this research were obtained mainly from GEO database (http://www.ncbi.nlm.nih.gov/geo/) after searching for keywords related to CCA. Totally, we obtained 101 series about CCA from GEO database. Then, we selected three separate gene expression profiles (GSE107943, GSE26566, and GSE119337) for our study, about 228 human cholangiocarcinoma samples information were retrieved from these profiles. Among them, GSE107943 was based on the GPL18573 platform, GSE26566 was based on GPL6104, and GSE119337 was based on platform GPL11154.
Data Processing Of DEGs
In order to find out the DEGS between CCA and normal liver samples, we used the GEO2R online analysis tool in NCBI (https://www.ncbi.nlm.nih.gov/geo/geo2r/). We also used this tool to calculate the adjusted P-value and |logFC|. We considered the genes which meet cutoff standard requirements (adjusted P<0.05 and |logFC|≥2.0) as DEGs. Statistical analysis was carried out for each dataset. The Venn diagram was performed by using the web tool (bioinformatics.psb.ugent.be/webtools/Venn/).
GO And KEGG Pathway Analysis Of DEGs
Gene Ontology (GO) is used widely in functional annotation and enrichment analysis; biological process (BP), molecular function (MF), and cellular component (CC) are the three major components of gene function. KEGG is a database resource for collecting large number of data about molecular-level information, biological pathways, chemical substances which is generated by high-throughput experimental technologies. Through the Database for Annotation, Visualization and Integrated Discovery (DAVID) tools (https://david.ncifcrf.gov/), we carried out the GO annotation analysis and KEGG pathway enrichment analysis of DEGs. P<0.01 and gene counts≥10 were considered statistically significant.
PPI Network Construction And Hub Gene Identification
In order to obtain a PPI map, we upload the data of DEGs to the database analysis platform named Search Tool for the Retrieval of Interacting Genes (STRING). If the PPI pairs have the combined score >0.4, we extracted these pairs and visualize the PPI network using Cytoscape software (www.cytoscape.org/). Nodes with higher degree of connection, which were more essential for maintaining the stability of the entire network. The top 10 genes in the central index are considered to be core candidate genes.
RNA Isolation And Quantitative Real-Time PCR (qRT-PCR)
We isolated the total RNA using TRIzol reagent (TaKaRa, China) and then it was transcribed into cDNA using the PrimeScript RT Reagent Kit (TaKaRa, China). With an SYBR Green PCR Kit (Takara, China), the quantitative real-time PCR was carried out by an ABI 7500 FAST RT-PCR system (Applied Biosystems, USA). Relative quantification of mRNA expression was based on the 2ΔΔCt method after normalization to the endogenous reference GAPDH. Table S1 presented the primers we used in this research.
The Correlation Between Gene Expression And Methylation Around In The Promoter Region
MEXPRESS is a web tool which could offer the visualized analysis of clinical data, the expression (normalized RNASeqV2 value), and methylation TCGA and detect the relationship between them for one single gene in the specific tumor type. In this webtool, it executed the Pearson correlation to evaluate the difference between expression value and methylation level. When MEXPRESS faced with clinical parameter contains only two levels, the system will use a P value to compare the difference. The false discovery rate was used to correct for multiple comparisons.
Results
Identification Of DEGs
In this study, we selected three groups of gene expression profiles (GSE107943, GSE26566, and GSE119337). As shown in Table 1, GSE107943 contained 31 CCA specimens and 30 normal specimens, GSE26566 contained 104 CCA specimens and 65 normal liver specimens, and GSE119337 included 30 CCA samples and 30 normal liver samples. Matched with the criteria of P<0.05 and |logFC|≥2, 576 upregulated genes and 851 downregulated genes were identified through comparing the CCA specimens to liver normal specimens. In GSE26566 expression profile, 1076 DEGs were identified; 463 genes were upregulated and 613 genes were downregulated. And from GSE65194 dataset, 586 DEGs including 212 upregulated genes and 374 downregulated genes were discovered. The DEGs levels were illustrated by Heatmap in Figure S1. Subsequently, we carried out Venn analysis to get the intersection of the DEG profiles. On the whole, 115 DEGs were downregulated in all three groups (Figure 1A).
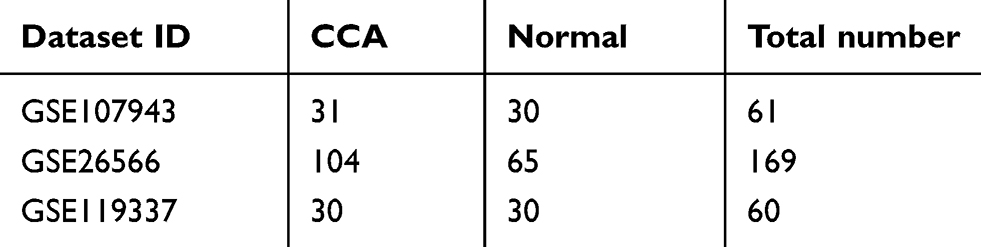 |
Table 1 Statistics Of The Three Microarray Databases Derived From The GEO Database |
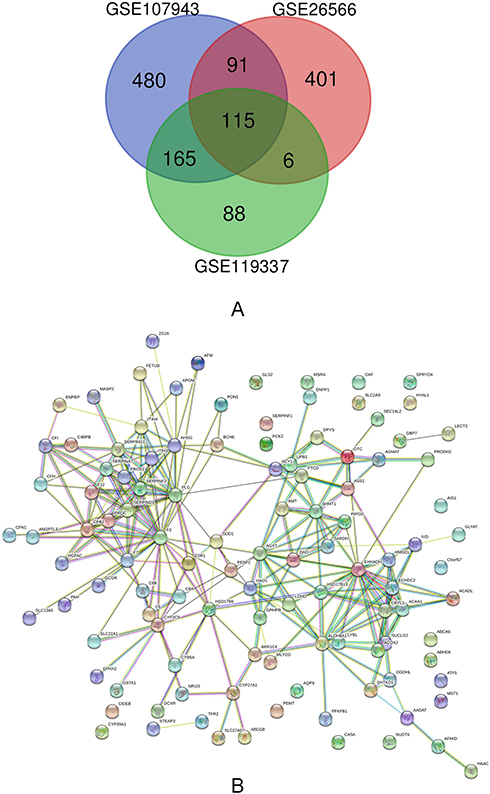 |
Figure 1 (A) Venn diagram of downregulated DEGs common to all three GEO datasets. (B) Protein–protein interaction network constructed with the differentially expressed genes. |
Functional Enrichment Analyses Of Downregulated DEGs
Then, we evaluate the downregulated DEGs biological functions in CCAs, GO function and KEGG pathway enrichment analysis were carried out by DAVID (Table 2). CC, BP, and MF ontologies are the three components of enriched GO terms. The GO analysis results showed that downregulated DEGs were mainly enriched in CCs, including extracellular exosome, extracellular space, mitochondrion, and blood microparticle. The results of MF analysis indicated that the downregulated DEGs were significantly enriched in serine-type endopeptidase activity, calcium ion binding, and serine-type endopeptidase inhibitor activity. In addition, terms associated with complement and coagulation cascades, metabolic pathways, peroxisome, and biosynthesis of antibiotics were obtained from the results of KEGG pathway enrichment analysis.
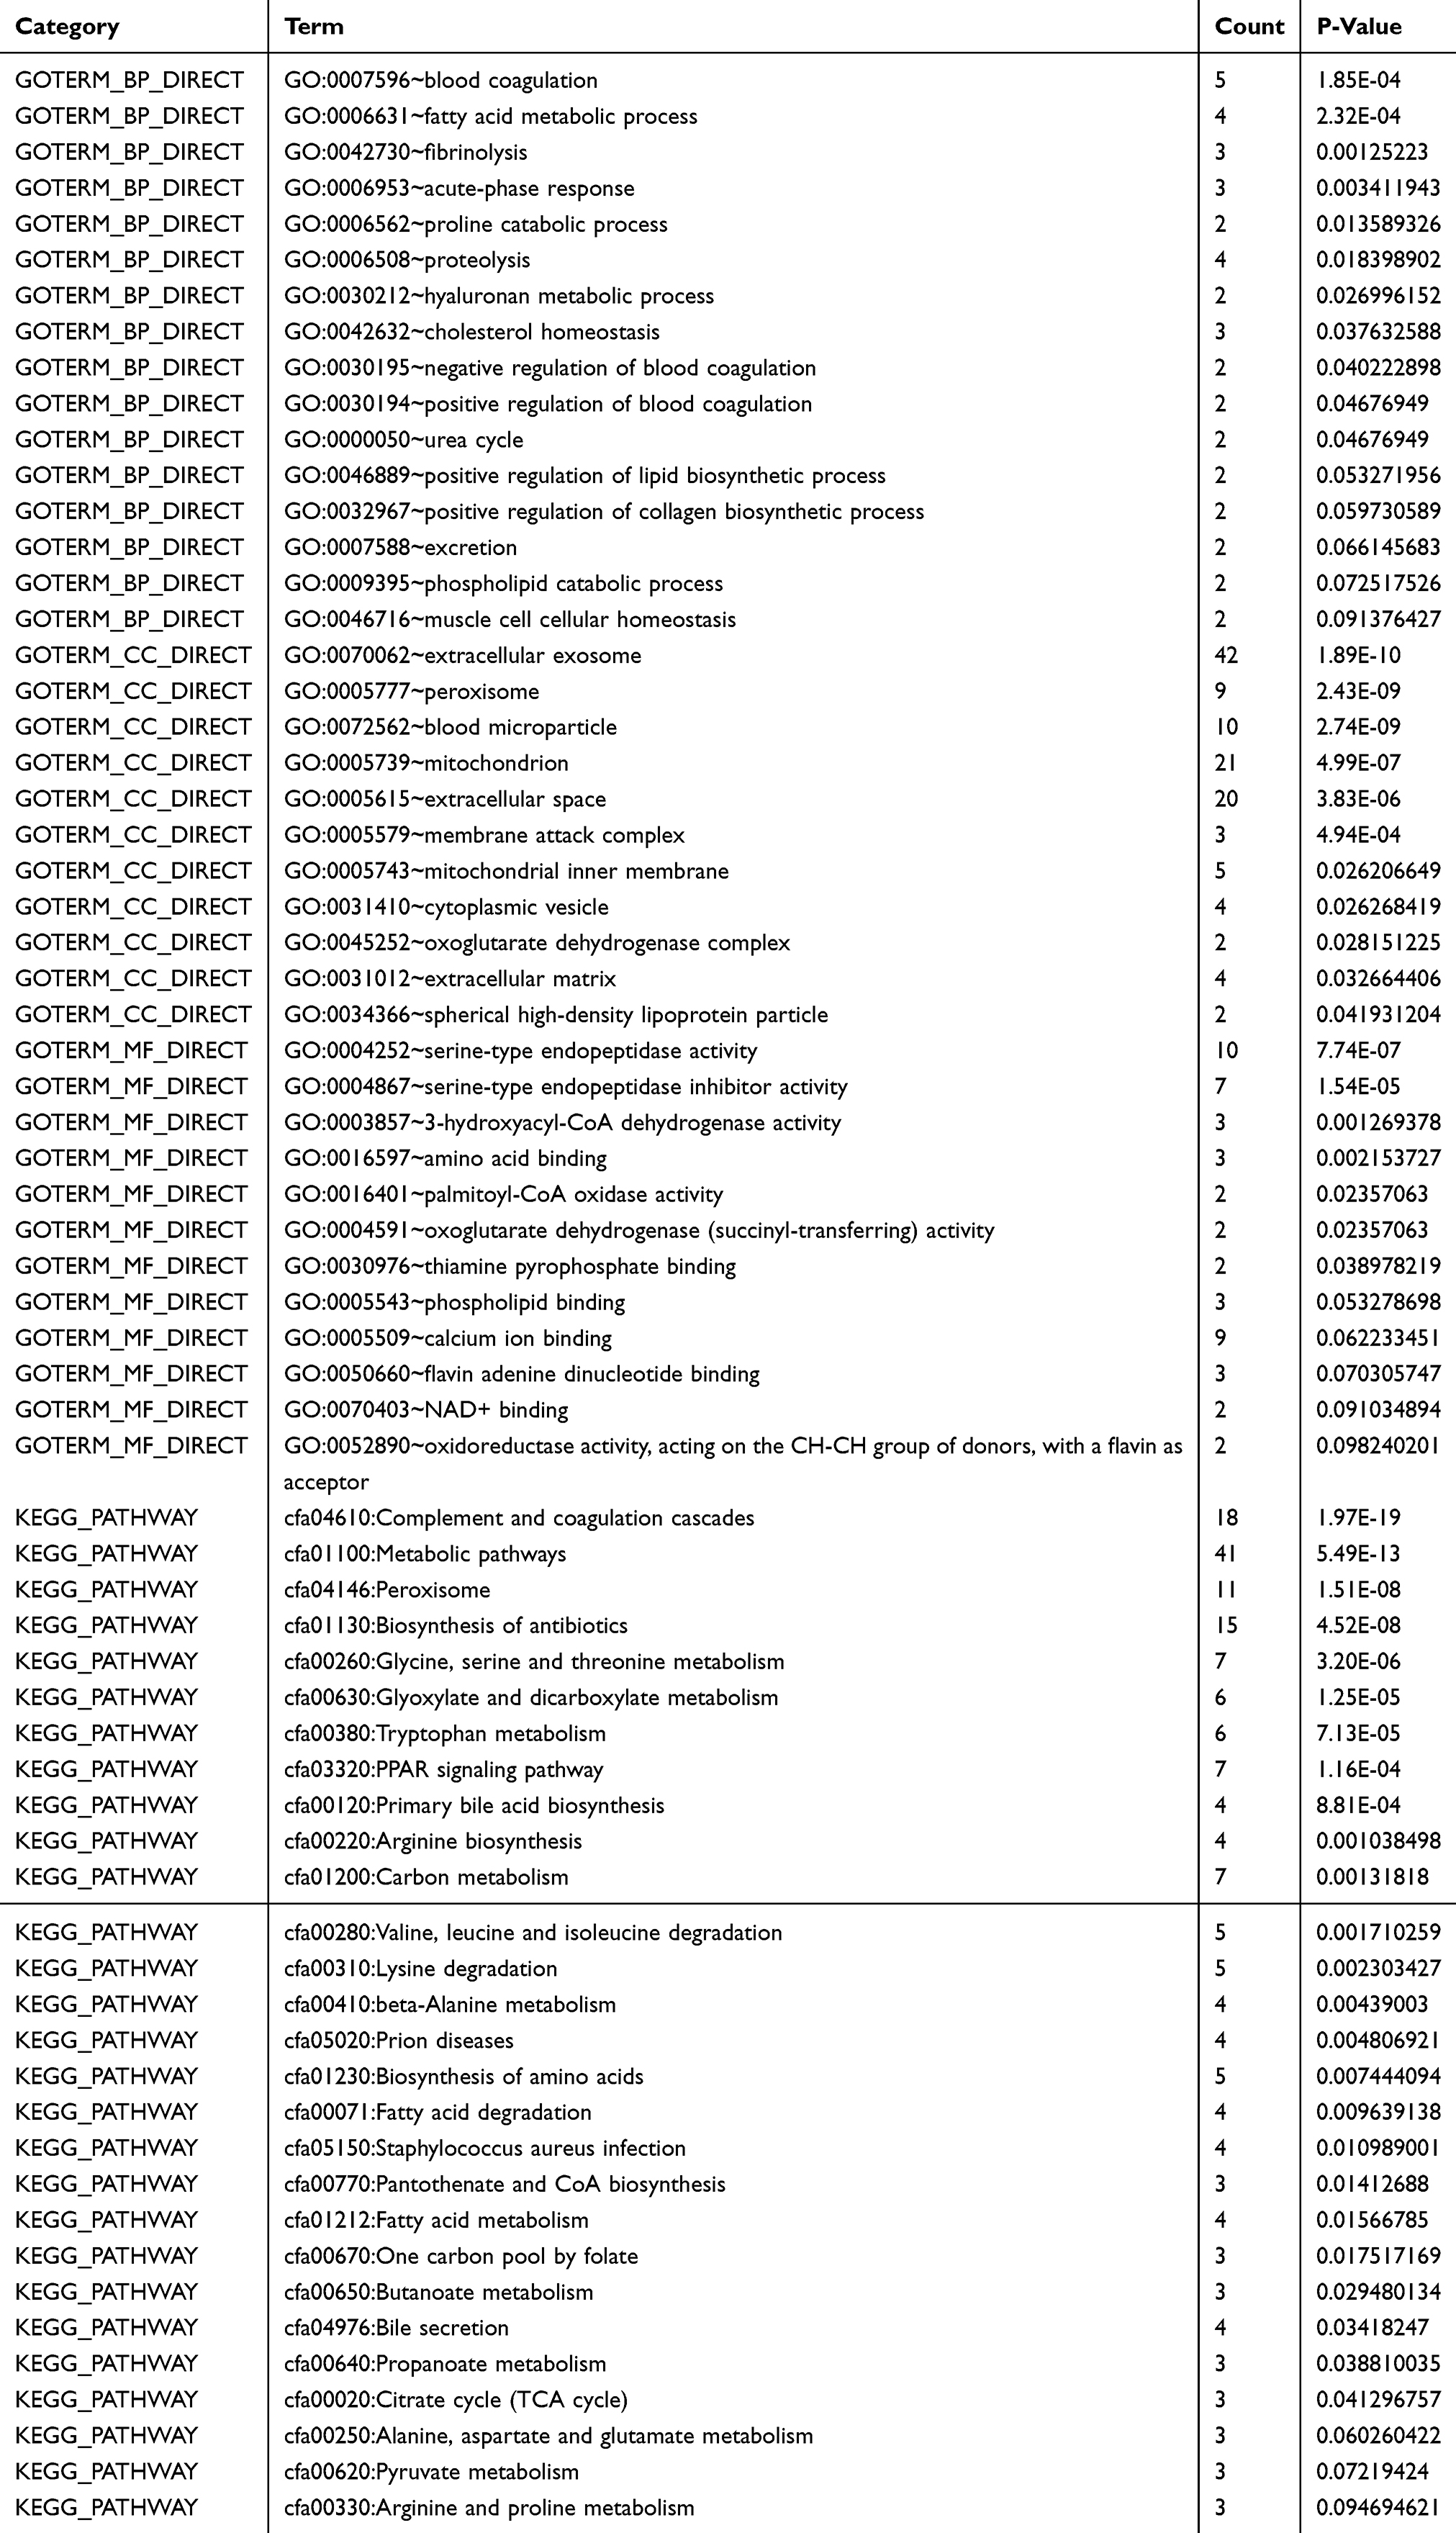 |
Table 2 Significantly Enriched GO Terms And KEGG Pathways Of DEGs |
PPI Network Construction And Hub Gene Identification
As shown in Table 2, 28 terms for KEGG pathway enrichment analysis were significantly over-represented among these downregulated DEGs. Then, the probability of relationships between pathways was evaluated by STRING tools. The PPI network was presented in Figure 1B. Besides, the top 10 genes evaluated by connectivity degree in the PPI network were identified (Table 3). From Table 3, we found that the degree of Coagulation factor II9 (F2) was 27, which ranked first among these 10 genes. Then, the following genes were plasminogen10 (PLG; degree= 21), enoyl-CoA hydratase and 3-hydroxyacyl CoA dehydrogenase11 (EHHADH; degree= 20), alanine-glyoxylate and serine–pyruvate aminotransferase12 (AGXT; degree= 15), alpha 2-HS glycoprotein (AHSG; degree= 15),13 carboxypeptidase B214 (CPB2; degree= 14), aldehyde dehydrogenase 8 family member A115 (ALDH8A1; degree= 14), serpin family D member 1 (SERPIND1; degree= 12), serpin family F member 216 (SERPINF2; degree= 11), serine hydroxyl-methyltransferase 117 (SHMT1; degree= 11). All of these hub genes were downregulated in CCA.
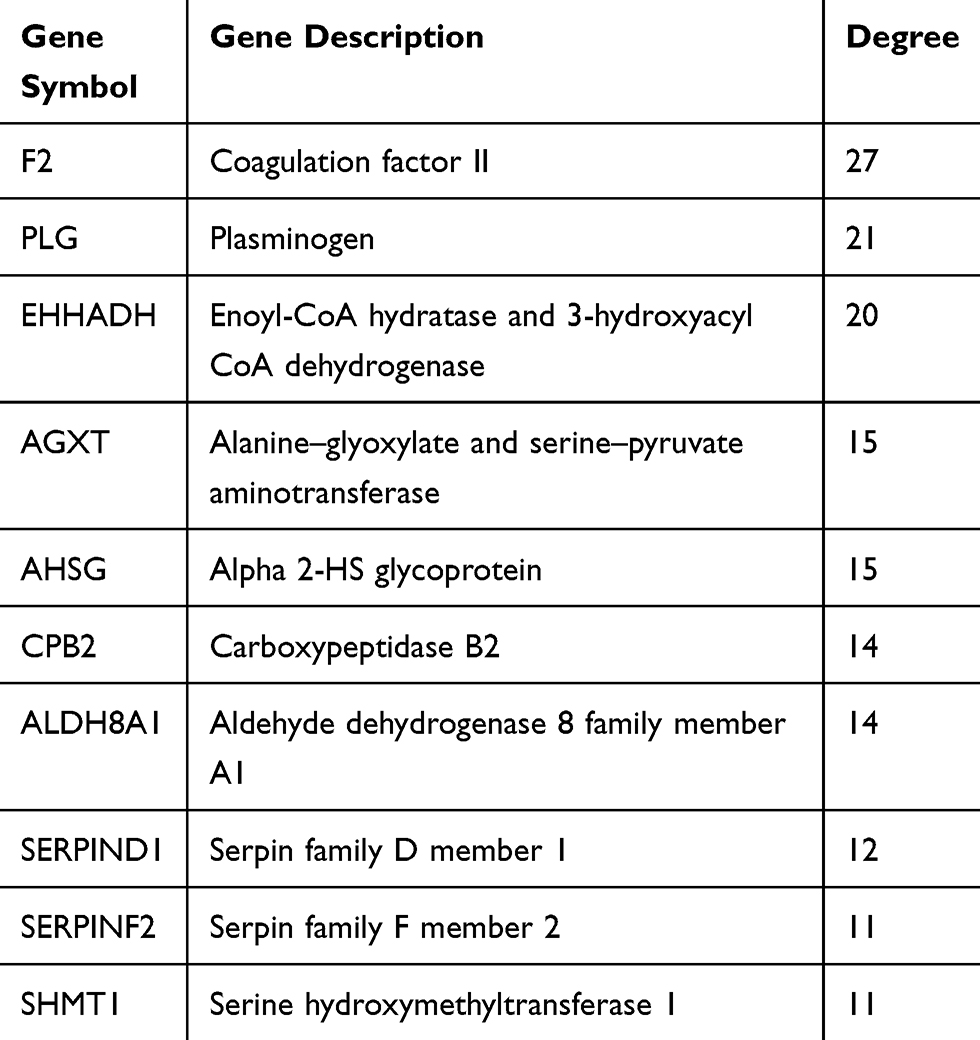 |
Table 3 Top 10 Hub Genes With Higher Degree Of Connectivity |
F2, AHSG, ALDH8A1, SERPIND1 And AGXT Might Be The Potential DNA Methylation Biomarkers For CCA
To further clarify the expression of these hub genes in CCA and normal tissues, we performed the differential expression analysis by using GEPIA tools. From the box-profiles in Figure 2, these results indicated that all these 10 hub genes were lower expressed in CCA than normal liver tissues (p<0.05), in other words, 10 hub genes could be the suppressor gene in CCA. DNA promoter hyper-methylation is an important pattern which impact tumorigenesis of cancers, and this pattern could be found in various tumor suppressor genes.18 Therefore, we speculated whether these 10 hub genes were associated with DNA promoter methylation in CCA. Then, the methylation levels of hub genes in CCA were detected by MEXPRESS database. The results revealed that the promoter region of F2, AHSG, ALDH8A1, SERPIND1 and AGXT showed significantly higher methylation levels (p<0.05) in CCA compared to normal tissues (Figure 3). However, the left 5 genes showed no significant methylation level change between tumor and normal tissues (Figure S2). In addition, we detected the relationship between the five hub genes and the survival of CCA patients. Using GEPIA database, as Figure 4 showed, higher expression of these five genes would predict the better prognosis of CCA patients.
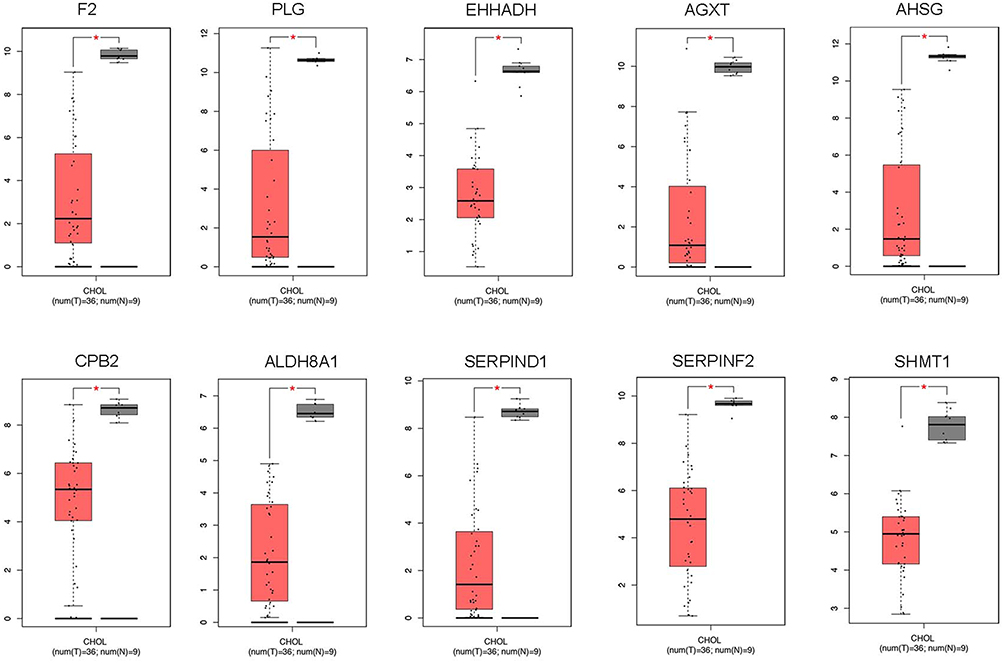 |
Figure 2 The expression of 10 hub genes in CCA samples and normal tissue samples through GAPIA database (*p<0.05). |
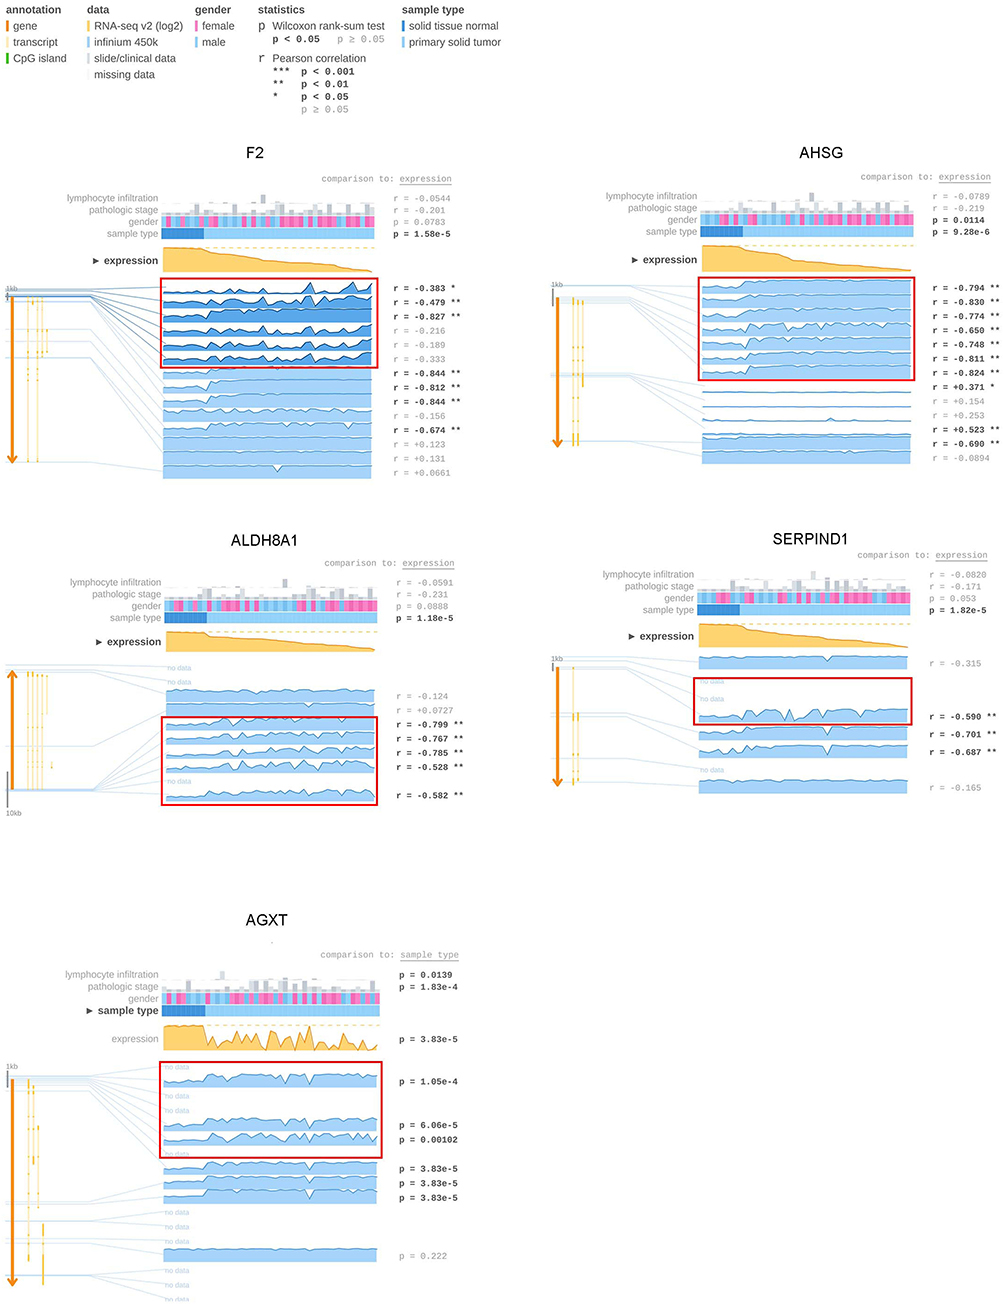 |
Figure 3 Visualization of the TCGA data for F2, AHSG, ALDH8A1, SERPIND1, and AGXT in cholangiocarcinoma using MEXPRESS. Samples were ordered by their expression value. This figure showed the negative correlation between hub gene expression and promoter methylation (highlighted part with red box), with the Pearson correlation coefficients on the right (*p<0.05, **p<0.01, ***p<0.001). |
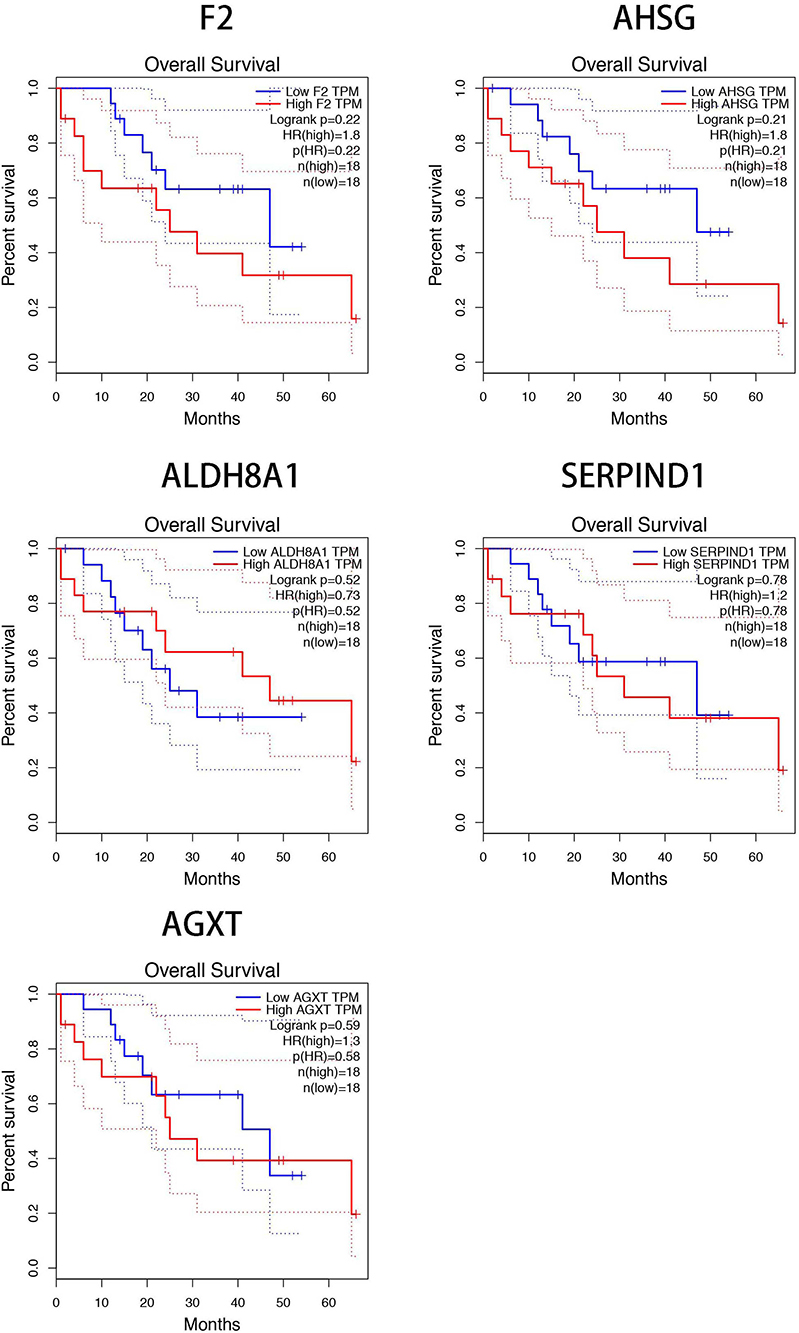 |
Figure 4 The five hub genes (F2, AHSG, ALDH8A1, SERPIND1, and AGXT) impacted the survival rate of CCA patients. |
Then, we evaluated F2, AHSG, ALDH8A1, SERPIND1 and AGXT expressions level in a panel of five cell lines: four CCA (CCLP-1, HuCCT-1, HCCC-9810 and RBE) cell lines and one non-tumorigenic or benign (HIBEC) cell line. The mRNA expression measured by RT-PCR revealed that F2, AHSG, ALDH8A1, SERPIND1 and AGXT transcription levels in cancerous cell lines were lower than those in the non-tumorigenic or benign control cells (Figure 5A). Moreover, the expression of five genes above in CCLP-1, HuCCT-1, HCCC-9810 and RBE cells was significantly increased after treatment with 5-Aza, a DNA methyltransferase inhibitor (Figure 5B). And, we also analyzed the methylation sequencing data form TCGA, we found out that compared with the adjacent normal liver tissues the CCA have the higher methylation levels in the promoter (Figure S3). All these results indicated that F2, AHSG, ALDH8A1, SERPIND1 and AGXT may be the potential DNA methylation biomarkers for CCA.
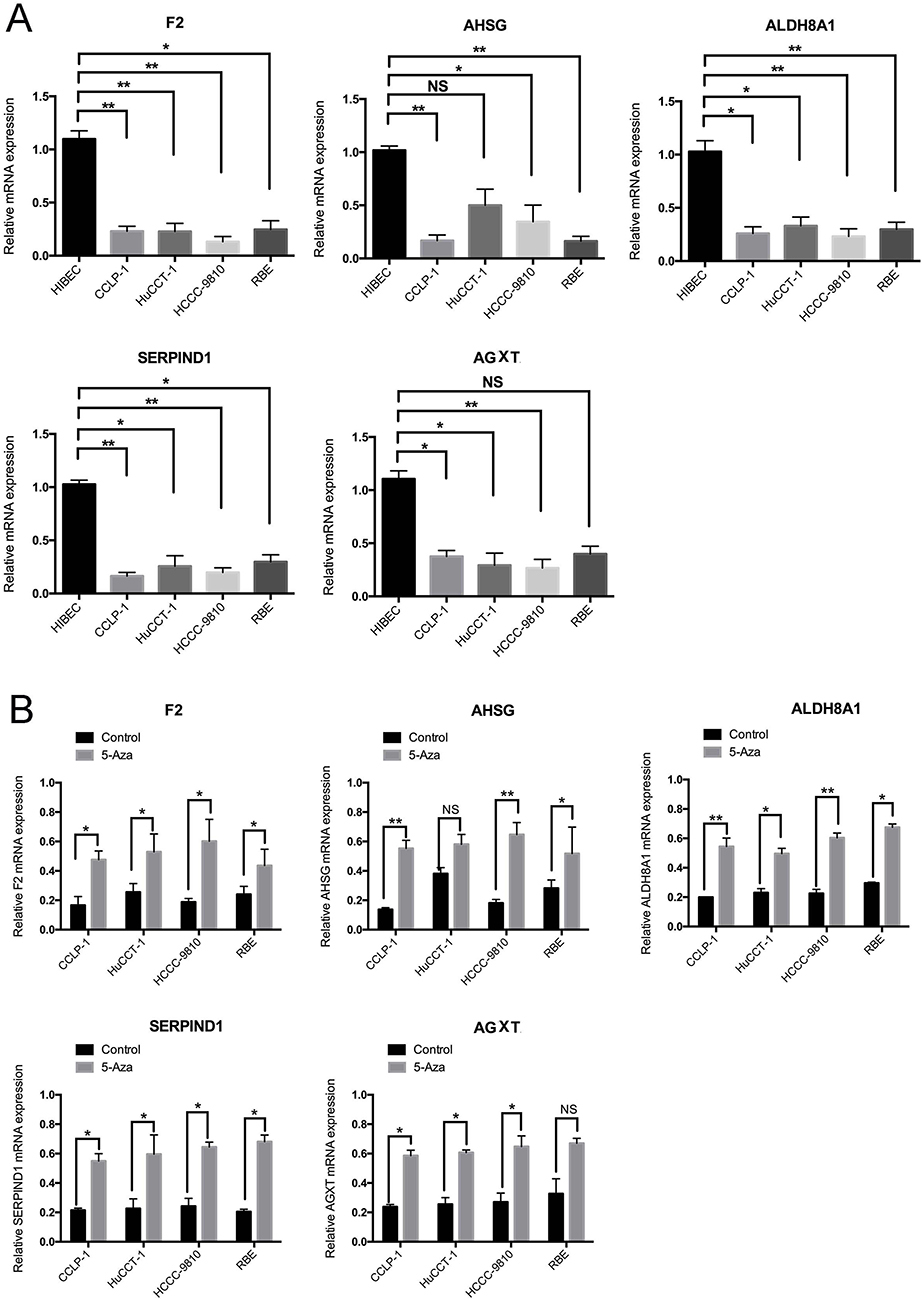 |
Figure 5 (A) Results of quantitative real-time PCR revealed that F2, AHSG, ALDH8A1, SERPIND1, and AGXT transcription levels in four cancerous cell lines and benign cells. Error bars represent the SD from three independent experiments. (B) Quantitative real-time PCR indicated that 5-Aza treatment for 96 hrs increased the expression of F2, AHSG, ALDH8A1, SERPIND1, and AGXT in CCA cells (*p<0.05, **p<0.01). |
Discussion
In order to identify the potential key genes associated with CCA, gene expression and protein–protein interaction analysis were executed in our study. We found 115 downregulated DEGS in CCA compared with normal tissue by comparing gene expression profiling data from the three GEO dataset. Then, we constructed the PPI network to detect the inner-relationship of the downregulated DEGs, and 10 hub genes were identified, including F2, PLG, EHHADH, AGXT, AHSG, CPB2, ALDH8A1, SERPIND1, SERPINF2 and SHMT1.
In various cancers, DNA methylation plays an important role in the gene expression regulation. Several methylated genes are often shared among the gastrointestinal tract.6,19–21 Then we identified the relationship between DEGs expression and DNA methylation using MEXPRESS. As Figure 4 showed, default MEXPRESS plot for hub genes in CCA with the samples sorted based on their expression value. The MEXPRESS analysis results have indicated that there was a negative correlation between the expression and methylation around the promoter region which is highlighted with red box, which showed that the expressions of F2, AHSG, ALDH8A1, SERPIND1 and AGXT might be regulated through promoter DNA methylation (the left 5 hub genes showed no significant methylation level change between tumor and normal tissues).
Totally, we have shown the panel in this research included F2, AHSG, ALDH8A1, SERPIND1, and AGXT might be the novel biomarkers for CCA. Although the role of these genes in cancer is not fully understood, the high performance of the identified five‐gene biomarker panel suggests that it could be suitable for discriminating the DNA methylation expression changes during the carcinogenetic process in bile tract epithelium. Some research have shown that DNA methylation always occurred in the early stage of cancers.20 This panel may be of early diagnostic value for CCA patients, and we can combine this biomarker panel of this study with bile duct brush biopsy technology, which has the potential to diagnose CCA at an early stage that can be cured by surgery or transplantation.22
Conclusion
Through our bioinformatics analysis, we identified 112 genes were downregulated in CCA. Based on the GO analysis and PPI network, 10 hub genes were found out from these DEGs, including F2, PLG, EHHADH, AGXT, AHSG, CPB2, ALDH8A1, SERPIND1, SERPINF2, and SHMT1. Epigenetics is the main factor which causes the reduction of tumor suppressor gene expression in tumor, and DNA methylation plays an important role in the epigenetic modification. Using MEXPRESS and RT-PCR, we found that F2, AHSG, ALDH8A1, SERPIND1 and AGXT could be methylated in the promoter. These 5 genes may be the potential DNA methylation biomarkers and therapy targets for CCA.
Acknowledgment
This study was supported by grants from the National Natural Science Foundation of China (81874228).
Disclosure
The authors report no conflicts of interest in this work.
References
1. Razumilava N, Gores GJ. Cholangiocarcinoma. Lancet. 2014;383(9935):2168–2179. doi:10.1016/S0140-6736(13)61903-0
2. Blechacz B, Komuta M, Roskams T, Gores GJ. Clinical diagnosis and staging of cholangiocarcinoma. Nat Rev Gastroenterol Hepatol. 2011;8(9):512–522. doi:10.1038/nrgastro.2011.131
3. Komuta M, Govaere O, Vandecaveye V, et al. Histological diversity in cholangiocellular carcinoma reflects the different cholangiocyte phenotypes. Hepatology. 2012;55(6):1876–1888. doi:10.1002/hep.25595
4. Khan SA, Davidson BR, Goldin RD, et al. Guidelines for the diagnosis and treatment of cholangiocarcinoma: an update. Gut. 2012;61(12):1657–1669. doi:10.1136/gutjnl-2011-301748
5. Liau JY, Tsai JH, Yuan RH, Chang CN, Lee HJ, Jeng YM. Morphological subclassification of intrahepatic cholangiocarcinoma: etiological, clinicopathological, and molecular features. Mod Pathol. 2014;27(8):1163–1173. doi:10.1038/modpathol.2013.241
6. Klutstein M, Nejman D, Greenfield R, Cedar H. DNA methylation in cancer and aging. Cancer Res. 2016;76(12):3446–3450. doi:10.1158/0008-5472.CAN-15-3278
7. Liang G, Weisenberger DJ. DNA methylation aberrancies as a guide for surveillance and treatment of human cancers. Epigenetics. 2017;12(6):416–432. doi:10.1080/15592294.2017.1311434
8. Andresen K, Boberg KM, Vedeld HM, et al. Four DNA methylation biomarkers in biliary brush samples accurately identify the presence of cholangiocarcinoma. Hepatology. 2015;61(5):1651–1659. doi:10.1002/hep.27707
9. Gazzard BG, Lewis ML, Ash G, Rizza CR, Bidwell E, Williams R. Coagulation factor concentrate in the treatment of the haemorrhagic diathesis of fulminant hepatic failure. Gut. 1974;15(12):993–998. doi:10.1136/gut.15.12.993
10. Sulniute R, Shen Y, Guo YZ, et al. Plasminogen is a critical regulator of cutaneous wound healing. Thromb Haemost. 2016;115(5):1001–1009. doi:10.1160/TH15-08-0653
11. Houten SM, Denis S, Argmann CA, et al. Peroxisomal L-bifunctional enzyme (Ehhadh) is essential for the production of medium-chain dicarboxylic acids. J Lipid Res. 2012;53(7):1296–1303. doi:10.1194/jlr.M024463
12. Isiyel E, Ezgu SA, Caliskan S, et al. Molecular analysis of the AGXT gene in patients suspected with hyperoxaluria type 1 and three novel mutations from Turkey. Mol Genet Metab. 2016;119(4):311–316. doi:10.1016/j.ymgme.2016.10.011
13. Dabrowska AM, Tarach JS, Wojtysiak-Duma B, Duma D. Fetuin-A (AHSG) and its usefulness in clinical practice. Review of the literature. Biomed Pap Med Fac Univ Palacky Olomouc Czech Repub. 2015;159(3):352–359. doi:10.5507/bp.2015.018
14. Cagliani R, Fumagalli M, Riva S, et al. Polymorphisms in the CPB2 gene are maintained by balancing selection and result in haplotype-preferential splicing of exon 7. Mol Biol Evol. 2010;27(8):1945–1954.
15. Kent T, Arnold SL, Fasnacht R, et al. ALDH enzyme expression is independent of the spermatogenic cycle, and their inhibition causes misregulation of murine spermatogenic processes. Biol Reprod. 2016;94(1):12. doi:10.1095/biolreprod.115.131458
16. Wong JH, Dukes J, Levy RE, et al. Sex differences in thrombosis in mice are mediated by sex-specific growth hormone secretion patterns. J Clin Invest. 2008;118(8):2969–2978. doi:10.1172/JCI34957
17. Boehme B, Schelski N, Makridakis M, et al. Role of cytosolic Serine Hydroxymethyl Transferase 1 (SHMT1) in phosphate-induced vascular smooth muscle cell calcification. Kidney Blood Press Res. 2018;43(4):1212–1221. doi:10.1159/000492248
18. Flanagan JM, Wilson A, Koo C, et al. Platinum-based chemotherapy induces methylation changes in blood DNA associated with overall survival in patients with ovarian cancer. Clin Cancer Res. 2017;23(9):2213–2222. doi:10.1158/1078-0432.CCR-16-1754
19. Kulis M, Esteller M. DNA methylation and cancer. Adv Genet. 2010;70:27–56. doi:10.1016/B978-0-12-380866-0.60002-2
20. Emmett RA, Davidson KL, Gould NJ, Arasaradnam RP. DNA methylation patterns in ulcerative colitis-associated cancer: a systematic review. Epigenomics. 2017;9(7):1029–1042. doi:10.2217/epi-2017-0025
21. Weisenberger DJ. Characterizing DNA methylation alterations from the cancer genome atlas. J Clin Invest. 2014;124(1):17–23. doi:10.1172/JCI69740
22. Njei B, McCarty TR, Varadarajulu S, Navaneethan U. Cost utility of ERCP-based modalities for the diagnosis of cholangiocarcinoma in primary sclerosing cholangitis. Gastrointest Endosc. 2017;85(4):773–781.e710. doi:10.1016/j.gie.2016.08.020
 © 2019 The Author(s). This work is published and licensed by Dove Medical Press Limited. The
full terms of this license are available at https://www.dovepress.com/terms
and incorporate the Creative Commons Attribution
- Non Commercial (unported, 3.0) License.
By accessing the work you hereby accept the Terms. Non-commercial uses of the work are permitted
without any further permission from Dove Medical Press Limited, provided the work is properly
attributed. For permission for commercial use of this work, please see paragraphs 4.2 and 5 of our Terms.
© 2019 The Author(s). This work is published and licensed by Dove Medical Press Limited. The
full terms of this license are available at https://www.dovepress.com/terms
and incorporate the Creative Commons Attribution
- Non Commercial (unported, 3.0) License.
By accessing the work you hereby accept the Terms. Non-commercial uses of the work are permitted
without any further permission from Dove Medical Press Limited, provided the work is properly
attributed. For permission for commercial use of this work, please see paragraphs 4.2 and 5 of our Terms.