Back to Journals » Diabetes, Metabolic Syndrome and Obesity » Volume 17
First-Trimester Triglyceride-Glucose Index and Triglyceride/High-Density Lipoprotein Cholesterol are Predictors of Gestational Diabetes Mellitus Among the Four Surrogate Biomarkers of Insulin Resistance
Received 13 December 2023
Accepted for publication 23 March 2024
Published 8 April 2024 Volume 2024:17 Pages 1575—1583
DOI https://doi.org/10.2147/DMSO.S454826
Checked for plagiarism Yes
Review by Single anonymous peer review
Peer reviewer comments 2
Editor who approved publication: Prof. Dr. Juei-Tang Cheng
Ning Ma,1 Liwei Bai,2 Qiang Lu1
1Department of Endocrinology, First Hospital of Qinhuangdao, Hebei, Qinhuangdao, 066000, People’s Republic of China; 2Qinhuangdao Hospital for Maternal and Child Health, Hebei, Qinhuangdao, 066000, People’s Republic of China
Correspondence: Qiang Lu, Department of Endocrinology, First Hospital of Qinhuangdao, Hebei, Qinhuangdao, 066000, People’s Republic of China, Tel +86 13933909066, Email [email protected]
Purpose: This study seeks to assess the potential of early pregnancy Triglyceride Glucose Index (TyG), triglyceride to High-Density Lipoprotein Cholesterol ratio (TG/HDL-c), Low-Density Lipoprotein Cholesterol to High-Density Lipoprotein Cholesterol ratio (LDL-C/HDL-C), and Total Cholesterol to High-Density Lipoprotein Cholesterol ratio (TC/HDL-C) in predicting Gestational Diabetes Mellitus (GDM).
Patients and Methods: A total of 1073 adults singleton pregnant women were enrolled from June 2017 to September 2019. Complete anthropometric data and lipid profiles were measured in the first trimester (before 12 weeks gestation) and a 75g oral glucose tolerance test (OGTT) at 24– 28 weeks was performed. Based on OGTT results, participants were categorised into Normal Glucose Tolerance (NGT) group (n=872) and GDM group (n=201). General data, laboratory test results, and surrogate insulin resistance indicators such as TyG index, TG/HDL-C, LDL-C/HDL-C, and TC/HDL-C were documented and compared. To compare differences between the two groups, t-test was used, Spearman correlation analysis and linear regression analysis were performed to establish associations between these indicators and insulin resistance in GDM. Receiver Operating Characteristic (ROC) curves were generated to compare the thresholds of these indicators for predicting GDM during pregnancy and to quantify overall diagnostic accuracy.
Results: Individuals with GDM had higher TyG, TG/HDL-C, and LDL-C/HDL-C levels (P < 0.001), but with no significant difference observed in TC/HDL-C. All four ratios were positively correlated with Homeostatic Model Assessment of Insulin Resistance (HOMA-IR), yet only TyG emerged as an independent risk factor for HOMA-IR. The Area under the Curve (AUC) of TyG index (0.692) was comparable to that of HOMA-IR (0.703). The cut-off points for TyG index, TG/HDL-C, and HOMA-IR in predicting GDM were 7.088, 0.831, and 1.8, respectively. HOMA-IR exhibited the highest sensitivity (79.1%), while TyG index (64.3%) and TG/HDL-C ratio (64.3%) demonstrated better specificity compared to HOMA-IR (56.3%). LDL-C/HDL-C and TC/HDL-C offered no discernible predictive advantage.
Conclusion: Early pregnancy TyG index and TG/HDL-C can aid in identifying pregnant women at risk for GDM, potentially facilitating early and effective intervention to improve prognosis. TyG index exhibited superior predictive capability compared to TG/HDL-C.
Keywords: TyG, gestational diabetes mellitus, glucose and lipid metabolism, insulin resistance
Introduction
Gestational Diabetes Mellitus (GDM) stands as a prevalent comorbidity during pregnancy, exerting short- and long-term adverse effects on mother and infant, large-for-gestational-age (LGA) infants were particularly common.1,2 Emma Assi et al used a proteomic approach to find that placental dysfunction may be directly responsible for abnormal growth and development of GDM fetuses.3 GDM and T2DM share both non-genetic and genetic risk factors, including obesity, poor diet and sedentary lifestyle; MTNR1B, TCF7L2, CDKAL1 and CDKN2A-CDKN2B of the GDM loci have been reported at genome-wide significance for T2DM.4 The etiology of GDM remains elusive, with insulin resistance and islet beta cell dysfunction recognised as pivotal pathophysiological foundations. Established risk factors for GDM include increasing body mass index (BMI), advanced maternal age and increases in insulin resistance (IR).5 The homeostasis model assessment for insulin resistance (HOMA-IR) index is the most widely used to evaluate the degree of IR.6 However, it is not readily available in the early stages, and insulin testing is expensive. So it is a good idea to use routine antenatal testing indicators instead of IR to predict the risk of GDM. Past investigations have identified metabolic indicators, such as the Triglyceride/Glucose Index (TyG) and Triglyceride/High-Density Lipoprotein Cholesterol Ratio (TG/HDL-C), as reliable markers for discerning high-risk groups prone to insulin resistance and metabolic disorders in non-pregnant individuals.7–9 Nonetheless, evidence linking these indicators to insulin resistance (IR) and GDM in pregnant individuals remains scarce. Thus, the query persists: do these straightforward insulin resistance-related alternative indicators in early pregnancy hold reference value, and can clinicians utilise them to swiftly and accurately identify and intervene with high-risk groups of GDM in actual clinical practice? Hence, this study aims to scrutinise the relevance and practicality of four indicators, including TyG and TG/HDL-C, in predicting GDM in pregnant individuals, alongside their association with early pregnancy GDM occurrence.
Materials and Methods
Study Objects and Groups
A total of 1073 singleton pregnant women who underwent routine prenatal examination in Qinhuangdao Maternal and Child Health Hospital from June 2017 to September 2019 were enrolled in this retrospective study. The data of age, height, pre-pregnancy weight, systolic blood pressure, diastolic blood pressure and blood biochemical indexes of pregnant women at the time of the first prenatal examination (pregnancy weeks 8 to 12) were collected and recorded. The results of oral glucose tolerance test (OGTT) at 24–28 weeks of pregnancy were recorded. And according to OGTT, the patients were divided into normal glucose tolerance (NGT) group and GDM group. All subjects were excluded from diseases affecting blood glucose levels such as hyperthyroidism, Cushing’s syndrome, and pancreatitis, and there were no acute complications such as diabetic ketoacidosis, and no serious damage to heart, liver, and kidney function, and incomplete data in early pregnancy. This study was approved by the Ethics Committee of Qinhuangdao Maternal and Child Health Hospital and the First Hospital of Qinhuangdao. Institutional Review Board approvals reviewed patient’s medical records, the data were anonymous, and the requirement for informed consent was therefore waived. The study was conducted in accordance with the ethical standards of the Declaration of Helsinki.
According to the diagnostic criteria of the International Association of Diabetes and Pregnancy Study Groups (IADPSG),10 fasting blood glucose level (FPG) ≥5.1 mmol/L, 1-h post-glucose (1hPG) level ≥10.0 mmol/L, or 2-h post-glucose (2hPG) level ≥8.5 mmol/L. GDM was diagnosed to conform to any one of the three items.
Laboratory Examination
The night before the blood was collected, the participants were asked to fast for eight hours. All blood collected was centrifuged within 2 hours. We used serum for biochemical measurements and whole blood for HBA1c analysis, all measurements were completed within 24 hours. The automatic biochemical analyzer (Hitachi 7060 type, Ibaraki, Japan) was used to detect fasting plasma glucose (FPG), triglyceride, serum total cholesterol, high-density lipoprotein cholesterol (HDL-c), low-density lipoprotein cholesterol (LDL-C), blood uric acid, creatinine, blood urea nitrogen, alanine aminotransferase (ALT), aspartate aminotransferase (AST) and gamma glutamyl transpeptidase (GGT). The methodology of automatic biochemical analyzer adopted continuous monitoring method, enzyme method and two-point endpoint method. HbA1C was detected by automatic HBA1C analyzer (Arkray HA8180 type, Japan) using high performance liquid chromatography (HPLC). Fasting insulin (FINS) levels were detected by electrochemiluminescence (Roche Cobas e801, Ibaraki, Japan).
Indices were calculated:  ; Homeostasis model evaluation insulin resistance index
  . Steady-state model assessment islet beta cells secrete index
  .
.
Statistical Analysis
Data processing and statistical analysis were used SPSS25.0 statistical analysis package. To compare differences between the NGT and GDM groups, the measurement data used the t-test, expressed as (x±s). The associations between HOMA-IR and various indicators were explored using Spearman correlation generated in Correlation Plot by Origin 2024. Linear regression was further used to analyze the independent risk factors of HOMA-IR. The receiver operating characteristic (ROC) curve predicts the tangent point of each indicator of GDM during pregnancy. P<0.05 was considered statistically significant.
Results
The present study comprised of 1073 pregnant women with an average age of 28.01±5.30years. Among the participants, 201 (18.7%) were diagnosed with GDM. Table 1 presents a general comparison between NGT and GDM pregnancies. Compared to NGT pregnant women, those with GDM were characterized by advanced age, higher levels of GGT, CREA, UA, glycated hemoglobin, TG and LDL-C in the first trimester, and greater weight gain, higher fasting blood glucose, 1h blood glucose and 2h blood glucose at 24–28 weeks of pregnancy (all P<0.05). Whereas the level of systolic blood pressure, diastolic blood pressure, ALT, AST, BUN, TC and HDL-C in early pregnancy were not found any significant differences (P>0.05, Table 1).
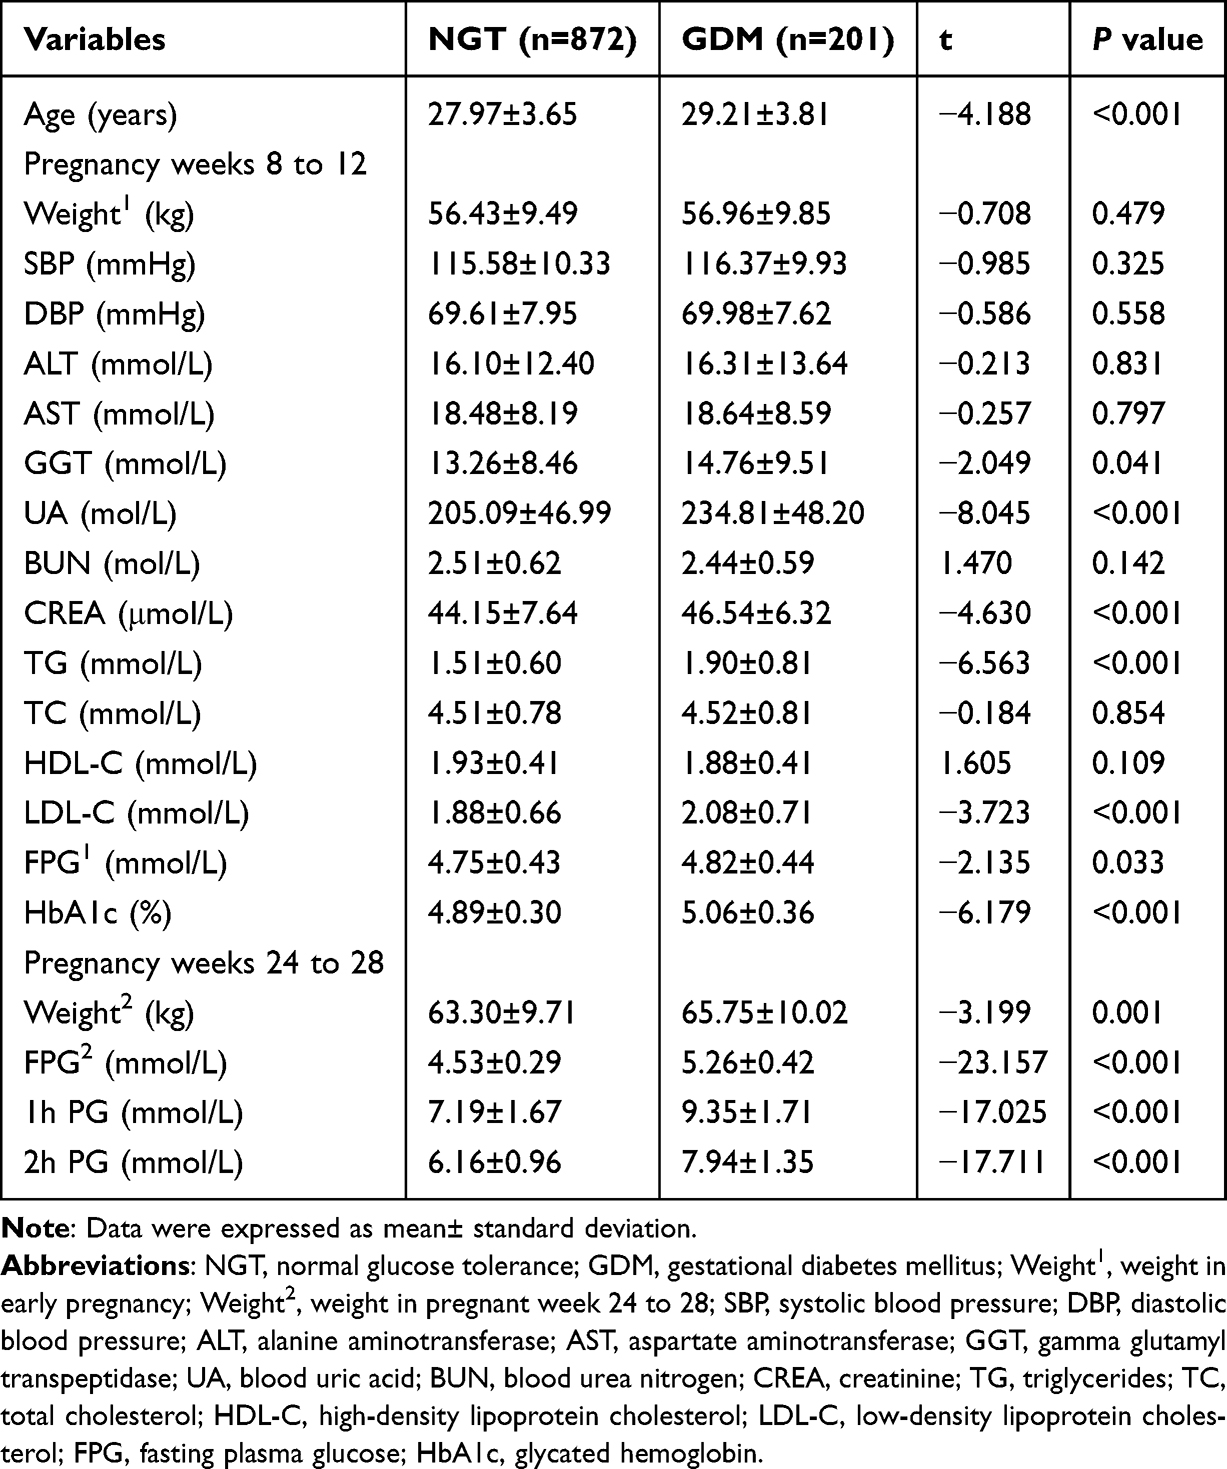 |
Table 1 Anthropometric and Biochemical Characteristics of Participants [ |

In terms of insulin resistance-related indicators, significantly higher fasting insulin, TyG, TG/HDL-C, LDL-C/HDL-C and HOMA-IR, and lower HOMA-β were observed in GDM group compared with NGT group (P< 0.001 for all). There were no significant differences between TC/HDL-C (Table 2).
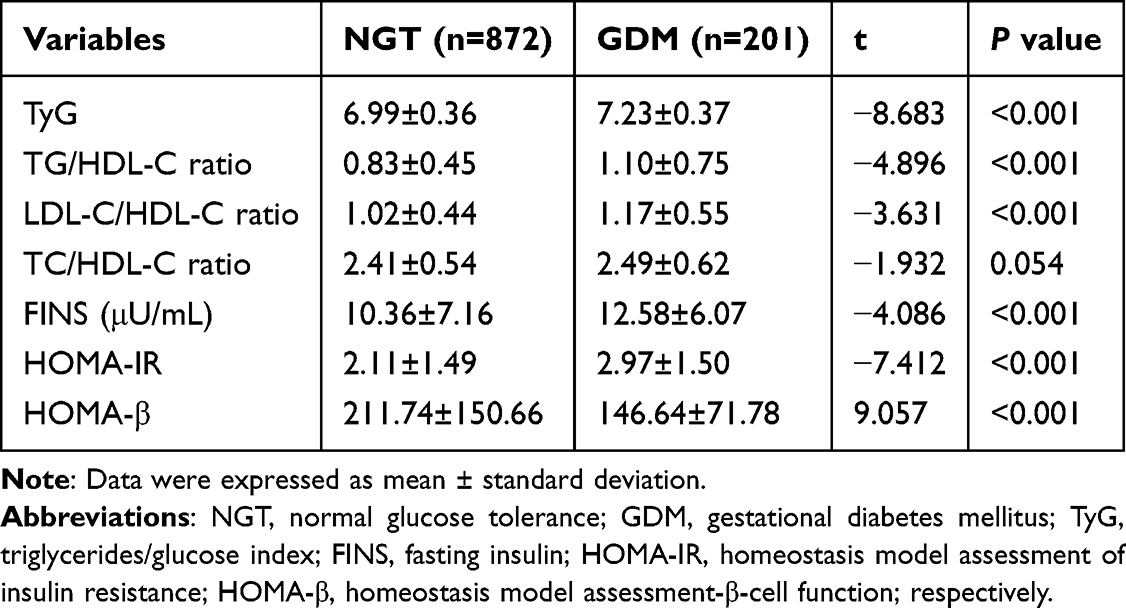 |
Table 2 Comparison of Insulin Resistance-Related Indicators |
Figure 1 shows that correlation analysis results of these indices and HOMA-IR. TG, TC, HDL-C, LDL-C, TG/HDL-C, TyG, LDL-C/HDL-C, TC/HDL-C were all correlated with HOMA-IR (P< 0.001 for all). After adjusting for age, only HbA1C and TyG were independent risk factors for HOMA-IR (Table 3).
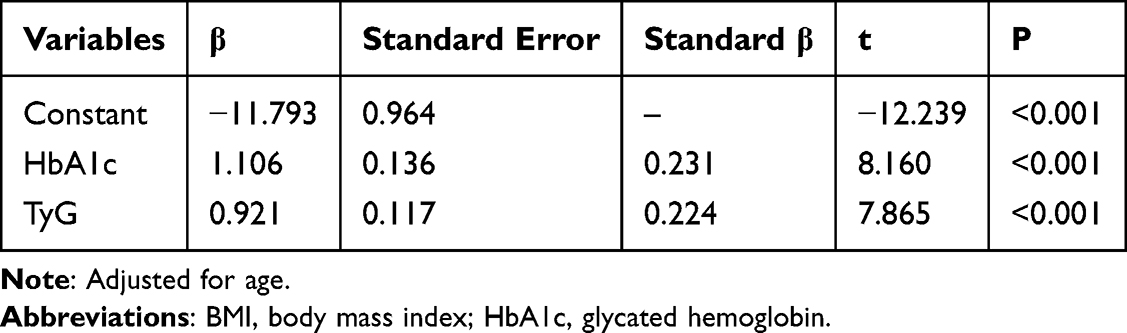 |
Table 3 Linear Regression Analysis of HOMA-IR and Each Index |
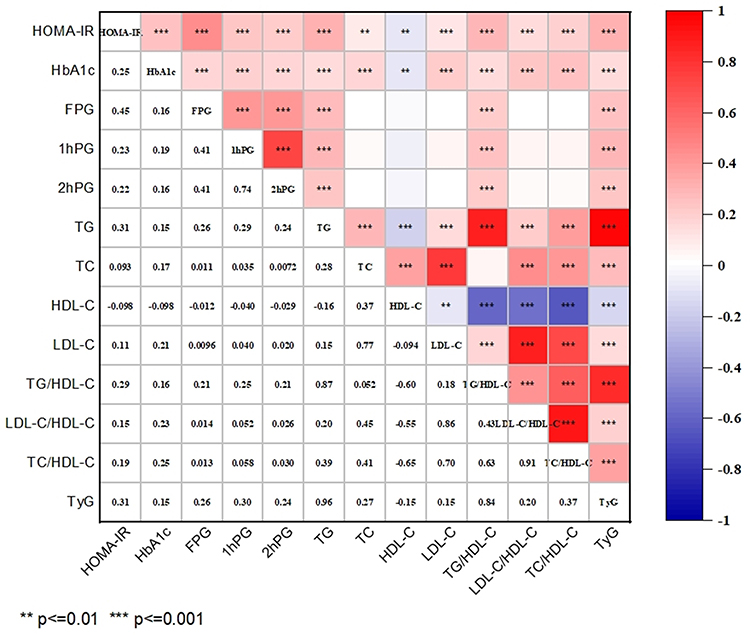 |
Figure 1 Spearman correlation between the indices and HOMA-IR. The leftmost column represents the correlation coefficient, **P<0.01, ***P<0.001. Abbreviations: HbA1c, glycated hemoglobin; FPG, fasting plasma glucose; TG, triglycerides; TC, total cholesterol; HDL-C, high-density lipoprotein cholesterol; LDL-C, low-density lipoprotein cholesterol; TyG, triglycerides/glucose index. HOMA-IR, homeostasis model assessment of insulin resistance. |
ROC curve analysis results showed that TyG index, TG/HDL-C, LDL-C/HDL-C were linearly correlated with GDM events. As for the detection of GDM, all three indices showed significant areas under the ROC curve (P < 0.001 for all). Among them, the AUC value and 95% CI for TyG index were the nearest rival that for HOMA-IR and were slightly higher than that for TG/HDL-C, but were significantly higher than that for LDL-C/HDL-C. The cut-off point of TyG index, TG/HDL-C, LDL-C/HDL-C and HOMA-IR for predicting GDM were 7.088, 0.831, 0.928 and 1.8, respectively. The sensitivity and specificity of TyG index, TG/HDL-C and LDL-C/HDL-C for predicting GDM occurrence were 68.2% and 64.3%, 63.7% and 64.3%, 66.7% and 46.2%, respectively. Compared with HOMA-IR (79.1% and 56.3%), TyG index and TG/HDL-C have better specificity to predict GDM risk (Table 4 and Figure 2).
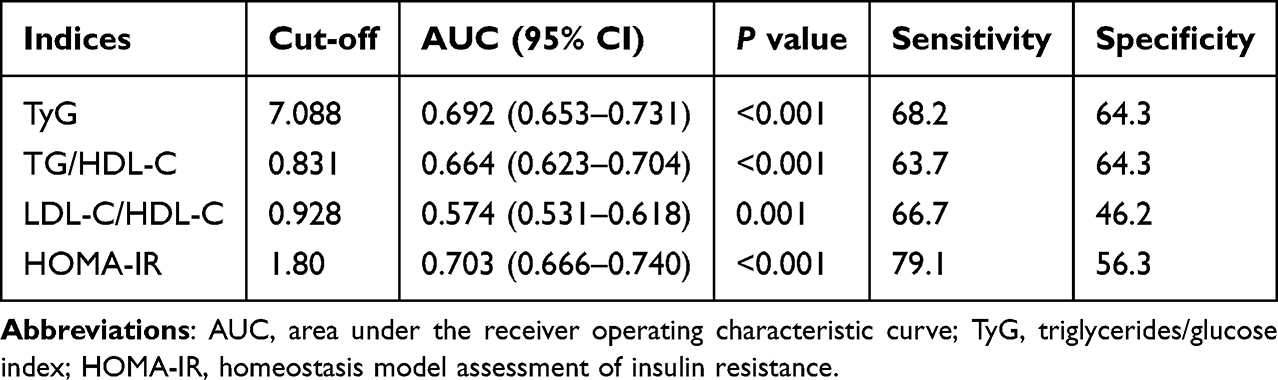 |
Table 4 Comparison of Predictive Accuracy and Cut-off Values of TyG, TG/HDL-C, LDL-C/HDL-C, and HOMA-IR for GDM |
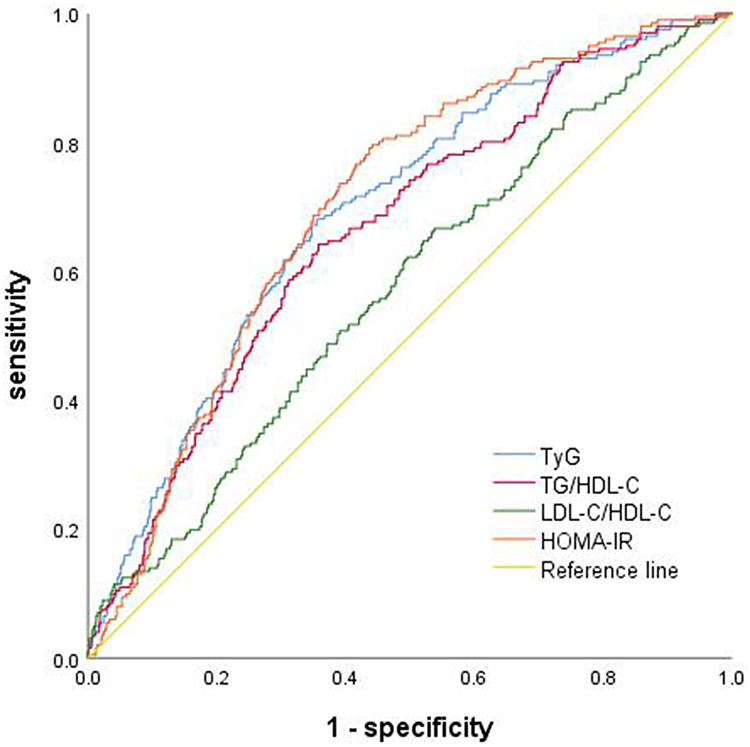 |
Figure 2 ROC curve analysis of four indexes for predicting gestational diabetes. |
Discussion
GDM is characterised as any degree of glucose intolerance first recognised or emerging during pregnancy. Worldwide, GDM affects up to 16.5% of pregnant women, with its incidence steadily rising.11 Currently, GDM screening during pregnancy typically involves an Oral Glucose Tolerance Test (OGTT) administered at 24 to 28 weeks gestation, providing limited time for at-risk pregnant women to mitigate blood glucose levels through dietary, exercise, or medical interventions. Consequently, it becomes imperative for pregnant women to identify high-risk individuals for GDM utilising simple and effective indicators, enabling prompt and effective interventions.
The high-insulin positive glucose clamp test stands as the gold standard for ascertaining insulin resistance,12 primarily employed in scientific research due to its high cost and time-intensive nature. Conversely, the widely utilised HOMA-IR13 is constrained by the necessity to detect insulin in clinical practice. However, alternative surrogate markers of insulin resistance, such as the TyG index, are gaining prominence owing to clinicians’ imperative to meaningfully evaluate insulin resistance without measuring insulin levels. Hence, it becomes imperative to actively seek simple and economical alternatives and biomarkers for predicting insulin resistance in the early stages of the disease. Guerrero et al14 conducted a hyperinsulin-positive glucose clamp test on subjects, comparing it with the TyG index, revealing the latter’s high sensitivity and specificity in recognising insulin resistance. Son et al’s8 findings suggested that the TyG index surpasses HOMA-IR in predicting Metabolic Syndrome (MetS). Li et al15 identified an independent correlation between the rise of the TyG index and an increased risk of diabetes in Chinese adults, signifying the TyG index as a reliable predictor of diabetes risk in high-risk groups. A Peruvian study16 demonstrated a positive correlation between the TG/HDL-C ratio and HOMA-IR in normal-weight adults, establishing it as a clinically useful tool for assessing insulin resistance. In pregnancy-related investigations, Pazhohan et al’s17 results indicated the TyG index as a potent indicator for predicting GDM in early pregnancy. A Korean study involving 380,208 first-pregnant women18 revealed that an increase in the TyG index before pregnancy correlates with the risk of GDM, suggesting its potential as an early marker for GDM. You et al19 found that the TG/HDL-C ratio during 10–14 weeks can aid in identifying pregnant women at risk of GDM, enabling early and effective treatment to enhance prognosis. However, a study performed by Sanchez-Garcia et al20 did not support the use of the TyG index to predict GDM in Latin American women. In conclusion, the TyG index and TG/HDL-C ratio prove useful for the early identification of insulin resistance and Type 2 Diabetes Mellitus high-risk groups in the general population. The relationship between the TyG index and TG/HDL-C ratio in the first trimester and the risk of GDM during pregnancy in pregnant women warrants further exploration.
In prior studies, these screening tools were utilised solely as clinical markers of insulin resistance. To date, there are limited direct comparative data for the four indicators in predicting HOMA-IR and GDM during pregnancy. This study comprehensively assessed the correlation between four indicators, including the TyG index in early pregnancy, and the risk of GDM in pregnant women. Our findings revealed that women who developed GDM exhibited significantly elevated TyG, TG/HDL-c, LDL-C/HDL-C ratios in early pregnancy compared to controls (all P< 0.001). The TC/HDL-C in the GDM group was higher than that in the control group, although statistical significance was not observed. Correlation analyses indicated that TyG, TG/HDL-C, LDL-C/HDL-C, and TC/HDL-C were all significantly correlated with the HOMA-IR index (all P< 0.001). Among these, TyG emerged as an independent risk factor for HOMA-IR. Given that HOMA-IR is an acknowledged indicator of insulin resistance, its predictive capacity for GDM was scrutinised through ROC curve analysis for comparison with the four indices. According to the ROC analysis results, the AUC of GDM predicted by HOMA-IR was 0.703 (0.666–0.740), with a sensitivity of 79.1% and specificity of 56.3%. In contrast, the AUC of GDM predicted by TyG was 0.692 (0.653–0.731), with a sensitivity of 68.2% and specificity of 64.3%. TG/HDL-C predicted GDM with an AUC of 0.664 (95% CI 0.623–0.704, P < 0.001), sensitivity of 63.7%, and specificity of 64.3%. Both TyG and TG/HDL-C ratio exhibited lower sensitivity than HOMA-IR but higher specificity.
It is noteworthy that the TyG index exhibits high specificity and sensitivity in predicting GDM risk. In comparison to the classical insulin resistance indicator HOMA-IR, the sensitivity for GDM prediction was lower than that of HOMA-IR (68.2% vs 79.1%) and higher than the specificity (64.3% vs 56.3%). The sensitivity of LDL-C/HDL-C in predicting GDM was akin to the aforementioned indices, with a concurrently low specificity. TC/HDL-C ratio exhibited poor predictive capability for GDM. Hence, TyG and TG/HDL-C can serve as simple and alternative methods for identifying individuals at risk for insulin resistance and GDM. This outcome aligns with the conclusions of a Chinese study,21 wherein a meta-analysis encompassing five cohort studies involving 382,213 women demonstrated that the TyG index independently predicted the risk of developing GDM in Asian women. Another study carried out by Li et al22 similarly indicated a significant correlation between the TyG index in early pregnancy and the risk of GDM. Consequently, the TyG index emerges as a valuable predictor of GDM, standing as the most promising screening marker for effective GDM prediction.
Pregnancy induces a unique state of stress in the mother, representing a period marked by substantial alterations in both the form and physiology of women. Concurrently supplying energy to the fetus, considerable physiological transformations transpire in the mother’s glucose and lipid metabolism deemed a biologically imperative mechanism for furnishing fuel and nutrition to the developing fetus.23 While the precise mechanism underlying the association between the TyG index and TG/HDL-C and GDM remains elusive, it is plausible that insulin resistance may be implicated. In pregnant women, heightened estrogen levels and insulin resistance can enhance hepatic lipid synthesis.24 Early in pregnancy, there is an upsurge in blood lipid and triglyceride production, leading to elevated blood levels of free fatty acids. Elevated-free fatty acids may compromise insulin sensitivity,25 establishing a detrimental cycle between elevated triglyceride levels and IR, potentially culminating in impaired glucose tolerance and the onset of diabetes.26 Reduced insulin secretion, diminished insulin sensitivity, and attenuated AMP-activated protein kinase activity represent conceivable consequences of low HDL-C levels on glucose homeostasis.27,28
The HOMA-IR distribution exhibits variation in accordance with the demographic characteristics of the subjects, including age, gender, and ethnicity, thereby posing a challenge in determining the optimal cut-off point. While the TyG index and TG/HDL-c ratio are readily obtainable and calculable in clinical practice or large-scale epidemiological investigations, there exists limited data at present for establishing the optimal cut point for the TG/HDL-c ratio of the TyG index. Consequently, it becomes imperative to deliberate upon and ascertain the cut-off point for maternal TyG index and TG/HDL-c ratio in the first trimester, as a substitute for HOMA-IR. In a comprehensive prospective study on GDM conducted in China, the optimum predictive cutoff for TyG was determined to be 8.55,22 a value higher than that observed in our study. Consequently, additional investigations are warranted to elucidate the optimal inflection point of the TyG index and TG/HDL-c ratio for GDM prediction.
It is imperative to acknowledge certain limitations in the present study. The cross-sectional nature of the study, coupled with a relatively modest sample size, precludes the establishment of causal relationships. Conversely, the study lacked comprehensive data collection on factors such as dietary habits, family history, and previous pregnancies, all of which could potentially serve as confounding variables.
Conclusion
In summation, the TyG index and TG/HDL-C ratio emerge as viable alternatives to HOMA-IR, exhibiting predictive utility in anticipating the onset of GDM, with the TyG index demonstrating superior performance compared to the TG/HDL-C ratio.
Acknowledgments
The authors sincerely appreciate participants and obstetricians of Qinhuangdao Maternal and Child Health Hospital for their selfless assistance.
Disclosure
The authors have no commercial or financial relationships that could be construed as a potential conflict of interest for this study.
References
1. Lowe WL, Scholtens DM, Kuang A, et al. Hyperglycemia and Adverse Pregnancy Outcome Follow-up Study (HAPO FUS): maternal gestational diabetes mellitus and childhood glucose metabolism. Diabetes Care. 2019;42(3):372–380. doi:10.2337/dc18-1646
2. Ye W, Luo C, Huang J, Li C, Liu Z, Liu F. Gestational diabetes mellitus and adverse pregnancy outcomes: systematic review and meta-analysis. BMJ. 2022;377:e067946. doi:10.1136/bmj-2021-067946
3. Assi E, D’Addio F, Mando C, et al. Placental proteome abnormalities in women with gestational diabetes and large-for-gestational-age newborns. BMJ Open Diabetes Res Care. 2020;8(2):e001586. doi:10.1136/bmjdrc-2020-001586
4. Pervjakova N, Moen GH, Borges MC, et al. Multi-ancestry genome-wide association study of gestational diabetes mellitus highlights genetic links with type 2 diabetes. Hum Mol Genet. 2022;31(19):3377–3391. doi:10.1093/hmg/ddac050
5. Egan AM, Enninga EAL, Alrahmani L, Weaver AL, Sarras MP, Ruano R. Recurrent gestational diabetes mellitus: a narrative review and single-center experience. J Clin Med. 2021;10(4):569. doi:10.3390/jcm10040569
6. Matthews DR, Hosker JP, Rudenski AS, Naylor BA, Treacher DF, Turner RC. Homeostasis model assessment: insulin resistance and beta-cell function from fasting plasma glucose and insulin concentrations in man. Diabetologia. 1985;28(7):412–419. doi:10.1007/BF00280883
7. Yu X, Wang L, Zhang W, et al. Fasting triglycerides and glucose index is more suitable for the identification of metabolically unhealthy individuals in the Chinese adult population: a nationwide study. J Diabetes Investig. 2019;10(4):1050–1058. doi:10.1111/jdi.12975
8. Son DH, Lee HS, Lee YJ, Lee JH, Han JH. Comparison of triglyceride-glucose index and HOMA-IR for predicting prevalence and incidence of metabolic syndrome. Nutr Metab Cardiovasc Dis. 2022;32(3):596–604. doi:10.1016/j.numecd.2021.11.017
9. Gasevic D, Frohlich J, Mancini GB, Lear SA. The association between triglyceride to high-density-lipoprotein cholesterol ratio and insulin resistance in a multiethnic primary prevention cohort. Metabolism. 2012;61(4):583–589. doi:10.1016/j.metabol.2011.09.009
10. Metzger BE, Gabbe SG, Persson B, et al.; International Association of D, Pregnancy Study Groups. International association of diabetes and pregnancy study groups recommendations on the diagnosis and classification of hyperglycemia in pregnancy. Diabetes Care. 2010;33(3):676–682. doi:10.2337/dc09-1848
11. Plows JF, Stanley JL, Baker PN, Reynolds CM, Vickers MH. The pathophysiology of gestational diabetes mellitus. Int J Mol Sci. 2018;19(11):3342. doi:10.3390/ijms19113342
12. DeFronzo RA, Tobin JD, Andres R. Glucose clamp technique: a method for quantifying insulin secretion and resistance. Am J Physiol. 1979;237(3):E214–E223. doi:10.1152/ajpendo.1979.237.3.E214
13. Wallace TM, Levy JC, Matthews DR. Use and abuse of HOMA modeling. Diabetes Care. 2004;27(6):1487–1495. doi:10.2337/diacare.27.6.1487
14. Guerrero-Romero F, Simental-Mendia LE, Gonzalez-Ortiz M, et al. The product of triglycerides and glucose, a simple measure of insulin sensitivity. Comparison with the euglycemic-hyperinsulinemic clamp. J Clin Endocrinol Metab. 2010;95(7):3347–3351. doi:10.1210/jc.2010-0288
15. Li X, Li G, Cheng T, Liu J, Song G, Ma H. Association between triglyceride-glucose index and risk of incident diabetes: a secondary analysis based on a Chinese cohort study: tyG index and incident diabetes. Lipids Health Dis. 2020;19(1):236. doi:10.1186/s12944-020-01403-7
16. Pantoja-Torres B, Toro-Huamanchumo CJ, Urrunaga-Pastor D, et al. High triglycerides to HDL-cholesterol ratio is associated with insulin resistance in normal-weight healthy adults. Diabetes Metab Syndr. 2019;13(1):382–388. doi:10.1016/j.dsx.2018.10.006
17. Pazhohan A, Rezaee Moradali M, Pazhohan N. Association of first-trimester maternal lipid profiles and triglyceride-glucose index with the risk of gestational diabetes mellitus and large for gestational age newborn. J Matern Fetal Neonatal Med. 2019;32(7):1167–1175. doi:10.1080/14767058.2017.1402876
18. Kim JA, Kim J, Roh E, et al. Triglyceride and glucose index and the risk of gestational diabetes mellitus: a nationwide population-based cohort study. Diabet Res Clin Pract. 2021;171:108533. doi:10.1016/j.diabres.2020.108533
19. You Y, Hu H, Cao C, Han Y, Tang J, Zhao W. Association between the triglyceride to high-density lipoprotein cholesterol ratio and the risk of gestational diabetes mellitus: a second analysis based on data from a prospective cohort study. Front Endocrinol. 2023;14:1153072. doi:10.3389/fendo.2023.1153072
20. Sanchez-Garcia A, Rodriguez-Gutierrez R, Saldivar-Rodriguez D, et al. Early triglyceride and glucose index as a risk marker for gestational diabetes mellitus. Int J Gynaecol Obstet. 2020;151(1):117–123. doi:10.1002/ijgo.13311
21. Song T, Su G, Chi Y, Wu T, Xu Y, Chen C. Triglyceride-glucose index predicts the risk of gestational diabetes mellitus: a systematic review and meta-analysis. Gynecol Endocrinol. 2022;38(1):10–15. doi:10.1080/09513590.2021.1940932
22. Li H, Miao C, Liu W, et al. First-trimester triglyceride-glucose index and risk of pregnancy-related complications: a prospective birth cohort study in Southeast China. Diabetes Metab Syndr Obes. 2022;15:3705–3715. doi:10.2147/DMSO.S378964
23. Herrera E, Ortega-Senovilla H. Lipid metabolism during pregnancy and its implications for fetal growth. Curr Pharm Biotechnol. 2014;15(1):24–31. doi:10.2174/1389201015666140330192345
24. Rahnemaei FA, Pakzad R, Amirian A, Pakzad I, Abdi F. Effect of gestational diabetes mellitus on lipid profile: a systematic review and meta-analysis. Open Med. 2022;17(1):70–86. doi:10.1515/med-2021-0408
25. van de Woestijne AP, Monajemi H, Kalkhoven E, Visseren FL. Adipose tissue dysfunction and hypertriglyceridemia: mechanisms and management. Obes Rev. 2011;12(10):829–840. doi:10.1111/j.1467-789X.2011.00900.x
26. Manell H, Kristinsson H, Kullberg J, et al. Hyperglucagonemia in youth is associated with high plasma free fatty acids, visceral adiposity, and impaired glucose tolerance. Pediatr Diabetes. 2019;20(7):880–891. doi:10.1111/pedi.12890
27. Di Bartolo BA, Cartland SP, Genner S, et al. HDL improves cholesterol and glucose homeostasis and reduces atherosclerosis in diabetes-associated atherosclerosis. J Diabetes Res. 2021;2021:6668506. doi:10.1155/2021/6668506
28. Sposito AC, de Lima-Junior JC, Moura FA, et al. Reciprocal multifaceted interaction between HDL (High-Density Lipoprotein) and myocardial infarction. Arterioscler Thromb Vasc Biol. 2019;39(8):1550–1564. doi:10.1161/ATVBAHA.119.312880
 © 2024 The Author(s). This work is published and licensed by Dove Medical Press Limited. The
full terms of this license are available at https://www.dovepress.com/terms
and incorporate the Creative Commons Attribution
- Non Commercial (unported, 3.0) License.
By accessing the work you hereby accept the Terms. Non-commercial uses of the work are permitted
without any further permission from Dove Medical Press Limited, provided the work is properly
attributed. For permission for commercial use of this work, please see paragraphs 4.2 and 5 of our Terms.
© 2024 The Author(s). This work is published and licensed by Dove Medical Press Limited. The
full terms of this license are available at https://www.dovepress.com/terms
and incorporate the Creative Commons Attribution
- Non Commercial (unported, 3.0) License.
By accessing the work you hereby accept the Terms. Non-commercial uses of the work are permitted
without any further permission from Dove Medical Press Limited, provided the work is properly
attributed. For permission for commercial use of this work, please see paragraphs 4.2 and 5 of our Terms.
Recommended articles
Relationship Between Four Non-Insulin-Based Indexes of Insulin Resistance and Serum Uric Acid in Patients with Type 2 Diabetes: A Cross-Sectional Study
Han R, Zhang Y, Jiang X
Diabetes, Metabolic Syndrome and Obesity 2022, 15:1461-1471
Published Date: 9 May 2022
Lower ATG7 Levels are Associated with a Higher Risk of Gestational Diabetes Mellitus: A Cross-Sectional Study
Lu L, Ma Y, Deng J, Xie J, Huang C
Diabetes, Metabolic Syndrome and Obesity 2022, 15:2335-2343
Published Date: 4 August 2022
Association Between Triglyceride-Glucose Index and Serum Uric Acid Levels: A Biochemical Study on Anthropometry in Non-Obese Type 2 Diabetes Mellitus Patients
Luo Y, Hao J, He X, Wang C, Zhao H, Zhang Z, Yang L, Ren L
Diabetes, Metabolic Syndrome and Obesity 2022, 15:3447-3458
Published Date: 3 November 2022
Circulating Bone Morphogenetic Protein-9 is Decreased in Patients with Type 2 Diabetes and Non-Alcoholic Fatty Liver Disease
Hao J, Wang Y, Huo L, Sun T, Zhen Y, Gao Z, Chen S, Ren L
International Journal of General Medicine 2022, 15:8539-8546
Published Date: 7 December 2022
Deciphering the Role of CD36 in Gestational Diabetes Mellitus: Linking Fatty Acid Metabolism and Inflammation in Disease Pathogenesis
Huang L, Zhang T, Zhu Y, Lai X, Tao H, Xing Y, Li Z
Journal of Inflammation Research 2025, 18:1575-1588
Published Date: 4 February 2025