Back to Journals » Cancer Management and Research » Volume 11
First-Line Doublet Chemotherapy for Metastatic Triple-Negative Breast Cancer: Circulating Tumor Cell Analysis of the tnAcity Trial
Authors Liu MC, Janni W, Georgoulias V, Yardley DA, Harbeck N ![]() , Wei X, McGovern D, Beck R
, Wei X, McGovern D, Beck R ![]()
Received 2 April 2019
Accepted for publication 14 November 2019
Published 12 December 2019 Volume 2019:11 Pages 10427—10433
DOI https://doi.org/10.2147/CMAR.S208712
Checked for plagiarism Yes
Review by Single anonymous peer review
Peer reviewer comments 3
Editor who approved publication: Professor Harikrishna Nakshatri
Minetta C Liu,1 Wolfgang Janni,2 Vassilis Georgoulias,3 Denise A Yardley,4 Nadia Harbeck,5 Xin Wei,6 Desmond McGovern,7 Robert Beck7
1Department of Laboratory Medicine and Pathology, Mayo Clinic, Rochester, MN, USA; 2Department of Obstetrics and Gynecology, University Clinic Ulm, Ulm, Germany; 3Department of Medical Oncology, School of Medicine, University of Crete, Crete, Greece; 4Department of Medical Oncology, Breast Cancer Research Program, Sarah Cannon Research Institute, Nashville, TN, USA; 5Department of Breast Center, Oncological Therapy and Clinical Trials Unit, University of Munich (LMU), Munich, Germany; 6Department of Translational/Clinical Development, Celgene Corporation, Summit, NJ, USA; 7Department of Clinical Research, Celgene Corporation, Summit, NJ, USA
Correspondence: Minetta C Liu
Department of Laboratory Medicine and Pathology, Mayo Clinic, 200 First St SW, Rochester, MN 55905, USA
Tel +1 507 293 0526
Email [email protected]
Purpose: Circulating tumor cells (CTCs) are prognostic biomarkers in metastatic breast cancer, but their role in predicting treatment outcomes in metastatic triple-negative breast cancer (mTNBC) is less clear. The tnAcity trial demonstrated a significant progression-free survival (PFS) benefit with nab-paclitaxel (nab-P)/carboplatin (C) over nab-P/gemcitabine (G) or G/C in patients with mTNBC. We assessed the correlation between CTC dynamics and clinical benefit in all patients and by treatment arm.
Methods: CTC enumeration, performed using CELLSEARCH technology (Menarini Silicon Biosystems, Huntingdon Valley, PA, USA), was a prespecified exploratory endpoint in the tnAcity trial. Patients with TNBC were categorized based on pre- and post-treatment CTC levels: Group 1 (+ + +; elevated CTCs at baseline and postbaseline), Group 2 (+ ± ±; CTCs elevated at baseline and cleared postbaseline [cycle 3 and/or cycle 5]), or Group 3 (−; no CTCs detected at baseline). The baseline cutoff was ≥1 CTC/7.5 mL for the main analysis; cutoffs of ≥2 and ≥5 CTCs were used for supporting analyses.
Results: The main analysis included 126 patients (Group 1, n = 24; Group 2, n = 54; and Group 3, n = 48). The median PFS was longer in Group 2 vs Group 1 (8.5 vs 4.7 months; HR, 0.30 [95% CI, 0.17–0.54]). These results were supported by the ≥2- and ≥5-CTC cutoff analyses. The median overall survival rates were 17.8, 16.0, and 9.8 months in Groups 2, 3, and 1, respectively. The overall response rates were 79.6%, 43.8%, and 29.2%, respectively. A numerically higher percentage of patients had CTC clearance during nab-P/C treatment vs nab-P/G or G/C.
Conclusion: Efficacy outcomes trended positively with chemotherapy-induced elimination of CTCs, suggesting that CTC clearance may predict the chemosensitivity of mTNBC tumors.
Trial registration: EudraCT Number: 2013-000113-20; ClinicalTrials.gov number: NCT01881230.
Keywords: metastatic triple-negative breast cancer, circulating tumor cells, nab-paclitaxel, chemotherapy, prognosis
Introduction
Circulating tumor cell (CTC) enumeration is gaining importance in cancer therapy due to its potential to guide prognosis and treatment, measure tumor burden and response to treatment, and detect recurrent disease.1 The prognostic value of CTCs has been established in studies of patients with both early-stage and metastatic breast cancer (MBC).2,3
CELLSEARCH technology (Menarini Silicon Biosystems, Huntingdon Valley, PA, USA) has been cleared by the US Food and Drug Administration as an aid in monitoring patients with MBC, colorectal cancer, or prostate cancer.4 Prospective studies using CELLSEARCH have demonstrated that patients with MBC and ≥5 CTCs/7.5 mL of blood at baseline have shorter progression-free survival (PFS) and overall survival (OS) than those with <5 CTCs. Moreover, CTC clearance during treatment (a decrease from ≥5 CTCs at baseline to <5 CTCs postbaseline) has been associated with improved outcomes compared with no clearance (≥5 CTCs at all time points, including baseline).5,6 These findings have been confirmed by prospective and pooled analyses with larger patient numbers.7–9
A recent prospective CTC study included a subset of patients with hormone receptor-negative, human epidermal growth factor receptor 2 (HER2)-negative breast cancer (triple-negative breast cancer [TNBC]). In that study, it was reported that OS outcomes were best in patients with low CTCs at baseline (<5 CTCs/7.5 mL), followed by those who experienced a reduction in CTCs upon treatment (a decrease to <5 CTCs from baseline). OS outcomes were worst among patients with CTCs unresponsive to therapy (persistent increase of ≥5 CTCs postbaseline).10
The multicenter, open-label, randomized, Phase II/III tnAcity trial evaluated the efficacy and safety of 3 chemotherapy regimens (nab-paclitaxel [nab-P]/carboplatin [C], nab-P/gemcitabine [G], and G/C) as first-line treatment for patients with metastatic TNBC (mTNBC).11 nab-P/C treatment resulted in a significantly longer median PFS and numerically higher overall response rate (ORR) compared with nab-P/G or G/C; grade ≥3 adverse events were mainly hematologic.12 The findings of a prespecified exploratory analysis investigating the correlation of CTC levels with ORR, PFS, and OS are reported here.
Materials and Methods
Study Design and Patients
The tnAcity trial investigated weekly treatment with nab-P/C or nab-P/G vs G/C in patients with mTNBC (Figure S1), and the study design has been previously reported.12 Briefly, key eligibility requirements included measurable metastatic disease per Response Evaluation Criteria In Solid Tumors (RECIST) version 1.1, Eastern Cooperative Oncology Group performance status (ECOG PS) ≤1, and prior adjuvant or neoadjuvant anthracycline therapy (unless not indicated by physician).
The trial was registered at ClinicalTrials.gov (NCT01881230), approved by institutional review boards or independent ethics committees at each of the 52 participating sites (Table S1), and conducted in accordance with the Declaration of Helsinki and Good Clinical Practice Guidelines of the International Conference on Harmonisation. All patients provided written informed consent prior to study entry.
Endpoints and Study Assessments
The primary endpoint of Phase II was investigator-assessed PFS per RECIST 1.1. Secondary endpoints included investigator-assessed ORR, OS, and safety. CTC enumeration was a prespecified exploratory endpoint. CTCs were measured before treatment on day 1 of cycle 1 (baseline) and day 1 of cycles 3 and 5 (postbaseline). Briefly, 8 to 10 mL of whole blood was collected in a CellSave blood collection tube (Menarini Silicon Biosystems). CTC enrichment and enumeration were performed using the CELLSEARCH CTC Test according to the manufacturer’s instructions.
The standard, established CTC cutoff in the MBC setting is 5 CTCs.4,5 A cutoff of ≥1 CTC was used for the main analysis of the current study because it increased the sensitivity of the analysis. Cutoffs of ≥2 and ≥5 CTCs were used for supportive analyses. All CTC cutoffs and values are reported per 7.5 mL of blood. For analyses by CTC clearance, patients were classified into 3 groups according to presence of CTCs at baseline and change in CTC levels postbaseline: Group 1 (+ + +; CTCs elevated at baseline and both postbaseline visits), Group 2 (+ ± ±; CTCs elevated at baseline and cleared at ≥1 postbaseline visit), and Group 3 (−; no CTCs at baseline) (Table S2). In additional analyses, patients were grouped exclusively by the presence or absence of CTCs at baseline.
Statistical Methods
The Kaplan–Meier method was used to estimate the distribution of PFS and OS with a log-rank test. The Kaplan–Meier curves were presented individually for each group. The hazard ratio (HR) between these groups and the associated 2-sided 95% CI were estimated using a Cox proportional hazards model.
Results
Patients and Baseline CTC Levels
A total of 191 patients were enrolled in the tnAcity trial,12 and 126 patients were included in the main analysis (≥1-CTC cutoff; 24, 54, and 48 patients were included in Groups 1, 2, and 3, respectively). Across the 3 groups, most patients were aged <65 years and had an ECOG PS of 0 (Table 1). In the ≥2-CTC cutoff analysis, 16, 44, and 69 patients were included in Groups 1, 2, and 3, respectively, while the ≥5-CTC cutoff analysis included 10, 34, and 87 patients, respectively (Tables S3 and S4).
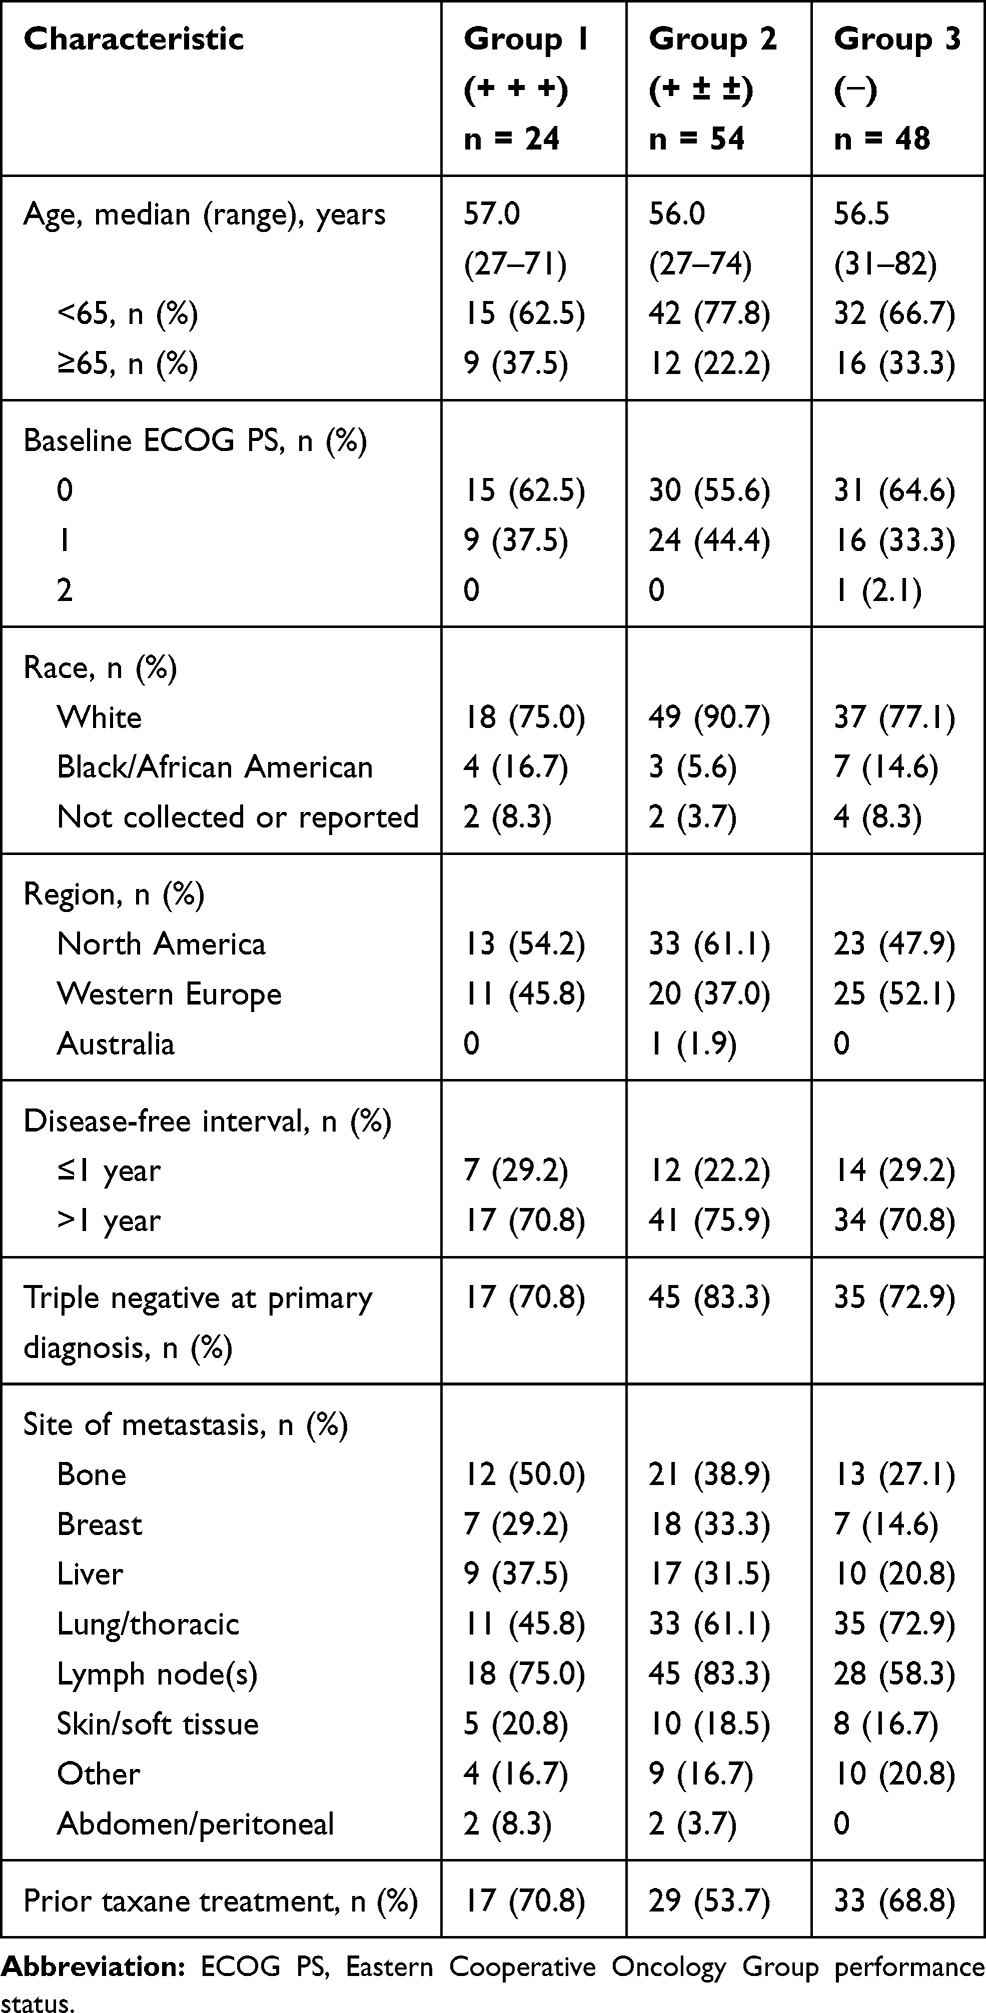 |
Table 1 Patient Baseline Characteristics in the Main Analysis of ≥1 Circulating Tumor Cell |
At baseline, the median CTC level in Group 1 was 21.5, with levels of 3.0 and 9.8 at cycles 3 and 5, respectively (Table 2). In Group 2, patients had a median of 5.0 CTCs at baseline, and 0 CTCs were detected at cycles 3 and 5. Patients in Group 3 had no CTCs detected at baseline.
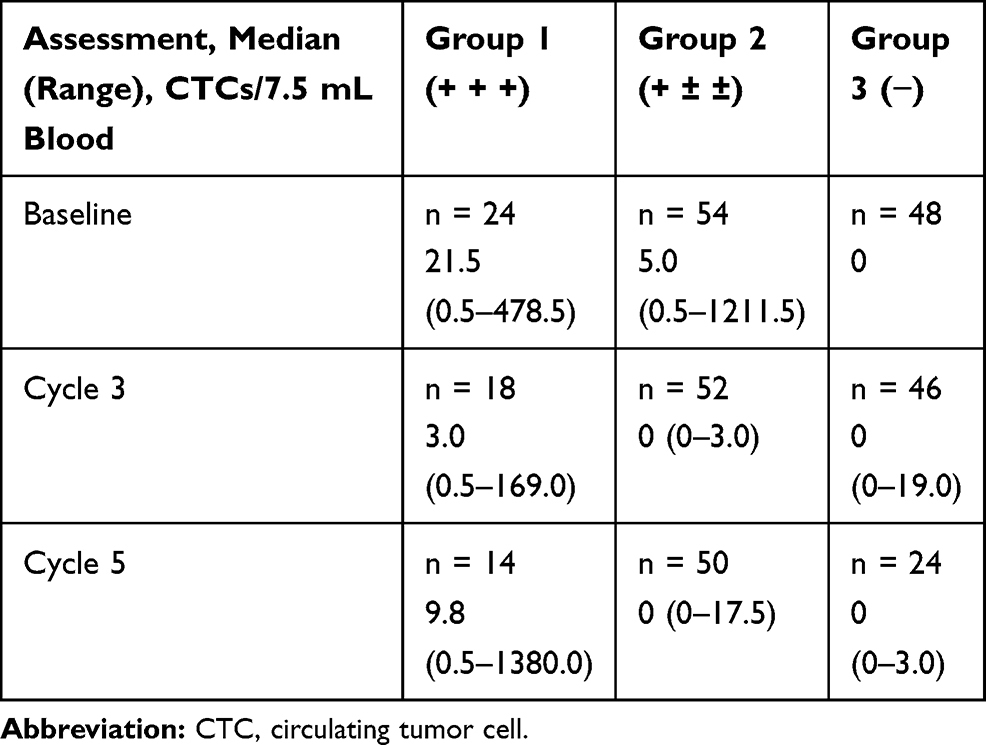 |
Table 2 Median Circulating Tumor Cell Values at Each Assessment |
Efficacy
Patients in Group 2 had the highest ORR (79.6%), followed by Group 3 (43.8%) and Group 1 (29.2%) (Table 3). Patients in Group 2 also had a longer median PFS compared with Group 1 (8.5 vs 4.7 months; HR, 0.30 [95% CI, 0.17–0.54]; Figure 1A). The median PFS was 5.9 months in Group 3. Compared with Group 1 (9.8 months), the median OS was longer in both Groups 2 (17.8 months; HR, 0.35 [95% CI, 0.20–0.62]) and 3 (16.0 months; HR, 0.40 [95% CI, 0.22–0.73]; Figure 1B).
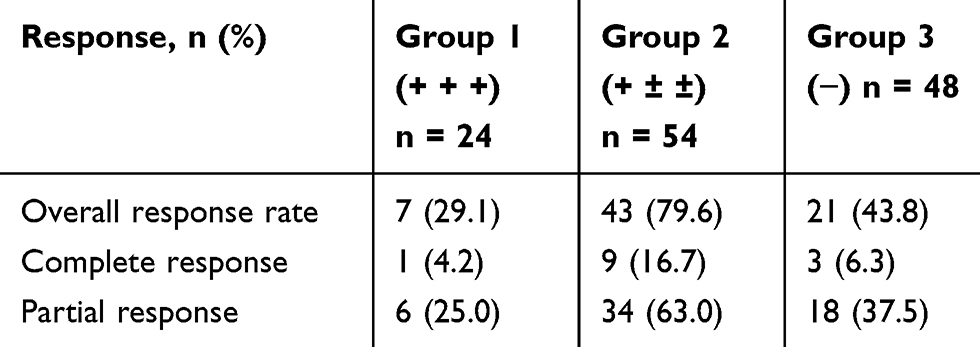 |
Table 3 Response by Change in Circulating Tumor Cell (CTC) Levels from Baseline in the Main Analysis of ≥1 CTC |
 |
Figure 1 Efficacy outcomes by change in circulating tumor cell levels from baseline. Kaplan–Meier plots of (A) PFS and (B) OS. Notes: Group 1 (+ + +), elevated at baseline and elevated postbaseline; Group 2 (+ ± ±), elevated at baseline and cleared postbaseline (cycle 3 and/or cycle 5); Group 3 (−), no CTCs detected at baseline. a vs Group 1. Abbreviations: HR, hazard ratio; OS, overall survival; PFS, progression-free survival. |
The ORR and PFS results were supported by the ≥2- and ≥5-CTC cutoff analyses (Table S5). In the ≥2-CTC cutoff analysis, patients in Group 2 had a higher ORR (77.3%) compared with Group 3 (47.8%) and Group 1 (31.3%). In the same analysis, the median PFS was 8.9 months in Group 2 and 6.0 months in Group 3 vs 4.7 months in Group 1, and the median OS was 16.8 months in Group 2 and 16.2 months in Group 3 vs 9.8 months in Group 1. Similarly, in the ≥5-CTC cutoff analysis, the ORRs were 82.4%, 48.3%, and 20.0% in Groups 2, 3, and 1, respectively. The median PFS rates were 8.4, 6.5, and 4.7 months, respectively. Patients in Group 3 had the longest median OS (16.0 months), followed by Group 2 (15.4 months) and Group 1 (9.8 months) (Table S5).
Efficacy by Baseline CTC Levels
An efficacy analysis based on the presence or absence of CTCs at baseline revealed that patients with 0 detected CTCs at baseline had a lower ORR (43.8%) than those with ≥1 CTC at baseline (64.1%). The median PFS (5.9 vs 7.0 months; HR, 1.45 [95% CI, 0.93–2.25]; Figure 2A) and OS (16.0 vs 15.0 months; HR, 0.90 [95% CI, 0.57–1.42]; Figure 2B) were similar for patients with 0 vs ≥1 CTC at baseline, respectively. Additional analyses using cutoffs of ≥2 and ≥5 CTCs at baseline support these results (Table S6).
 |
Figure 2 Efficacy outcomes by the absence or presence of circulating tumor cells at baseline. Kaplan–Meier plots of (A) PFS and (B) OS. Abbreviations: CTC, circulating tumor cell; HR, hazard ratio; OS, overall survival; PFS, progression-free survival. |
Efficacy by Treatment Group
An analysis of CTC dynamics by treatment received showed that more patients in the nab-P/C arm had postbaseline CTC clearance (Group 2) than in the nab-P/G and G/C arms (60.0% vs 28.2% vs 38.1%; Table 4). In general, patterns of PFS were similar regardless of treatment arm, with numerically longer median PFS values associated with Groups 2 and 3 compared with Group 1; however, no formal statistical analyses were performed to support this comparison. These results were supported in the ≥2- and ≥5-CTC cutoff analyses (Table S7).
 |
Table 4 PFS by Treatment Arm and Change in Circulating Tumor Cell (CTC) Levels from Baseline in the Main Analysis of ≥1 CTC |
Discussion
The tnAcity CTC analysis revealed better efficacy outcomes in patients with CTC clearance. A numerically higher percentage of patients in the nab-P/C arm experienced CTC clearance during treatment than in the nab-P/G and G/C arms, suggesting improved antitumor activity with nab-P/C. We report the results with ≥1-, ≥2-, and ≥5-CTC cutoffs, but to increase the sensitivity of our detection method, a cutoff of ≥1 CTC was used for the main analysis. Among the 3 cutoffs, the ≥1-CTC cutoff analysis included the largest number of patients (n = 24) in Group 1. As the CTC threshold increased, fewer patients were included in Group 1; therefore, these analyses were considered more cautiously. It should be noted that results were generally consistent across CTC thresholds.
The ORR was lower among patients with no detectable CTCs at baseline compared with those with ≥1 detectable CTC. Although the differences in PFS and OS between these cohorts were small, the results were not aligned. However, the ORR, PFS, and OS results all suggest better outcomes among patients with CTC levels at baseline that were reduced or eliminated in subsequent cycles compared with CTC levels that persisted postbaseline. Therefore, within the limits of the system used in this study, the data suggest that the response of CTCs to treatment, rather than the presence or absence of CTCs per se, may predict outcomes.
We reported a decrease from baseline CTC levels with doublet chemotherapy in >28% of patients; in particular, CTC clearance from baseline was noted in 60% of patients in the nab-P/C arm. A previous meta-analysis using CELLSEARCH CTC enumeration, which included 6 studies and >800 patients with MBC showed that ≥5 CTCs/7.5 mL at baseline and persistently elevated levels during treatment were associated with the worst PFS and OS outcomes, irrespective of type and line of treatment.13 In a larger, pooled analysis of >1900 patients with MBC, the ≥5-CTC threshold at baseline and increased CTC levels after baseline were significantly correlated with decreased PFS and OS compared with baseline levels of <5 CTCs.7 Similar findings emerged from the large, prospective, randomized study SWOG S0500 (also based on the CELLSEARCH platform), in which patients with TNBC and low CTC levels at baseline, as well as those who had CTC clearance with chemotherapy treatment, had a longer OS compared with those who had elevated CTC levels at baseline and after treatment.10 In addition, treatment with chemotherapy reduced baseline CTC levels in 55% of patients with TNBC. However, changing to an alternative chemotherapy regimen based on CTC levels did not improve survival outcomes in the patients with MBC evaluated in the SWOG S0500 study.
The publication of CTC studies with conflicting results regarding treatment outcomes is acknowledged. For example, a meta-analysis of 50 studies and >6700 patients demonstrated that systemic therapy, whether single-agent or combination treatment in the neoadjuvant, adjuvant, or metastatic setting, reduced CTC levels in patients with breast cancer overall,14 but the CTC reduction appeared to be limited to patients with HER2+/− disease. However, in addition to including several different CTC platforms, the biology of the breast cancers included in this meta-analysis varied and included multiple disease settings (eg, early stage vs advanced) and subtypes (eg, only 2 TNBC studies [of which only 1 was in the metastatic setting]). In addition, a prospective study in TNBC comparing CELLSEARCH and immunomagnetic enrichment/flow cytometry methods revealed an association between baseline CTC levels and OS but not time to progression, and changes in CTC levels during chemotherapy were significantly associated with both time to progression and OS, regardless of the enumeration platform.15
The present study has potential limitations that must be considered. First, the CELLSEARCH platform relies on the capture of CTCs based on epithelial cell adhesion molecule (EpCAM) expression and excludes populations of low- or non-EpCAM-expressing cells in circulation. As a result, if tumor cells have undergone epithelial to mesenchymal transition, CTC detection may be less precise, as CTCs in TNBC often lack EpCAM expression and exhibit more stem cell-like properties.1,16 In addition, it is possible that the proportion of epithelial cells relative to cells that underwent an epithelial to mesenchymal transition changed during treatment. Therefore, the perceived clearance may be the result of a population of CTCs that became undetectable.17,18 Second, we acknowledge that the small number of CTC patient samples (N = 126) limits the ability to draw definitive conclusions, as this study was not powered to assess the outcomes investigated within. Additional studies including more patient samples are warranted.
Data Sharing
Data requests may be submitted to Celgene at www.CelgeneClinicalDataSharing.com and must include a description of the research proposal.
Acknowledgments
This work was supported by Celgene Corporation (no grant number applies). Medical writing assistance was provided by Mihaela Marina, PhD, of MediTech Media, Ltd, funded by Celgene Corporation. This paper was presented at the 2018 American Association for Cancer Research (AACR) Annual Meeting as a poster presentation with interim findings. The poster abstract was published in Cancer Res. 2018;78(13 Suppl):Abstract 4209.
Author Contributions
MCL, WJ, VG, DAY, and NH contributed to data collection. XW analyzed the data. All authors interpreted the data and revised the report critically. All authors reviewed and approved the final version of the report to submit for publication. All authors agreed to be accountable for all aspects of the work and to ensure that questions related to the accuracy or integrity of any part of the work are appropriately investigated and resolved.
Disclosure
Dr Liu reports nonfinancial support from MediTech Media during the conduct of the study, her institution received funding from Celgene to conduct the trial. Dr Liu had received clinical trial support from Eisai, Genentech, GRAIL, Janssen, Merck, Novartis, Seattle Genetics and Tesaro. Dr Liu also received nonfinancial support from Ionis, nonfinancial support from Pfizer, nonfinancial support from Syndax, nonfinancial support from Agena, nonfinancial support from Cynvenio, and nonfinancial support from Menarini Silicon Biosystems outside the submitted work. Dr Janni reports grants from Celgene during the conduct of the study. Dr Yardley reports grants from Novartis during the conduct of the study. Sarah Cannon, the institution for which Dr Yardley serves as a research leader, has been paid for consulting/advisory roles from the following companies: Abraxis, Amgen, Alexion, Astellas, AstraZeneca, Bayer, Boehringer Ingelheim, Bristol-Myers Squibb, Celgene, Eisai, Lilly, Roche/Genentech, Gilead, GlaxoSmithKline, Janssen, Luitpold, Medivation, Novartis, Otsuka, Pfizer, ProStrakan, Spectrum, Janssen, Ipsen, Novartis, R-Pharm US, Millennium, Seattle Genetics, Sanofi, Merck, Merrimack, AbbVie, Incyte, Concordia, Genzyme, Exelixis, Nippon Kayaku, Odonate, ELM Medical, Biotheranostics, and Hengrui; and funding for the conduct of research projects has been provided by the following companies: AbbVie, Amgen, Astellas, AstraZeneca, Bayer, BioMarin, Bristol-Myers Squibb, Celgene, Concordia, Eisai, Exelixis, Genentech, Genzyme, GlaxoSmithKline, ImClone, Incyte, Ipsen, Janssen, Lilly, MedImmune, Medivation, Merck, Merrimack, Novartis, Pfizer, Roche, Sanofi, Spectrum, and Tesaro. Dr Harbeck reports personal fees from Celgene during the conduct of the study. Mr McGovern, Mr Beck and Dr Wei reports employment and stock options from Celgene during the conduct of the study. The authors report no other conflicts of interest in this work.
References
1. Krebs MG, Hou JM, Ward TH, Blackhall FH, Dive C. Circulating tumour cells: their utility in cancer management and predicting outcomes. Ther Adv Med Oncol. 2010;2(6):351–365. doi:10.1177/1758834010378414
2. Pukazhendhi G, Gluck S. Circulating tumor cells in breast cancer. J Carcinog. 2014;13:8. doi:10.4103/1477-3163.135578
3. Sparano J, O’Neill A, Alpaugh K, et al. Association of circulating tumor cells with late recurrence of estrogen receptor-positive breast cancer: a secondary analysis of a randomized clinical trial. JAMA Oncol. 2018;4(12):1700–1706. doi:10.1001/jamaoncol.2018.2574
4. Menarini Silicon Biosystems Inc. CellSearch Circulating Tumor Cell Kit. [Instructions for Use]. Huntingdon Valley, PA: Menarini Silicon Biosystems Inc; 2017.
5. Cristofanilli M, Budd GT, Ellis MJ, et al. Circulating tumor cells, disease progression, and survival in metastatic breast cancer. N Engl J Med. 2004;351(8):781–791. doi:10.1056/NEJMoa040766
6. Hayes DF, Cristofanilli M, Budd GT, et al. Circulating tumor cells at each follow-up time point during therapy of metastatic breast cancer patients predict progression-free and overall survival. Clin Cancer Res. 2006;12(14 Pt 1):4218–4224. doi:10.1158/1078-0432.CCR-05-2821
7. Bidard F-C, Peeters DJ, Fehm T, et al. Clinical validity of circulating tumour cells in patients with metastatic breast cancer: a pooled analysis of individual patient data. Lancet Oncol. 2014;15(4):406–414. doi:10.1016/S1470-2045(14)70069-5
8. Liu MC, Shields PG, Warren RD, et al. Circulating tumor cells: a useful predictor of treatment efficacy in metastatic breast cancer. J Clin Oncol. 2009;27(31):5153–5159. doi:10.1200/JCO.2008.20.6664
9. Pierga JY, Hajage D, Bachelot T, et al. High independent prognostic and predictive value of circulating tumor cells compared with serum tumor markers in a large prospective trial in first-line chemotherapy for metastatic breast cancer patients. Ann Oncol. 2012;23(3):618–624. doi:10.1093/annonc/mdr263
10. Smerage JB, Barlow WE, Hortobagyi GN, et al. Circulating tumor cells and response to chemotherapy in metastatic breast cancer: SWOG S0500. J Clin Oncol. 2014;32(31):3483–3489. doi:10.1200/JCO.2014.56.2561
11. Yardley DA, Brufsky A, Coleman RE, et al. Phase II/III weekly nab-paclitaxel plus gemcitabine or carboplatin versus gemcitabine/carboplatin as first-line treatment of patients with metastatic triple-negative breast cancer (the tnAcity study): study protocol for a randomized controlled trial. Trials. 2015;16:575. doi:10.1186/s13063-015-1101-7
12. Yardley DA, Coleman R, Conte P, et al. nab-Paclitaxel plus carboplatin or gemcitabine versus gemcitabine plus carboplatin as first-line treatment of patients with triple-negative metastatic breast cancer: results from the tnAcity trial. Ann Oncol. 2018;29(8):1763–1770. doi:10.1093/annonc/mdy201
13. Liu MC, Mego M, Nakamura S, et al. Clinical validity of circulating tumor cells (CTC) enumeration in 841 subjects with metastatic breast cancer (MBC). J Clin Oncol. 2011;29(suppl 15):10592. [abstract 10592]. doi:10.1200/jco.2011.29.15_suppl.10592
14. Yan WT, Cui X, Chen Q, et al. Circulating tumor cell status monitors the treatment responses in breast cancer patients: a meta-analysis. Sci Rep. 2017;7:43464. doi:10.1038/srep43464
15. Magbanua MJ, Carey LA, DeLuca A, et al. Circulating tumor cell analysis in metastatic triple-negative breast cancers. Clin Cancer Res. 2015;21(5):1098–1105. doi:10.1158/1078-0432.CCR-14-1948
16. Yang MH, Imrali A, Heeschen C. Circulating cancer stem cells: the importance to select. Chin J Cancer Res. 2015;27(5):437–449. doi:10.3978/j.issn.1000-9604.2015.04.08
17. Bulfoni M, Gerratana L, Del Ben F, et al. In patients with metastatic breast cancer the identification of circulating tumor cells in epithelial-to-mesenchymal transition is associated with a poor prognosis. Breast Cancer Res. 2016;18(1):30. doi:10.1186/s13058-016-0687-3
18. Yu M, Bardia A, Wittner BS, et al. Circulating breast tumor cells exhibit dynamic changes in epithelial and mesenchymal composition. Science. 2013;339(6119):580–584. doi:10.1126/science.1228522
 © 2019 The Author(s). This work is published and licensed by Dove Medical Press Limited. The
full terms of this license are available at https://www.dovepress.com/terms
and incorporate the Creative Commons Attribution
- Non Commercial (unported, 3.0) License.
By accessing the work you hereby accept the Terms. Non-commercial uses of the work are permitted
without any further permission from Dove Medical Press Limited, provided the work is properly
attributed. For permission for commercial use of this work, please see paragraphs 4.2 and 5 of our Terms.
© 2019 The Author(s). This work is published and licensed by Dove Medical Press Limited. The
full terms of this license are available at https://www.dovepress.com/terms
and incorporate the Creative Commons Attribution
- Non Commercial (unported, 3.0) License.
By accessing the work you hereby accept the Terms. Non-commercial uses of the work are permitted
without any further permission from Dove Medical Press Limited, provided the work is properly
attributed. For permission for commercial use of this work, please see paragraphs 4.2 and 5 of our Terms.