")
Back to Journals » OncoTargets and Therapy » Volume 9
Filtered selection coupled with support vector machines generate a functionally relevant prediction model for colorectal cancer
Authors Gabere M, Hussein M, Aziz M
Received 22 October 2015
Accepted for publication 8 February 2016
Published 1 June 2016 Volume 2016:9 Pages 3313—3325
DOI https://doi.org/10.2147/OTT.S98910
Checked for plagiarism Yes
Review by Single anonymous peer review
Peer reviewer comments 3
Editor who approved publication: Dr Faris Farassati
Musa Nur Gabere,1 Mohamed Aly Hussein,1 Mohammad Azhar Aziz2
1Department of Bioinformatics, King Abdullah International Medical Research Center/King Saud bin Abdulaziz University for Health Sciences, Riyadh, Saudi Arabia; 2Colorectal Cancer Research Program, Department of Medical Genomics, King Abdullah International Medical Research Center, Riyadh, Saudi Arabia
Purpose: There has been considerable interest in using whole-genome expression profiles for the classification of colorectal cancer (CRC). The selection of important features is a crucial step before training a classifier.
Methods: In this study, we built a model that uses support vector machine (SVM) to classify cancer and normal samples using Affymetrix exon microarray data obtained from 90 samples of 48 patients diagnosed with CRC. From the 22,011 genes, we selected the 20, 30, 50, 100, 200, 300, and 500 genes most relevant to CRC using the minimum-redundancy–maximum-relevance (mRMR) technique. With these gene sets, an SVM model was designed using four different kernel types (linear, polynomial, radial basis function [RBF], and sigmoid).
Results: The best model, which used 30 genes and RBF kernel, outperformed other combinations; it had an accuracy of 84% for both ten fold and leave-one-out cross validations in discriminating the cancer samples from the normal samples. With this 30 genes set from mRMR, six classifiers were trained using random forest (RF), Bayes net (BN), multilayer perceptron (MLP), naïve Bayes (NB), reduced error pruning tree (REPT), and SVM. Two hybrids, mRMR + SVM and mRMR + BN, were the best models when tested on other datasets, and they achieved a prediction accuracy of 95.27% and 91.99%, respectively, compared to other mRMR hybrid models (mRMR + RF, mRMR + NB, mRMR + REPT, and mRMR + MLP). Ingenuity pathway analysis was used to analyze the functions of the 30 genes selected for this model and their potential association with CRC: CDH3, CEACAM7, CLDN1, IL8, IL6R, MMP1, MMP7, and TGFB1 were predicted to be CRC biomarkers.
Conclusion: This model could be used to further develop a diagnostic tool for predicting CRC based on gene expression data from patient samples.
Keywords: colorectal cancer, support vector machines, exon microarray, minimum redundancy maximum relevance, predictive model, pathway analysis, biomarkers
Introduction
Mortality from cancer is projected to continue rising worldwide, with an estimated total number of 12 million deaths by 2030.1 Early detection of cancer is considered to be crucial for better management of this disease. In certain cancers, preventive screening is changing the trends in reported incidence, and colorectal cancer (CRC) management has benefited immensely from this strategy.2 In the past 10 years, the rate of CRC-associated mortality has decreased by 20%, owing to a combination of advances in its diagnosis and treatment.3 CRC is one of the most lethal types of cancer and is ranked first and third among all cancer incidences in men and women in Saudi Arabia, respectively.4
An effective detection strategy is contingent on reliable diagnostic tools. Virtual colonoscopy,5 tests for DNA methylation markers in stool,6 and fecal occult blood test7 are potentially useful diagnostic strategies. There have been advances in imaging techniques that are used for the noninvasive diagnosis and staging of CRC as well as for the evaluation of treatment.3 Colonoscopy is the most common and effective way to accurately diagnose and determine the stage of CRC. Once a patient undergoes an invasive procedure such as colonoscopy, tissue specimens are collected and sent to a pathologist for diagnosis. A correct diagnosis relies on the site of sample collection as well as examination of the pathology of tissue specimens.
There has been an ongoing search for accurate biomarkers of diagnostic, prognostic, and predictive value. In addition to genes associated with well-known pathways that are altered in CRC, microRNAs show potential as biomarkers of this disease.8 Most of these gene and microRNA biomarkers have been used to classify cancer and predict responses to therapies.9,10 Predictive and prognostic gene signatures have been developed but are yet to be implemented in clinical trials because of several challenges.11
Several computational methods have been used for predicting cancer. These methods can be classified into network- and nonnetwork-based methods. In network-based methods, pathways related to cancer are used as prediction features in the modeling process, whereas in nonnetwork-based methods, prediction features are selected based on individual gene expression. Examples of network-based prediction methods include the use of Bayesian evolutionary hypergraph learning12 and centrality measures.13 Nonnetwork-based methods select features (genes) from gene expression data by applying either filter, wrapper, or embedded methods. Filter methods use a ranking measure that is independent of the classifier, whereas wrapper methods search the feature space and rank a subset of features using the prediction accuracy of the classifier. Both wrapper and embedded methods depend on the classifier in the selection of the features, but embedded method searches are guided by the learning process.14 Examples of nonnetwork-based methods include recursive feature elimination (RFE),15 minimum-redundancy–maximum-relevance (mRMR),16 genetic algorithm,17 signal-to-noise ratio,18 partial least squares,14 and deep learning (DL).19
There are several challenges in prediction of cancer. First, the selection of factors based on certain measures contains superfluous features. Such redundancy leads to poor performance of the classification algorithm.20 Second, selecting the optimal number of features to be used in creating the classification model is crucial. The selection of optimal features to use is considered a global optimization problem. One major problem for feature selection studies is the vast search space of different combinations of gene interactions. In general, an exhaustive search is not an ideal way to solve this problem. Many studies employed feature selection to reduce a large number of genes from microarray experiment. Guo et al21 employed feature selection of 27,336 features of 176 subjects.21 Third, the right choice of classification affects the prediction accuracy.22 Finally, the use of small sample size relative to the number of features poses a problem.
In this study, we aimed at creating a model that could predict CRC by building a binary model using exon array data obtained from tissue samples belonging to patients with CRC. We used a combination of filtered gene selection, mRMR method,16 and support vector machines23 (SVM) to develop a prediction model that could be useful in classifying samples into normal and cancer. We chose a discrete set of genes from mRMR and selected the set with the best prediction accuracy. The gene expression of the selected gene list was chosen as an input training set for other comparable machine learning techniques, namely, Bayes net (BN), random forest (RF), naïve Bayes (NB), reduced error pruning tree (REPT), and (MLP). All these models were validated using an independent dataset. The SVM model showed the best prediction accuracy of 95.27% using the independent dataset with a small panel of 30 genes. Lower number of genes is desirable for validation experiments and developing assays. Furthermore, we investigated the relevance of the selected gene panel as reflected by their known involvement in CRC. The genes used to create the model were found to be associated with colorectal adenocarcinoma, colon cancer, colon tumor, and CRC, suggesting their probable functional relevance in CRC.
Materials and methods
The methodology used in this study is presented as a flowchart in Figure 1, and the details will be presented in the following sections.
 | Figure 1 Flowchart depicting the methodology adopted in this study. |
Patient samples and RNA extraction
Patient sample collection and RNA extraction were performed as previously described.24 Briefly, 46 cancer and 44 normal samples were obtained after the requisite approval by King Abdullah International Medical Research Center. The samples were obtained from biopsies as well as surgical resections. Written informed consent from all patients was obtained. All the samples were immediately stored in the RNAlater reagent until the extraction of nucleic acids. Homogenization was carried out using a QiaPrep homogenizer (Qiagen, Hilden, Germany) with stainless steel beads (5 mm). RNA extraction was performed using a Macherey-Nagel TripPrep kit (Macherey-Nagel Inc., Bethlehem, PA, USA) using less than 30 mg of tissue. Human Exon ST 1.0 arrays (containing probes of exons belonging to 22,011 genes) from Affymetrix (Santa Clara, CA, USA) were used as previously described24 together with the amplification and labeling kit from Ambion (Foster City, CA, USA).
Quantile normalization
All data were deposited in the GEO database under the accession number GSE50421 and GSE77434 (90 samples: 44 normal samples and 46 cancer samples). Data were exported as CEL files (which contain data on the intensity of each signal, indicating the expression level of the gene corresponding to each probe) and processed using Expression Console software (Affymetrix). To validate the model created, we used the data with following accession numbers, namely, GSE36400 (five normal and nine cancer), GSE42690 (19 normal), and GSE24550 (142 cancer). All data were subjected to quantile normalization using Integromics Omicsoffice software, which is available at www.integromics.com.
Gene selection
We first identified and ranked genes using a technique called mRMR.16 mRMR is a filter approach that uses a mutual information technique to select a small subset of features from a large set, for example, a small number of genes out of thousands in a microarray data. mRMR ranks genes according to their differential expression among phenotypes (normal and cancer) and selects the top-ranked genes. Gene selection using mRMR is crucial in machine learning as it chooses a subgroup of genes that are relevant to the parameters used, hence the term maximum relevance. Furthermore, mRMR reduces this subgroup to a smaller set by removing redundant genes. Both relevance and redundancy are quantified by the following mutual information, that is,
|
|
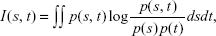
where s and t are vectors, p(s, t) is the joint probability density, and p(s) and p(t) are the marginal probability densities. mRMR takes the dataset as its input, and the parameters chosen are n which is the number of features to select (that is, n=10, 20, 30 50, etc), the selection method (m), which is set to mutual information difference, and the number of attributes (v), which is taken as 23,000. The command line for selecting, for example, the best 20 genes using mRMR is as follows:
mrmr − i90_smaples.csv − n20 − v23,000 >best_20_features.txt | (2) |
To use mRMR, we need to transform the data into mRMR format where the gene IDs are represented as columns and the class label and its corresponding gene expression are represented as rows. To do this, we transpose the gene expression data.
Creation of the prediction model
An SVM25,26 is a modeling technique that performs data classification by constructing an n-dimensional hyperplane that optimally separates the data into two classes. The input of an SVM is a training set S = (x1, y1), …,(xn, yn) of vector of features xi ∈ X together with their known classes yi ∈ {−1, +1}. The output of an SVM is a model f: X → {−1, +1} that predicts the class f(x) of any new object x ∈ X. The SVM implementation used in this study was the library for support vector machines (LIBSVM),23 which is an open-source software. A robust SVM model was built by filtering 22,011 genes for the 90 samples using mRMR. This approach is used to select seven gene sets, of the best 20, 30, 50, 100, 200, 300, and 500 genes. Each smaller gene set is a subset of the larger gene set, that is, the 20 gene list is a subset of the 30 gene list and so on.
In silico functional analysis
The 30 gene set was subjected to Ingenuity Pathway Analysis (IPA), which is available at www.ingenuity.com, a web-based functional analysis tool to find an association between the genes and CRC. Core analysis and biomarker analysis functions of IPA were carried out. The pathway designer tool within IPA was used to generate networks of genes related to CRC. IPA computes a score for each network according to the fit of that network to the user-defined set of focus genes. The score is derived from a P-value and indicates the likelihood of the focus genes in a network being found together due to random chance. A score of 2 indicates that there is a 1 in 100 chance that the focus genes are together in a network due to random chance. Therefore, scores of 2 or higher have at least 99% confidence of not being generated by random chance alone.
Classifier performance measures
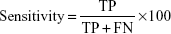
Four measures were used to judge the performance of the classification system. They are all based on true positives (TP, correctly predicted positive [cancer] samples); true negatives (TN, correctly predicted negative [normal] samples), false positives (FP, normal samples wrongly predicted as being cancer samples), and false negatives (FN, cancer samples wrongly predicted as normal). Sensitivity (the percentage of cancer samples correctly predicted as cancer) is defined as follows:
|
|
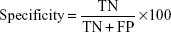
Specificity (the percentage of normal samples correctly predicted as normal) is defined as follows:
|
|
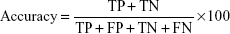
Accuracy (the percentage of correctly predicted samples) is defined as follows:
|
|
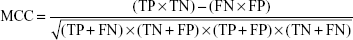
The Matthews correlation coefficient (MCC) is a measure of both sensitivity and specificity. MCC =0 indicates a completely random prediction and MCC =1 indicates perfect prediction. MCC is defined as:
|
|
Validation
The “tenfold” and “leave-one-out” (LOO) methods are used for cross validation. The tenfold cross-validation method splits the data randomly into ten equal (or almost equal) parts. The algorithm is then run ten times, using nine of the parts as a training set and the remaining part as a test set. Each time the algorithm is run, a different test set is used, so that over the ten runs of the algorithm, all the instances are used as a test set. The success of the algorithm is the sum of the correct classification over each of the runs. On the other hand, a leave-one-out cross validation (LOOCV) is when all except one of the samples are used to create a model and the algorithm is tested on the left-out sample. This is repeated, leaving out each of the samples in turn and the number of samples correctly classified is reported as the success rate of the algorithm.27
Results
Sigmoid and radial basis function are the best kernel
Before creating the SVM models, it is required to determine the best kernel type (linear, third-degree polynomial, sigmoid, and radial basis function [RBF]) to use. Kernel selection is an important task in creating SVM models to reduce the classification probability error. The kernel methods transform the data into higher dimensional spaces to make the data separable. We divided the data into a training set (35 normal samples and 35 cancer samples) and a testing set (nine normal samples and eleven cancer samples) to determine the best kernel type. We chose the kernel type based on the accuracy they provided using a LIBSVM.23 The four performance measures of the different kernel types are listed in Table 1. RBF and sigmoid were among the best kernel types for training the data. For subsequent analyses, RBF was chosen for training the SVM model.
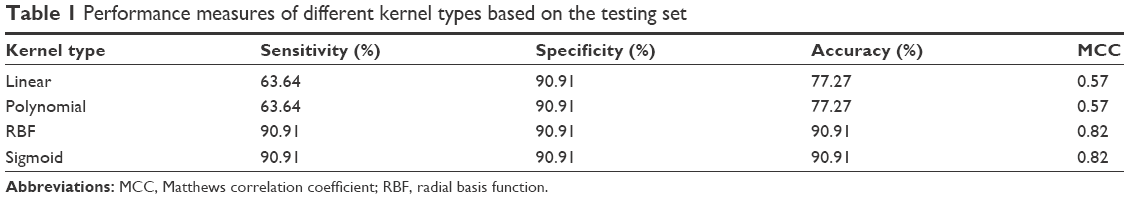 | Table 1 Performance measures of different kernel types based on the testing set |
A panel of 30 genes provided best model accuracy
We then built a robust SVM model by filtering 22,011 genes for the 90 samples using mRMR. We ran the mRMR software and obtained two tables, maxRel and mRMR features. mRMR features were chosen. This approach was used to select seven gene sets, of the best 20, 30, 50, 100, 200, 300, and 500 genes. For each gene set, we selected the SVM model parameters (C, γ) using the grid search method of the LIBSVM software. The values (C and γ) determine the optimal SVM model, and they range as follows: C =2−5, 2−3, …, 215 and γ =2−15, 2−14, …, 23. The discriminative qualities of an SVM model depend on these two parameters, namely, cost parameter (C) and the coefficient in the RBF kernel (γ).28 After determining the best kernel, we trained the SVM model and validated it using tenfold and LOOCV and compared the performance measures of each gene set. The performance measure of different features (genes) lists is given in Figure 2 as bar chart. The set of 30 genes outperformed the other gene sets (Figure 2), with 84% accuracy in both the tenfold and LOOCV methods. The optimal LIBSVM parameters of the 30 genes is (C*, γ*) = (0.5, 0.0078125). Therefore, we chose a panel of 30 genes to create the CRC model. The LOOCV and 10-fold cross-validation results for the remaining gene sets (20, 50, 100, 200, and 500) are given in Table S1. The genes in this 30 gene set are listed in Table 2 where they are ranked using mRMR. The remaining gene lists are given in Table S2.
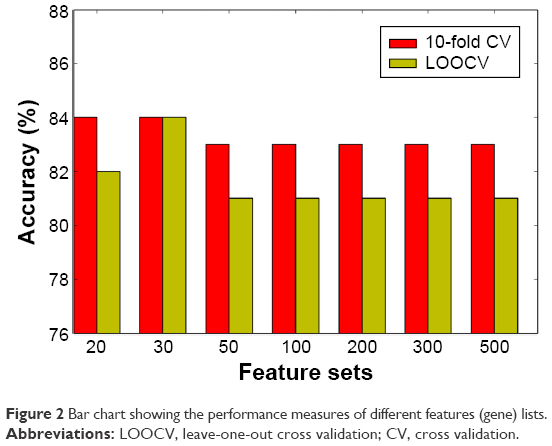 | Figure 2 Bar chart showing the performance measures of different features (gene) lists. |
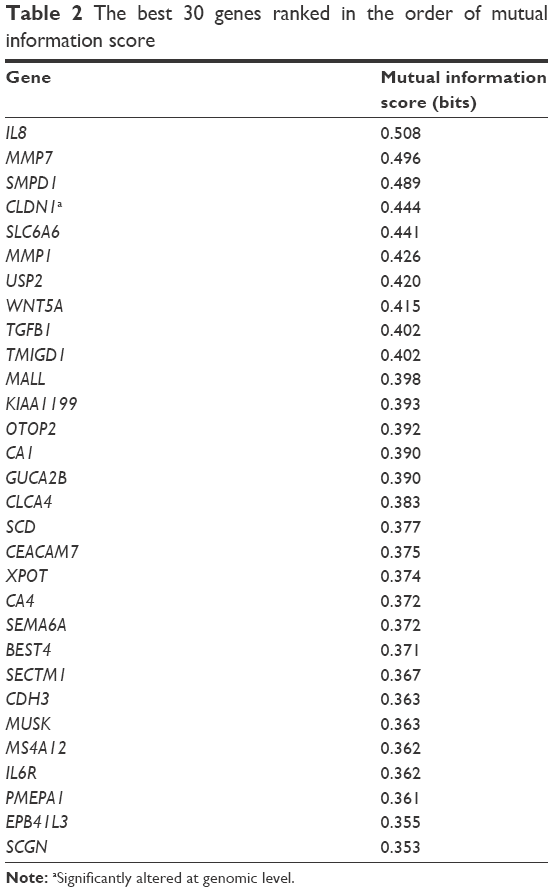 | Table 2 The best 30 genes ranked in the order of mutual information score |
Heatmap plot reveals genes with better potential to discriminate
We plotted a heatmap of the 30 best genes based on their expression levels of the 90 samples (Figure 3). In this figure, the expression profiles of the 30 selected genes in the CRC data are plotted, with the x-axis denoting the sample type (normal or cancer) and the y-axis denoting the gene symbol. The normalized level of the expression is indicated by colors as shown in the key. Some genes showed a better discriminating potential of the cancer samples from the normal samples, than other genes in the same feature set. This is reflected by higher difference in expression levels between normal and cancer samples. The genes CA4, PMEPA1, PA1, CDH3, MALL, IL8, MS4A12, MUSK, CLDN1, OTOP2, SCD, MMP7, EPB41L3, and SLC6A6 show significant upregulation in cancer samples, whereas MMP1, TGFB1, WNT5A, TMIGD1, GUCA2B, SECTM1, BEST4, USP2, CEACAM7, and XPOT showed significant downregulation.
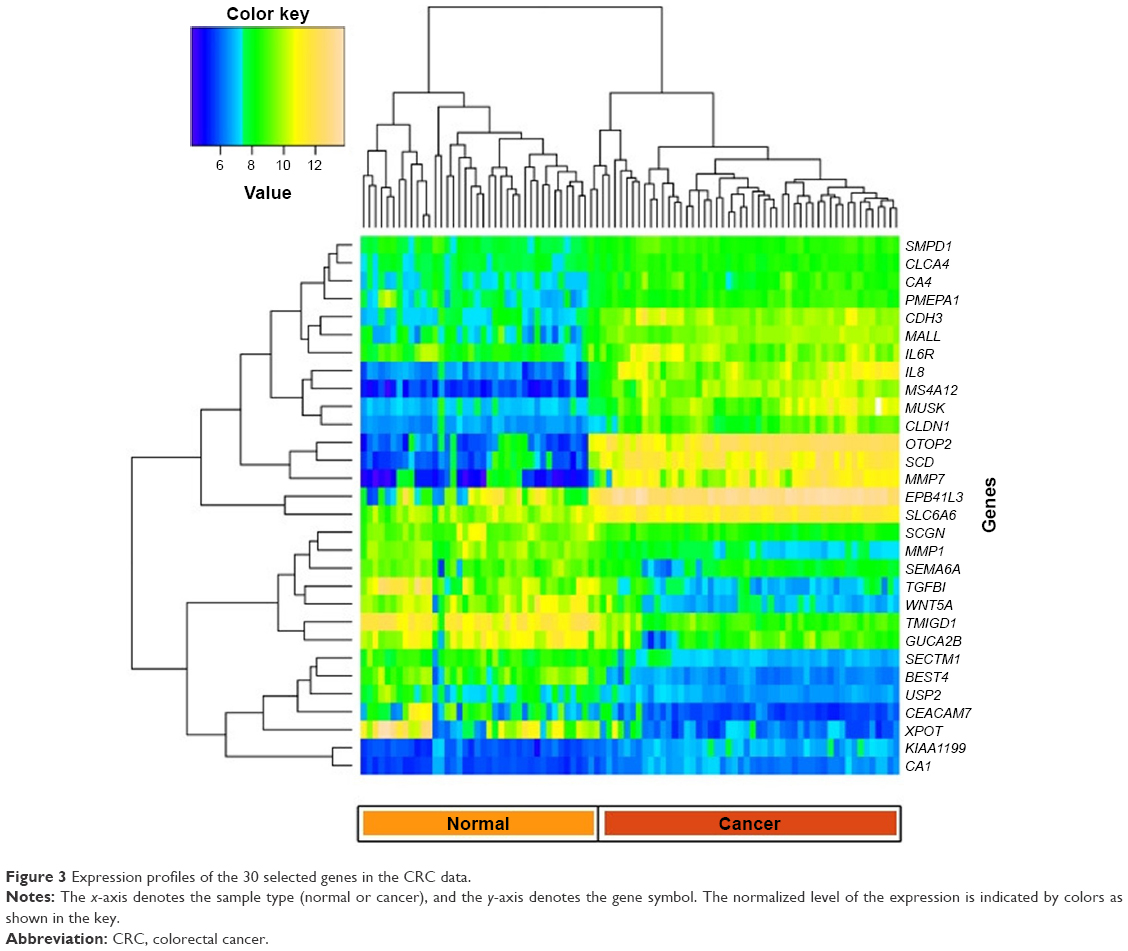 | Figure 3 Expression profiles of the 30 selected genes in the CRC data. |
Confusion matrix shows prediction accuracy of CRC samples using LOOCV
In addition, we plotted a confusion matrix to depict the prediction of each patient sample (cancer) using the LOOCV approach, as shown in Figure 4. This figure shows the confusion matrix for cancer samples where the rows represent the actual state of the sample, and T and WC denote cancer sample and wrong prediction of cancer sample, respectively. The column represents the corresponding prediction using the SVM model. This figure shows the prediction of 46 cancer samples using LOOCV. In the confusion matrix for cancer samples, the diagonal represents the prediction power. When the cell entries are colored continuously along the diagonal, prediction accuracy is 100%. However, in this case, the diagonal entries are not continuously colored, as we had a prediction accuracy of approximately 84%. The confusion matrix for normal samples is given in Figure S1. The actual status of the samples and the corresponding prediction using the CRC model are given in Table S3.
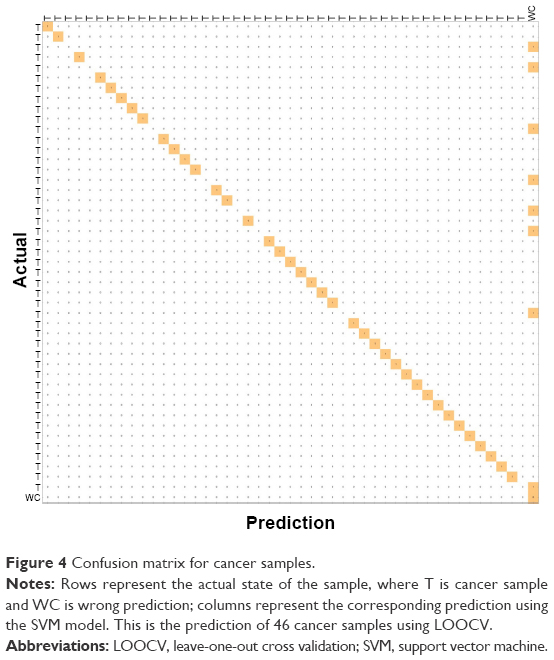 | Figure 4 Confusion matrix for cancer samples. |
Comparison of mRMR + SVM with other models shows that mRMR + REPT and mRMR + BN were the best model
To test the robustness of mRMR + SVM, we compared it with BN, RF, NB, REPT, and MLP. We used the open-source data mining software known as WEKA29 in training models for BN, RF, NB, REPT, and MLP. In particular, the 30 best genes from mRMR were used as features for these models. We denote these hybrids as mRMR + BN, mRMR + RF, mRMR + NB, mRMR + REPT, and mRMR + MLP. These results are given in Table 3. A tenfold cross-validation was implemented. On the basis of accuracy, mRMR + REPT and mRMR + BN were the best classifiers, followed by mRMR + RF, mRMR + SVM, mRMR + NB, and mRMR + MLP in that order.
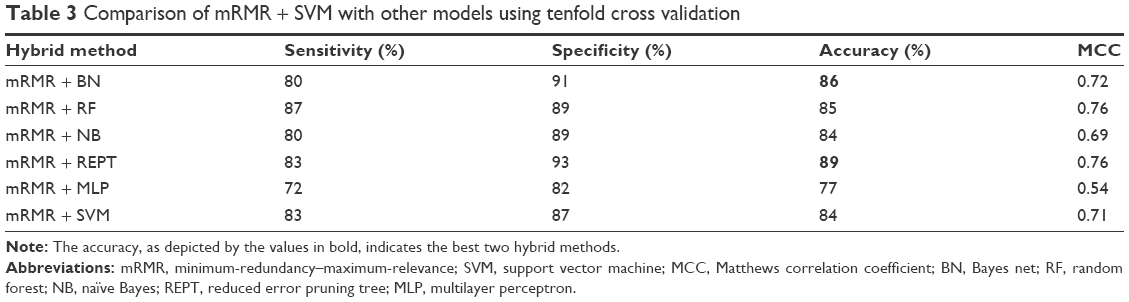 | Table 3 Comparison of mRMR + SVM with other models using tenfold cross validation |
SVM model provides high accuracy on being tested on similar datasets available in public database
After creating the CRC model using different machine learning hybrids, we validated the performance of mRMR + REPT and mRMR + BN, mRMR + RF, mRMR + NB, mRMR + MLP, and mRMR + SVM on an independent datasets from GEO database.30 The datasets have accession numbers GSE36400 (five normal and nine cancer), GSE42690 (19 normal), and GSE24550 (142 cancer). We selected these datasets because they were generated using Exon 1.0 ST arrays similar to the one used in this study. The independent set consisted of 24 normal samples and 151 cancer samples. On average, mRMR+SVM and mRMR+BN were the best models based on prediction accuracy of these independent dataset, that is 95.27% and 91.99%, respectively (Table 4).
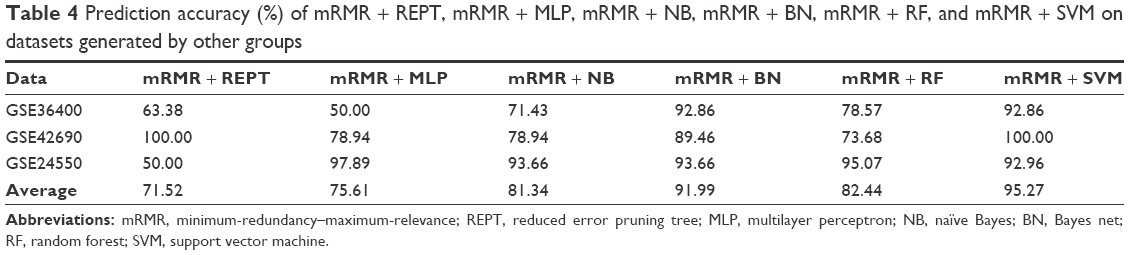 | Table 4 Prediction accuracy (%) of mRMR + REPT, mRMR + MLP, mRMR + NB, mRMR + BN, mRMR + RF, and mRMR + SVM on datasets generated by other groups |
The 30 gene list is functionally relevant in association with CRC
To determine the importance and relevance of 30 best genes used in the model, we performed pathway, function, and biomarker studies using IPA. Of the 30 genes, 28 were known to be associated with a network involved in the development of colorectal adenocarcinoma, colon cancer, colon tumor, and adenocarcinoma (Figure 5A). Core function analysis suggested the possible involvement of these genes in the CRC metastasis signaling and Wnt/β-catenin signaling pathways (Figure 5B). Left-hand y-axis indicates probable involvement of specific pathways. Right-hand y-axis denotes ratio, which indicates percentage of genes in a pathway that are found in the gene list. In addition, the function of the 30 genes indicated that they were significantly associated with cancer (Figure 5C). Biomarker analysis further confirmed the usefulness of employing these 30 genes for discriminating between cancer and normal samples. CDH3, CEACAM7, CLDN1, CXCL8 (IL8), and IL6R are known biomarkers. There are drugs available to target IL6R, MMP1, and MMP7, which could be helpful for further understanding the critical involvement of these genes in CRC (Table 5). Four molecules are detectable in the blood, namely, CDH3, MMP1, MMP7, and TGFBI, which makes them good candidates for developing diagnostic assays. IL6R has been targeted using tocilizumab, while MMP1 and MMP7 can be targeted using Marimastat (British Biotech, Oxford, UK).
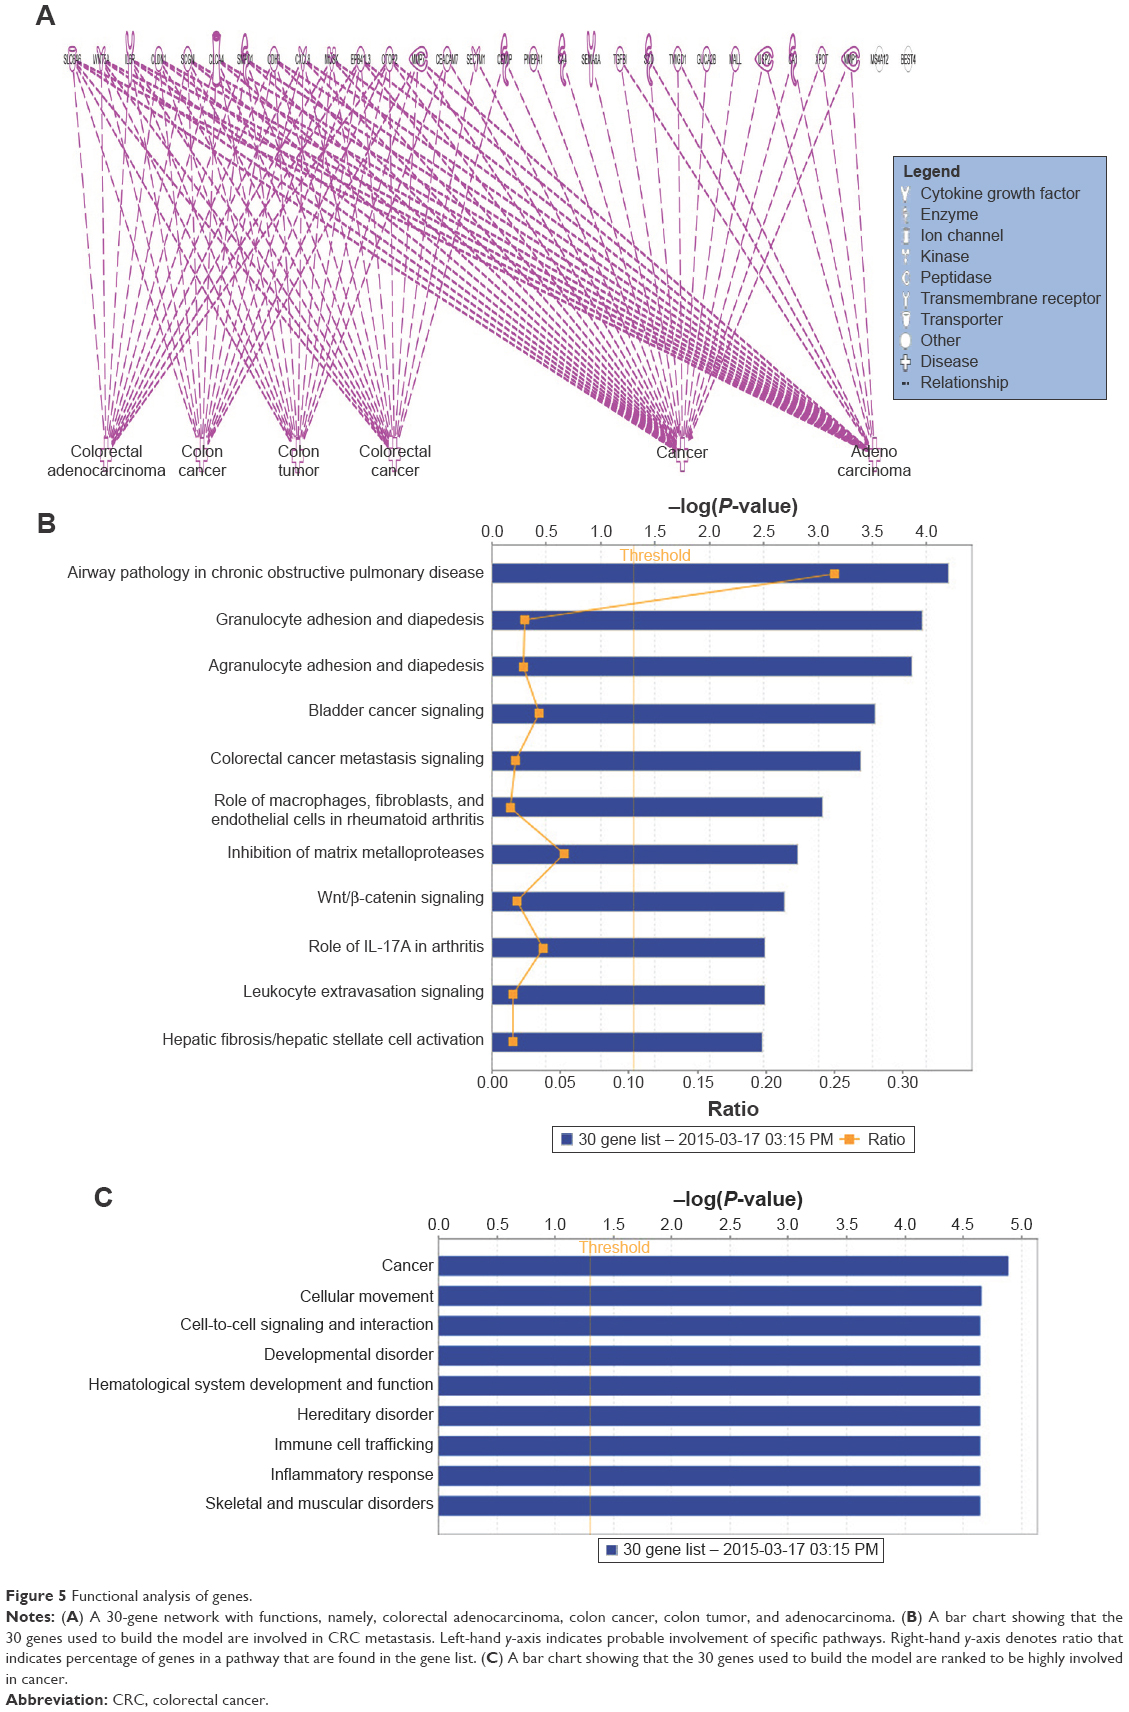 | Figure 5 Functional analysis of genes. |
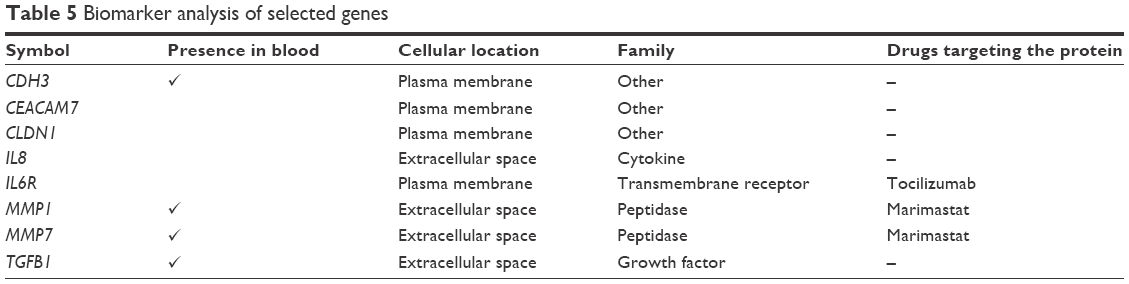 | Table 5 Biomarker analysis of selected genes |
Finally, a network with a score of 20 (definition of score described in “Materials and methods” section) was constructed with these 30 genes and showed their probable involvement in cellular movement (Figure 6). In Figure 6, the top scoring network generated by the genes used in model building is illustrated. This network had a score of 25 and included ten out of 30 genes as focus molecules.
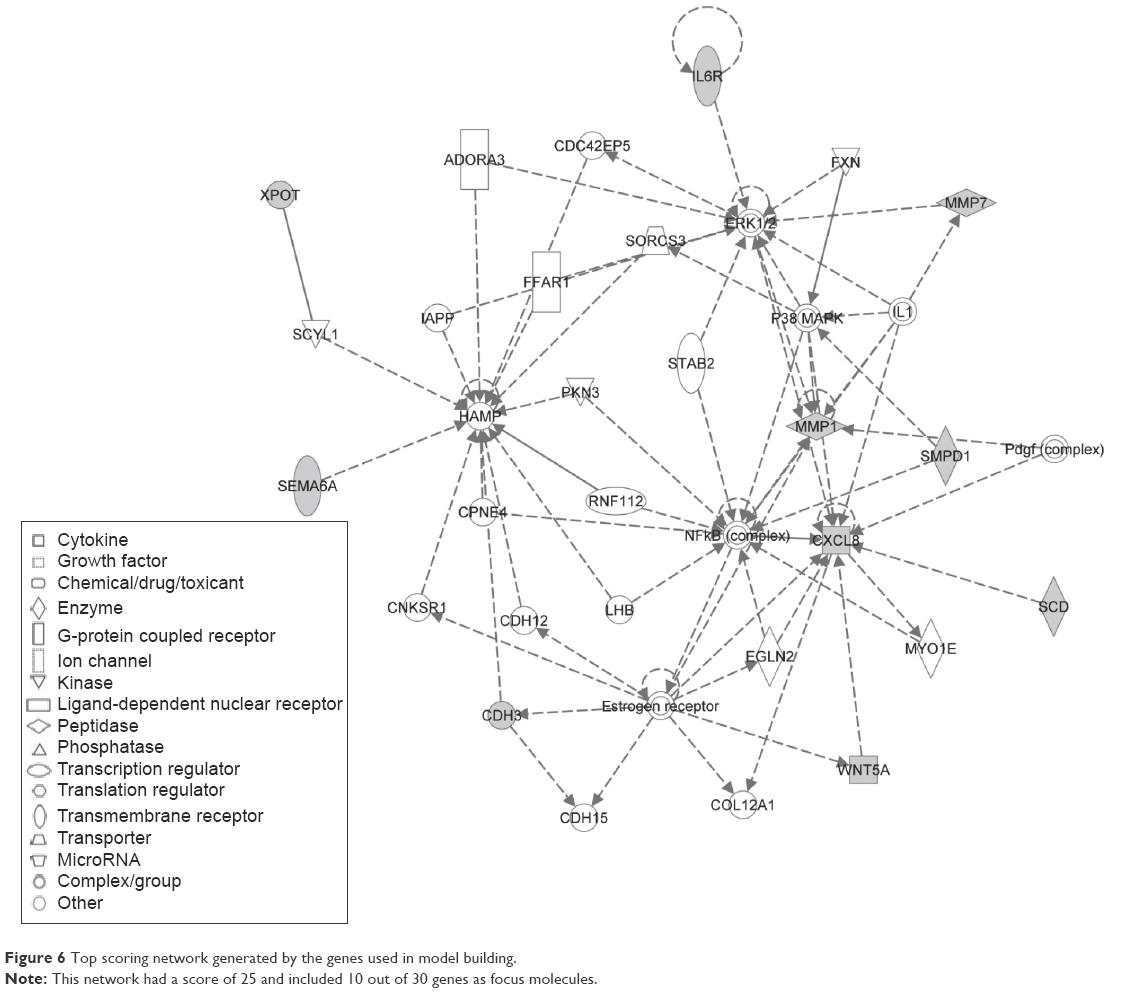 | Figure 6 Top scoring network generated by the genes used in model building. |
Discussion
In this study, we created an SVM model based on optimal parameters (kernel and SVM parameters) and feature selection. We further conducted both functional and biomarker analyses of the selected 30 genes.
Comparison of mRMR + SVM hybrid with other models
The mRMR method16 minimizes redundancy and is based on mutual information that considers the distribution function of the variables. The hybrid of mRMR coupled with different models has resulted in a better classification algorithm. Some of the models performed well during cross-validation process, while others performed well during the independent testing.
The hybrids mRMR + REPT and mRMR + BN were the best models based on the tenfold cross validation as compared to mRMR + SVM hybrid. However, mRMR + REPT did not perform well in the classification of GEO independent dataset. This may be a result of overfitting of these models. The performance of mRMR + MLP was the worst in tenfold cross validation. This is because MLP usually gets entrapped in a local minimum of the objective function and it misses converging to the global minimum.
This is a result of the gradient descent optimization method applied. One can ameliorate this problem by using derivative-free optimization methods such as pattern search. On the other hand, the hybrid mRMR + REPT was the best performing model using the tenfold cross validation. This is because REPT is a fast decision tree learning by downsizing of decision trees. It removes sections of the tree that provide little power to classify examples, and this ultimately improves the accuracy of the cross-validation testing. However, this method does not generalize well on the independent dataset, since it had an accuracy of 71.52%. This may be as a result of pruning important trees, which may lead to overfitting. In the same way, RF selects a small number of genes while maintaining predictive accuracy by discarding genes with the smallest importance values.
While NB has an advantage of training rapidly, it suffers from assuming independence of features. This assumption means that relation among the genes may not be generalized.31
It has been shown that mathematical theory of SVM is based on its success on empirical performance in gene expression data. That is, SVM have robust to high variable-to-sample ratio and they use robust regularized technique to avoid overfitting.32 This explains why mRMR + SVM generalize well (with an accuracy of 95.27%). This is in accordance with the work of Statnikov et al33 who proved that SVM outperformed RF by using 22 diagnostic and prognostic datasets. A comprehensive comparison of RF and SVM in microarray cancer-based classification showed that SVM outperformed RF in two scenarios, namely, with genes or no genes selected. They elucidated the superiority of SVM over RF because SVM may be less sensitive to the choice of input parameters than RF.
In another study, it was shown that Bayesian nets and SVM model were both competitive when applied to complete patients’ dataset.34 In this study, both mRMR + BN and mRMR + SVM were the best performers, with an accuracy of above 90% in the independent testing.
The model is used specifically for classifying only CRC and can be used to classify other types of cancer if they share the same set of genes. We have not tested the same model on other types of cancer; however, four of the genes from our list of 30 best genes, IL8, TGFB1, MMP1, and WNT5A overlap with the breast cancer biomarkers,35–38 whereas CLDN1 and TGFB1 overlap with gastric cancer.39,40
Earlier, efforts were made to predict colon cancer based on gene expression microarrays. These methods suffered from lower accuracy rate. DL19 and signal-to-noise ratio18 had a low prediction accuracy of 83.33% and 90.2%, respectively, on the colon data. Genetic algorithms17 had a prediction accuracy of 93.55%. However, being a wrapper method, it suffers from overfitting and is computationally expensive. As for RFE method coupled with SVM,15 it had an overall accuracy of 98%. Despite having higher accuracy, it has some limitations. First, RFE finds only the k dimension in the final subset by trying to append to the set k features (this is why it is most accurate in class separation using an SVM classifier).15 However, appending one gene to another does not form an optimal feature set, as the two genes might be highly correlated, which leads to redundancy in the feature set. Biologically, the expression of one gene can trigger another gene to be expressed in the same direction, but this does not necessarily mean that the first gene is important as a feature. Second, a review on microarray feature selection methods by Bolón-Canedo et al20 showed that SVM-RFE, in spite of the fact that it is in theory better than filter methods, achieved comparable or even worse results than filter methods in terms of classification accuracy. Partial least squares14 coupled with SVM had a prediction accuracy of 90.3% for the colon data. This method select genes based on the mean and standard deviation and this leads to variability problems.
Genes selected
From our selected list of 30 genes, nine overlapped with the genes selected by Chu et al:41 MMP7, KIAA1199, CA1, GUCA2B, CLCA4, CA4, CDH3, MS4A12, and IL6R; GUCA2B and CDH3 overlapped with the top six genes found by Li et al.42
IPA analysis suggested that genes in this network might be associated with the development of colorectal adenocarcinoma, CRC, and colon cancer and in the CRC metastasis signaling and Wnt/β-catenin signaling pathways. In a previous study, the abnormal regulation of the Wnt/β-catenin signaling pathways was found to be one of the major causes of CRC,43 and hence it plays a potential role in CRC therapy.44 At the cytogenetic level, the IL6R gene from this list was found to be a significant target as analyzed by the Genomic Identification of Significant Targets in Cancer tool,36,45 further underscoring the functional relevance of the feature selection. This finding also suggests that altered copy number changes at these loci might be involved with CRC. At the transcriptional level, IL6R, CA4, PMEPA1, CDH3, MALL, IL8, MS4A12, MUSK, CLDN1, OTOP2, SCD, MMP7, EPB41L3, and SLC6A6 were found to be differentially regulated in cancer samples when compared with normal matched tissues from the same group of patients. At the molecular level, CDH3 gene played a role in carcinogenic pathway in some patients with CRC, and methylating agents can be used to reduce CDH3 expression to prevent tumor formation.46 In addition, MS4A12 gene has been implicated in colon cancer, and it is a colon-specific components of store operated Ca2+, which promotes tumor growth. On the other hand, SLC6A6 gene has been suggested to play a major role in promoting the survival and multidrug resistance of CRC. Mal, T-cell differentiation proteinlike (MALL), gene has been shown to be downregulated in CRC, and its expression at the protein level has not been measured, and diagnostic and prognostic utilities have not been researched. The mechanistic aspects of these genes need to be further examined to reveal their crucial roles in causing CRC. Our functional analyses open up avenues for studying other genes and their possible roles as biomarkers of predictive value.
Conclusion
This study provides a prediction model to differentiate between normal and CRC samples using exon array-based data. Our method, which combines mRMR feature selection of 30 genes with SVM using an RBF kernel, yielded an accuracy of 95.27% on an independent dataset. Some of the 30 genes selected by our method have already been confirmed as being implicated in the CRC pathway. The feature selection method used in this study depends on the use of labeled data, and this can be ameliorated by the use of DL methods. This work would pave the way for building classification models for cancer based on gene expression data.
Acknowledgments
We thank Dr Mohammed Afzal, Dr Mishal Johani, Dr Zeyad Yousef, and all the clinicians of National Guard Health Affairs who were involved in the collection of samples. This work is supported by King Abdullah International Medical Research Center grant #RC10/083 awarded to Mohammad Azhar Aziz.
Disclosure
The authors report no conflicts of interests in this work.
References
Siegel R, Ma J, Zou Z, Jemal A. Cancer statistics, 2014. CA Cancer J Clin. 2014;64(1):9–29. | ||
Doubeni CA. The impact of colorectal cancer screening on the US population: is it time to celebrate? Cancer. 2014;120(18):2810–2813. | ||
Kekelidze M, D’Errico L, Pansini M, Tyndall A, Hohmann J. Colorectal cancer: current imaging methods and future perspectives for the diagnosis, staging and therapeutic response evaluation. World J Gastroenterol. 2013;19(46):8502–8514. | ||
Jemal A, Bray F, Center MM, Ferlay J, Ward E, Forman D. Global cancer statistics. CA Cancer J Clin. 2011;61(2):69–90. | ||
Philip AK, Lubner MG, Harms B. Computed tomographic colonography. Surg Clin North Am. 2011;91(1):127–139. | ||
Zhang H, Qi J, Wu YQ, et al. Accuracy of early detection of colorectal tumours by stool methylation markers: a meta-analysis. World J Gastroenterol. 2014;20(38):14040–14050. | ||
Ip S, Sokoro AA, Kaita L, Ruiz C, McIntyre E, Singh H. Use of fecal occult blood testing in hospitalized patients: results of an audit. Can J Gastroenterol Hepatol. 2014;28(9):489–494. | ||
Orang AV, Barzegari A. MicroRNAs in colorectal cancer: from diagnosis to targeted therapy. Asian Pac J Cancer Prev. 2014;15(17):6989–6999. | ||
Benard A, van de Velde CJ, Lessard L, et al. Epigenetic status of LINE-1 predicts clinical outcome in early-stage rectal cancer. Br J Cancer. 2013;109(12):3073–3083. | ||
Deb S, Xu H, Tuynman J, et al. RAD21 cohesin overexpression is a prognostic and predictive marker exacerbating poor prognosis in KRAS mutant colorectal carcinomas. Br J Cancer. 2014;110(6):1606–1613. | ||
Van Schaeybroeck S, Allen WL, Turkington RC, Johnston PG. Implementing prognostic and predictive biomarkers in CRC clinical trials. Nat Rev Clin Oncol. 2011;8(4):222–232. | ||
Kim SJ, Ha JW, Zhang BT. Bayesian evolutionary hypergraph learning for predicting cancer clinical outcomes. J Biomed Inform. 2014;49:101–111. | ||
Ay A, Gong D, Kahveci T. Network-based prediction of cancer under genetic storm. Cancer Inform. 2014;13(Suppl 3):15–31. | ||
Nguyen DV, Rocke DM. Tumor classification by partial least squares using microarray gene expression data. Bioinformatics. 2002;18(1):39–50. | ||
Guyon I, Weston J, Barnhill S, Vapnik V. Gene selection for cancer classification using support vector machines. Mach Learn. 2002;46(1–3):389–422. | ||
Peng H, Long F, Ding C. Feature selection based on mutual information: criteria of max-dependency, max-relevance, and min-redundancy. IEEE Trans Pattern Anal Mach Intell. 2005;27(8):1226–1238. | ||
Peng S, Xu Q, Ling XB, Peng X, Du W, Chen L. Molecular classification of cancer types from microarray data using the combination of genetic algorithms and support vector machines. FEBS Lett. 2003;555(2):358–362. | ||
Furey TS, Cristianini N, Duffy N, Bednarski DW, Schummer M, Haussler D. Support vector machine classification and validation of cancer tissue samples using microarray expression data. Bioinformatics. 2000;16(10):906–914. | ||
Fakoor R, Ladhak F, Nazi A, Huber M. Using deep learning to enhance cancer diagnosis and classification. Paper presented at: The 30th International Conference on Machine Learning (ICML 2013), WHEALTH workshop, 16–21 June, 2013, Atlanta, USA. | ||
Bolón-Canedo V, Sánchez-Maroño N, Alonso-Betanzos A, Benítez J, Herrera F. A review of microarray datasets and applied feature selection methods. Inf Sci. 2014;282:111–135. | ||
Guo P, Luo Y, Mai G, et al. Gene expression profile based classification models of psoriasis. Genomics. 2014;103(1):48–55. | ||
Li T, Zhang C, Ogihara M. A comparative study of feature selection and multiclass classification methods for tissue classification based on gene expression. Bioinformatics. 2004;20(15):2429–2437. | ||
Chang C-C, Lin C-J. LIBSVM: a library for support vector machines. ACM Trans Intell Syst Technol. 2011;2(3):1–27. | ||
Aziz MA, Periyasamy S, Al Yousef Z, et al. Integrated exon level expression analysis of driver genes explain their role in colorectal cancer. PLoS One. 2014;9(10):e110134. | ||
Cristianini N, Shawe-Taylor J. An Introduction to Support Vector Machines: and Other Kernel-based Learning Methods. New York, NY: Cambridge University Press; 2000. | ||
Vapnik VN. The Nature of Statistical Learning Theory. New York, NY: Springer-Verlag Inc.; 1995. | ||
Stekel D. Microarray Bioinformatics. New York, NY: Cambridge University Press; 2003. | ||
Duan K, Keerthi, Poo A. Evaluation of simple performance measures for tuning SVM hyperparameters. Neurocomputing. 2003;51:41–59. | ||
Hall M, Frank E, Holmes G, Pfahringer B, Reutemann P, Witten IH. The WEKA data mining software: an update. SIGKDD Explor Newsl. 2009;11(1):10–18. | ||
Edgar R, Domrachev M, Lash AE. Gene expression omnibus: NCBI gene expression and hybridization array data repository. Nucleic Acids Res. 2002;30(1):207–210. | ||
Lu Y, Han J. Cancer classification using gene expression data. Inf Syst. 2003;28:243–268. | ||
Statnikov A, Aliferis CF. Are random forests better than support vector machines for microarray-based cancer classification? AMIA Annual Symp Proc. 2007;2007:686–690. | ||
Statnikov A, Wang L, Aliferis C. A comprehensive comparison of random forests and support vector machines for microarray-based cancer classification. BMC Bioinf. 2008;9(1):319. | ||
Jayasurya K, Fung G, Yu S, et al. Comparison of Bayesian network and support vector machine models for two-year survival prediction in lung cancer patients treated with radiotherapy. Med Phys. 2010;37(4):1401–1407. | ||
Li Y, Cai G, Yuan S, et al. The overexpression membrane type 1 matrix metalloproteinase is associated with the progression and prognosis in breast cancer. Am J Transl Res. 2015;7(1):120–127. | ||
Eldai H, Periyasamy S, Al Qarni S, et al. Novel genes associated with colorectal cancer are revealed by high resolution cytogenetic analysis in a patient specific manner. PLoS One. 2013;8(10):e76251. | ||
Benhaj K, Akcali KC, Ozturk M. Redundant expression of canonical Wnt ligands in human breast cancer cell lines. Oncol Rep. 2006;15(3):701–707. | ||
Liu T, Sun B, Zhao X, et al. USP44+ cancer stem cells subclones contributed to breast cancer aggressiveness by promoting vasculogenic mimicry. Mol Cancer Ther. 2015;14(9):2121–2131. | ||
Sathiya Pandi N, Manimuthu M, Asha GV, Gobic M, Rajendran S. In silico analysis and validation of the proliferative potential of CLDN1 expression in gastric cancer. J Environ Pathol Toxicol Oncol. 2013;32(4):343–360. | ||
Zhou H, Wang K, Hu Z, Wen J. TGF-β1 alters microRNA profile in human gastric cancer cells. Chin J Cancer Res. 2013;25(1):102–111. | ||
Chu C-M, Yao C-T, Chang Y-T, et al. Gene expression profiling of colorectal tumors and normal mucosa by microarrays meta-analysis using prediction analysis of microarray, artificial neural network, classification, and regression trees. Dis Markers. 2014;2014:11. | ||
Li BQ, Huang T, Liu L, Cai YD, Chou KC. Identification of colorectal cancer related genes with mRMR and shortest path in protein-protein interaction network. PLoS One. 2012;7(4):e33393. | ||
Lemieux E, Cagnol S, Beaudry K, Carrier J, Rivard N. Oncogenic KRAS signalling promotes the Wnt/beta-catenin pathway through LRP6 in colorectal cancer. Oncogene. 2015;34(38):4914–4927. | ||
Amado NG, Predes D, Moreno MM, Carvalho IO, Mendes FA, Abreu JG. Flavonoids and Wnt/beta-catenin signaling: potential role in colorectal cancer therapies. Int J Mol Sci. 2014;15(7):12094–12106. | ||
Aziz MA, Periyasamy S, Yousef Z, Deeb A, AlOtaibi M. Colorectal cancer driver genes identified by patient specific comparison of cytogenetic microarray. Genom Data. 2014;2(0):29–31. | ||
Hibi K, Goto T, Mizukami H, et al. Demethylation of the CDH3 gene is frequently detected in advanced colorectal cancer. Anticancer Res. 2009;29(6):2215–2217. |
 © 2016 The Author(s). This work is published and licensed by Dove Medical Press Limited. The full terms of this license are available at https://www.dovepress.com/terms.php and incorporate the Creative Commons Attribution - Non Commercial (unported, v3.0) License.
By accessing the work you hereby accept the Terms. Non-commercial uses of the work are permitted without any further permission from Dove Medical Press Limited, provided the work is properly attributed. For permission for commercial use of this work, please see paragraphs 4.2 and 5 of our Terms.
© 2016 The Author(s). This work is published and licensed by Dove Medical Press Limited. The full terms of this license are available at https://www.dovepress.com/terms.php and incorporate the Creative Commons Attribution - Non Commercial (unported, v3.0) License.
By accessing the work you hereby accept the Terms. Non-commercial uses of the work are permitted without any further permission from Dove Medical Press Limited, provided the work is properly attributed. For permission for commercial use of this work, please see paragraphs 4.2 and 5 of our Terms.