Back to Journals » Nature and Science of Sleep » Volume 13
Fidelity of Information Processing on a Psychomotor Vigilance Task Predicts Changes in Self-Reported Sleepiness Ratings
Authors Nielson SA, Buysse DJ, Kay DB
Received 13 January 2021
Accepted for publication 16 April 2021
Published 25 May 2021 Volume 2021:13 Pages 659—671
DOI https://doi.org/10.2147/NSS.S301832
Checked for plagiarism Yes
Review by Single anonymous peer review
Peer reviewer comments 4
Editor who approved publication: Prof. Dr. Ahmed BaHammam
Spencer A Nielson,1 Daniel J Buysse,2 Daniel B Kay1
1Department of Psychology, Brigham Young University, Provo, UT, 84602, USA; 2Department of Psychiatry and Sleep Medicine Institute, University of Pittsburgh School of Medicine, Pittsburgh, PA, 15213, USA
Correspondence: Daniel B Kay
Department of Psychology, Brigham Young University, 1090 KMBL, Provo, UT, 84602, USA
Tel +1 801-422-7949
Email [email protected]
Introduction: Daytime sleepiness is a common problem. Although sleepiness is primarily assessed at the self-report unit of analysis, factors that contribute to an individual’s experience and report of sleepiness remain poorly understood. While sleepiness is known to impact vigilance performance, the impact of vigilance performance on sleepiness reports is less well understood. We aimed to explore how performance on a psychomotor vigilance task (PVT) relates to changes in self-reported sleepiness in a rested condition.
Methods: Participants were 66 adults (Mdn=23, range 18– 49 years old), 47% female, 88% white, with a wide range of insomnia symptoms. Participants rated their sleepiness on a scale from 1 (not sleepy) to 10 (extremely sleepy) at the start (pre) and the end (post) of a 10-minute computerized PVT. Ordinal regression determined whether mean reciprocal reaction time, a measure of overall performance, or the log-transformed signal-to-noise ratio (LSNR), a measure of fidelity of information processing, predicted post-sleepiness, adjusting for pre-sleepiness, insomnia, and potential confounds.
Results: Lower LSNR predicted greater change in sleepiness (pre-to-post PVT) and higher post-sleepiness even after adjusting for pre-sleepiness, mean reciprocal reaction time, insomnia, and other potential confounds (p< 0.05).
Discussion: When adjusting for insomnia symptoms and potential confounds, participants with lower fidelity of information processing reported higher sleepiness than they had reported at the start of the PVT. Possible mechanisms and explanations are discussed in relation to a 3-factor model of sleep-wake states. This line of research may contribute to innovative approaches to assessing and treating sleepiness.
Keywords: psychomotor vigilance, sleepiness, insomnia, fidelity of information processing, self-report, context
Introduction
Daytime sleepiness has been deemed “one of the greatest challenges faced by modern society.”1 Excessive daytime sleepiness affects as many as 27.8% of individuals in the general public.1 Prevalence rates are particularly high among individuals with insomnia, in which 45.6% report experiencing daytime sleepiness.2 The social and individual costs of daytime sleepiness are great, contributing to a heightened risk of accidents on the road, impaired work performance, poorer mental and physical health, and higher mortality rates.3–6 Despite its debilitating impact, daytime sleepiness remains a poorly understood problem, particularly in patients with insomnia, a patient population who struggle to sleep despite feeling sleepy. The extent to which sleepiness contributes to the higher rates of daytime impairments in patients with insomnia remains unclear.7–9 Regardless, many individuals with and without insomnia are unaware of the extent of their daytime sleepiness and its associated consequences.10,11 A greater understanding of the factors that contribute to an individual’s awareness and reporting of daytime sleepiness may lead to improved assessment and innovative techniques capable of helping individuals recognize when they are sleepy and require rest or clinical intervention.
The most widely used method for assessing daytime sleepiness is a single self-report item answered by either a nominal “yes or no” response, a frequency scale, or a severity scale.12 Self-reported sleepiness ratings are meant to reflect individuals’ interpretations of feelings and sensations associated with sleep drive.13 Sleep drive includes time- and use-dependent processes that actively promote sleep.14 Although there is a general correspondence between increased sleep drive and self-reported sleepiness, this association is not linear. Indeed, self-reported daytime sleepiness fluctuates across the 24-hour day and across contexts, despite an increase in sleep drive associated with time- and use- dependent sleep processes.15–17 This suggests that self-reported sleepiness reflects more than sleep drive. In general, self-report of many psychological constructs, such as wellbeing, are influenced by cognitive and contextual factors.18 Factors that specifically influence conscious awareness of sleepiness may have the most direct impact on self-reported sleepiness ratings.
Arousal is one such factor known to influence self-reported sleepiness. Circadian rhythms, motivation, environmental stimulation, and body position, are known to influence self-reported sleepiness.19,20 These studies suggest that heightened arousal associated with these variables likely mask the influence of sleep drive rather than reducing the actual level of sleep drive.22 One study, for example, showed that self-reported alertness decreased following a 22-minute neurobehavioral test battery compared to pre-testing ratings when sleep pressure was heightened with sleep deprivation, but only during certain circadian phases.11 Another study found that sleepiness increased during partial sleep deprivation but was highest following a 6-minute reaction time task as compared to following relaxation or a free activity condition.21 22 Collectively, these studies suggest that changes in arousal may provide a context that contributes to variation in conscious awareness of sleep drive and self-reported sleepiness levels.
Cognitive factors may also influence self-reported sleepiness reports. Attention to sleepiness related cues and feedback from the environment are associated with self-reported sleepiness.23 Intrinsic and environmental feedback obtained during a vigilance task could be used as a gauge to help assess sleepiness levels, resulting in predictable changes. The Psychomotor Vigilance Task (PVT) is widely used to demonstrate deficiencies in attention due to sleep deprivation and heightened sleep drive.24–26 Various metrics of the PVT have been associated with deficiencies due to sleep deprivation such as: mean reciprocal reaction time,27 standard deviation of reaction time, number of lapses and false starts,26 and log-transformed signal-to-noise ratio (LSNR).28 Although the PVT is widely used to assess the impact of increased sleep drive on PVT performance, few studies have used the PVT to explore whether vigilance performance predicts changes in self-reported sleepiness.25 One study found that changes in mean reaction time across a 10-min PVT were strongly correlated with changes in self-reported sleepiness taken concurrently every two minutes.29 Importantly, Horne and colleagues found no correlation between self-reported sleepiness at the start of the task and PVT performance during the task, suggesting that the association between PVT performance and self-reported sleepiness is directional. Van Dongen and colleagues26 demonstrated that PVT performance progressively degraded in a condition of chronic sleep restriction while self-reported sleepiness plateaued, suggesting that PVT performance may be a more sensitive marker of sleepiness than self-reported sleepiness. However, the disassociation between PVT performance and self-reported sleepiness was not observed in a total sleep deprivation condition. Thus, further research into the factors underlying self-reported sleepiness may elucidate why this dissociation between behavioral performance and self-reported sleepiness occurred. In general, further research into the associations between individual differences in PVT performance, across different PVT metrics, and changes in self-reported sleepiness is needed.25
Many studies have failed to detect higher sleepiness in patients with insomnia at behavioral and self-report units of measurement.30,31 For example, multiple studies have failed to find increased sleepiness on the multiple sleep latency test, a behavioral measure of sleepiness, in patients with insomnia.32–34 Nevertheless, insomnia inherently involves a sense of unmet sleep need and there is mounting evidence that time- and use-dependent sleep mechanisms are intact in individuals with insomnia symptoms.35,36 Some have proposed that heightened sleepiness in individuals with insomnia does not always manifest in laboratory measurement due to masking or compensatory mechanisms.37 Supporting a masking hypothesis, patients with insomnia reported greater levels of sleepiness than healthy controls during a constant routine that attempted to mitigate the occurrence of arousal-related masking effects of circadian rhythms, posture, and meals.38 Daytime performance may influence self-reported sleepiness differently in individuals with insomnia than good sleepers. During performance testing individuals with insomnia report greater sleepiness than good sleepers throughout the day.39 One study, found that while both individuals with and without insomnia experienced a decrease in self-reported alertness following a 50-minute simulated monotonous driving task, there was a trend for individuals with insomnia to report a greater decrease in alertness.11 No prior study has investigated whether insomnia influences how performance on vigilance tasks relates to changes in self-reported sleepiness pre- to post-task. Such an investigation may help elucidate how individuals with insomnia determine their sleepiness.
This study aimed to explore whether individual differences in performance on a Psychomotor Vigilance Task (PVT) are associated with the direction and magnitude of changes in self-reported sleepiness ratings. In 66 individuals stratified across the insomnia severity symptoms spectrum, we assessed self-reported sleepiness at the start of a standard computerized PVT and at the end while participants were in a rested condition. We explored the associations of pre-PVT sleepiness, post-PVT sleepiness, and changes in self-reported sleepiness pre- to post-PVT performance with several participant-level factors (ie, age, sex, depression, anxiety, sleep history, and insomnia symptom severity), and several PVT metrics. Establishing how vigilance performance relates to self-reported sleepiness builds on prior research and can expand understanding on the factors that influence the experience and reporting of daytime sleepiness.
Methods
Overview of Protocols
This study was a secondary analysis of data collected through two protocols conducted at Brigham Young University (BYU). The primary aim of these protocols was to investigate how insomnia symptoms relate to transdiagnostic features of psychiatric disorders. Procedures relevant to the present investigation were identical in both protocols, except for the target sample. Both included a telephone or online survey to screen individuals for exclusionary criteria (listed below). Participants attended an intake assessment to determine inclusion/exclusion criteria. The intake assessment involved a structured clinical interview for the Diagnostic and Statistical Manual of Mental Disorders, 5th edition,40 neurocognitive screening, and several questionnaires of sleep, mood, and health history. The Montreal Cognitive Assessment (MoCA)41 was administered to assess for cognitive impairment, and the Edinburgh Handedness Inventory (EHI)42 was administered to assess handedness. The Structured Clinical Interview for DSM-5 Sleep Disorders was also administered to screen for sleep disorders other than insomnia and to diagnose insomnia disorder when applicable. Following the intake assessment, participants completed 10–21 consecutive nights of sleep diaries concurrent with actigraphy that concluded with an overnight ambulatory polysomnographic (PSG) sleep study during participants’ habitual sleep time. The following morning, participants completed magnetic resonance imaging (MRI) scans and a battery of neurocognitive tests including a computerized PVT. The variables relevant to the present analyses are described in greater detail below.
Participants
Participants (N = 66) were recruited from BYU and the surrounding community through flyers and online advertisements. In one of the protocols (n = 37), participants were recruited across tertials of insomnia severity using standard Insomnia Severity Index (ISI) cutoff scores: 0–7 no insomnia, 8–14 subclinical insomnia, and 15–21 severe insomnia.43 The other protocol (n = 29) recruited two groups of participants: good sleepers (ISI <7) and patients with clinical insomnia according to DSM-5 criteria. The combined sample represented a wide range of insomnia symptom severity. All participants gave written informed consent and were compensated for their participation. Protocols were approved by the Institutional Review Board at BYU (IRB# F16497 & F16377) and conducted in accordance with the Declaration of Helsinki.
Exclusion criteria for both protocols were: (1) history of severe psychiatric illness, (2) active suicidality in the past three months based on the Columbia-Suicide Severity Rating Scale (score ≥ 3),44 (3) current pregnancy, based on self-report and confirmed with a urine pregnancy test, (4) self-reported learning disabilities, (5) cognitive impairment (MoCA <26), (6) ferromagnetic material in the body, (7) fear of closed spaces, (8) consumption of >12 alcohol drinks per week or binge drinking (greater than or equal to four drinks for women or five drinks for men in a single sitting) in the past month or inability to abstain from alcohol for 24 hours before the MRI scan, (9) recreational drug use in the past month, (10) clinically significant symptoms or current diagnosis of sleep disorders other than insomnia, and (11) left-handedness (EHI < 0). Individuals on a single serotonin reuptake inhibitor or sleep aid were permitted to participate, given they were at a stable dose for at least 3 months. None of the participants included in this analysis reported being on antidepressants or hypnotics during the study.
Table 1 shows the demographic breakdown of the total sample along with descriptive statistics for mood variables, self-reported chronotype, sleep variables from sleep diaries, actigraphy, and PSG, and PVT metrics. In brief, participants were predominantly young adults (Mdn = 23, range 18–49 years old), right-handed (M EHI = 43), 47% female, and 88% white. All participants obtained at least a high school degree, with 98% having completed at least some college. In the total sample, 30 individuals had an ISI score in the minimal insomnia symptom range (ISI = 0–7), 20 individuals were in the subclinical insomnia symptom range (ISI = 8–14), and 16 individuals were in the moderate insomnia range (ISI = 15–21).
 |
Table 1 Demographics and Characteristics of Total Sample (N = 66) |
Measures of Interest
As part of the protocol, participants completed various questionnaires relating to sleep and mood. The questionnaires pertinent to these analyses include the ISI, Patient Health Questionnaire-9 (PHQ-9), the State-Trait Anxiety Inventory (STAI), and the Composite Scale of Morningness. The ISI is a widely used, well-validated seven-item measure of insomnia symptoms.45 The PHQ-9 is a well-validated 9-item questionnaire that assesses an individual’s depressive symptoms.46 The STAI is a 40-item questionnaire that assesses both state and trait anxiety.47 For these analyses state anxiety was used. The Composite Scale of Morningness is a well-validated 13-item measure of chronotype that ranges from 13 to 55 where scores below 22 indicate evening type, scores above 44 indicate morning type, and scores in between indicate an intermediate type.48
As part of a broader neurocognitive assessment, participants completed the PC-PVT Version 1, a computerized psychomotor vigilance task that is comparable in performance to the PVT-192.49 Neurocognitive testing typically occurred at 10:00 AM [Interquartile Range = 9:42 AM – 10:30 AM] the morning after the overnight ambulatory PSG sleep study. The median time between waking up and taking the PVT was 200 minutes [Interquartile Range = 175–248 minutes]. No pre-study sleep criteria or modifications to sleep schedules were required of participants. Participants were instructed not to use caffeine and alcohol for the 12 hours before their testing and MRI scans. On the day of testing, participants arrived at the BYU MRI Research Facility and completed a urine drug screen, MRI scans, and memory tests before completing the PC-PVT. All participants completed the PC-PVT in the same testing environment that included a well-lit, quiet, and private room. Participants were seated at a desk in a soft chair with a back. The PVT was administered by study staff who were seated next to the participant. Participants were given standard instructions and were told that the task was a simple reaction time test. Participants were instructed to watch a computer screen and click a high-performance gaming mouse as quickly as possible with their right index finger each time the visual stimuli (a millisecond counter) appeared on the screen. They were instructed to avoid responding too early, as this would result in a false start. They were also informed that responding too slowly would be considered an error. To help the participant orient themselves to the task, participants completed a brief practice trial. Following the practice, participants were informed that the task would go on for a while, but were not told the duration, and were encouraged to do their best. The participants were instructed that the task would begin immediately once they clicked the mouse. The administrator remained in the room and observed the participant as neutral, unobtrusive, and still as possible during the task. The PC-PVT lasted for 10-minutes and used the standardized parameter of random interstimulus intervals between 2 and 10 seconds. After the participants clicked on the mouse to respond to the visual stimuli, their reaction time stayed on the screen for 500 ms, thus providing brief feedback.
There are numerous metrics used to quantify PVT performance in the field including: mean reaction time, mean reciprocal reaction time, standard deviation of reaction time, number of lapses (reaction times greater than 500 ms), and, log signal-to-noise ratio (LSNR), among others. These metrics have been shown to be sensitive to sleepiness, including experimental increases in sleepiness during sleep deprivation protocols, and capture distinct aspects of performance.24–29,37,50,51
The mean of the reciprocal reaction times (mean 1/RT * 1000) was calculated as a measure of overall performance, excluding false starts (reaction times <150ms), for each participant due to its robust statistical nature.27 The LSNR was calculated for each participant, excluding false starts.28 Specifically, LSNR is interpreted as a measure of fidelity of cognitive information processing as it measures participants’ encoding of information and speed in responding appropriately.28,37 LSNR is sensitive to the degradation of performance due to sleep deprivation, and includes significant statistical advantages such as a lack of floor and ceiling effects, and a high degree of statistical normality.28 Standard deviation of reaction time, mean reaction time, and number of lapses were also calculated excluding false starts. These metrics were chosen due to their statistical advantages, ability to capture distinct aspects of PVT performance, wide use in the field, and sensitivity to increased sleep drive.
As part of the PVT, participants rated their sleepiness in the program on a standard scale from 1 (not sleepy) to 10 (extremely sleepy), at the start and end of the PVT (pre-PVT and post-PVT, respectively). The administrator provided verbal instructions for each sleepiness rating; participants were simply told to click the scale to indicate their current level of sleepiness. Due to the secondary nature of the study, we were unable to use a comprehensive and validated measure of self-reported sleepiness (eg, Karolinska Sleepiness Scale) before and after the PVT. However, the sleepiness measure used in this study has strong face validity and had high test–retest reliability pre- to post-PVT sleepiness (rs = 0.85).
Analyses
Analyses were conducted in IBM SPSS 26. We assessed all variables for assumptions of normality using the Shapiro–Wilk test and visual inspection of histogram plots. Central tendency and variance for normally distributed variables were reported using the mean and standard deviation. Non-normally distributed variables were reported using the median and interquartile range. The mode and percentage were used for categorical variables.
Main Analyses
To test whether performance on the PVT was associated with increased sleepiness post-PVT, we conducted a multivariate ordinal regression with both mean reciprocal reaction time and LSNR as predictors of post-PVT sleepiness ratings while adjusting for pre-PVT sleepiness ratings. Because pre-PVT sleepiness ratings were accounted for, the variance leftover represented the change in sleepiness from pre- to post-assessments of sleepiness. As insomnia severity was an inclusion criterion built into the design of both protocols, we also included ISI total score in the model to test whether insomnia severity accounted for changes in self-reported sleepiness. Thus, the main ordinal regression analysis included LSNR, mean reciprocal reaction time, pre-PVT sleepiness, and insomnia severity as predictors of post-PVT sleepiness. Following this main analysis, we conducted a sensitivity multivariate ordinal regression analysis to account for potential confounds in the aforementioned main analysis including demographics (age and sex), protocol (F16497 vs F16377), depression, anxiety, and the amount of time between final awakening from the overnight PSG study and performing the PVT. A retrospective power analysis was conducted to determine sensitivity of our study.
Exploratory Analyses
Because sex was found to be a significant predictor of post-PVT sleepiness in the sensitivity analysis, we conducted follow-up Mann–Whitney U-tests and Student’s t-tests to explore significant differences in pre- and post-PVT sleepiness ratings, changes in sleepiness ratings, and PVT performance (ie, mean reciprocal reaction time and LSNR) between men and women.
To explore whether insomnia moderated the association between PVT performance and changes in self-reported sleepiness, we investigated whether ISI total score interacted with either PVT mean reciprocal reaction time or LSNR in predicting changes in sleepiness reports by including an interaction term in a follow-up analysis to the main regression model. In two separate follow-up analyses, we also explored whether sleep history influenced changes in sleepiness rating by including an interaction term for PSG total sleep time (TST) or average diary TST with mean reciprocal time or LSNR to the main regression model described above.
To further explore associations between our variables, we used Spearman's correlation coefficient on the following: pre- and post-sleepiness ratings, pre- to post-PVT change in sleepiness ratings, and LSNR with depression severity, anxiety, insomnia severity, self-reported chronotype, TST, sleep onset latency, wake after sleep onset, and sleep efficiency from the average sleep diary data and also from PSG data from the previous night, and numerous PVT metrics (mean reaction time, standard deviation of reaction time, number of lapses, mean reciprocal reaction time, and LSNR).
We also conducted simple regression analyses to show the amount of variance in LSNR explained by pre-PVT sleepiness, the amount of variance in post-PVT sleepiness explained by LSNR, and the amount of variance in pre- and post-PVT sleepiness explained by insomnia severity.
Results
Table 2 shows the results of the main analysis. In the ordinal regression model, LSNR was a significant predictor of post-PVT sleepiness ratings when accounting for pre-PVT sleepiness, mean reciprocal reaction time, and insomnia severity. To help interpret the association between LSNR and pre- to post-sleepiness changes, we created a scatter plot of these variables in Figure 1. The plot revealed that as LSNR increased there was a greater reduction in sleepiness ratings and as LSNR decreased there was a greater increase in sleepiness ratings. The negative correlation represented in the plot was significant (rs = −0.370, p < 0.01). Mean reciprocal reaction time on the PVT and insomnia severity were not significant predictors of post-PVT sleepiness ratings in any model. Multicollinearity was not a problem in this regression analysis as LSNR and mean reciprocal reaction time were correlated at a 0.266 level (Table 3). LSNR remained a significant predictor of change in sleepiness ratings in the sensitivity analysis that included demographic variables, protocol, depression severity, state anxiety, and amount of time from final awakening from the overnight PSG until performing the PVT. Of these potential confounds, sex was the only significant predictor of pre- to post-PVT change in sleepiness (p = 0.031). To further explain this association, men and women did not have significantly different levels of pre-PVT self-reported sleepiness ratings (Z = −1.37, p = 0.171) nor did they have significantly different levels in the amount of change in sleepiness ratings pre-to-post (Z = −1.64, p = 0.101). However, men and women did have significantly different levels of post-PVT sleepiness ratings, such that women reported higher levels of sleepiness than men (Z = −2.20, p = 0.028). It should also be noted that women had significantly lower mean reciprocal reaction time than men (t = −2.53, p = 0.014) but there were no significant differences in LSNR (t = −0.50, p = 0.621). The obtained bivariate ordinal logistic regression coefficient for LSNR of −0.405, yielding an odds ratio of 0.667, was used as the effect size for a retrospective power analysis of the association between the variables. Estimated power using a significance level of 0.05 for selected sample sizes ranging from 50 to 100 was obtained using Monte Carlo simulation with Mplus 8.5. With over 60 participants, estimated power exceeds 0.80. Thus, the sample size of this study was adequate to determine medium to large effect sizes.
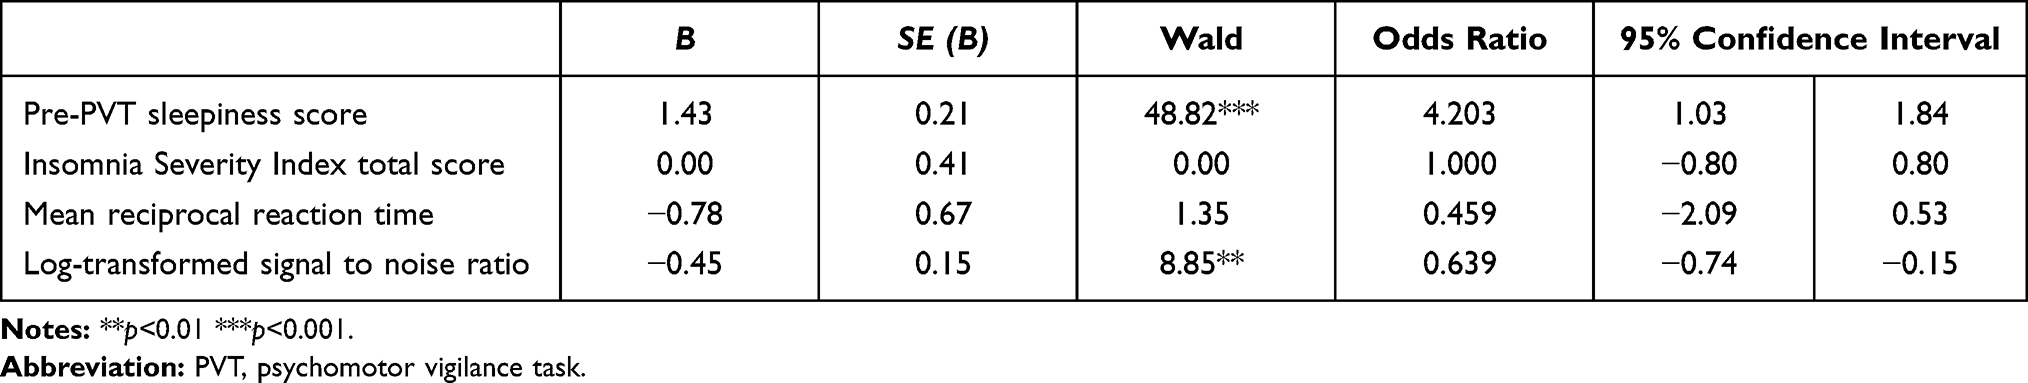 |
Table 2 Ordinal Regression Model Predicting Post-PVT Sleepiness Scores |
 |
Table 3 Correlations of Pre-PVT Sleepiness Score, Post-PVT Sleepiness Score, Changes in Sleepiness Score from Pre-to-Post PVT, Log-Transformed Signal-to-Noise Ratio with Person-Level Factors and PVT Performance Metrics |
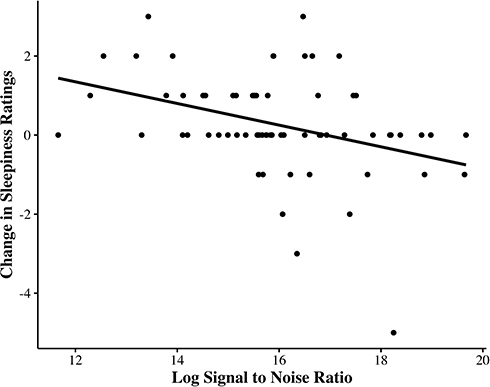 |
Figure 1 This figure depicts the scatter plot between the LSNR and pre-to-post changes in sleepiness. The correlation between LSNR and pre-to-post changes in sleepiness was significant (rs = −0.370, p < 0.01). Participants who had lower fidelity of information processing during the PVT reported greater sleepiness after completing the PVT than they had immediately before doing the PVT, whereas participants who had higher fidelity of information processing reported less sleepiness after the PVT, in individuals with and without insomnia symptoms. Removing the participant who appeared to have an extreme change in sleepiness ratings in the negative direction did not alter the pattern of results or significance level. |
In follow-up regression analyses, we found no evidence that insomnia, average diary TST, or PSG TST from the previous night were related to changes in sleepiness as they were not significant predictors themselves, nor did they moderate the association between PVT performance and change in sleepiness pre- to post-PVT.
Table 3 shows the results of exploratory correlation analyses. These analyses indicated that pre-PVT sleepiness ratings were significantly correlated with PHQ-9 depression symptom inventory scores, STAI-state anxiety score, insomnia severity, number of lapses, average sleep onset latency from sleep diaries, PSG TST, and PSG sleep efficiency. Post-PVT sleepiness ratings were significantly correlated with PHQ-9 depression symptom inventory scores, STAI-state anxiety scores, insomnia severity, mean reaction time, variability in reaction time, mean reciprocal reaction time, number of lapses, LSNR, and PSG sleep efficiency. LSNR was strongly correlated with variability in reaction time (rs = −0.910, p < 0.01) and significantly correlated with state anxiety, mean reaction time, number of lapses, mean reciprocal reaction time, post-PVT sleepiness, and change in sleepiness.
Using simple linear regression, we found that 3% of the variance in LSNR was explained by pre-PVT sleepiness (p = 0.161). The LSNR, in contrast, explained 14.5% of the variance in post-PVT sleepiness reports (p = 0.002). The amount of variance in pre- and post-PVT sleepiness explained by insomnia severity was 19% (p < 0.001) and 18% (p < 0.001), respectively.
Discussion
We explored whether poor performance on a psychomotor vigilance task that is sensitive to sleepiness was associated with increased self-reported sleepiness in a rested condition. We found that lower fidelity of information processing on the PVT, but not the overall reaction time performance, was a significant predictor of increased self-reported sleepiness, regardless of insomnia symptom severity or sleep history of TST. Because pre-PVT sleepiness ratings were accounted for in the analysis, post-PVT sleepiness ratings represent the relative change in sleepiness ratings predicted by lower fidelity of information processing. The finding that 14.5% of the variance in post-PVT sleepiness could be explained by the fidelity of information processing was on par with the predictive power of insomnia severity, a well-known predictor of sleepiness reports. This study adds further clarity to prior studies that found changes in self-reported sleepiness following a vigilance task.21,38 Specifically, we demonstrated that the level of fidelity of information processing during the task, in particular, was associated with the direction in which sleepiness ratings changed following the task.
There are several potential explanations for the association between PVT performance and changes in sleepiness reports. First, lower fidelity of information processing may have served as a cue on which participants gauged their sleepiness. Lower fidelity of information processing represents a slowness in processing information and responding appropriately.28 As participants progressed through the PVT, they might have experienced a slowness in processing the stimuli which, in turn, might have helped the participants become more consciously aware of their sleepiness or to interpret their sluggishness as sleepiness. Likewise, higher fidelity of information processing may have prompted participants to interpret their state as being less sleepy. Second, feedback from the PVT presented on the computer screen may have influenced participants self-reported sleepiness. Lower fidelity of information processing was highly correlated with variable performance on the PVT. Participants were shown their reaction time after each trial, and they could have noticed that their reaction times were more or less variable. Participants may have changed their sleepiness reports to match this feedback. While individuals are likely to notice and interpret fluctuations in reaction times around their individual norms, participants who consistently respond within a limited range would have a much more limited frame of reference to interpret whether that consistent reaction time was fast or slow. However, it is possible that we were not sufficiently powered to detect a smaller effect size relationship between mean performance and changes in sleepiness ratings. Because this study lacked different feedback conditions, we cannot determine whether feedback on the PVT was a factor in the changes in self-reported sleepiness. A prior study that compared reciprocal response time between feedback and no feedback conditions found that feedback resulted in better performance only when they used the standard interstimulus intervals of 2–10 seconds,52 suggesting that feedback is associated with level of performance. Furthermore, another study found that participants’ self-reported ratings of alertness and their self-reported ratings of performance were highly correlated, suggesting that individuals may associate their self-monitoring of performance with their level of alertness.53 That study also showed that the association between self-reported alertness and self-monitoring of performance was strongest when individuals performed a task that provided feedback. Future studies that include differences in feedback conditions are needed to explore the association between feedback and self-reported sleepiness and whether the internal experience of poorer fidelity of information processing or whether the environmental feedback of poorer performance contributes to changes in sleepiness reports. Studies that assess participants’ perception of their performance could also shed further light on these possible explanations. These possibilities have the advantage of explaining both the increase and the decrease in sleepiness in relation to individual differences in performance on the PVT.
The third and fourth explanations for these findings are, respectively, that latent sleepiness became unmasked or sleep drive increased over the course of the PVT. Both of these explanations would suggest that individual differences in sleep drive manifested as both lower fidelity of information processing and a greater increase in sleepiness ratings. Regarding the third possible explanation, participants may have had a stronger sleep drive than they were aware or reported prior to the PVT due to various masking factors, such as lighting and position.22 Because the PVT was performed in the morning, a time of general alertness, performing the PVT may have unmasked latent sleepiness. Regarding the fourth explanation, performing the PVT may have increased use-dependent sleep processes, thereby contributing to lower fidelity of information processing and a greater increase in self-reported sleepiness.54 Whether a 10-minute PVT can induce a substantive increase in use-dependent sleep drive is unknown, but our findings suggest that if it does, the task itself may not act on all individuals’ sleep drive the same. Additional work is required to determine whether there are individual differences in how the PVT influences local use-dependent sleep drive. Regardless, these explanations fail to account for the individuals with higher fidelity of information processing who reported feeling less sleepy after the PVT than they had before the PVT.
In this discussion we have proposed 4 possible explanations for the present findings. These possibilities can be further conceptually explored within the framework of a 3-factor model of sleep-wake states.55 This model proposes that conscious awareness, sleep drive, and arousal determine an individual’s global state. In this model, daytime sleepiness can result from various combinations of these three factors. In terms of conscious awareness, no prior study, to our knowledge, has investigated how levels of conscious awareness relate to self-reported sleepiness. Fidelity of information processing may be a tenable marker of an individual’s level of conscious awareness during the PVT. One possibility of our findings is that individual differences in conscious awareness during the PVT influenced sleepiness reports. This may explain why fidelity of information processing, but not mean level performance, was related to change in self-reported sleepiness. In terms of sleep drive, biological sleep processes undoubtedly influence self-reported sleepiness. However, the sleep drive factor does not seem to be as strong of an explanation of the current findings. We did not find any influence of sleep duration during the prior night, average sleep duration during the prior weeks, or insomnia severity (all variables known to be associated with sleepiness) on how PVT performance related to changes in sleepiness. Moreover, individual differences in sleep drive is not a clear explanation for why individuals with higher fidelity of information processing had a reduction in self-reported sleepiness. In terms of arousal, there is substantial evidence that levels of arousal influence self-reported sleepiness, both as a factor that can mask sleepiness when increased and unmask sleepiness when decreased.22 However, this study was not specifically designed to assess conscious awareness, sleep drive, or arousal, in regard to their impact on this association.
Daytime sleepiness is a common complaint and problem for patients with insomnia.2 Insomnia symptom severity was associated with higher self-reported sleepiness before and after the PVT. This finding is consistent with prior studies that also found that insomnia was associated with higher sleepiness ratings during the course of neurocognitive testing.39 Some models posit that patients with insomnia have an attentional bias toward sleep-related information and are hyper-aroused, which might influence the association between PVT performance and sleepiness ratings.23,56,57 In this study, we failed to find an association between insomnia symptom severity and changes in self-reported sleepiness following the PVT. It should be noted that the vigilance test used in this study was brief (10 minutes). One possibility is that participants with insomnia symptoms may have been able to compensate for this amount of time. A follow-up study in a larger sample of individuals with insomnia and which uses a longer vigilance task, or a sleep deprivation protocol, is needed to determine whether differences in the association between performance and changes in sleepiness is related to insomnia.
In this study, we found that sex was a significant predictor of pre-to-post changes in sleepiness when accounting for potential confounds such as age, protocol, mood variables, among others. This association showed that females reported higher self-reported sleepiness ratings after the PVT than males, regardless of the level of performance. Additionally, we found that both pre- and post-PVT sleepiness ratings were significantly correlated with measures of depression, anxiety, insomnia severity, and level of performance during the PVT, consistent with findings currently in the literature.27,58 Sleep diary SOL and PSG TST and SE were also associated with sleepiness reports in expected directions. Interestingly, pre-PVT sleepiness ratings were significantly correlated with these sleep history variables while post-PVT sleepiness ratings was less robust. These findings might suggest that post-PVT sleepiness is more strongly associated with the proximal level of performance on the PVT than the prior night’s sleep features. Future studies are needed to further examine these potential associations and their underlying mechanisms.
As a secondary analysis, this study has several limitations. We are unable to provide causal inference or to differentiate between the possible explanations outlined above. The directional effects of our results suggest that the overall pre- to post-PVT changes in this single item self-reported sleepiness scale are meaningful and not simply due to an unreliable measure. Indeed, the test–retest reliability of this measure was good. Furthermore, nearly 50% of participants changed their sleepiness rating. The direction of the change was interpretable and corresponded to their level of performance on the PVT. Those who performed better reported decreased sleepiness levels and those who performed more poorly reported increased sleepiness levels. Most participants who changed their sleepiness rating deviated by 1–3 points pre- to post-PVT. In the context of the 1–10 sleepiness scale, these changes represent a 10–30% change in an individual’s report of their sleepiness, with only a 10-minute gap separating their sleepiness ratings. The use of a single-item sleepiness measure introduced the possibility of an operational confound. Specifically, many people may confabulate their feelings of fatigue with sleepiness. Indeed, previous studies suggest that self-reported sleepiness covaries with fatigue.16 Therefore, differences in PVT performance could result in changes in feelings of fatigue during the task, which could have then been reported as changes in self-reported sleepiness. While this might explain those individuals who reported greater sleepiness after the PVT, this explanation cannot explain those who had higher levels of fidelity of information processing in their PVT performance and subsequently reported lower sleepiness. Another consideration is that this study used a single test bout that was administered in the morning, a period of generally low sleep pressure and high circadian alertness. The generalizability of these findings requires follow-up studies to determine whether performance is related to sleepiness in other time points and populations.
In conclusion, this is the first study to show that level of performance on a vigilance task are associated with changes in self-reported sleepiness in a rested condition. We found that individuals who had lower fidelity of information processing reported greater levels of sleepiness than they had at the start of the PVT, 10 minutes earlier. Establishing how the level of performance relates to changes in self-reported sleepiness may innovate assessment techniques and interventions that help people to recognize and report their sleepiness. Follow-up research is needed to further investigate how individual differences in fidelity of information processing relates to self-reported sleepiness. Future studies would also benefit from conducting multiple test administrations throughout the day to determine if these results extend across the day and during varying levels of sleepiness. A validated model that explains these results could have far-reaching benefits for society. For example, if fidelity of information processing influences awareness of latent sleepiness, tasks that challenge an individual’s fidelity of information processing may help in professions where such feedback is not provided as part of the routine job. For example, long-haul drives who sometimes struggle to know when it is time to pull over for rest might more readily recognize their sleepiness if given such a performance test. Performance markers of sleepiness may also help patients with insomnia who sometimes struggle to know when they are sleepy enough to get in bed to attempt sleep.
Acknowledgments
We would like to acknowledge Joseph Olsen for his statistical input.
Disclosure
Dr Daniel J Buysse reports grants from National Institutes of Health, Patient Centered Outcomes Research Institute, personal fees from Bayer, BeHealth Solutions, Cereve/Ebb Therapeutics, Emmi Solutions, Pear Therapeutics, Philips Respironics, Sleep Number, Weight Watchers International, National Cancer Institute, American Academy of Physician Assistants, CME Institute, Eisai, outside the submitted work. In addition, Dr Daniel J Buysse has a patent Pittsburgh Sleep Quality Index licensed to University of Pittsburgh, a patent Pittsburgh Sleep Quality Index Addendum for PTSD (PSQI-A), a patent Brief Pittsburgh Sleep Quality Index (B-PSQI), a patent Daytime Insomnia Symptoms Scale, a patent Pittsburgh Sleep Diary, a patent Insomnia Symptom Questionnaire, a patent RU_SATED, a patent Consensus Sleep Diary. The authors report no other conflicts of interest in this work.
References
1. Ohayon MM, Dauvilliers Y, Reynolds CF
2. Hein M, Lanquart JP, Loas G, Hubain P, Linkowski P. Prevalence and risk factors of excessive daytime sleepiness in insomnia sufferers: a study with 1311 individuals. J Psychosom Res. 2017;103:63–69. doi:10.1016/j.jpsychores.2017.10.004
3. Dean B, Aguilar D, Shapiro C, et al. Impaired health status, daily functioning, and work productivity in adults with excessive sleepiness. J Occup Environ Med. 2010;52(2):144–149. doi:10.1097/JOM.0b013e3181c99505
4. Bioulac S, Micoulaud-Franchi JA, Arnaud M, et al. Risk of motor vehicle accidents related to sleepiness at the wheel: a systematic review and meta-analysis. Sleep. 2017;40(10). doi:10.1093/sleep/zsx134.
5. Boden-Albala B, Roberts ET, Bazil C, et al. Daytime sleepiness and risk of stroke and vascular disease: findings from the Northern Manhattan Study (NOMAS). Circ Cardiovasc Qual Outcomes. 2012;5(4):500–507. doi:10.1161/CIRCOUTCOMES.111.963801
6. Ozder A, Eker HH. The prevalence of excessive daytime sleepiness among academic physicians and its impact on the quality of life and occupational performance. Int J Occup Med Environ Health. 2015;28(4):721–730. doi:10.13075/ijomeh.1896.00367
7. Daley M, Morin CM, LeBlanc M, Grégoire JP, Savard J. The economic burden of insomnia: direct and indirect costs for individuals with insomnia syndrome, insomnia symptoms, and good sleepers. Sleep. 2009;32(1):55–64.
8. Schneider-Helmert D. Twenty-four-hour sleep-wake function and personality patterns in chronic insomniacs and healthy controls. Sleep. 1987;10(5):452–462. doi:10.1093/sleep/10.5.452
9. Raymann RJ, Van Someren EJ. Time-on-task impairment of psychomotor vigilance is affected by mild skin warming and changes with aging and insomnia. Sleep. 2007;30(1):96–103. doi:10.1093/sleep/30.1.96
10. Perry GS, Patil SP, Presley-Cantrell LR. Raising awareness of sleep as a healthy behavior. Prev Chronic Dis. 2013;10:E133. doi:10.5888/pcd10.130081
11. Perrier J, Bertran F, Marie S, et al. Impaired driving performance associated with effect of time duration in patients with primary insomnia. Sleep. 2014;37(9):1565–1573. doi:10.5665/sleep.4012
12. Ohayon MM. From wakefulness to excessive sleepiness: what we know and still need to know. Sleep Med Rev. 2008;12(2):129–141. doi:10.1016/j.smrv.2008.01.001
13. Cluydts R, De Valck E, Verstraeten E, Theys P. Daytime sleepiness and its evaluation. Sleep Med Rev. 2002;6(2):83–96. doi:10.1053/smrv.2002.0191
14. Borbely AA, Daan S, Wirz-Justice A, Deboer T. The two-process model of sleep regulation: a reappraisal. J Sleep Res. 2016;25(2):131–143. doi:10.1111/jsr.12371
15. Eriksen CA, Akerstedt T, Kecklund G, Akerstedt A. Comment on short-term variation in subjective sleepiness. Percept Mot Skills. 2005;101(3):943–948. doi:10.2466/PMS.101.7.943-948
16. Buysse DJ, Thompson W, Scott J, et al. Daytime symptoms in primary insomnia: a prospective analysis using ecological momentary assessment. Sleep Med. 2007;8(3):198–208. doi:10.1016/j.sleep.2006.10.006
17. Dinges DF, Pack F, Williams K, et al. Cumulative sleepiness, mood disturbance, and psychomotor vigilance performance decrements during a week of sleep restricted to 4–5 hours per night. Sleep. 1997;20(4):267–277.
18. Pavot W, Diener E. The affective and cognitive context of self-reported measures of subjective well-being. Soc Indic Res. 1993;28(1):1–20. doi:10.1007/BF01086714
19. De Valck E, Cluydts R. Sleepiness as a state-trait phenomenon, comprising both a sleep drive and a wake drive. Med Hypotheses. 2003;60(4):509–512. doi:10.1016/S0306-9877(02)00444-9
20. Sharafkhaneh A, Hirshkowitz M. Contextual factors and perceived self-reported sleepiness: a preliminary report. Sleep Med. 2003;4(4):327–331. doi:10.1016/S1389-9457(03)00002-9
21. Åkerstedt T, Kecklund G, Axelsson J. Effects of context on sleepiness self‐ratings during repeated partial sleep deprivation. Chronobiol Int. 2008;25(2–3):271–278. doi:10.1080/07420520802110589
22. Van Dongen HPA, Dinges D F. Circadian rhythms in fatigue, alertness, and performance. In: Kryger MH, Roth T, Dement WC, editors. Principles and Practice of Sleep Medicine. Vol. 3rd. Philadelphia, Pennsylvania: WB Saunders; 2000:391–399.
23. Spiegelhalder K, Espie C, Riemann D. Is sleep-related attentional bias due to sleepiness or sleeplessness? Cogn Emot. 2009;23(3):541–550. doi:10.1080/02699930802022129
24. Lim J, Dinges DF. Sleep deprivation and vigilant attention. Ann N Y Acad Sci. 2008;1129:305–322. doi:10.1196/annals.1417.002
25. Akerstedt T, Anund A, Axelsson J, Kecklund G. Subjective sleepiness is a sensitive indicator of insufficient sleep and impaired waking function. J Sleep Res. 2014;23(3):240–252. doi:10.1111/jsr.12158
26. Van Dongen HP, Maislin G, Mullington JM, Dinges DF. The cumulative cost of additional wakefulness: dose-response effects on neurobehavioral functions and sleep physiology from chronic sleep restriction and total sleep deprivation. Sleep. 2003;26(2):117–126. doi:10.1093/sleep/26.2.117
27. Basner M, Dinges DF. Maximizing sensitivity of the psychomotor vigilance test (PVT) to sleep loss. Sleep. 2011;34(5):581–591. doi:10.1093/sleep/34.5.581
28. Chavali VP, Riedy SM, Van Dongen HP. Signal-to-noise ratio in PVT performance as a cognitive measure of the effect of sleep deprivation on the fidelity of information processing. Sleep. 2017;40(3). doi:10.1093/sleep/zsx016
29. Horne JA, Burley CV. We know when we are sleepy: subjective versus objective measurements of moderate sleepiness in healthy adults. Biol Psychol. 2010;83(3):266–268. doi:10.1016/j.biopsycho.2009.12.011
30. Shekleton JA, Rogers NL, Rajaratnam SM. Searching for the daytime impairments of primary insomnia. Sleep Med Rev. 2010;14(1):47–60. doi:10.1016/j.smrv.2009.06.001
31. Fortier-Brochu E, Beaulieu-Bonneau S, Ivers H, Morin CM. Insomnia and daytime cognitive performance: a meta-analysis. Sleep Med Rev. 2012;16(1):83–94. doi:10.1016/j.smrv.2011.03.008
32. Chung S, Bohnen NI, Albin RL, Frey KA, Müller ML, Chervin RD. Insomnia and sleepiness in Parkinson disease: associations with symptoms and comorbidities. J Clin Sleep Med. 2013;9(11):1131–1137. doi:10.5664/jcsm.3150
33. Liu H, Wang D, Li Y, et al. Examination of daytime sleepiness and cognitive performance testing in patients with primary insomnia. PLoS One. 2014;9(6):e100965. doi:10.1371/journal.pone.0100965
34. Gumenyuk V, Belcher R, Drake CL, Roth T. Differential sleep, sleepiness, and neurophysiology in the insomnia phenotypes of shift work disorder. Sleep. 2015;38(1):119–126. doi:10.5665/sleep.4336
35. Stepanski E, Zorick F, Roehrs T, Roth T. Effects of sleep deprivation on daytime sleepiness in primary insomnia. Sleep. 2000;23(2):215–219. doi:10.1093/sleep/23.2.1h
36. Kay DB, Karim HT, Hasler BP, et al. Impact of acute sleep restriction on cerebral glucose metabolism during recovery non-rapid eye movement sleep among individuals with primary insomnia and good sleeper controls. Sleep Med. 2019;55:81–91. doi:10.1016/j.sleep.2018.12.007
37. Hansen DA, Layton ME, Riedy SM, Van Dongen HP. Psychomotor vigilance impairment during total sleep deprivation is exacerbated in sleep-onset insomnia. Nat Sci Sleep. 2019;11:401–410. doi:10.2147/NSS.S224641
38. Varkevisser M, Kerkhof GA. Chronic insomnia and performance in a 24-h constant routine study. J Sleep Res. 2005;14(1):49–59. doi:10.1111/j.1365-2869.2004.00414.x
39. Schneider C, Fulda S, Schulz H. Daytime variation in performance and tiredness/sleepiness ratings in patients with insomnia, narcolepsy, sleep apnea and normal controls. J Sleep Res. 2004;13(4):373–383. doi:10.1111/j.1365-2869.2004.00427.x
40. First M, Williams J, Karg R, Spitzer R. Structured Clinical Interview for DSM-5—research Version (SCID-5 for DSM-5, Research Version; SCID-5-RV). Arlington, VA: American Psychiatric Association; 2015.
41. Nasreddine ZS, Phillips NA, Bédirian V, et al. The Montreal Cognitive Assessment, MoCA: a brief screening tool for mild cognitive impairment. J Am Geriatr Soc. 2005;53(4):695–699. doi:10.1111/j.1532-5415.2005.53221.x
42. Oldfield RC. The assessment and analysis of handedness: the Edinburgh inventory. Neuropsychologia. 1971;9(1):97–113. doi:10.1016/0028-3932(71)90067-4
43. Morin CM, Belleville G, Bélanger L, Ivers H. The Insomnia Severity Index: psychometric indicators to detect insomnia cases and evaluate treatment response. Sleep. 2011;34(5):601–608. doi:10.1093/sleep/34.5.601
44. Posner K, Brown GK, Stanley B, et al. The Columbia-Suicide Severity Rating Scale: initial validity and internal consistency findings from three multisite studies with adolescents and adults. Am J Psychiatry. 2011;168(12):1266–1277. doi:10.1176/appi.ajp.2011.10111704
45. Bastien CH, Vallières A, Morin CM. Validation of the Insomnia Severity Index as an outcome measure for insomnia research. Sleep Med. 2001;2(4):297–307. doi:10.1016/S1389-9457(00)00065-4
46. Kroenke K, Spitzer RL, Williams JB. The PHQ-9: validity of a brief depression severity measure. J Gen Intern Med. 2001;16(9):606–613. doi:10.1046/j.1525-1497.2001.016009606.x
47. Spielberger G, Lushene V, Jacobs. Manual for the State-Trait Anxiety Inventory. Palo Alto, CA: Consulting Psychologists Press; 1983.
48. Smith CS, Reilly C, Midkiff K. Evaluation of three circadian rhythm questionnaires with suggestions for an improved measure of morningness. J Appl Psychol. 1989;74(5):728–738. doi:10.1037/0021-9010.74.5.728
49. Khitrov MY, Laxminarayan S, Thorsley D, et al. PC-PVT: a platform for psychomotor vigilance task testing, analysis, and prediction. Behav Res Methods. 2014;46(1):140–147. doi:10.3758/s13428-013-0339-9
50. Van Dongen HP, Baynard MD, Maislin G, Dinges DF. Systematic interindividual differences in neurobehavioral impairment from sleep loss: evidence of trait-like differential vulnerability. Sleep. 2004;27(3):423–433.
51. Drummond SP, Bischoff-Grethe A, Dinges DF, Ayalon L, Mednick SC, Meloy MJ. The neural basis of the psychomotor vigilance task. Sleep. 2005;28(9):1059–1068.
52. Roach GD, Lamond N, Dawson D. Feedback has a positive effect on cognitive function during total sleep deprivation if there is sufficient time for it to be effectively processed. Appl Ergon. 2016;52:285–290. doi:10.1016/j.apergo.2015.07.026
53. Dorrian J, Lamond N, Holmes AL, et al. The ability to self-monitor performance during a week of simulated night shifts. Sleep. 2003;26(7):871–877. doi:10.1093/sleep/26.7.871
54. Van Dongen HPA, Belenky G, Krueger JM. A local, bottom-up perspective on sleep deprivation and neurobehavioral performance. Curr Top Med Chem. 2011;11(19):2414–2422. doi:10.2174/156802611797470286
55. Kay DB, Buysse DJ. Hyperarousal and beyond: new insights to the pathophysiology of insomnia disorder through functional neuroimaging studies. Brain Sci. 2017;7(3):23. doi:10.3390/brainsci7030023
56. Baglioni C, Lombardo C, Bux E, et al. Psychophysiological reactivity to sleep-related emotional stimuli in primary insomnia. Behav Res Ther. 2010;48(6):467–475. doi:10.1016/j.brat.2010.01.008
57. Jones BT, Macphee LM, Broomfield NM, Jones BC, Espie CA. Sleep-related attentional bias in good, moderate, and poor (primary insomnia) sleepers. J Abnorm Psychol. 2005;114(2):249–258. doi:10.1037/0021-843X.114.2.249
58. Yun CH, Kim H, Lee SK, et al. Daytime sleepiness associated with poor sustained attention in middle and late adulthood. Sleep Med. 2015;16(1):143–151. doi:10.1016/j.sleep.2014.07.028
 © 2021 The Author(s). This work is published and licensed by Dove Medical Press Limited. The
full terms of this license are available at https://www.dovepress.com/terms
and incorporate the Creative Commons Attribution
- Non Commercial (unported, 3.0) License.
By accessing the work you hereby accept the Terms. Non-commercial uses of the work are permitted
without any further permission from Dove Medical Press Limited, provided the work is properly
attributed. For permission for commercial use of this work, please see paragraphs 4.2 and 5 of our Terms.
© 2021 The Author(s). This work is published and licensed by Dove Medical Press Limited. The
full terms of this license are available at https://www.dovepress.com/terms
and incorporate the Creative Commons Attribution
- Non Commercial (unported, 3.0) License.
By accessing the work you hereby accept the Terms. Non-commercial uses of the work are permitted
without any further permission from Dove Medical Press Limited, provided the work is properly
attributed. For permission for commercial use of this work, please see paragraphs 4.2 and 5 of our Terms.