")
Back to Journals » International Journal of General Medicine » Volume 8
Feet swelling in a multistage ultraendurance triathlete: a case study
Authors Knechtle B , Zingg M, Knechtle P, Rosemann T , Rüst CA
Received 16 August 2015
Accepted for publication 5 September 2015
Published 13 October 2015 Volume 2015:8 Pages 325—332
DOI https://doi.org/10.2147/IJGM.S94542
Checked for plagiarism Yes
Review by Single anonymous peer review
Peer reviewer comments 2
Editor who approved publication: Dr Scott Fraser
Beat Knechtle,1 Matthias Alexander Zingg,2 Patrizia Knechtle,1 Thomas Rosemann,2 Christoph Alexander Rüst2
1Gesundheitszentrum St Gallen, St Gallen, 2Institute of Primary Care, University of Zurich, Zurich, Switzerland
Abstract: Recent studies investigating ultraendurance athletes showed an association between excessive fluid intake and swelling of the lower limbs such as the feet. To date, this association has been investigated in single-stage ultraendurance races, but not in multistage ultraendurance races. In this case study, we investigated a potential association between fluid intake and feet swelling in a multistage ultraendurance race such as a Deca Iron ultratriathlon with ten Ironman triathlons within 10 consecutive days. A 49-year-old well-experienced ultratriathlete competed in autumn 2013 in the Deca Iron ultratriathlon held in Lonata del Garda, Italy, and finished the race as winner within 129:33 hours:minutes. Changes in body mass (including body fat and lean body mass), foot volume, total body water, and laboratory measurements were assessed. Food and fluid intake during rest and competing were recorded, and energy and fluid turnovers were estimated. During the ten stages, the volume of the feet increased, percentage body fat decreased, creatinine and urea levels increased, hematocrit and hemoglobin values decreased, and plasma [Na+] remained unchanged. The increase in foot volume was significantly and positively related to fluid intake during the stages. The poststage volume of the foot was related to poststage total body water, poststage creatinine, and poststage urea. This case report shows that the volume of the foot increased during the ten stages, and the increase in volume was significantly and positively related to fluid intake during the stages. Furthermore, the poststage volume of the foot was related to poststage total body water, poststage creatinine, and poststage urea. The continuous feet swelling during the race was most probably due to a combination of a high fluid intake and a progressive decline in renal function (ie, continuous increase in creatinine and urea), leading to body fluid retention (ie, increase in total body water).
Keywords: swimming, cycling, running, fluid
Introduction
Ultraendurance performance seems to lead to changes in the feet of the athletes.1–3 In ultramarathoners competing in a 64-day multistage ultramarathon across Europe, changes in the feet have been recorded using magnetic resonance imagining.3 The diameter of the Achilles tendon increased, and bone lesions and subcutaneous edema occurred.3 The subcutaneous edema resulted in a swelling of both ankles and feet. The swelling of the feet necessitated cutting away parts of the shoes and creating makeshift sandals to accommodate the athletes’ feet.3
Apart from running per se, fluid intake during running also seems to have had an effect on the feet of the athletes. An increased fluid intake during an ultraendurance performance, such as a 100 km ultramarathon, was associated with an increase in the volume of the extremities,1,2 especially of the lower limbs such as the feet.2 The changes in the feet of ultramarathoners with subcutaneous edema3 might also explain the increase in the volume of both the feet and the lower leg, reported by Bracher et al1 and Cejka et al2 in 100 km ultramarathoners.
An ultraendurance performance also leads to an increase in total body water as has been shown in ultradistance races of different durations.4–7 During a multistage ultraendurance performance, total body water continuously increased up to 2.3 L.5,6,8,9 The increase in total body water is explained by retention of plasma sodium ([Na+]) as the most likely mechanism.7,10,11
The increase in feet volume in ultraendurance athletes is most likely due to fluid intake, or rather fluid overload.1,2 In 100 km ultramarathoners, fluid intake was significantly and positively related to the change in the volume of the feet.2 In Ironman triathletes, however, the volume of the lower leg decreased and the decrease was unrelated to fluid intake.12 Moreover, the continuous increase in total body water during an ultraendurance performance might be responsible for the swelling of the feet. Nonetheless, the association between changes in feet volume and fluid intake has only been investigated in single-stage ultraendurance races such as an ultramarathon or an Ironman triathlon, but not in a multistage ultraendurance race. In this case study, we investigated a potential association between fluid intake and feet swelling in a multistage race such as a Deca Iron ultratriathlon, wherein ten Ironman triathlons have to be completed within 10 consecutive days.
Case presentation
Ethics
The investigation received approval from the Institutional Review Board of Kanton St Gallen, Switzerland. The athlete gave informed written consent for the case study and for the publication of this paper.
Subject and event
Our subject was a 49-year-old well-experienced ultratriathlete (78 kg, 1.78 m) who had already finished several multistage ultratriathlons, such as 5-day and 10-day multistage ultratriathlons. His personal best time in a 5-day multistage ultratriathlon was 69:29 hours:minutes and in a 10-day multistage ultratriathlon, 128:22 hours:minutes. Apart from these multistage triathlons, he had finished 22 Double Iron ultratriathlons (personal best time 22:57 hours:minutes) and 24 Triple Iron ultratriathlons (personal best time 37:18 hours:minutes). His average weekly training volume ranged from ~30 hours up to a maximum of ~50 hours, with a total annual volume of ~1,600 hours.
The Deca Iron ultratriathlon race started on September 28, 2013 and consisted in performing daily one Ironman distance triathlon (ie, 3.8 km swimming, 180 km cycling, and 42 km running) in 10 days. The race was held inside (ie, swimming and running) and outside (ie, cycling) of “Parco La Quiete” (http://www.parcolaquiete.it) near Lonata del Garda, south to Lake Garda, in the north of Italy. Swimming was held in a nonheated 25 m outdoor pool. Cycling was held in the surroundings of “Parco La Quiete” with 30 laps of 6 km each to complete the total distance of 180 km for the cycling split. Running was held around the lake in “Parco La Quiete” with 54 laps of 800 m each. Approximately 50% of the course was on lawn, and the other 50% was on stone slabs. Laps were counted manually during swimming and electronically during cycling and running. Table 1 presents the environmental conditions (ie, air temperature) during the 10 days.
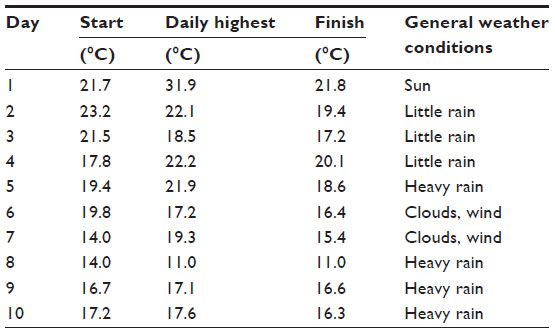 | Table 1 Daily air temperature before the start of the race, maximum temperature during the day, and temperature at the finish of each stage |
Measurements
One month before the start of the race, a maximal exercise test was performed on a stationary cycle ergometer (Corival Cycle Ergometer; MedGraphics, St Paul, MN, USA) to determine maximum oxygen uptake (VO2max). The exercise protocol started at 100 W and was increased by 30 W every 3 minutes until exhaustion of the athlete. Oxygen uptake (VO2) and carbon dioxide release (VCO2) were measured continuously (CPX Ultima; MedGraphics). The subject achieved 340 W (4.35 W·kg−1) and reached a VO2max of 57.0 mL·min−1·kg−1. The portable heart rate monitor POLAR® S625X (Polar Electro Oy, Kempele, Finland) was then programmed using sex, age, body mass, and VO2max to estimate energy expenditure during the race.13 Because estimation of energy expenditure during physical exercise using POLAR® S625X starts at 90 beats per minute, we determined resting metabolic rate using indirect calorimetry to determine total energy expenditure in 24 hours, with the energy expenditure during the recovery phase in addition to energy expenditure during the stages. The athlete was sitting at rest on the cycle ergometer while VO2 and VCO2 were continuously measured. VO2 and VCO2 were recorded for 5 minutes to calculate the oxidation rates of carbohydrate and fat. To estimate resting metabolic rate using the respiratory gases, oxidation rates of fat and carbohydrate were calculated using the stoichiometric equations of Frayn.14 Energy expenditure from oxidation of fats and carbohydrates was converted into kilocalories per minute by multiplying the oxidation rate of fat by 9.1 and the oxidation rate of carbohydrate by 4.2 using the Atwater general conversion factor.15 Resting metabolic rate was 1.72 kcal·min−1, resulting in an estimated daily energy expenditure of 2,480 kcal at rest. Before and after each stage, changes in anthropometric characteristics (ie, body mass, skinfold thicknesses and circumferences of the right foot and the right lower leg, and volume of the right foot), as well as hematological and urine measurements, were determined. The measurements were taken ~30 minutes before the start of the swim and again ~30 minutes after the arrival at the finish line. All measurements were performed by the same person. During and after each stage, food and fluid intakes, as well as urine output, were determined. Circumferences and skinfold thicknesses of the right foot and the right calf, as well as the volume of the right foot, were measured to record any swelling of the feet during the race. The thickness of the skinfold at the forefoot (ie, at the site of the “os cuneiforme intermedium”) and the lower leg (ie, one handbreadth above the “malleolus medialis”) was measured using a skinfold calliper (GPM skin-fold calliper; Siber and Hegner AG, Zurich, Switzerland) to the nearest 0.2 mm. The circumference of the limb at the forefoot (ie, at the site of the “os cuneiforme intermedium”) and the lower leg (ie, one handbreadth above the “malleolus medialis”) were measured using a nonelastic tape measure (KaWe CE; Kirchner und Wilhelm, Asperg, Germany) and recorded to the nearest 0.01 cm. The anatomical sites were marked with a waterproof pencil and the measurements were taken three times, and the mean of the three measurements was then recorded. Energy intake was estimated from all ingested food. The athlete prepared all his food on the day before the race and took prepackaged food with him. Nutrition during the race consisted mainly of commercial food, such as energy gels and energy bars, with a detailed description of their contents upon the packing. All the food consumed was continuously recorded, with the weight being taken using an electronic balance (SOEHNLE mara, Soehnle, Murrhadt, Germany), and the energy content was determined using a food table.16 Energy expenditure was estimated using the heart rate method. Heart rate was continuously monitored using the Polar® S625X, and energy expenditure was recorded. All drinks were provided by the support crew. All drinks and urine outputs were measured separately to the nearest 0.1 L using two different graduated jugs. The volume and the changes of the volume of the right foot were measured using the principle of Archimedes. A Plexiglas® vessel with internal dimensions of 386 mm length and 234 mm width was used. These dimensions were chosen so that any foot size of a man would fit in the vessel. Outside the vessel, a scale marked in millimeters was fixed on the front window, measuring changes in the level of water from the bottom to the top. The vessel was filled to the level of 100 mm with plain water. After immersion of the foot up to the “malleolus medialis”, the new water level was recorded to the nearest 1 mm. With the dimension of length (386 mm), width (234 mm), and height (ie, level of displaced water in millimeters), the volume of the foot was estimated. Following the principle of Archimedes, the volume of the displaced water is equal to the volume of the immersed foot. The reproducibility of the applied method of water displacement using the changes in height in millimeters was evaluated in a separate series of 20 consecutive measurements in one individual. The coefficient of variance was 1.9%, the mean height of displaced water was 12.0 mm, the 95% confidence interval was 11.8–12.1 mm, and the standard error was 0.05. Before and after each stage, bioelectrical impedance measurements were performed to estimate changes in body mass, fat-free mass, percentage body fat, and total body water using InBody 3.0 Body composition analyzer (InBody 3.0; Biospace, Seoul, Korea) with a direct segmental multifrequency bioelectrical impedance method following Bedogni et al.17 All measurements were performed after voiding of the urinary bladder. InBody 3.0 has a tetrapolar eight-point tactile electrode system and performs 20 impedance measurements at each session using four different frequencies (ie, 5 kHz, 50 kHz, 250 kHz, and 500 kHz) at each of the five segments (ie, right and left arms, trunk, and right and left legs). The skin and the electrodes were cleaned and dried before testing. The athlete stood barefoot in an upright position on the foot electrodes on the platform of the instrument, with the legs and thighs not touching and the arms not touching the torso. Four foot electrodes were used (ie, two oval-shaped electrodes and two heel-shaped electrodes) and the athlete was asked to grip the two palm-and-thumb electrodes (ie, two thumb and two palm electrodes). Before and after each stage, capillary blood samples of 80 μL were taken from the fingertip to determine sodium [Na+], potassium [K+], hematocrit, and levels of hemoglobin, creatinine, and urea using CHEM8+ with i-STAT (Abbott Laboratories, Abbott Park, IL, USA). At the same time, urine samples were collected and the urine specific gravity was determined using the Combur 10 Test® (Hoffman-La Roche Ltd, Basel, Switzerland). Data in the text are given as mean ± standard deviation (SD). The Shapiro–Wilk test was used to check whether the data were normally distributed. Any change in a variable over time was investigated using linear regression analyses. An association between two variables was investigated using correlation analyses with Pearson’s or Spearman’s correlation as appropriate. The difference between the pre- and the poststages measurements was investigated using paired t-test or Wilcoxon test as appropriate. Statistical analyses were performed using Analyse-it® Software Ltd (The Tannery, 91 Kirkstall Road, Leeds, LS3 1HS, UK). Significance was accepted at P<0.05 (two-sided for t-tests).
Performance
Among the 19 starters (ie, 17 men and two women), only six men (ie, 35.3% of all starters) finished the race. Among the nonfinishers, six triathletes stopped before the sixth day and seven triathletes stopped between the sixth and the ninth days. The subject finished the race as winner with an overall race time of 129:33 hours:minutes. His mean swimming, cycling, running, and overall race times across the 10 days were 1:06±0:01 hours:minutes, 6:14±0:25 hours:minutes, 5:06±0:16 hours:minutes, and 12:57±0:35 hours:minutes, respectively. Swimming (r2=0.11, P=0.34) and running (r2=0.02, P=0.71) split times remained unchanged, whereas cycling split times (r2=0.84, P=0.0002) and overall race times (r2=0.67, P=0.0040) increased over time (Figure 1). During Stage 2, the athlete started suffering from blisters at the feet while cycling in the rain. He had to change to a larger pair of cycling shoes. During Stage 5, the athlete had to change again to larger cycling shoes and also to larger running shoes.
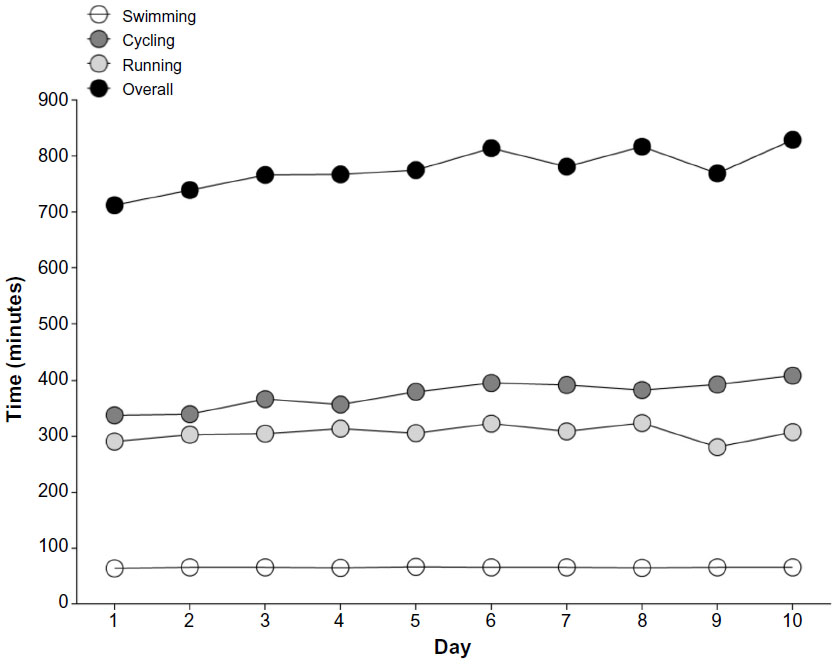 | Figure 1 Changes in split and overall race times across the 10 days. |
Changes during the event
Table 2 shows the anthropometric measurements; Table 3 shows the energy and fluid turnover, and Table 4 reports the results of the blood and urine analyses. Body mass and percentage body fat decreased in the mornings before the stages (Table 2). The decrease in percentage body fat was neither related to energy expenditure during the stages (r=−0.20, P=0.58) nor to energy deficit during the stages (r=0.33, P=0.34). Total body water increased in the pre- and poststage evaluations (Table 2). The increase in total body water was neither related to fluid intake (r=−0.33, P=0.34) nor to urine output (r=0.22, P=0.54) during the stages. During the ten stages, energy intake and energy expenditure decreased (Table 3). During rest periods (ie, during night), energy intake and energy expenditure remained unchanged across stages. Overall energy intake during the 10 days remained unchanged, but overall energy expenditure decreased. The resulting energy deficit remained unchanged over time. Fluid intake and urine output remained unchanged during the stages (Table 3). Mean fluid intake was 0.39±0.09 L/h while competing. During the nights between the stages, fluid intake remained unchanged, whereas urine output increased. Overall, fluid intake (8.38±1.39 L) was 4.35±1.73 L higher (P<0.0001) than urine output (4.03±1.47 L). Fluid intake was highest on day 8, whereas urine output was highest on day 3 (Table 3). During the ten stages, the volume of the foot increased (Table 2). The change in the foot volume was significantly and positively (r=0.78, P=0.0082) related to fluid intake during the stages (Figure 2). The change (Δ) in foot volume was not related to Δ total body water (r=0.30, P=0.40), Δ creatinine (r=0.15, P=0.68), and Δ urea (r=−0.03, P=0.93). However, the poststage volume of the foot was significantly and positively related to poststage total body water (r=0.68, P=0.029), poststage creatinine (r=0.77, P=0.0090), and poststage urea (r=0.92, P=0.0001) (Figure 2). Urine specific gravity increased after the stages (Table 4). Plasma [Na+] remained unchanged in the pre- and postrace evaluations and was never <135 mmol/L. Fluid intake during stages showed no association with poststage plasma [Na+] (r=0.25, P=0.48), as did fluid intake after the stages with prestage plasma [Na+] (r=0.23, P=0.52). Creatinine increased in the pre- and poststage measurements. Poststage creatinine was related to poststage total body water (r=0.97, P<0.0001). Hematocrit and hemoglobin were decreased in prestage measurements. Fluid intake during the stages was not related to Δ hematocrit (r=–0.23, P=0.51) but to Δ hemoglobin (r=0.68, P=0.031). Urea increased in the poststage test. The increase in poststage urea was related to poststage total body water (r=0.83, P=0.0029). Urine output during the stages was neither related to poststage creatinine (r=0.29, P=0.40) nor to poststage urea (r=0.35, P=0.32).
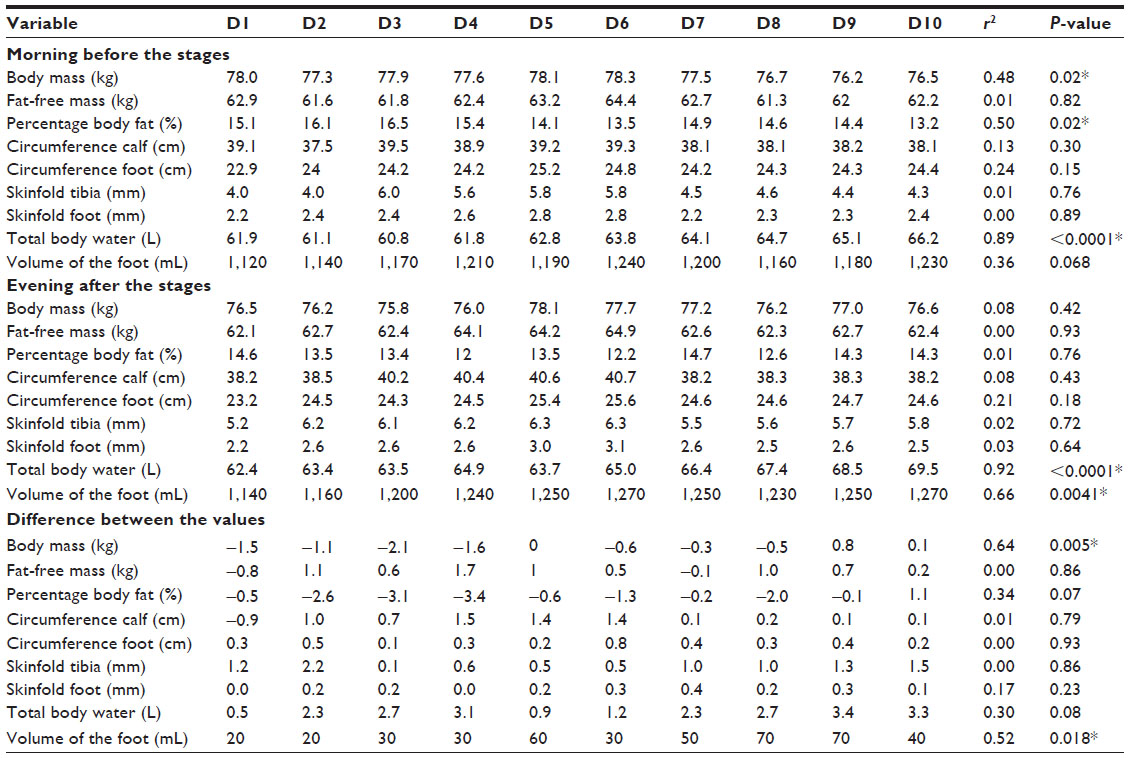 | Table 2 Changes in anthropometric characteristics in the morning before the stages, in the evening after the stages, and the difference between the values |
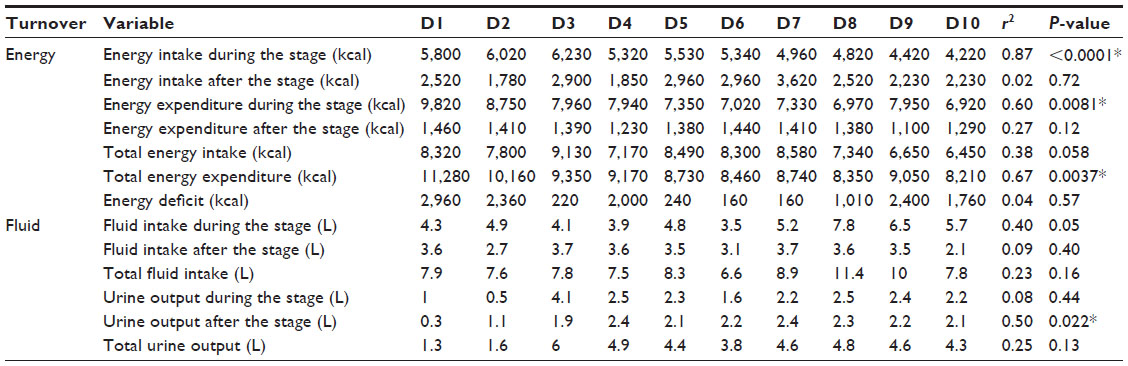 | Table 3 Changes in energy and fluid turnover during the ten stages |
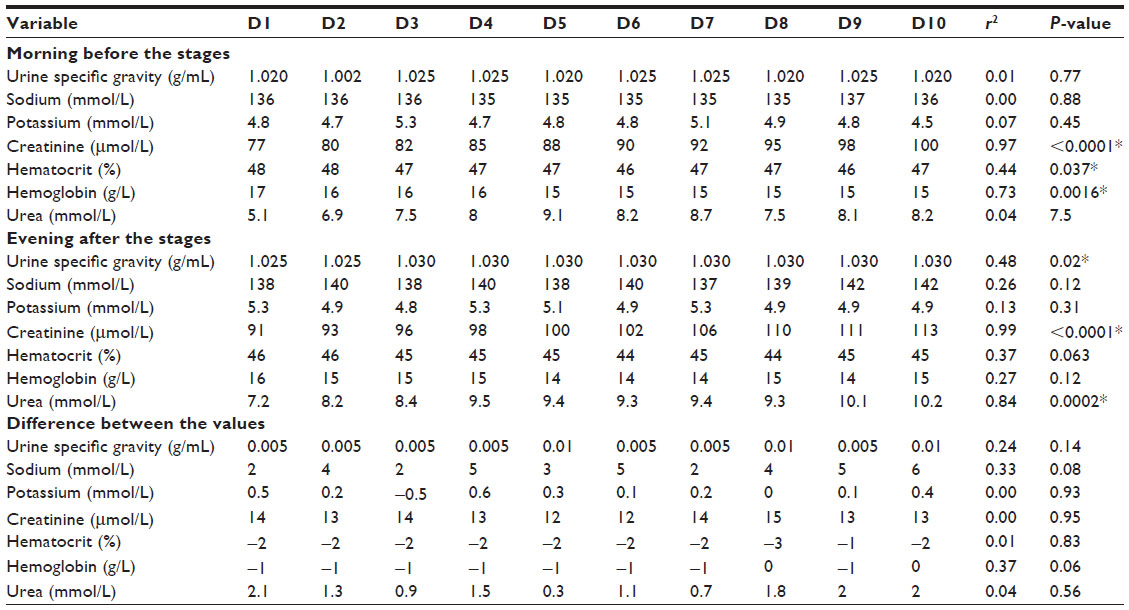 | Table 4 Changes in urine and blood parameters in the morning before the stages, in the evening after the stages, and the difference between the values |
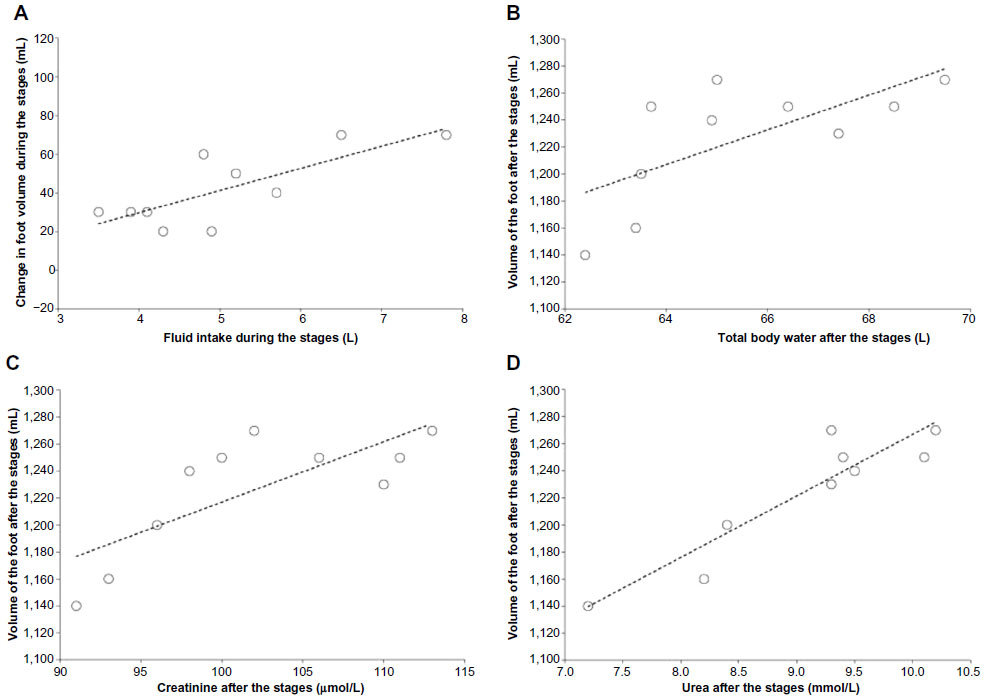 | Figure 2 Association between fluid intake and change in foot volume during the stages (A) and associations between volume of the foot at the end of the stages with total body water (B), creatinine (C), and urea (D) at the end of the stages. |
Discussion
The intention of this case study was to investigate a potential association between fluid intake and foot swelling in a multistage race such as a Deca Iron ultratriathlon with ten Ironman triathlons over a period of 10 days. We found an increase in foot volume and the increase in the foot volume was related to fluid intake during the stages. The volume of the foot after the stages was related to total body water, creatinine, and urea after the stages.
Similarly to the present multistage ultratriathlete, an increased fluid intake was associated with an increase in the volume of the extremities,1,2 especially at the lower limbs2 in 100 km ultramarathoners. However, disparate findings were reported for Ironman triathletes completing a single Ironman triathlon, wherein the volume of the lower leg decreased and the decrease was unrelated to fluid intake.12 The decrease in the volume of the lower leg in Ironman triathletes is most probably due to the depletion of energy-rich substrates in the muscles. A recent study using dual-energy X-ray absorptiometry and peripheral quantitative computed tomography in the investigation of male Ironman triathletes showed that calf muscle density was reduced by ~1.9% and the decrease was interpreted as a loss in lean mass due to glycogen loss.18
We assume that the athlete lost substantial mass of the lower limb and developed, at the same time, subcutaneous edema. The poststage volume of the foot was related to poststage total body water, poststage creatinine, and poststage urea. Most probably, the development of feet swelling was due to a combination of a high fluid intake and a progressive decline in renal function (ie, significant increase in creatinine during the race), leading to fluid retention. In an athlete competing in Triple Iron ultratriathlon (ie, 11.4 km swimming, 540 km cycling, and 126.6 km running), feet swelling occurred postrace parallel to an increase in total body water, a reduction in urine production, and an increase in blood urea.19 The authors assumed that the increased blood urea and the reduced urine production were due to an impairment of renal function immediately postrace due to skeletal muscle damage and manifestation in clinically visible edemas of the feet.19
A further interesting finding was that at no time did the athlete develop during the race an exercise-associated hyponatremia (EAH). In contrast, two of 25 multistage ultramarathoners competing in a 7-day multistage ultramarathon developed EAH.20 In those multistage ultramarathoners, hematocrit, hemoglobin, and plasma albumin decreased during the race, showing that these athletes progressively became diluted. Furthermore, in the present athlete, hematocrit and hemoglobin decreased during the 10 days. In 50 single-stage ultramarathoners competing in a 100 km ultramarathon, however, plasma [Na+] increased after the race and no subject developed EAH.21 The authors assumed that the subjects were highly experienced in ultraendurance due to their large prerace experience.21 A large previous experience might help to prevent excessive drinking and the subsequent development of EAH.22 Indeed, the present athlete had already successfully finished many ultratriathlons.
We found a continuous increase in total body water in this athlete. This increase in total body water seems typical for multistage Ironman triathletes. In a sample of 49 athletes competing in three editions of a Deca Iron ultratriathlon, a continuous increase in total body water was found.23 In a smaller sample of eight athletes competing in a Deca Iron ultratriathon, total body water increased in the first 3 days and then remained elevated for the remainder of the race.6
Practical applications
For athletes and coaches, a multistage ultraendurance race – such as a multistage ultratriathlon – leads to a continuous increase in foot swelling. The most likely reason for this increase is fluid intake during competing. To avoid problems due to the increase in foot volume, fluid restriction might be an appropriate strategy. Fluid restriction might also lead to body mass reduction, which might enhance ultraendurance performance.24
Conclusion
This case report of a multistage Ironman triathlete shows that the volume of the feet increased during the ten stages and that the increase in foot volume was significantly and positively related to fluid intake during the stages. The poststage volume of the foot was related to poststage total body water, poststage creatinine, and poststage urea. The continuous feet swelling during the race was most probably due to a combination of a high fluid intake and a progressive decline in renal function (ie, continuous increase in creatinine and urea), leading to body fluid retention (ie, increase in total body water).
Acknowledgments
We thank the support crew for their help. A special thanks goes to the race director for providing us all the split times.
Disclosure
The authors report no conflicts of interest in this work.
References
Bracher A, Knechtle B, Gnädinger M, et al. Fluid intake and changes in limb volumes in male ultra-marathoners: does fluid overload lead to peripheral oedema? Eur J Appl Physiol. 2012;112:991–1003. | |
Cejka C, Knechtle B, Knechtle P, Rüst CA, Rosemann T. An increased fluid intake leads to feet swelling in 100-km ultra-marathoners – an observational field study. J Int Soc Sports Nutr. 2012;9:11. | |
Freund W, Weber F, Billich C, Schuetz UH. The foot in multistage ultra-marathon runners: experience in a cohort study of 22 participants of the Trans Europe Footrace Project with mobile MRI. BMJ Open. 2012;2(3):pii:e001118. | |
Knechtle B, Wirth A, Knechtle P, Rosemann T. Increase of total body water with decrease of body mass while running 100 km nonstop – formation of edema? Res Q Exerc Sport. 2009;80:593–603. | |
Knechtle B, Duff B, Schulze I, Kohler G. A multi-stage ultra-endurance run over 1,200 km leads to a continuous accumulation of total body water. J Sports Sci Med. 2008;7:357–364. | |
Knechtle B, Salas Fraire O, Andonie JL, Kohler G. Effect of a multistage ultra-endurance triathlon on body composition: World Challenge Deca Iron Triathlon 2006. Br J Sports Med. 2008;42:121–125. | |
Fellmann N, Ritz P, Ribeyre J, Beaufrère B, Delaître M, Coudert J. Intracellular hyperhydration induced by a 7-day endurance race. Eur J Appl Physiol Occup Physiol. 1999;80:353–359. | |
Knechtle B, Morales NP, González ER, et al. Effect of a multistage ultraendurance triathlon on aldosterone, vasopressin, extracellular water and urine electrolytes. Scott Med J. 2012;57:26–32. | |
Knechtle B, Knechtle P, Andonie JL, Kohler G. Body composition, energy, and fluid turnover in a five-day multistage ultratriathlon: a case study. Res Sports Med. 2009;17:104–120. | |
Milledge JS, Bryson EI, Catley DM, et al. Sodium balance, fluid homeostasis and the renin-aldosteronsystem during the prolonged exercise of hill walking. Clin Sci (Lond). 1982;62:595–604. | |
Williams ES, Ward MP, Milledge JS, Withey WR, Older MW, Forsling ML. Effect of the exercise of seven consecutive days hill-walking on fluid homeostasis. Clin Sci. 1979;56:305–331. | |
Meyer M, Knechtle B, Bürge J, et al. Ad libitum fluid intake leads to no leg swelling in male Ironman triathletes – an observational field study. J Int Soc Sports Nutr. 2012;9:40. | |
Hiilloskorpi H, Pasenen M, Fogelholm M, Laukkanen R, Mänttäri AT. Use of heart rate to predict energy expenditure from low to high activity levels. Int J Sports Med. 2003;24:332–336. | |
Frayn KN. Calculation of substrate oxidation rates in vivo from gaseous exchange. J Appl Physiol. 1983;55:628–634. | |
Atwater WO. Coefficients of digestibility and availability of the nutrients of food. Proc Am Physiol Soc. 1909;30:14–19. | |
Kirchhoff E. Online-publication of the German food composition table “Souci- Fachmann-Kraut” on the Internet. J Food Compost Anal. 2002;15:465–472. | |
Bedogni G, Malavolti M, Severi S, et al. Accuracy of an eight-point tactile-electrode impedance method in the assessment of total body water. Eur J Clin Nutr. 2002;56:1143–1148. | |
Mueller SM, Anliker E, Knechtle P, Knechtle B, Toigo M. Changes in body composition in triathletes during an Ironman race. Eur J Appl Physiol. 2013;113:2343–2352. | |
Knechtle B, Vinzent T, Kirby S, Knechtle P, Rosemann T. The recovery phase following a Triple Iron triathlon. J Hum Kinet. 2009;21:65–74. | |
Knechtle B, Knechtle P, Rüst CA, et al. Regulation of electrolyte and fluid metabolism in multi-stage ultra-marathoners. Horm Metab Res. 2012;44:919–926. | |
Bürge J, Knechtle B, Knechtle P, Gnädinger M, Rüst CA, Rosemann T. Maintained serum sodium in male ultra-marathoners – the role of fluid intake, vasopressin, and aldosterone in fluid and electrolyte regulation. Horm Metab Res. 2011;43:646–652. | |
Winger JM, Hoffman MD, Hew-Butler TD, et al. The effect of physiology and hydration beliefs on race behavior and postrace sodium in 161-km ultramarathon finishers. Int J Sports Physiol Perform. 2013;8:536–541. | |
Herbst L, Knechtle B, Lopez CL, et al. Pacing strategy and change in body composition during a Deca Iron Triathlon. Chin J Physiol. 2011;54:255–263. | |
Knechtle B, Knechtle P, Wirth A, Alexander Rüst C, Rosemann T. A faster running speed is associated with a greater body weight loss in 100-km ultra-marathoners. J Sports Sci. 2012;30:1131–1140. |
 © 2015 The Author(s). This work is published and licensed by Dove Medical Press Limited. The full terms of this license are available at https://www.dovepress.com/terms.php and incorporate the Creative Commons Attribution - Non Commercial (unported, v3.0) License.
By accessing the work you hereby accept the Terms. Non-commercial uses of the work are permitted without any further permission from Dove Medical Press Limited, provided the work is properly attributed. For permission for commercial use of this work, please see paragraphs 4.2 and 5 of our Terms.
© 2015 The Author(s). This work is published and licensed by Dove Medical Press Limited. The full terms of this license are available at https://www.dovepress.com/terms.php and incorporate the Creative Commons Attribution - Non Commercial (unported, v3.0) License.
By accessing the work you hereby accept the Terms. Non-commercial uses of the work are permitted without any further permission from Dove Medical Press Limited, provided the work is properly attributed. For permission for commercial use of this work, please see paragraphs 4.2 and 5 of our Terms.