Back to Journals » International Journal of Nanomedicine » Volume 15
Fe3O4 Magnetic Nanoparticles Under Static Magnetic Field Improve Osteogenesis via RUNX-2 and Inhibit Osteoclastogenesis by the Induction of Apoptosis
Authors Marycz K, Sobierajska P ![]() , Wiglusz RJ
, Wiglusz RJ ![]() , Idczak R
, Idczak R ![]() , Nedelec JM
, Nedelec JM ![]() , Fal A
, Fal A ![]() , Kornicka-Garbowska K
, Kornicka-Garbowska K ![]()
Received 2 April 2020
Accepted for publication 8 September 2020
Published 14 December 2020 Volume 2020:15 Pages 10127—10148
DOI https://doi.org/10.2147/IJN.S256542
Checked for plagiarism Yes
Review by Single anonymous peer review
Peer reviewer comments 3
Editor who approved publication: Prof. Dr. Anderson Oliveira Lobo
Krzysztof Marycz, 1– 3 Paulina Sobierajska, 4 Rafał J Wiglusz, 4 Rafał Idczak, 5 Jean-Marie Nedelec, 6 Andrzej Fal, 2 Katarzyna Kornicka-Garbowska 1, 3
1The Department of Experimental Biology, University of Environmental and Life Sciences Wroclaw, Wroclaw 50-375, Poland; 2Collegium Medicum, Cardinal Stefan Wyszynski University in Warsaw, Warsaw 01-938, Poland; 3International Institute of Translational Medicine, Malin 55-114, Poland; 4Institute of Low Temperature and Structure Research, Polish Academy of Sciences, Wroclaw 50-422, Poland; 5Centre for Advanced Materials and Smart Structures, Polish Academy of Sciences, Wroclaw 50-950, Poland; 6CNRS, SIGMA Clermont, ICCF, Université Clermont Auvergne, Clermont-Ferrand, France
Correspondence: Krzysztof Marycz
The Department of Experimental Biology, University of Environmental and Life Sciences Wroclaw, Norwida 27B, Wrocław 50-375, Poland
Tel +48 71 320 5201
Email [email protected]
Purpose: The presented study aimed to investigate the effects of Fe 3O 4 nanoparticles and static magnetic field on osteoblast and osteoclasts’ metabolic activity.
Methods: Magnetic nanoparticles were prepared by a wet chemical co-precipitation process and analyzed using X-ray powder diffraction, high-resolution transmission electron microscope (HRTEM), dynamic light scattering (DLS), laser Doppler velocimetry, Raman and the Mössbauer spectroscopy. In vitro experiments were performed using MC3T3, 4B12 and RAW 264.7 cell lines. Cells were cultured in the presence of nanoparticles and with or without exposure to the magnetic field. Proteins were investigated with Western blotting and immunofluorescence and Western blot. Gene expression was analyzed with a quantitative real-time polymerase chain reaction.
Results: Obtained particles were in the nano-range (average size around 50 nm) and had a spherical-like morphology. The typical hydrodynamic size was in the range 178– 202 nm and Zeta potential equaled – 9.51 mV. Mössbauer spectrum corresponds to the Fe+3 ions in tetrahedral (A) and Fe+3 and Fe+2 ions in octahedral (B) sites of Fe 3O 4. In vitro study revealed cytocompatibility and anti-inflammatory effects of fabricated nanoparticles. Furthermore, it was shown that nanoparticles combined with magnetic field exposure enhance osteogenic differentiation of MC3T3 cells by upregulation of RUNX-2 activity. Under the same experimental condition, nanoparticles and magnetic field decreased osteoclastogenesis of 4B12 by the induction of apoptosis through the mitochondrial-dependent pathway.
Conclusion: Fe 3O 4 nanoparticles together with magnetic field can be applied for the fabrication of novel biomaterials for the treatment of bone disorders related to bone loss in which a balance between bone-forming and resorbing cells is disturbed.
Keywords: magnetite, osteoblasts, osteoclasts, magnetic field
Introduction
Nanotechnology and regenerative medicine have become the fastest developing fields of medical sciences, providing multiple solutions for various medical applications.1 With the rapid aging of populations, especially in well-developed countries, there is an increased requirement for effective therapies to improve bone fracture regeneration.2 According to the Food and Drug Administration (FDA), over 200 million people have osteoporosis (OP), and the incidence rate increases with age while worldwide, there are approximately 9 million fractures per year as a result of OP.3 For that reason, OP has become not only a serious medical issue but also a financial burden for the health systems of world economies.
In the course of OP, the advantage of bone catabolism over anabolism is observed, which leads to bone mass lowering and finally increased incidents of bone fractures.4 Furthermore, the molecular perturbations leading to osteoporosis are also associated with delayed fracture healing and impaired bone regeneration.5 Progressive bone degradation in OP is thought to result from the overactivity of osteoclasts together with the reduced metabolic activity of osteoblasts. Increased activity of osteoclasts leads to excessive secretion of proteases including metalloproteinases (MMPs), cathepsin K (catK), and a broad range of cytokines which reduces osteoblast metabolic activity. CatK together with MMPs is considered as a key player in the process of bone resorption.6 The differentiation process of osteoclasts which plays a fundamental role in the disses progression is mediated by receptor activator of nuclear factor kappa B ligand (RANKL), macrophage colony-stimulating factor (M-CSF) and tumor necrosis factor α (Tnf-a).6 In OP, progressive bone resorption is augmented due to reduced osteoblasts’ metabolic activity7 as they lose the ability to produce extracellular matrix. The osteoblasts differentiation process is regulated by specific genes set and corresponding protein synthesis during proliferation, extracellular matrix maturation, and mineralization.8 The most important factor that modulates the expression of bone matrix proteins which are common for actively proliferating osteoblast is the Runt-related transcription factor (RUNX-2). Its overexpression lead for increased bone mass and bone matrix production, while its silencing lead to loosening of bone mass.9 Bone mass is directly associated with osteoblast maturation and the formation of the bone matrix from regularly and densely packed collagen fibrils and high mineralization. Furthermore, a caspase-3 and BAX are responsible for the apoptotic activity observed in many cell lines, including osteoblasts, which reduced their activity and interferes synthesis of the bone extracellular matrix.10 This, in consequence, affects the reduction of bone biomechanical properties and finally leads to reduced bone mass and increases bone fracture incidents. Although the molecular mechanisms underlying OP-related bone destruction are still not fully understood, it is proposed that targeting osteoblast activity with simultaneous reduction of osteoclast as well as cytokines and metalloproteinases activity seems to be a fully justified strategy.
Recently, intensive development of nanotechnology brought a range of innovative nano-sized materials, including nanoparticles which are characterized by superior physical and chemical properties due to their quantum size and surface effect.11 The nanosized scale combined with magnetic properties allows the biomaterials to modulate biological processes on the cellular level, which in consequence improves the healing of damaged tissue. Recently, Fe3O4 magnetic nanoparticles (MNPs) have been intensively investigated because of their superparamagnetic properties and biocompatibility.12 It was previously demonstrated by many Authors, that magnetic field (MF) even alone, modulates multiple biological processes including enhanced osteoblasts’ viability or differentiation potential as well as promotes synthesis and secretion of various growth factors promoting bone regeneration including bone morphogenetic protein 2 (BMP-2), fibroblast growth factors (FGF) or vascular endothelial growth factors (VEGF).13–17
In this work, we fabricated the nano-sized Fe3O4 MNPs and investigated their influence on osteoblasts, osteoclasts, and macrophages in the presence and absence of MF exposition. Next, we investigated the expression of genes involved in osteoblasts as well as osteoclasts differentiation and metabolism. Moreover, the immunomodulatory effect of MNP under normal and MF conditions has been investigated.
Materials and Methods
All of the reagents used in the study were purchased from Sigma-Aldrich (USA) unless indicated otherwise.
Preparation of Magnetic Nanoparticles (MNPs)
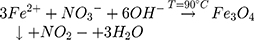
All of the magnetic nanoparticles were prepared by a wet chemical co-precipitation process. A typical preparation procedure, for magnetite (Fe3O4) nanoparticles, involved the usage of hot alkaline water solution of KOH (≥85%, for analysis, Avantor Performance Materials Poland S.A., Polska) and KNO3 (≥99% ACS, ACROS Organics, USA) that were added dropwise into a water solution of FeSO4·7 H2O (99.5%, for analysis, ACROS Organics, USA). Next, the solution was constantly stirred at 90 °C for 10 min. After the completion of the reaction, the black precipitate of the magnetite was formed and separated from the suspension. Then, the precipitate was washed with deionized water to remove the by-products as well as to obtain neutral pH and dried at 90 °C. The red-ox reaction can be written as follows:
Physicochemical Characterization
Structural properties of the obtained material were verified employing X-ray powder diffraction (XRPD) measurements in a 2θ range of 15°–100° with X’Pert Pro PANalytical X-ray diffractometer (Cu Kα1: λ = 1.54060 Å, U = 40 kV, I = 30 mA). The structural refinement was performed by the Maud 2.93 software and using a better approximation as well as indexing of the Crystallographic Information File (CIF). Primary particle size and morphology were investigated using a high-resolution transmission electron microscope (HRTEM) Philips CM20 SuperTwin operating in 200 kV with a resolution 0.25 nm. Samples were prepared by dispersion of powders in methanol and the suspension was deposited on a copper microscope grid covered with perforated carbon. Whereas, the typical hydrodynamic size of the nanoparticles was determined by Dynamic Light Scattering (DLS) method with a Zetasizer Nano ZS apparatus from Malvern Instruments operating under He-Ne 633 nm laser and equipped with the Dispersion Technology Software. For measurements of zeta potential, a combination of electrophoresis and Laser Doppler velocimetry was used. Each measurement was repeated three times with fixed concentrations of particles. Raman measurements were carried out with a Micro-Raman system Renishaw inVia equipped with a Leica DM 2500 M microscope and a CCD camera as the detector. An 830 nm diode laser was used as the excitation source.
Magnetic measurements were performed using a Quantum Design Physical Property Measurement System (PPMS) with a vibrating sample magnetometer (VSM) option at 2 K between 100 and 1000 Oe applied magnetic field (MF). The obtained material was compacted into disc-shaped samples and crushed into small pieces to avoid displacements under experimental conditions.
The Mössbauer spectroscopy (MS) was used to determine the phase composition of the prepared sample. The room-temperature 57Fe Mössbauer spectrum was recorded in transmission geometry with a conventional constant-acceleration spectrometer, using a 57Co-in-Rh standard source with a full width at half maximum (FWHM) of 0.24 mm/s. The obtained spectrum was analyzed employing a least-squares fitting procedure to determine Mössbauer parameters such as hyperfine magnetic field (B), isomer shift (IS), quadrupole splitting/shift (QS), relative spectral areas (C) and spectral linewidths (Γ) which are related to different chemical states of the Mössbauer 57Fe probes. All isomer shifts in this paper are given relative to α-iron.
Cell Culture
Undifferentiated MC3T3 (purchased from ATCC) cells were grown in MEM-alpha (Gibco, A10490-01) with 10% fetal bovine serum (FBS). For differentiation, the medium was changed to MEM-alpha with 10% FBS, 50 ug/mL L-ascorbic acid (A5960), and 10 mM B-glycerophosphate disodium salt hydrate (G9422). Medium for undifferentiated 4B12 consisted of MEM-alpha (Gibco, 12,561–056), 30% calvaria-derived stromal cell conditioned media (CSCM) and 10% FBS.18 To induce differentiation of 4B12 cells were maintained in culture media (as described above) with 1.5 ng/mL M-CSF form mouse (SRP3221) and 1.5 ng/mL Recombinant Mouse TRANCE/RANK L/TNFSF11 (R&D Systems, 462-TEC). RAW 264.7 (purchased from ATCC) were cultured in DMEM with 4500 mg/L glucose with 10% fetal bovine serum (FBS). The medium was refreshed every 2–3 days. Cells were passaged when reach 80% confluence using recombinant cell-dissociation enzyme StableCell Trypsin.
Preparation of MNPs for in vitro Experiments
To perform the experiments, IOs were sonicated in the ultrasonic bath for 1 hr, diluted 1:1 in DMEM/F12 medium, and treated with poly-l-lysine (10% v/v). After a 2-hrs incubation on plate roller, the solution was centrifuged (12,000xg for 10 mins), the supernatant was discarded while remaining IOs were re-suspended in DMEM/F12 at the initial volume and filtered through 0.22µm syringe filter. MNPs concentrations equalled: I - 18.16 ug/mL, II - 90.8 ug/mL.
Experimental Setting
Cells were exposed to a magnetic field using the system designed at the Institute of Low Temperature and Structure Research Polish Academy of Science in Wroclaw as described previously.19 The MF strength equaled 0.2 T. The cell culture plate (127.89 × 85.6 × 19.69 mm) was placed between magnets and installed in a CO2 incubator.
Undifferentiated MC3T3 cells were seeded onto 24-well plates and maintained in MEM-alpha (Gibco, A10490-01) with 10% FBS. When cells reached 80% confluence culture media was exchanged differentiation medium. On the 18th day of differentiation IOs were added to the medium and cells were exposed to MF for 15 mins daily for 4 days.
4B12 cells were seeded onto 24-well plates and maintained in the differentiation medium. On the 11th day of differentiation, IOs were added to the medium, and cells were exposed to MF for 15 mins daily for 4 days.
RAW 264.7 at a density of 5x10⁵ cells/mL were seeded onto wells of a 24-well plate. Next, lipopolysaccharide (LPS, 1 μg/mL) and IOs were added to the culture media for another 6 hrs. After 6 hrs LPS was removed from the culture medium while IOs remained. The same and following day cells were exposed to MF for 15 mins.
Assessment of Cell’s Morphology
MC3T3 were visualized after 22nd day of differentiation while for 4B12 15th day of differentiation. Detailed morphology of cells was assessed using scanning electron microscopy (SEM, EVO LS15, Zeiss). The procedure of sample preparation was performed as described previously.20 Samples were sprinkled with gold and (ScanCoat 6, UK) and analyzed with SE1 detector at 1 kV of filament tension. Calcium and phosphorus concentration was assessed with SEM with energy dispersive X-ray analysis (SEM/EDX). The quantax detector (Brüker) with 10 kV of filament tension was applied to perform a line scan analysis of randomly selected cells. The obtained values were presented as weight percentage (wt%).
F-actin filaments were stained with the Phalloidin Atto 590 solution in accordance with manufacturer protocol. Nuclei were counterstained with 4′,6-diamidino-2-phenylindole (DAPI). Staining was performed after the 15th day of the experiment for 4B12 and after day 2 for RAW 264.7. Cells were visualized using Leica TCS confocal microscope. After the 22nd day of differentiation, cells were stained with Alizarin Red to visualize calcium deposits. Prior to that, specimens were fixed with 4% paraformaldehyde (PFA), washed, and then 10% dye solution was applied to cells. Dye was also collected for spectrophotometric measurements (Epoch, Biotek).
Evaluation of Apoptosis
Live and dead cells in culture were visualized with Calcein AM (3 μM) and propidium iodide (2.5 μM) staining. Specimens were incubated with dye solution for 30 mins at 37°C and captured with an epifluorescence microscope (Axio Observer A.1). Images were acquired using a PowerShot camera (Canon). Apoptosis was also evaluated with Muse® Annexin V and Dead Cell Assay Kit (Merck) following manufacturer’ instructions using Muse™ Cell Analyzer.
Immunofluorescence
Cells were fixed with 4% PFA and permeabilized with 0.2% Tween 20 in phosphate-buffered saline (PBS) for 15 mins. Cells were incubated with proper antibodies and 10% goat serum at 4°C overnight. Following antibodies and their dilution were applied COL1A-1 1:50, RUNX-2 1:50, Cathepsin K 1:50, TRAP 1:50, and osteopontin (OPN) 1:1000 (supplier and catalog numbers are shown in Table 2). Atto-590-conjugated secondary antibodies were applied to detect the signal. Nuclei were counterstained with DAPI. Cells were observed and imaged using a confocal microscope (Leica TCS) and analyzed with Image J software.21
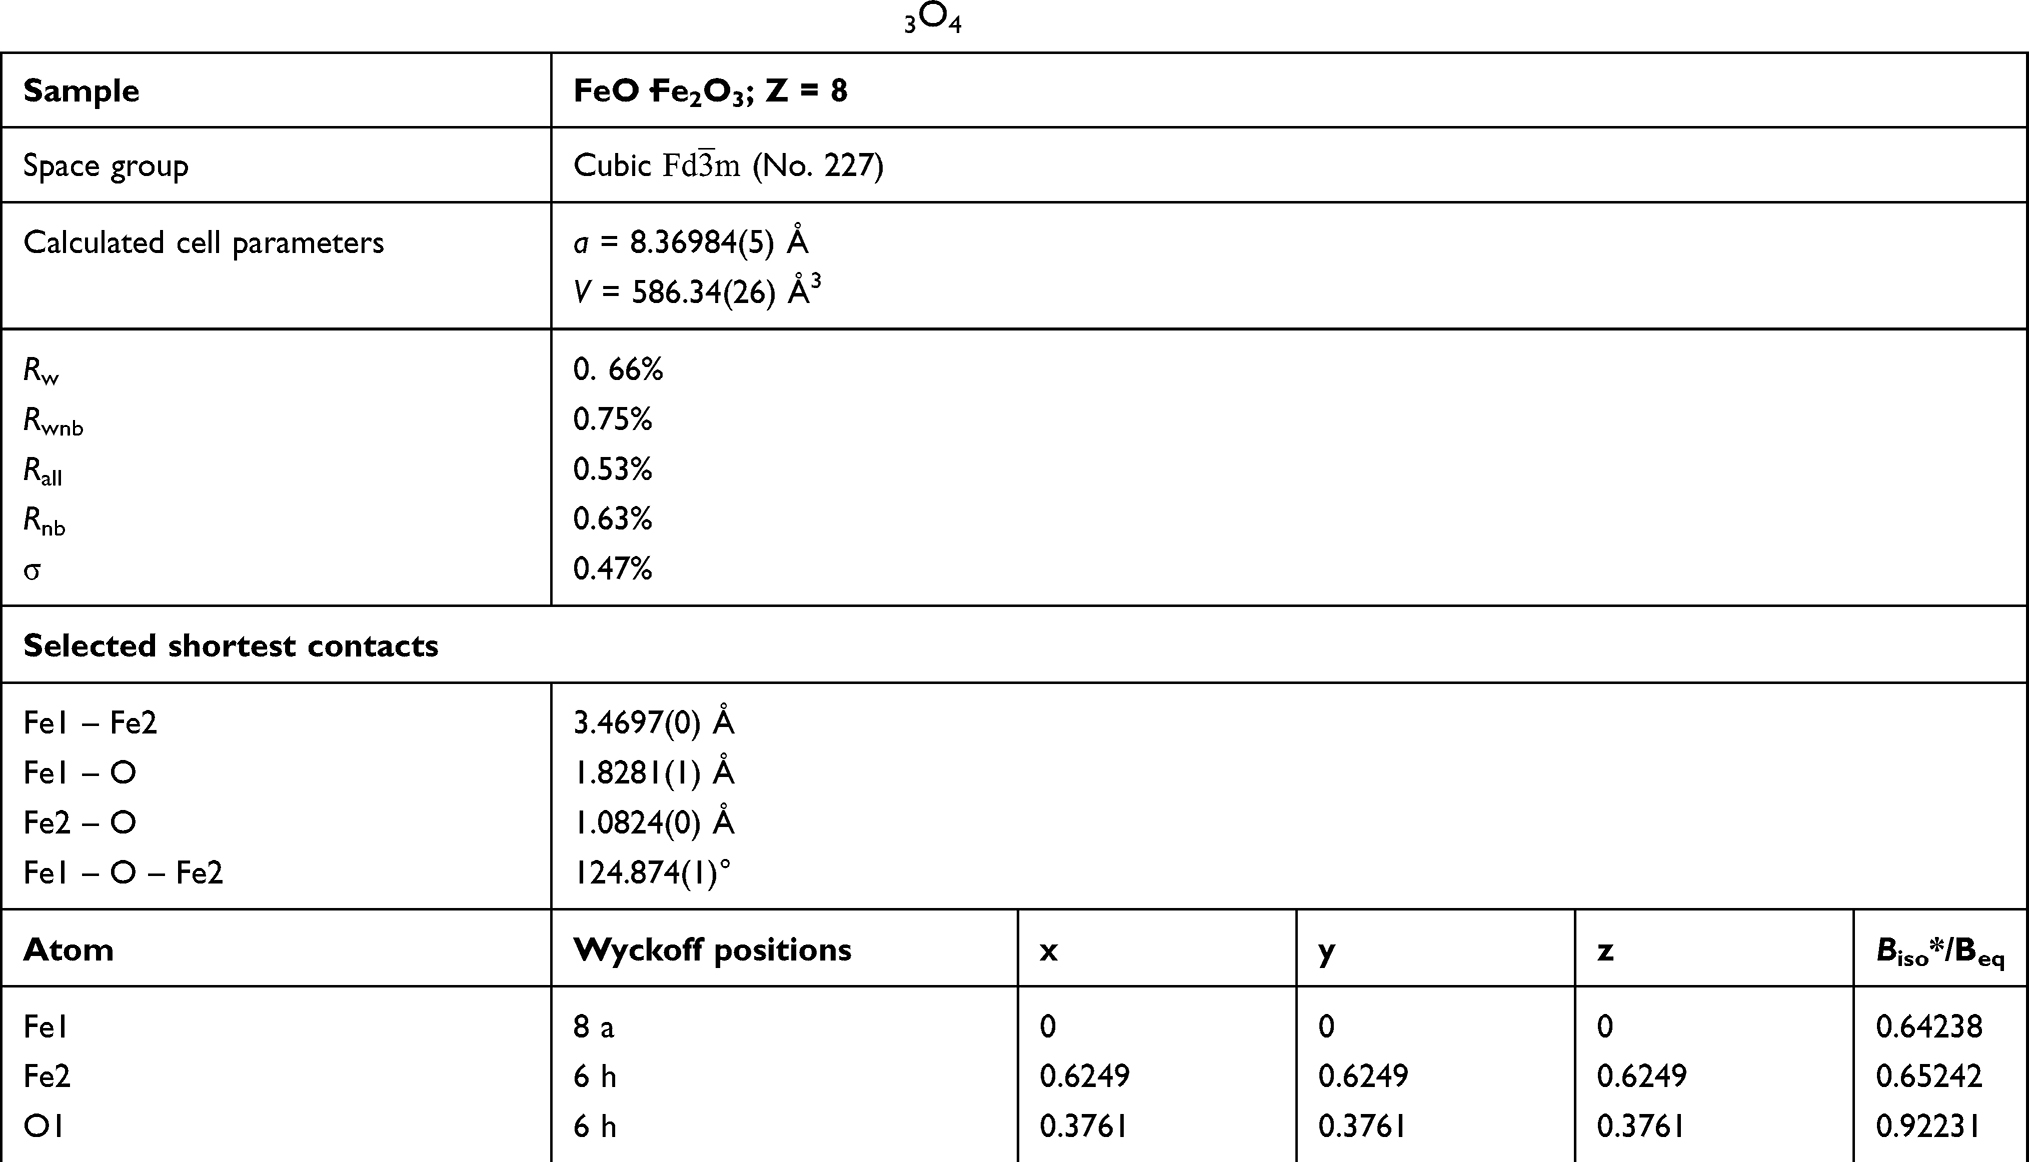 |
Table 1 Atomic Parameters of the Obtained Magnetite Fe3O4 |
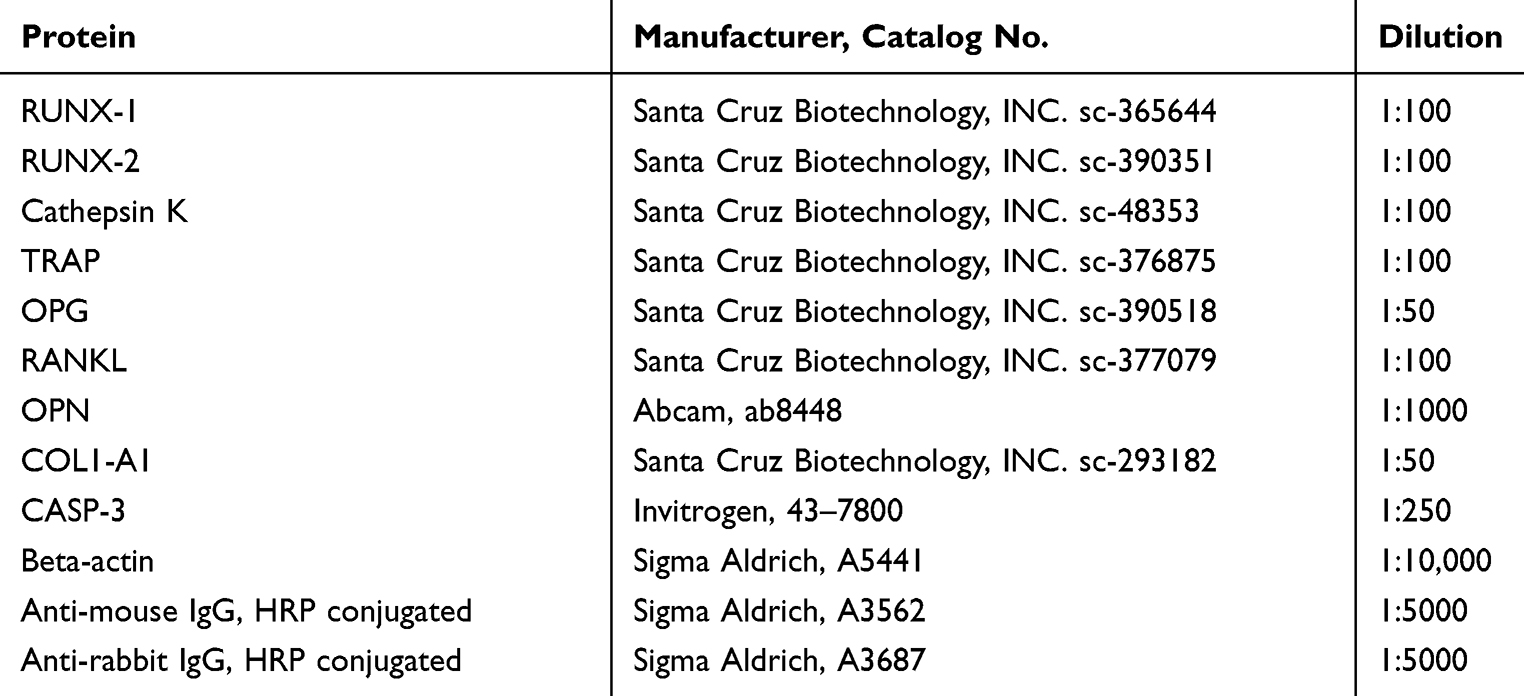 |
Table 2 Antibodies and Their Dilutions |
Western Blotting
After the last day of the experiment (22nd day for MC3T3, 15th for 4B12), cells were homogenized in RIPA buffer with protease inhibitor cocktail. After centrifugation (20 min at 14,000×g, 4°C) supernatants were collected and stored at −80°C. Protein concentration was estimated with Pierce™ BCA Protein Assay Kit (Life Technologies, USA). Samples were subjected to SDS-polyacrylamide gel electrophoresis at 100 V for 90 min using Mini-PROTEAN Tetra Vertical Electrophoresis Cell (Bio-Rad, USA). Proteins were transferred onto polyvinylidene difluoride (PVDF) membranes (Bio-Rad, USA) using a Mini Trans-Blot ® Cell (Bio-Rad, USA) at 100 V for 1 h at 4°C. For blocking, 5% non-fat milk in TBST was applied. Samples were incubated overnight with primary antibodies. Next, membranes were incubated with secondary HRP-conjugated antibodies (dilution 1:5000 in TBST for 2 hrs). Antibodies and their dilutions are shown in Table 2. Signals were detected using Chemiluminescent/Fluorescent Substrate Kit (Vector Laboratories, Inc. SK-6604) with ChemiDoc MP Imaging System (Bio-Rad, USA) and quantified with Image Lab Software (Bio-Rad, USA).
Quantitative Real-Time Polymerase Chain Reaction (qRT-PCR)
Total RNA was extracted from cells using phenol-chloroform method.22 The quantity and quality of RNA were measured spectrophotometer (Epoch, Biotek). One hundred and fifty nanograms of RNA were used for cDNA synthesis using RevertAidFirst Strand cDNA Synthesis Kit (Thermo Fisher Scientific, USA) following by gDNA digestion with DNase I RNase-free Kit (Thermo Fisher Scientific, USA). qRT-PCR was performed as described previously23 using CFX ConnectTM Real‐Time PCR Detection System (Bio‐Rad). The average fold change in the gene expression was calculated by the 2 −ΔΔCT method using GAPDH as the housekeeping gene.24 The sequences of the primers are shown in Table 3.
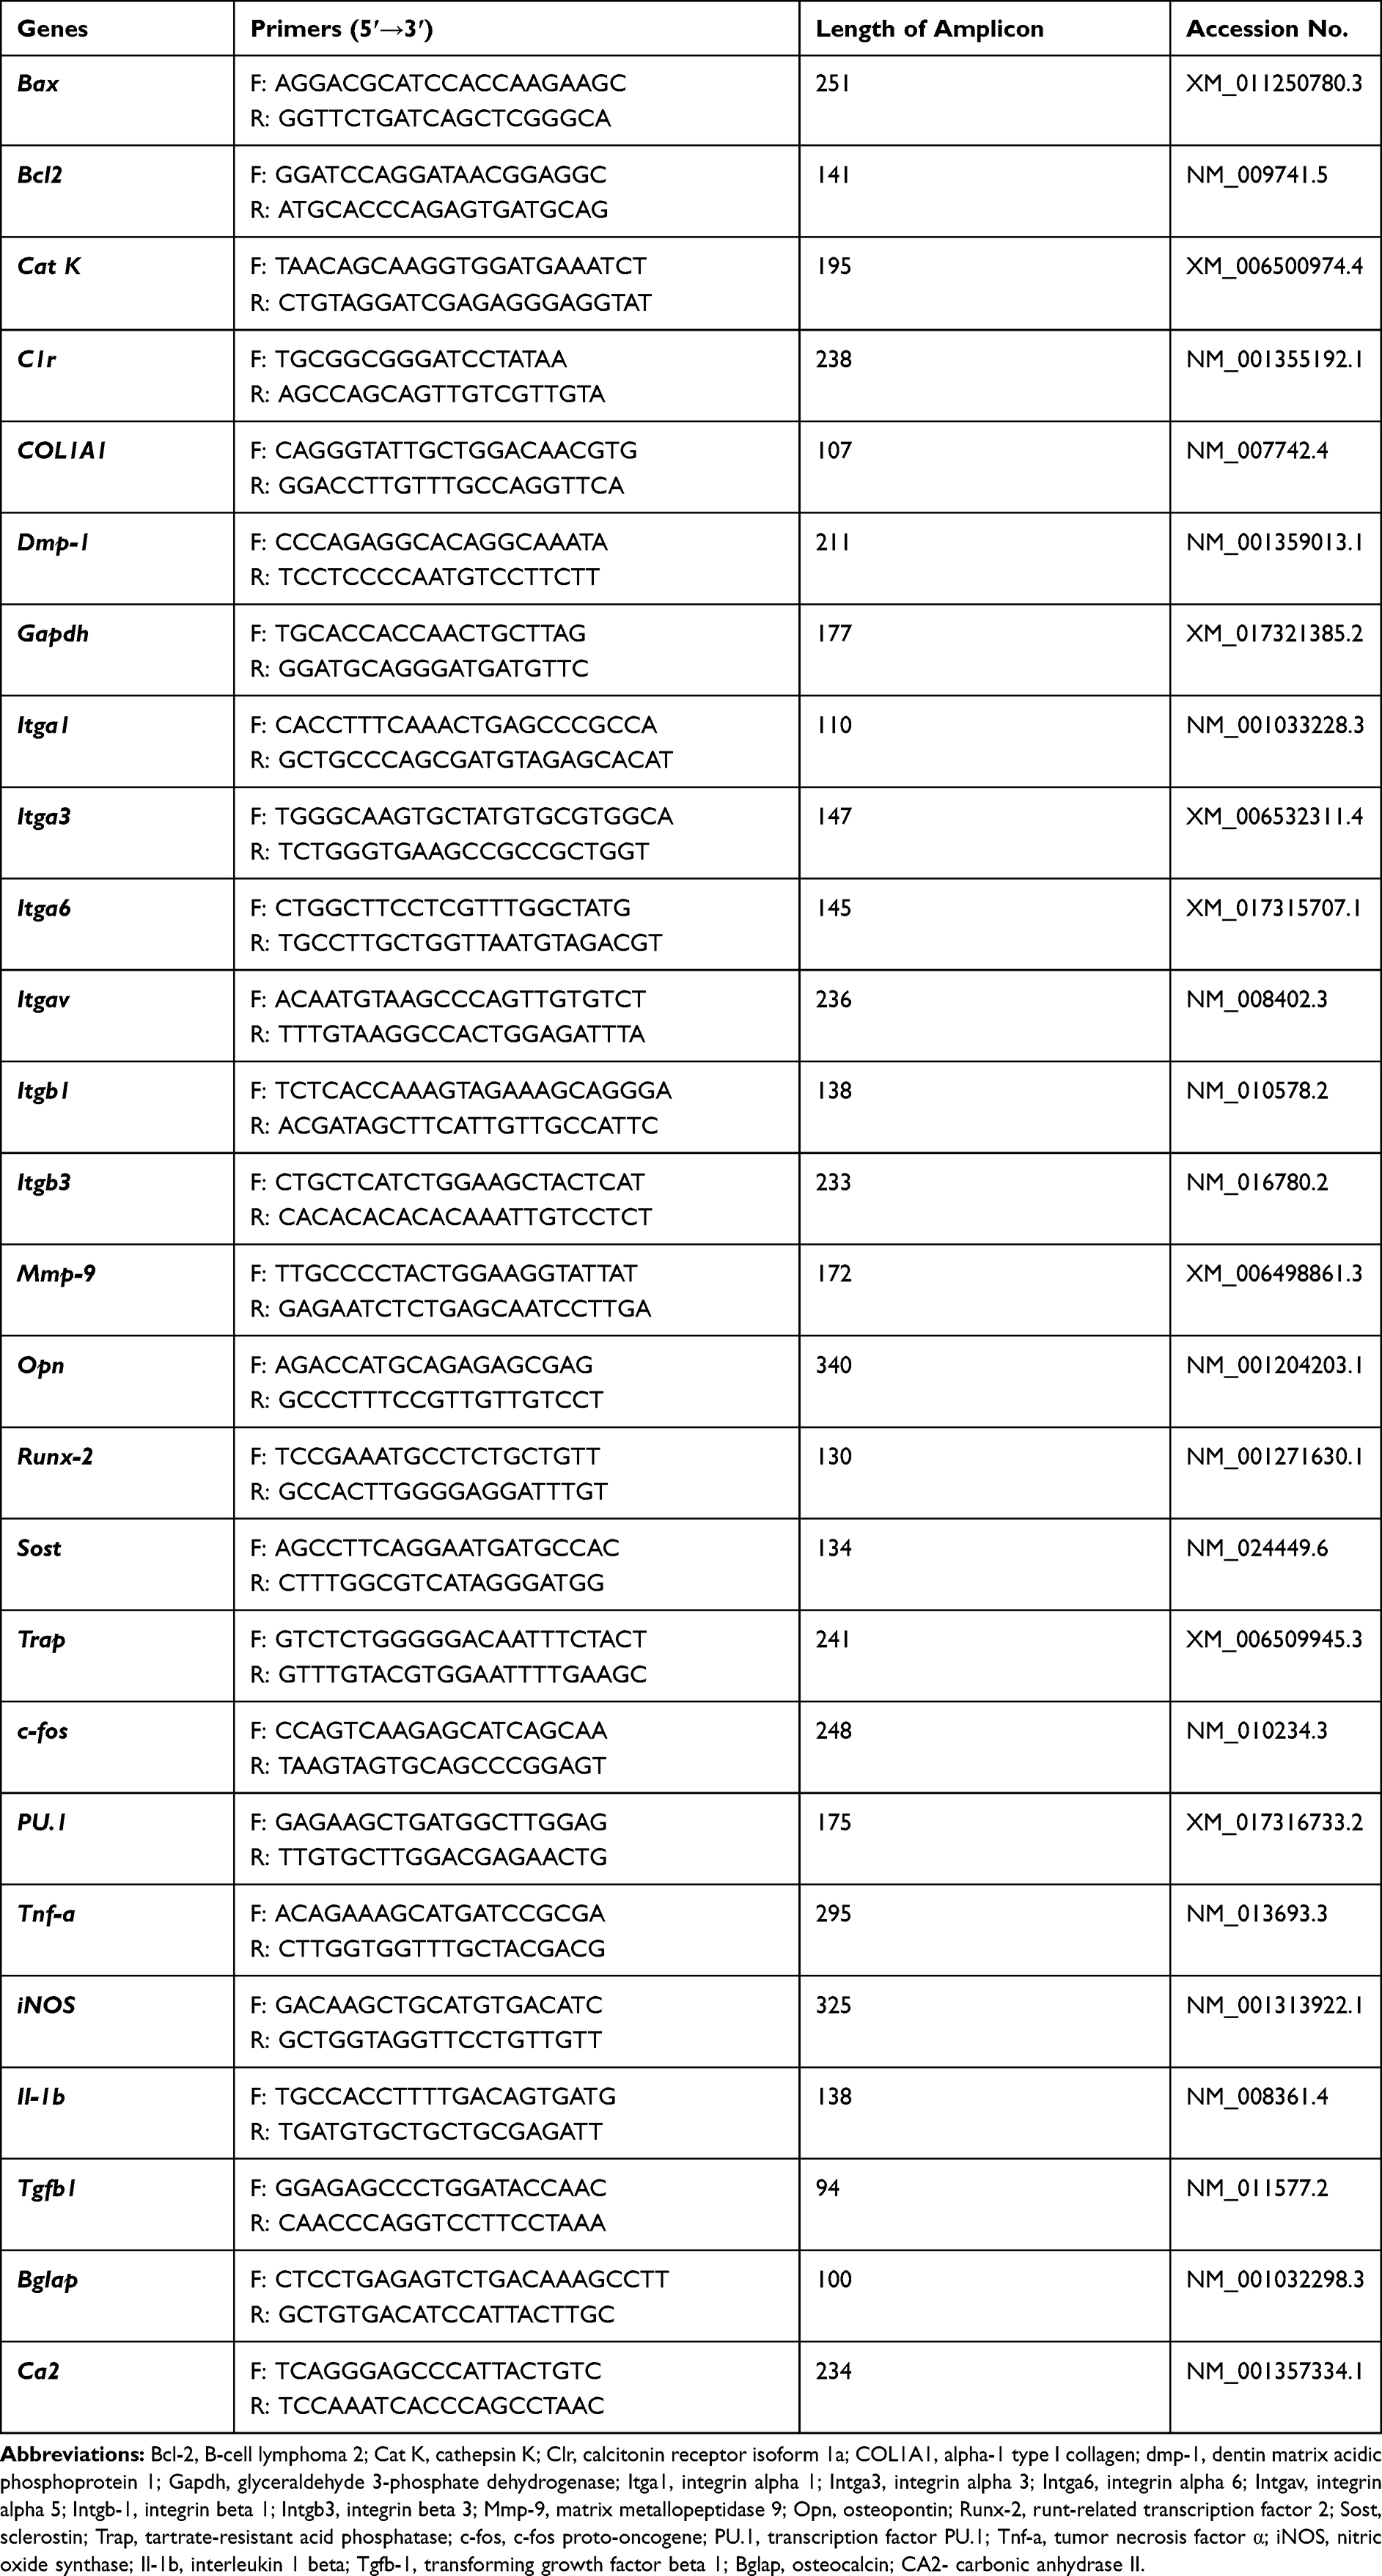 |
Table 3 List of Primers Used in qRT-PCR |
Statistics
All experiments were performed at least in three replicates. Statistical analysis was performed using the one‐way ANOVA with Tukey’s test in GraphPad Prism Software (La Jolla, CA, USA). Differences with the probability of P < 0.05 were considered significant. Statistical significance is indicated as an asterisk (*) when comparing the between corresponding MF- and MF+ groups, and a number sign (#) when comparing to CTRL MF-.
Results
Physicochemical Characterization of MNPs
Magnetite (Fe3O4) has a cubic inverse spinel structure and crystallizes in Fd3 ̅m space group.25,26 The presence of non-equivalent cations in two valence states (Fe2+ and Fe3+) in the unit cell of magnetite leads to its unique magnetic properties. Iron ions form the tetrahedral occupied by Fe3+ ions. Whereas, octahedron position is substituted by eight Fe2+ and eight Fe3+ ions, as shown in Figure 1. The unit cell contains 32 O2− ions in a close-packed (face-centered cubic) FCC structure along [110] direction.
 |
Figure 1 Projection of the magnetite (FeO·Fe2O3) unit cell with the indication of coordination polyhedra. |
The structure of obtained MNPs was investigated based on diffraction peaks analysis. The resulted pattern was in good agreement with the reference sample (Fe3O4 – ICSD 158,585). The cell parameters of the final product were calculated using Rietveld refinement in the isotropic approach. The difference in the intensity scale in the line (YObs − YCalc) is close to zero and thus indicates a good correlation between the observed XRPD pattern and the theoretical one (Figure 2). No additional secondary phases, impurities, or amorphous forms were detected, confirming the formation of the designated phase. The quality of structural refinement was also checked by R values and the results are gathered in Table 1. The crystallite size of the studied material was estimated to be 95.21 nm.
 |
Figure 2 XRD patterns (black lines) and results of the Rietveld analysis (red – fitted diffraction; blue – differential patterns, column – reference phase peak position) of the Fe3O4 nanoparticles. |
TEM images confirmed that obtained particles are in the nano-range (average size around 50 nm) and have a spherical-like morphology (Figure 3). Moreover, the SAED image shows well-developed spotty ring patterns revealing the well-crystallized material. The size distribution profile of the magnetite particles was also provided in water suspension. As it is shown in Figure 3, the typical hydrodynamic size of the studied MNPs was in the range 178–202 nm, and their Zeta potential equaled –9.51 mV.
 |
Figure 3 TEM and SAED images (above), hydrodynamic size and Zeta potential distribution (below) of the Fe3O4. |
For further characterization of the MNPs structure, the Raman analysis was performed. Laser Raman spectroscopy constitutes a powerful tool for the investigation of Fe2+ iron oxidation.27,28
It is visible in Figure 4 that the structure of the magnetite has changed with the increase in laser power excitation. Firstly, for 0.9 mW the bands at 300 cm−1, 380 cm−1, 484 cm−1 and 662 cm−1 are observed. The spectrum recorded with 2.4 mW shows broadened bands around 350 cm−1, 500 cm−1, and 700 cm−1, indicated the oxidation of magnetite and the appearance of new iron oxide phase – maghemite (γ-Fe2O3).29 The development of an additional peak at about 700 cm−1 confirms the first stage of magnetite oxidation (red line). The laser power at 4.3 mW caused an appearance of characteristic for hematite band at about 300 cm−1 along with peaks belonged to maghemite, explain the metastability of maghemite structure (blue line). Significant changes in Raman spectra were observed after using higher laser power (15.0 mW). The transformation of γ form to the thermodynamically more stable α form – hematite (α-Fe2O3) was detected. The most characteristic peaks for hematite appeared at about 222 cm−1, 300 cm−1, 400 cm−1and 606 cm−1.30
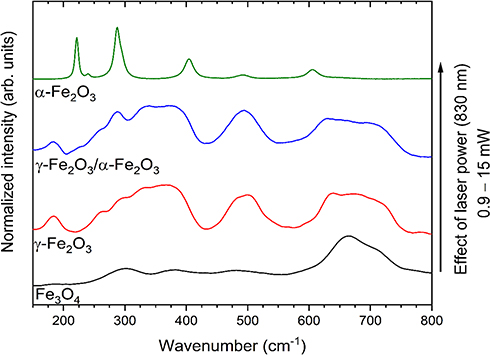 |
Figure 4 Raman spectra of Fe3O3 (magnetite), γ-Fe2O3 (maghemite) or both phases and α-Fe2O3 (hematite). Effect of laser power on oxidation and phase transformation of iron oxides. |
To further characterize the obtained MNPs, their magnetic properties were determined. Figure 5 shows half hysteresis loop of the ferromagnetic Fe3O4 nanoparticles. The saturation magnetization (Ms) of the Fe3O4 nanoparticles was found to be 70 emu/g.
 |
Figure 5 Magnetic field variation of the magnetization in the Fe3O4. Magnetic separation of the Fe3O4 nanoparticles water dispersion (inside). |
Iron oxides can be identified using Mössbauer spectroscopy. Figure 6 shows the room-temperature 57Fe Mössbauer spectrum of the nanocomposite Fe3O4. The fitting was made using three magnetic six-line patterns (sextets). Two sextets with BA = 49.5(2) T, ISA = 0.33(3) mm/s, QSA = −0.002(5) mm/s, ΓA = 0.38(2) mm/s and BB = 45.5(2) T, ISB = 0.58(4) mm/s, QSB = −0.02(1) mm/s, ΓB = 0.39(3) mm/s correspond to the Fe+3 ions in tetrahedral (A) and Fe+3 and Fe+2 ions in octahedral (B) sites of Fe3O431,32. Both sextets have broad lines, reflecting the small average grain size of Fe3O4 nanoparticles. This finding is in agreement with the XRD results which indicate that the crystallite size of the studied material is close to 95 nm. The intensity ratio CA/CB of the sextets in magnetite is known to be a very sensitive measure of the stoichiometry of Fe3−δO4. In the case of the studied nanocomposite, assuming the same Lamb-Mössbauer factor for both components,33 the CA/CB ratio is equal to 5.7. Therefore, based on the calculation method presented in work,34 CA/CB = 5.7 corresponds to the nonstoichiometric magnetite with the chemical formula Fe2.73O4. Finally, the third magnetic component in measured spectrum is described by sextet with B = 36.9(2) T, IS = 0.40(3) mm/s, QS = −0.26(2) mm/s, Γ = 0.38(2) mm/s and C = 15.6(5) % (see green component in Figure 6). The determined Mössbauer parameters suggest that this component may correspond to α-FeOOH34 which could be formed during the sample preparation procedure. However, this explanation is not supported by XRD results, according to which, no additional secondary phases, impurities, or amorphous forms were detected. Therefore, the third sextet is attributed to the Fe ions located in the surface region of the studied nanoparticles. According to previous research,37–39 the B values on iron nuclei in the surface region of nanoparticles are significantly decreased. At the same time, the observed quadrupole splitting (QS = −0.26 (2) mm/s) can be explained assuming that the iron atoms located in the surface region are immersed in a non-zero electric field gradient which is an effect on the broken cubic symmetry.
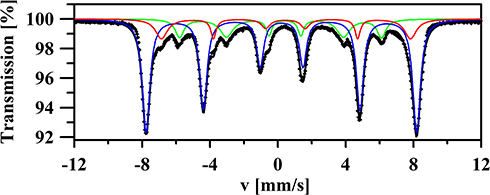 |
Figure 6 The room-temperature 57Fe Mössbauer spectrum of the nanocomposite Fe3O4 fitted using three sextets which correspond to the iron atoms located in the bulk (blue and red components) and in the surface region (green component) of the Fe3O4 nanoparticles. |
Fe3O4 and MF are Not Able to Activate Macrophages
The effects of manufactured Fe3O4 on RAW 264.7 cells are shown in Figure 7A. To assess whether Fe3O4 and MF affect macrophages’ morphology, f-actin was stained with phalloidin. Untreated, control cells presented spherical shape and smooth surface while cells treated with LPS displayed characteristic features of activated macrophages including a robust amount of filopodia. MF alone was not capable of inducing macrophage activation. Fabricated Fe3O4 nanoparticles were shown to be fully biocompatible as no alteration in the morphology of RAW 264.7 was observed either under MF or without exposure. We also investigated macrophage activation using qRT-PCR. As expected, LPS treatment resulted in increased expression of Tnf-a (Figure 7B) and treatment of cells with Fe3O4, and MF did not cause the enhancement of its expression in comparison to LPS untreated cells. A similar phenomenon was observed in the expression of iNOS (Figure 7C). Interestingly, the treatment of cells with MF only resulted in decreased expression of Tgfb1 in control and LPS treated cells (Figure 7D). Cells treated with MF and its combination with Fe3O4 were characterized by decreased Tgfb1 expression in comparison to LPS untreated cells.
 |
Figure 7 Biocompatibility of fabricated nanoparticles. Morphology of macrophages in investigated groups was investigated using f-actin staining (A). Furthermore, expression of Tnf-a (B), iNOS (C) and Tgfb1 (D) were tested in RAW 264.7 with qRT-PCR. Results expressed as mean ± SD. Statistical significance indicated as an asterisk (*) when comparing the results between corresponding bars representing MF- and MF+ groups, and a number sign (#) when comparing to LPS MF-. *p < 0.05; ###, ***p< 0.001. |
Evaluation of Inflammation Rate in the Co-Culture of RAW 264.7 with MC3T3 and 4B12
In the next step, we investigated whether cells in the presence of Fe3O4 nanoparticles can diminish LPS triggered inflammation. For that reason, we performed a co-culture of RAW 264.7 with MC3T3 or 4B12. Next, macrophages were subjected to gene expression analysis with qRT-PCR. The expression of TNF-a in both co-cultures was reduced in comparison to LPS treated macrophages (Figure 8A). A similar trend was noted in the expression of iNOS, however it is worth noting that in MC3T3 the reduction of iNOS expression was amplified by the application of MF. In the case of 4B12, the application of MF resulted in the enhancement of iNOS expression (Figure 8B). mRNA levels of Il-1b were diminished in both co-cultures, however in MC3T3 group, application of MF decreased its expression while in 4B12 enhanced (Figure 8C).
 |
Figure 8 Fe3O4 and MF reduce inflammation in co-culture of macrophages with osteoclasts and osteoblasts. qRT-PCR was performed to analyze the expression of Tnf-a (A), iNOS (B) and Il-1b (C) in RAW 254.7 after co-culture. Results expressed as mean ± SD. Statistical significance indicated as an asterisk (*) when comparing the results between corresponding bars representing MF- and MF+ groups, and a number sign (#) when comparing to LPS MF-. ##, **p < 0.01; ###, ***p< 0.001. |
Fe3O4 and MF Increase the Formation of Mineralized Matrix
On the last day of the differentiation process, cells were visualized using SEM and EDX mapping (Figure 9A) which allowed assessing the amount of Ca, P, and Fe. Furthermore, data were quantified and presented as Ca and P atomic weight percentages (Figure 9B). The ratio of Ca to P was significantly enhanced after the exposition of cells to MF and Fe3O4 (Figure 9C). To visualize calcium deposits, cells were stained with Alizarin Red and representative photographs are shown in Figure 9D. To quantify the results, after incubation with cells, the dye was collected and spectrophotometrically measured. Obtained data indicated an increased calcium accumulation in cells treated simultaneously with Fe3O4 and MF (Figure 9E).
 |
Figure 9 Magnetite enhances the formation of an extracellular mineralized matrix. SEM images of cultured cells (A) and their elemental analysis performed with EDX (B and C). Based on EDX data, Calcium deposits were also visualized with Alizarin Red stainings (D) and quantified by spectrophotometrical measurement (E). Results expressed as mean ± SD. Statistical significance indicated as an asterisk (*) when comparing the results between corresponding bars representing MF- and MF+ groups, and a number sign (#) when comparing to CTRL MF-. *,#p<0.05, ##p < 0.01; ###, ***p< 0.001. |
Fe3O4 and MF Increase Osteogenic Differentiation
To further investigate how Fe3O4 and MF influence osteogenic differentiation, on its lasts day cells were stained with RUNX-2 and COL1A-1 antibodies (Figure 10A). Obtained data were further supported with quantitative analysis – Western blot and qRT-PCR. The amount of RUNX-2 was significantly increased in Fe3O4 groups in comparison to untreated cells, and in concentration I, the effect was strengthened by the application of MF (Figure 10B). Similar results were obtained when analyzing mRNA levels of RUNX-2, as its highest expression was noted in Fe3O4 I MF+ (Figure 10C). As indicated by Western blot, the amount of COL1A-1 was comparable between groups (Figure 10D). However, its mRNA levels differ significantly, and its highest expression was observed in the Fe3O4 I MF+ group (Figure 10E). The expression of Bglap was increased in the groups treated with MF and Fe3O4. The greatest levels of Bglap mRNA were found in the Fe3O4 II MF+ group (Figure 10F). Simultaneous treatment of cells with Fe3O4 and MF resulted in enhanced expression of DMP1, and its highest level was observed in the Fe3O4 I MF+ group (Figure 10G). On the contrary, the expression of Sost was comparable between the groups, reaching significantly increased value only in the Fe3O4 II MF+ group (Figure 10H).
 |
Figure 10 Magnetite and MF enhance osteogenic differentiation. Representative photographs from RUNX-2 and COL1A-1 staining (A). Results were quantified by performing Western blot (B) and qRT-PCR (C) for RUNX-2. Evaluation of the COL1A-1 amount was supported by Western blot (D) and qRT-PCR analysis (E). Additionally, osteoblasts marker genes Bglap (F), DMP1 (G) and Sosts (H) was investigated with qRT-PCR. Results expressed as mean ± SD. Statistical significance indicated as an asterisk (*) when comparing the results between corresponding bars representing MF- and MF+ groups, and a number sign (#) when comparing to CTRL MF-. #p<0.05, **, ###, ***p< 0.001. |
Fe3O4 and MF Modulate Osteopontin and Integrins Expression
Considering that the OPN plays a major role in the regulation of osteogenic differentiation, we investigated its levels in cells after the 18th day of differentiation. Immunofluorescence staining indicated that OPN levels are increased after exposure (Figure 11A). Our data showed that 66 kDa OPN isoform is increased in CTRL MF+ and Fe3O4 I MF+ groups (Figure 11B). A similar phenomenon was observed for 32 kDa isoform (Figure 11C). Representative Western blot bands are shown in Figure 11D. Interestingly, OPN expression was enhanced in the control group treated only with MF and in cells treated simultaneously with iron oxide nanoparticles and MF (Figure 11E). Next, RT-qPCR analysis was employed to measure mRNA levels of selected integrins are they were shown to be modulated by OPN. No differences between the investigated groups were found in Itga1 expression (Figure 11F). When compared with the control group, the mRNA levels of Itga3 were significantly increased after Fe3O4 and MF treatment (Figure 11G). Itga5 mRNA levels were also significantly up-regulated in cells treated only with MF and Fe3O4 II groups when compared with the corresponding control group (Figure 11H). The highest expression of Itga6 was found in cells treated with Fe3O4 II in the presence and absence of MF (Figure 11I). Itgb1 mRNA level was upregulated in the Fe3O4 I MF+ group when compared with the control group (Figure 11J).
 |
Figure 11 Osteopontin-integrin correlation. As osteopontin interacts with selected integrins, we have investigated whether Fe3O4 and MF modulates the levels of both. Representative photographs of immunofluorescent OPN staining (A) were supported by quantitative data from Western blot regarding 66 kDa (B) and 32 kDa (C) OPN isoforms (representative bands shown at “D”). Furthermore, expression of OPN was examined with qRT-PCR (E). Obtained results revealed that Fe3O4 and MF increase OPN levels in cells. qRT-PCR was performed to analyze the kinetics of Itga1 (F), Itga3 (G), Itga5 (H), Itga6 (I) and Itgb1 (J) expression. Results expressed as mean ± SD. Statistical significance indicated as an asterisk (*) when comparing the results between corresponding bars representing MF- and MF+ groups, and a number sign (#) when comparing to CTRL MF-. *,#p<0.05; **, ##p < 0.01; ###, ***p< 0.001. |
Fe3O4 and MF Induce Apoptosis of Osteoclasts
Cells in the control group, without the exposure to MF, exhibited typical osteoclasts-like morphology including the formation of cellular processes connecting the osteoclasts to the surface and neighboring cells. Interestingly, in all remaining groups treated with Fe3O4 or MF, and with a combination of these factors, cellular morphology drastically changed. Cells become, smaller in size, round with a reduced number of filopodia. To further investigate the apoptosis in cell culture, Western blot for Casp-3 was performed (Figure 12A). Interestingly, an increased amount of that protein was found in cells treated with Fe3O4 and MF. In addition, the ratio of Bax:Bcl-2 indicated on apoptosis activation in cells treated with Fe3O4 and MF alone and in the combination of these factors (Figure 12B). To investigate the cell’s viability Calcein AM/Propidium Iodide staining was performed (Figure 12C). To support the results with more quantitative data, cells were stained with the Muse® Annexin V & Dead Cell Kit which allows for the quantitative analysis of viable, early, late apoptosis and cell death (Figure 12D). This assessment showed that the number of live cells was significantly decreased in all of the groups besides the control cells (Figure 12E). No differences were observed in the number of early apoptotic cells (Figure 12F), while late apoptotic/dead cell number was increased in all investigated groups when compared with the corresponding control group (Figure 12G). No statistically significant differences were noted in the dead cell number (Figure 12H).
 |
Figure 12 Fe3O4 and MF induce apoptosis of osteoclasts. The amount of pro-apoptotic CASP-3 was elevated in cells treated with Fe3O4 in the presence of MF (A). The Bax:Bcl-2 ratio indicates on the apoptosis activation in cells treated with Fe3O4 and MF (B). Representative photographs from Calcein AM/Propidium Iodide staining (C) and MUSE analysis (D). Results of Muse® Annexin V & Dead Cell assay: number of live (E), early apoptotic (F), late apoptotic/dead (G) and dead cells (H). Results expressed as mean ± SD. Statistical significance indicated as an asterisk (*) when comparing the results between corresponding bars representing MF- and MF+ groups, and a number sign (#) when comparing to CTRL MF-. *,#p<0.05; ###, ***p< 0.001. |
Fe3O4 and MF Reduce Osteoclast Activity
To observe whether Fe3O4 and MF induce changes in osteoclasts, their effect on the amount of intracellular TRAP and Cathepsin K was investigated with immunofluorescence staining (Figure 13A). Obtained photographs revealed decreased fluorescence intensity in cells treated with the combination of Fe3O4 and MF. Next, using Western blot we analyzed the levels of another master regulator of osteoclasts activity – RANKL (Figure 13B). Its amount was significantly reduced in all investigated groups while compared to control cells (Fe3O4 and MF untreated). Using Western blot we also quantified Cathepsin K levels in cells (Figure 13C). Similar, to RANKL its levels were diminished in cells treated with Fe3O4, MF, and a combination of these factors. The same phenomenon was noted in the case of RUNX-1 levels (Figure 13D). Together, these findings suggest that Fe3O4 and MF inhibit osteoclast activity.
 |
Figure 13 Fe3O4 and MF reduce osteoclast activity. Representative photographs from immunofluorescence staining of TRAP and Cathepsin K (A) indicate their decreased levels in cells after the application of Fe3O4 and MF. Western blots for RANKL (B), Cathepsin K (C) and RUNX-1 (D) further confirmed that Fe3O4 and MF inhibit osteoclasts activity. Results expressed as mean ± SD. Statistical significance indicated as an asterisk (*) when comparing the results between corresponding bars representing MF- and MF+ groups, and a number sign (#) when comparing to CTRL MF-. #p<0.05; **,##p<0.01; ### < 0.001. |
In the next step, we investigated the kinetics of the expression of osteoclasts marker genes. As shown in Figure 14A–C, expression of Mmp9, Ca2 and CatK were significantly downregulated in cells treated with Fe3O4 and Fe3O4 combined with MF+. A similar phenomenon was found in the mRNA levels of Clr (Figure 14D), Trap (Figure 14E), c-Fos (Figure 14F) and PU.1 (Figure 14G); however, expression of these genes was upregulated in cells treated only with MF when compared to control, untreated counterparts. Additionally, we investigated the expression of Inta5 (Figure 14H) and Intgb3 (Figure 14I). Treatment of cells only with MF resulted in the upregulation of their expression; however, the application of Fe3O4 and Fe3O4 in the combination with MF+ significantly downregulated mRNA levels of these genes.
 |
Figure 14 Fe3O4 and MF reduce the expression of master regulators of osteoclasts activity. The following genes were investigated: Mmmp9 (A), Ca2 (B), CatK (C), Clr (D), Trap (E), c-fos (F) and PU.1 (G). Additionally, expression of Itga5 (H) and Itgb3 (I) was assessed as well. Results expressed as mean ± SD. Statistical significance indicated as an asterisk (*) when comparing the results between corresponding bars representing MF- and MF+ groups, and a number sign (#) when comparing to CTRL MF-. *,#p<0.05; **,##p<0.01; ***,### < 0.001. |
Discussion
Due to progressive aging and increased prevalence of osteoporosis, bone fractures have become one of the most common causes of hospitalization in elderly patients. Because of the advantage of catabolic over anabolic processes, bones are loosening their biomechanical properties, which in consequence lead to bone fractures.7 On the molecular level, it was demonstrated, that reduced activity of osteoblast combined with overactivity of osteoclasts is the main factor promoting osteoporosis (OP) development.4 Hence, searching for effective methods, that promote osteoblasts activity simultaneously with silencing osteoclast differentiation to develop a new therapeutic strategy, seems to be fully justified.
The typical hydrodynamic size of the studied MNPs was in the range 178–202 nm and their Zeta potential equaled –9.51 mV. Zeta potential is a useful tool in the study of surface interaction (protein corona, cell adhesion) and cellular uptake of nanoparticles.35 The obtained value of Zeta potential indicates insufficient dispersion stability. This is much less than the absolute value of 30 mV, which is generally recognized for stable colloids.36 Nevertheless, stability strongly depends on particle size, shape, and concentration. Thus, in the case of tested material, it could be required to use specific stabilized agents, that would avoid particle agglomeration. In the case of nanoparticle systems, magnetism is strongly size-dependent due to the particle shape and surface effects. Distortions located into the crystal lattice of the small objects can be a reason that nanoparticles could reveal distinctly different properties in comparison with their bulk forms. Therefore, the magnetic measurements can be used not only to determine the type of magnetic ordering but also to identify possible interaction effects between nanoparticles. The saturation magnetization (Ms) of the Fe3O4 nanoparticles was found to be 70 emu/g. The value of Ms depends on the size of the particles – magnetic behavior is very sensitive to their size changes, which is well-documented in the literature 32.33. In the case of studied MNPs, the obtained value of Ms is one of the highest described.34,37–39
Besides enhanced osteoclastogenesis, chronic bone inflammation becomes an important factor that induces bone turnover, leading to osteoporosis development.40 Numerous proinflammatory cytokines have been implicated in the regulation of osteoblasts and osteoclasts activity, and the advantage of proinflammatory over anti-inflammatory profile has been hypothesized as an important risk factor.41 Pro-osteoclastic cytokines, such as interleukin 1 (IL-1), interleukin 6 (IL-6), or tumor necrosis factor α (Tnf-a) is elevated in the course of various bone-related diseases including osteoporosis.41 Here, we showed that MNPs together with MF possess an immunomodulatory effect since we found that macrophages stimulated by LPS secreted a decreased amount of proinflammatory cytokines including TNF-α and IL-1. Interestingly, a similar effect was observed in LPS stimulated macrophages in co-culture with osteoblasts as well as osteoclasts. We found, the incorporation of MNPs significantly suppresses the production of proinflammatory cytokines when compared to control; however, no significant effect regards Tgfb1 was noted. It might suggest that MNPs due to their anti-inflammatory activity can inhibit bone resorption.
The present study showed that MNPs induce osteogenic differentiation potential in MC3T3 osteoblasts and reduce the viability of osteoclasts cultured under magnetic field condition. Moreover, the co-culture of osteoblasts with macrophages stimulated with LPS indicated on immunomodulatory effect of MNPs, shedding a promising light on their potential application in osteoporotic fracture bone regeneration. We first demonstrated that MNPs under MF exposure enhance the formation of the extracellular mineralized matrix (ECM) as well as promotes their calcification. SEM-EDX study supported those findings since the highest accumulation and deposition of calcium have been found in osteoblast treated with MNPs under MF condition. Moreover, the greatest in size “osteogenic nodules” were observed in osteoblasts cultivated with MNPs and exposed to MF. The observed effect was strongly correlated with increased expression of both RUNX-2 and COL-1A – the master regulators of osteogenesis. Obtained results indicate the bilateral effect of MNPs promoting ECM formation as well as its mineralization. Recently, Peng and colleges showed that MNPs activate RUNX-2 mRNA expression and modulate osteoblasts differentiation and promote fracture bone healing.42 In the presented research, we demonstrated, that MNPs modulate the expression of osteocalcin (Bglap2) and dentin matrix protein 1 (DMP1) axis which are tandem genes involved in new bone formation and calcification. At the same time, the enhanced expression of osteopontin on mRNA as well as protein level was observed in osteoblasts cultivated together with MNPs under MF condition. This stands in a good agreement with the recent study of Kim and colleges,43 who noted, that electromagnetic fields combined with MNPs increase the osteogenic differentiation potential of human bone marrow-derived mesenchymal stem cells through osteopontin activation. Interestingly, as showed by Liu and collegues,44 osteopontin is also involved in the regulation of alkaline phosphatase through integrin-mediated cell signalling. Here, we observed, greater expression of integrin alpha 3 (Intga3) in osteoblasts cultivated under MF condition, which might explain the enhanced expression of Runx-2, Coll1A, Bglap2, which contributed to enhanced osteoblast differentiation and mineralization. At the same time, no significant differences in the expression of sclerostin (SOST) – the negative regulator of bone formation – have been observed. Therefore, it might be concluded that the combination of both MNPs together with MF might promote ECM formation and mineralization through the RUNX-2-Coll1A-Bglap2 axis. In order to delay the progression of osteoporosis, inhibition of osteoclasts viability, metabolic activity, and differentiation seems to be a crucial factor. Therefore, we investigated whether the combination of MNPs and MF is able to modulate osteoclast activity. We have found that both MNPs and MF induce osteoclasts apoptosis through activation of Bax as well as caspase −3 (CASP-3) axis. The enhanced levels of Bax and CASP-3 confirm the inhibitory effect of MNPs and MF on osteoclasts activity and at the same time might suggest its positive role in the inhibition of bone resorption processes. Furthermore, we observed decreased expression of Trap, c-fos as well as PU.1 - the critical activators of osteoclastogenesis. A similar effect was recently noted by Li and colleges, who showed, that bioactive iron oxide nanoparticles suppress osteoclastogenesis and bone loss through regulating the TRAF6-p62-CYLD signaling complex.45 Emerging evidence demonstrates that the master regulator of bone hematopoiesis, Runx1, is involved in the preosteoclasts activity and may influence skeletal health.46 Here, we observed increased expression of RUNX-1 in osteoclasts treated with MNPs and MF, which suggests their positive role in silencing preosteoclasts’ activity. It might suggest that the combination of both MNPs with MF might lead to inhibition of bone resorptive processes and therefore become an interesting component of various types of bone scaffold, that potentially might inhibit osteoclastogenesis. To support our hypothesis, we next analyzed osteoclasts-related genes’ expression and we found decreased mRNA expression of cathepsin K (catK) and matrix metalloproteinase 9 (Mmmp9) – key regulators of bone resorption processes. Therefore, it might be concluded, that a combination of MNPs together with MF inhibits osteoclastogenesis and might exert a protective effect against bone resorption.
In summary, this study showed that MNPs combined with MF improve osteogenic differentiation potential of osteoblasts through enhanced expression of key regulators including Runx2-Coll1A- Bglap2 and osteopontin axis. At the same time, we noted decreased osteoclastogenesis due to the induction of enhanced apoptosis and reduced inflammation in both osteoblasts and osteoclasts when co-cultured with macrophages stimulated with LPS. It can be concluded that both MNPs and MF become an attractive factor that might be used in future scaffolds dedicated to osteoporotic-related fracture bone regeneration through modulation of osteoblastogenesis and inhibition of osteoclastogenesis.
Conclusion
In the presented study we have demonstrated that Fe3O4 nanoparticles can be administered into cells and exert a wide range of biological effects. We have shown, that when combined with the magnetic field, Fe3O4 nanoparticles induce osteogenic differentiation of osteoblast while diminishing the metabolic activity of osteoclast and induce their apoptosis. For that reason, we speculate that these factors can be applied for the fabrication of novel biomaterials for the treatment of bone disorders related to bone loss, including osteoporosis in which a balance between bone-forming and resorbing cells is disturbed.
Acknowledgments
The research was funded by National Science Centre Poland grant no: 2017/26/M/NZ5/01184. 4B12 cell line was kindly provided by Dr Shigeru Amano – Division of Microbiology and Immunology, Department of Oral Biology and Tissue Engineering, Meikai University School of Dentistry, Keyakidai, Sakado City, Saitama 350-0283, Japan. All animal experiments were performed in accordance with the Guidelines of the Animal Center of the Meikai University School of Dentistry. Paulina Sobierajska received financial resources within the confines of financing the ETIUDA doctoral scholarship from the National Science Centre in Poland (no. UMO-2018/28/T/ST5/00326).
Disclosure
The authors declare there are no conflicts of interest in this work.
References
1. Yang Y, Chawla A, Zhang J, Esa A, Jang HL, Khademhosseini A. Chapter 29 - applications of nanotechnology for regenerative medicine; healing tissues at the nanoscale. In: Atala A, Lanza R, Mikos AG, Nerem R editors, Principles of Regenerative Medicine.
2. Blume SW, Curtis JR. Medical costs of osteoporosis in the elderly medicare population. Osteoporos Int J Establ Result Coop Eur Found Osteoporos Natl Osteoporos Found USA. 2011;22(6):1835–1844. doi:10.1007/s00198-010-1419-7
3. Porter JL, Varacallo M. Osteoporosis. StatPearls. Treasure Island (FL): StatPearls Publishing; 2020. http://www.ncbi.nlm.nih.gov/books/NBK441901/.
4. Drake MT, Clarke BL, Lewiecki EM. The pathophysiology and treatment of osteoporosis. Clin Ther. 2015;37(8):1837–1850. doi:10.1016/j.clinthera.2015.06.006
5. Cheung WH, Miclau T, Chow SK-H, Yang FF, Alt V. Fracture healing in osteoporotic bone. Injury. 2016;47(Suppl 2):S21–26. doi:10.1016/S0020-1383(16)47004-X
6. Arnett TR, Orriss IR. Metabolic properties of the osteoclast. Bone. 2018;115:25–30. doi:10.1016/j.bone.2017.12.021
7. Rachner TD, Khosla S, Hofbauer LC. Osteoporosis: now and the future. Lancet Lond Engl. 2011;377(9773):1276–1287. doi:10.1016/S0140-6736(10)62349-5
8. Caetano-Lopes J, Canhão H, Fonseca JE. Osteoblasts and bone formation. Acta Reumatol Port. 2007;32(2):103–110.
9. Komori T. Regulation of proliferation, differentiation and functions of osteoblasts by runx2. Int J Mol Sci. 2019;20:7. doi:10.3390/ijms20071694
10. Mollazadeh S, Fazly Bazzaz BS, Kerachian MA. Role of apoptosis in pathogenesis and treatment of bone-related diseases. J Orthop Surg. 2015;10. doi:10.1186/s13018-015-0152-5
11. Mohammadi M, Mousavi Shaegh SA, Alibolandi M, et al. Micro and nanotechnologies for bone regeneration: recent advances and emerging designs. J Control Release off J Control Release Soc. 2018;274:35–55. doi:10.1016/j.jconrel.2018.01.032
12. Shuai C, Yang W, He C, et al. A magnetic micro-environment in scaffolds for stimulating bone regeneration. Mater Des. 2020;185:108275. doi:10.1016/j.matdes.2019.108275
13. Ba X, Hadjiargyrou M, DiMasi E, et al. The role of moderate static magnetic fields on biomineralization of osteoblasts on sulfonated polystyrene films. Biomaterials. 2011;32(31):7831–7838. doi:10.1016/j.biomaterials.2011.06.053
14. Dini L, Abbro L. Bioeffects of moderate-intensity static magnetic fields on cell cultures. Micron Oxf Engl 1993. 2005;36(3):195–217. doi:10.1016/j.micron.2004.12.009
15. Kotani H, Kawaguchi H, Shimoaka T, et al. Strong static magnetic field stimulates bone formation to a definite orientation in vitro and in vivo. J Bone Miner Res off J Am Soc Bone Miner Res. 2002;17(10):1814–1821. doi:10.1359/jbmr.2002.17.10.1814
16. Marędziak M, Śmieszek A, Tomaszewski KA, Lewandowski D, Marycz K. The effect of low static magnetic field on osteogenic and adipogenic differentiation potential of human adipose stromal/stem cells. J Magn Magn Mater. 2016;398:235–245. doi:10.1016/j.jmmm.2015.09.004
17. Marędziak M, Marycz K, Lewandowski D, Siudzińska A, Śmieszek A. Static magnetic field enhances synthesis and secretion of membrane-derived microvesicles (MVs) rich in VEGF and BMP-2 in equine adipose-derived stromal cells (EqASCs)-a new approach in veterinary regenerative medicine. In Vitro Cell Dev Biol Anim. 2015;51(3):230–240. doi:10.1007/s11626-014-9828-0
18. Amano S, Sekine K, Bonewald L, Ohmori Y. A novel osteoclast precursor cell line, 4B12, recapitulates the features of primary osteoclast differentiation and function: enhanced transfection efficiency before and after differentiation. J Cell Physiol. 2009;221(1):40–53. doi:10.1002/jcp.21827
19. Marycz K, Alicka M, Kornicka-Garbowska K, et al. Promotion through external magnetic field of osteogenic differentiation potential in adipose-derived mesenchymal stem cells: design of polyurethane/poly(lactic) acid sponges doped with iron oxide nanoparticles. J Biomed Mater Res B Appl Biomater. 2019. doi:10.1002/jbm.b.34488
20. Kornicka K, Marycz K, Tomaszewski KA, Marędziak M, Śmieszek A. The effect of age on osteogenic and adipogenic differentiation potential of human adipose derived stromal stem cells (hASCs) and the impact of stress factors in the course of the differentiation process. Oxid Med Cell Longev. 2015;2015:309169. doi:10.1155/2015/309169
21. Schneider CA, Rasband WS, Eliceiri KW. NIH image to imageJ: 25 years of image analysis. Nat Methods. 2012;9(7):671–675. doi:10.1038/nmeth.2089
22. Chomczynski P, Sacchi N. Single-step method of RNA isolation by acid guanidinium thiocyanate-phenol-chloroform extraction. Anal Biochem. 1987;162(1):156–159. doi:10.1006/abio.1987.9999
23. Kornicka K, Szłapka-Kosarzewska J, Śmieszek A, Marycz K. 5-Azacytydine and resveratrol reverse senescence and ageing of adipose stem cells via modulation of mitochondrial dynamics and autophagy. J Cell Mol Med. 2018. doi:10.1111/jcmm.13914
24. Livak KJ, Schmittgen TD. Analysis of relative gene expression data using real-time quantitative PCR and the 2(-Delta Delta C(T)) method. Methods San Diego Calif. 2001;25(4):402–408. doi:10.1006/meth.2001.1262
25. Hamed MH, Mueller DN, Müller M. Thermal phase design of ultrathin magnetic iron oxide films: from Fe3O4 to γ-Fe2O3 and FeO. J Mater Chem C. 2020;8(4):1335–1343. doi:10.1039/C9TC05921K
26. Gawande MB, Branco PS, Varma RS. Nano-magnetite (Fe3O4) as a support for recyclable catalysts in the development of sustainable methodologies. Chem Soc Rev. 2013;42(8):3371–3393. doi:10.1039/C3CS35480F
27. Shebanova ON, Lazor P. Raman study of magnetite (Fe3O4): laser-induced thermal effects and oxidation. J Raman Spectrosc. 2003;34(11):845–852. doi:10.1002/jrs.1056
28. Faria DLAD, Silva SV, Oliveira MTD. Raman microspectroscopy of some iron oxides and oxyhydroxides. J Raman Spectrosc. 1997;28(11):873–878. doi:10.1002/(SICI)1097-4555(199711)28:11<873::aid-jrs177>3.0.CO;2-B
29. Marycz K, Sobierajska P, Roecken M, et al. Iron oxides nanoparticles (IOs) exposed to magnetic field promote expression of osteogenic markers in osteoblasts through integrin alpha-3 (INTa-3) activation, inhibits osteoclasts activity and exerts anti-inflammatory action. J Nanobiotechnology. 2020;18(1):33. doi:10.1186/s12951-020-00590-w
30. Lin CH, Kuo PC, Pan JL, Huang DR. Effects of Zn ion on magnetic properties of Fe3O4 magnetic colloids (abstract). J Appl Phys. 1996;79(8):6035. doi:10.1063/1.362081
31. Johnson CE, Johnson JA, Hah HY, et al. Mössbauer studies of stoichiometry of Fe3O4: characterization of nanoparticles for biomedical applications. Hyperfine Interact. 2016;237(1):27. doi:10.1007/s10751-016-1277-6
32. Lyubutin IS, Lin CR, YuV K, Dmitrieva TV, Chiang RK. Mössbauer spectroscopy and magnetic properties of hematite/magnetite nanocomposites. J Appl Phys. 2009;106(3):034311. doi:10.1063/1.3194316
33. Channing DA, Graham MJ. A study of iron oxidation processes by Mössbauer spectroscopy. Corros Sci. 1972;12(3):271–289. doi:10.1016/S0010-938X(72)90704-4
34. Valezi DF, Piccinato MT, Sarvezuk PWC, et al. Goethite (α-FeOOH) magnetic transition by ESR, Magnetometry and Mössbauer. Mater Chem Phys. 2016;173:179–185. doi:10.1016/j.matchemphys.2016.01.067
35. Lundqvist M, Stigler J, Elia G, Lynch I, Cedervall T, Dawson KA. Nanoparticle size and surface properties determine the protein corona with possible implications for biological impacts. Proc Natl Acad Sci. 2008;105(38):14265–14270. doi:10.1073/pnas.0805135105
36. Win KY, Feng -S-S. Effects of particle size and surface coating on cellular uptake of polymeric nanoparticles for oral delivery of anticancer drugs. Biomaterials. 2005;26(15):2713–2722. doi:10.1016/j.biomaterials.2004.07.050
37. Zakharova IN, Shipilin MA, Alekseev VP, Shipilin AM. Mössbauer study of maghemite nanoparticles. Tech Phys Lett. 2012;38(1):55–58. doi:10.1134/S1063785012010294
38. Lyubutin IS, Starchikov SS, Bukreeva TV, et al. In situ synthesis and characterization of magnetic nanoparticles in shells of biodegradable polyelectrolyte microcapsules. Mater Sci Eng C. 2014;45:225–233. doi:10.1016/j.msec.2014.09.017
39. Marquez-Linares F, Uwakweh ONC, Lopez N, et al. Study of the surface chemistry and morphology of single walled carbon nanotube–magnetite composites. J Solid State Chem. 2011;184(3):655–666. doi:10.1016/j.jssc.2011.01.017
40. Ginaldi L, Di Benedetto MC, De Martinis M. Osteoporosis, inflammation and ageing. Immun Ageing A. 2005;2:14. doi:10.1186/1742-4933-2-14
41. Montalcini T, Romeo S, Ferro Y, Migliaccio V, Gazzaruso C, Pujia A. Osteoporosis in chronic inflammatory disease: the role of malnutrition. Endocrine. 2013;43(1):59–64. doi:10.1007/s12020-012-9813-x
42. Peng J, Zhao J, Long Y, Xie Y, Nie J, Chen L. Magnetic materials in promoting bone regeneration. Front Mater. 2019;6. doi:10.3389/fmats.2019.00268
43. Kim M-O, Jung H, Kim S-C, Park J-K, Seo Y-K. Electromagnetic fields and nanomagnetic particles increase the osteogenic differentiation of human bone marrow-derived mesenchymal stem cells. Int J Mol Med. 2015;35(1):153–160. doi:10.3892/ijmm.2014.1978
44. Liu YK, Uemura T, Nemoto A, et al. Osteopontin involvement in integrin-mediated cell signaling and regulation of expression of alkaline phosphatase during early differentiation of UMR cells. FEBS Lett. 1997;420(1):112–116. doi:10.1016/s0014-5793(97)01498-1
45. Liu L, Jin R, Duan J, et al. Bioactive iron oxide nanoparticles suppress osteoclastogenesis and ovariectomy-induced bone loss through regulating the TRAF6-p62-CYLD signaling complex. Acta Biomater. 2020;103:281–292. doi:10.1016/j.actbio.2019.12.022
46. Soung DY, Kalinowski J, Baniwal SK, et al. Runx1-mediated regulation of osteoclast differentiation and function. Mol Endocrinol Baltim Md. 2014;28(4):546–553. doi:10.1210/me.2013-1305
 © 2020 The Author(s). This work is published and licensed by Dove Medical Press Limited. The
full terms of this license are available at https://www.dovepress.com/terms
and incorporate the Creative Commons Attribution
- Non Commercial (unported, 3.0) License.
By accessing the work you hereby accept the Terms. Non-commercial uses of the work are permitted
without any further permission from Dove Medical Press Limited, provided the work is properly
attributed. For permission for commercial use of this work, please see paragraphs 4.2 and 5 of our Terms.
© 2020 The Author(s). This work is published and licensed by Dove Medical Press Limited. The
full terms of this license are available at https://www.dovepress.com/terms
and incorporate the Creative Commons Attribution
- Non Commercial (unported, 3.0) License.
By accessing the work you hereby accept the Terms. Non-commercial uses of the work are permitted
without any further permission from Dove Medical Press Limited, provided the work is properly
attributed. For permission for commercial use of this work, please see paragraphs 4.2 and 5 of our Terms.