Back to Journals » Diabetes, Metabolic Syndrome and Obesity » Volume 16
Fasting Plasma Glucose and Glycated Hemoglobin Levels as Risk Factors for the Development of Hypertension: A Retrospective Cohort Study
Authors Luo B ![]() , Feng L, Bi Q, Shi R, Cao H
, Feng L, Bi Q, Shi R, Cao H ![]() , Zhang Y
, Zhang Y
Received 1 March 2023
Accepted for publication 10 June 2023
Published 17 June 2023 Volume 2023:16 Pages 1791—1798
DOI https://doi.org/10.2147/DMSO.S410670
Checked for plagiarism Yes
Review by Single anonymous peer review
Peer reviewer comments 2
Editor who approved publication: Professor Gian Paolo Fadini
Beibei Luo,1 Lei Feng,2 Qianye Bi,1 Rui Shi,1 Huiying Cao,1 Yanbi Zhang1
1Department of Laboratory, The Sixth Affiliated Hospital of Kunming Medical University, Yuxi City, Yunnan Province, 653100, People’s Republic of China; 2Intensive Care Unit, People’s Hospital of Yuxi City, Yuxi City, Yunnan Province, 653100, People’s Republic of China
Correspondence: Lei Feng, Department of Laboratory, The Sixth Affiliated Hospital of Kunming Medical University, 21 Nieer Road, Yuxi City, Yunnan Province, 653100, People’s Republic of China, Email [email protected]
Introduction: Hypertension (HTN) is a significant risk factor for cardiovascular disease. Identifying new risk factors for hypertension is crucial. This study aims to determine the predictive value of fasting plasma glucose (FPG) and glycated hemoglobin (HbA1c) in the development of hypertension.
Methods: In this study, we examined 16,026 individuals without diabetes and other cardiovascular risk factors who were underwent annual screening at the People’s Hospital of Yuxi, Yunnan, China from 2013 to 2016. The participants were divided into two groups: normoglycemic and prediabetic. Normoglycemia was defined as having an HbA1c level of less than 5.7% and an FPG level of less than 5.6 mmol/ L. Prediabetes was defined according to the ADA criteria, which includes having an HbA1c level between 5.7% and 6.5%, or an impaired fasting glucose level between 5.6 mmol/L and 7.0 mmol/L. The participants were further divided into four subgroups based on their FPG and HbA1c levels: normoglycemia, impaired HbA1c only, FPG only, and both parameters impaired.
Results: The cohort study was conducted on 16,026 participants from Yunnan, China, consisting of 60.6% males and 39.4% females, with a mean age of 44.6 ± 12.5 years. The study revealed that prediabetes was independently associated with an increased risk for HTN (OR 1.53, 95% CI 1.41~1.67, P < 0.001). The analysis of different subgroups of HbA1c and FPG showed that FPG was a better predictor of HTN than HbA1c, regardless of the group.
Conclusion: FPG and HbA1c were significantly associated with the future development of HTN in individuals with prediabetes.
Keywords: glycated hemoglobin, glucose, hypertension
Introduction
Hypertension (HTN) is a significant risk factor for cardiovascular disease,1 and it remains a major health concern globally. Approximately 40% of adults worldwide are affected by HTN, which leads to over 9.4 million deaths annually.2 Therefore, identifying new risk factors for HTN is crucial in promoting preventive treatment for cardiovascular diseases. Research has shown that up to one-third of hypertensive individuals have insulin resistance, which meets the diagnostic criteria for metabolic syndrome.3 Insulin resistance is a key indicator of prediabetes and diabetes,4 conditions that are strongly associated with the development of HTN.5
Previous research has demonstrated a correlation between glycated hemoglobin (HbA1c) and fasting plasma glucose (FPG) tests and hypertension and cardiovascular disease.6–8 Furthermore, FPG and HbA1c tests are straightforward methods for determining insulin resistance.9 The American Diabetes Association (ADA) 2003 diagnostic criteria,10 which defined impaired fasting glucose (IFG) as blood glucose between 6.1 and 7.0 mmol/ L, and impaired glucose tolerance (IGT) as a 2-hour postprandial blood glucose of between 7.8 and 11.1 mmol/ L, are predictors for the future development of diabetes and diabetes-related complications, including HTN. However, due to confounding factors, it remains unclear whether FPG and HbA1c tests serve as independent risk factors for hypertension development.
Although increased concentrations of FPG or HbA1c have been reported to have predictive power for the development of hypertension, it is unclear whether there is an association between elevated FPG levels or HbA1c in non-diabetic patients at the increased risk of hypertension. In this study, we aimed to determine the predictive value of FPG and HbA1c for the development of hypertension in a group of participants who had not been previously diagnosed with hypertension and diabetes at baseline.
Methods
Study Design and Participants
This single-center, retrospective cohort study was conducted at People’s Hospital of Yuxi, Yunnan, China and included a cohort of 31,180 apparently healthy employees who underwent annual medical examinations between 2013 and 2016. All participants underwent anthropometric measurements and biochemical tests, while trained professionals performed standardized measurements according to a working protocol. Participants’ height and weight were measured and recorded while wearing light clothing and no shoes. Blood pressure (BP) was measured after resting for 5 minutes in a seated position with a standard sphygmomanometer. Body mass index (BMI) was calculated as weight in Kg divided by the height in m2. Furthermore, medical histories were collected, including diseases and surgeries. Laboratory tests including blood count and a comprehensive metabolic panel were conducted on all participants using fresh samples analyzed by Roche automatic biochemical analyzer Cobas 8000 and its supporting reagents at People’s Hospital of Yuxi. This study was approved by the ethics committee of the Sixth Affiliated Hospital of Kunming Medical University (No. 2023kmykdx6f23) and conformed with the Declaration of Helsinki. Participant identifying information was not collected, and patient data was kept confidential.
Exclusion Criteria
The study excluded participants with prior diagnoses of HTN or diabetes (DM) as determined by either medical records or the primary care physician’s diagnosis at baseline. Additionally, participants with FPG ≥ 7.0 mmol/L or HbA1c ≥ 6.5% were excluded. However, participants without a previous HTN diagnosis but presenting with systolic blood pressure (SBP) ≥ 140 mmHg or diastolic blood pressure (DBP) ≥ 90 mmHg were included in our measurement. We also excluded participants with chronic comorbidities associated with HTN such as ischemic heart disease (IHD), chronic kidney disease (CKD), and cerebrovascular events (CVA). Participants with missing data in laboratory tests or disease history were excluded. Finally, a total of 16,026 patients were analyzed (Figure 1).
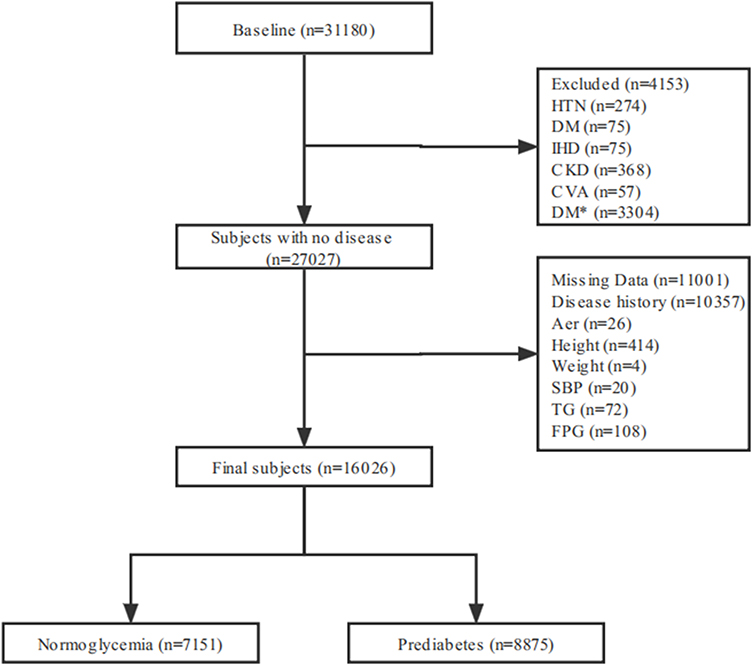 |
Figure 1 Flowchart of study participants. *No known DM, fasting plasma glucose > 7.0 mmol/L or HbA1c ≥ 6.5%. Abbreviations: HTN, hypertension; DM, diabetes mellitus; IHD, ischemic heart disease; CKD, chronic kidney disease; CVA, cerebrovascular accident. |
Definitions of HTN and Prediabetes
In this study, participants with SBP ≥ 140 mmHg and/or DBP ≥ 90 mmHg, who were referred for further evaluation by their primary care physician, were defined as having HTN.11 Prediabetes was defined according to the modified ADA criteria as following: HbA1c ≥ 5.7% and < 6.5%, or FPG ≥ 5.6 mmol/L and < 7.0 mmol/L. Normoglycemia was defined as HbA1c < 5.7% and FPG < 5.6 mmol/L.
Statistical Analysis
Continuous variables were described using mean ± the standard deviation (SD) or median and the interquartile range (IQR). Categorical variables were presented as numbers and percentages. To compare continuous variables, we used the Student’s t-test or Mann–Whitney U-test, whereas chi-square analysis was utilized to compare categorical variables. Univariate and multivariate logistic regression analyses were conducted to investigate the association of independent clinical variables. Multivariate logistic regression models were used to determine regression coefficients odd ratios (OR) and 95% confidence interval (CI) to evaluate the association between HTN and FPG or between HTN and HbA1c. We estimated three separate models: Model 1, which did not adjust any confounders. Model 2, which adjusted for gender, age, and BMI. Model 3, which additionally adjusted gender, age, BMI, TG, HDL-C, and LDL-C. Logistic regression models were also used to conduct subgroup analyses based on four groups: group 1 (HbA1c < 5.7% and FPG < 5.6 mmol/L), group 2 (HbA1c < 5.7% and 5.6 ≤ FPG < 7.0 mmol/L), group 3 (5.7% ≤ HbA1c < 6.5% and FPG < 5.6 mmol/L), and group 4 (5.7% ≤ HbA1c < 6.5% and 5.6 ≤ FPG < 7.0 mmol/L). In our analysis, P-values less than 0.05 was considered statistically significant. All the analyses were performed with the statistical software packages R (http://www.R-project.org, The R Foundation) and Free Statistics software version 1.7.
Results
The cohort study included 16,026 participants from Yunnan, China, with a male-to-female ratio of 60.6% to 39.4%, and a mean age of 44.6 ± 12.5 years. Among these participants, 7151 were normoglycemic, while 8875 had prediabetes. Prediabetic participants were predominantly male and older than the normoglycemic group, with higher BMI, SBP, DBP, LDL, TG, FPG, and HbA1c levels (Table 1).
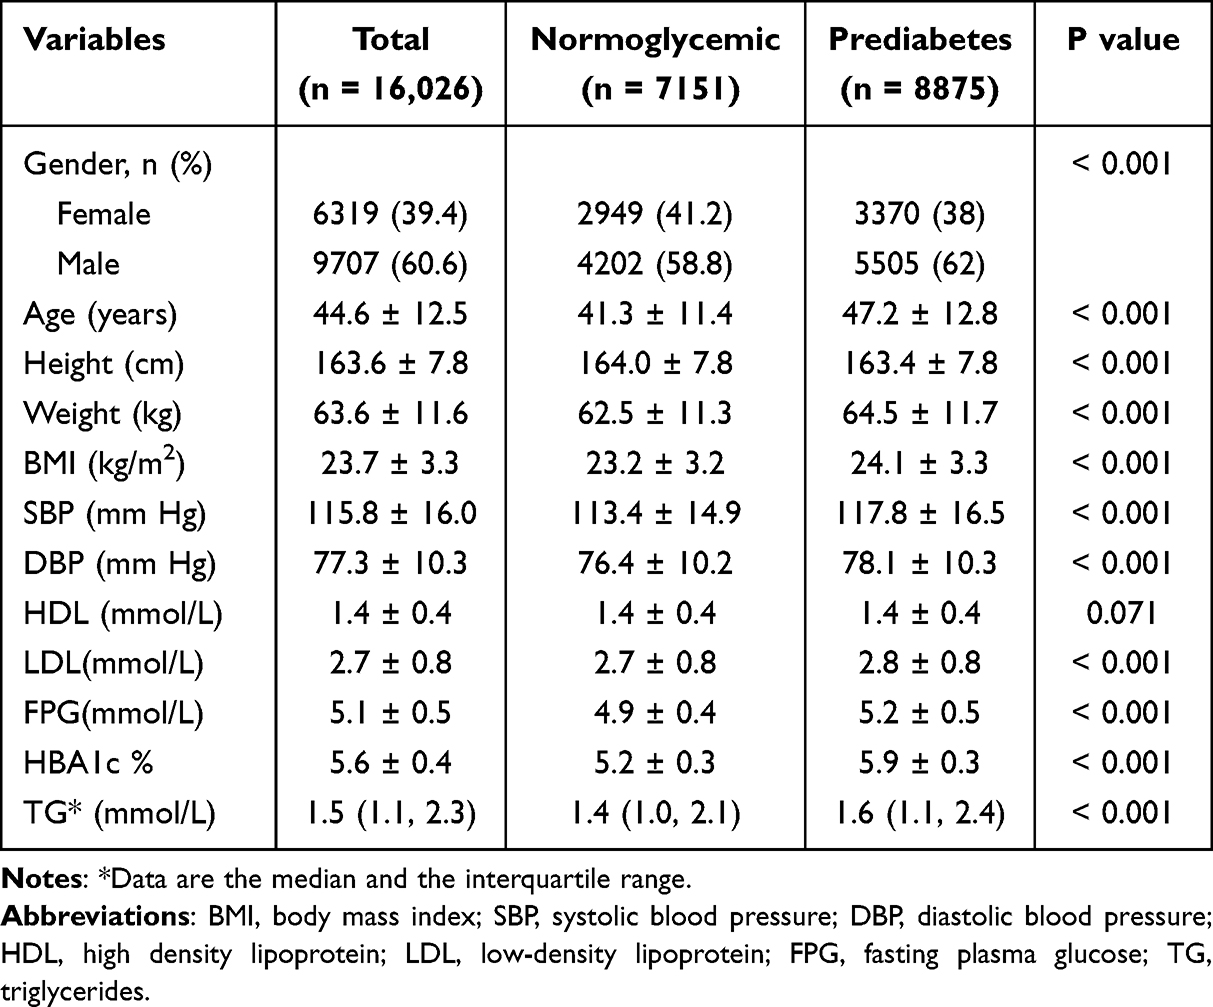 |
Table 1 Baseline Characteristics of Study Participants |
Prediabetes is an Independent Risk Factor for HTN
In the univariate logistic regression analysis for HTN, prediabetes was found to be independently associated with an increased risk for HTN (OR 1.53, 95% CI 1.41~1.67, P < 0.001) (Table 2). Additionally, other factors were identified for HTN. FPG was the highest risk factor for HTN, with every 1 mmol/L increment associated with a 135% increased risk (Table 2). After multivariate regression analysis of FPG and HbA1c, we found that FPG was a better predictor of HTN than HbA1c, as observed in both model 1 (confounders factors: gender, age, BMI) and model 2 (confounders factors: gender, age, BMI, TG, HDL, LDL) (Table 3).
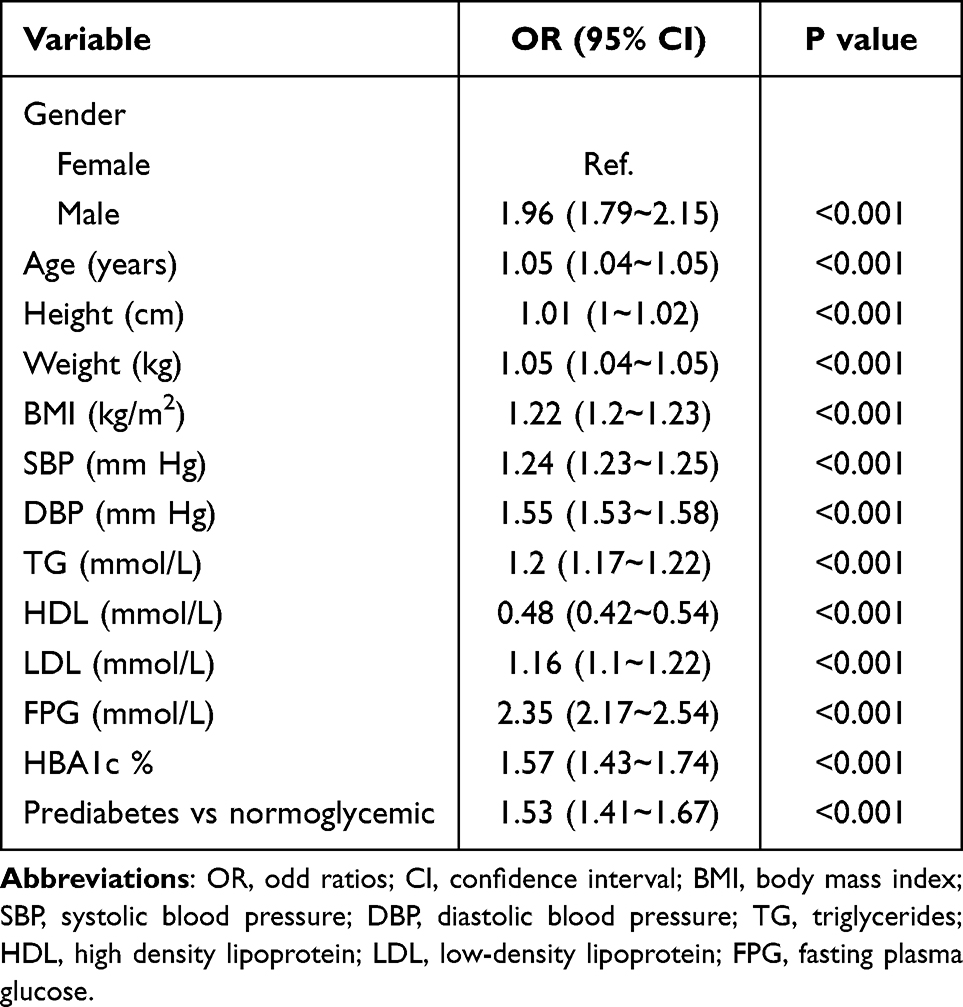 |
Table 2 Univariate Logistic Regression Analysis for Hypertension |
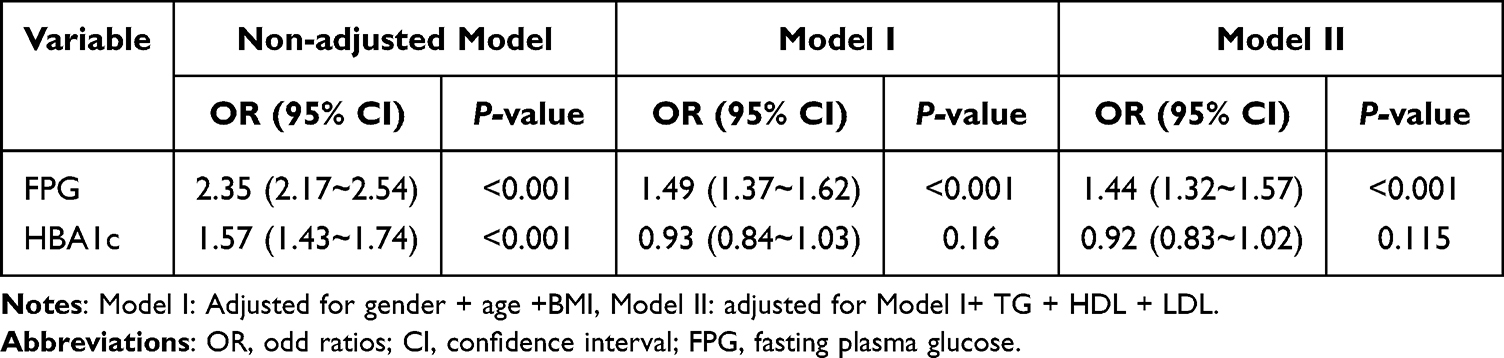 |
Table 3 Multivariate Logistic Regression Analysis for Hypertension |
The Association of Different Measures of Glycemic Control and Their Association with HTN
We classified the participants into four categories based on their FPG and HbA1c levels. Group 1 consisted of individuals with normal FPG and HbA1c levels (HbA1c < 5.7% and FPG < 5.6 mmol/L) (n = 7151). Group 2 included those with normal HbA1c but impaired FPG levels (HbA1c < 5.7% and 5.6 ≤ FPG < 7.0 mmol/L) (n = 817). Group 3 involved people with normal FPG but elevated HbA1c levels (5.7% ≤ HbA1c < 6.5% and FPG < 5.6 mmol/L) (n = 6225). Finally, group 4 consisted of individuals with elevated FPG and HbA1c levels (5.7% ≤ HbA1c < 6.5% and 5.6 ≤ FPG < 7.0 mmol/L) (n = 1833) (Figure 2). The baseline characteristics for the various sub-analysis groups are presented in Table 4. When examining the subgroups based on HbA1c and FPG, we discovered that FPG was a superior predictor of HTN risk than HbA1c regardless of the subgroup.
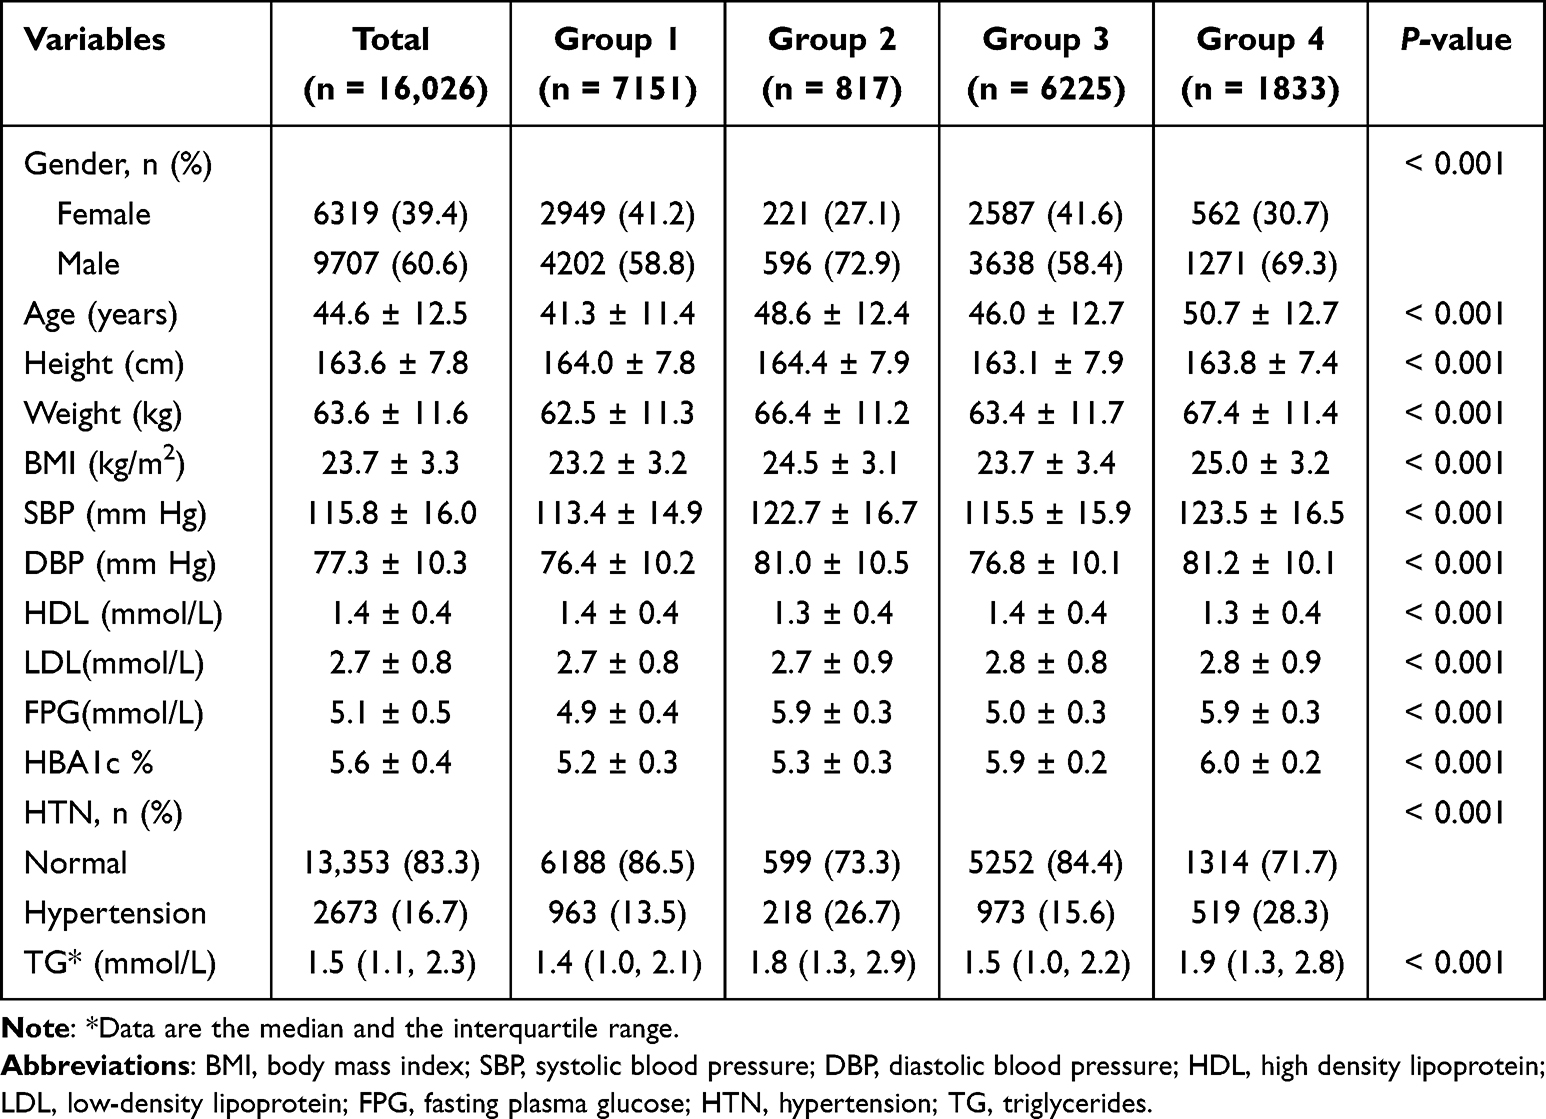 |
Table 4 Baseline Characteristics of Group |
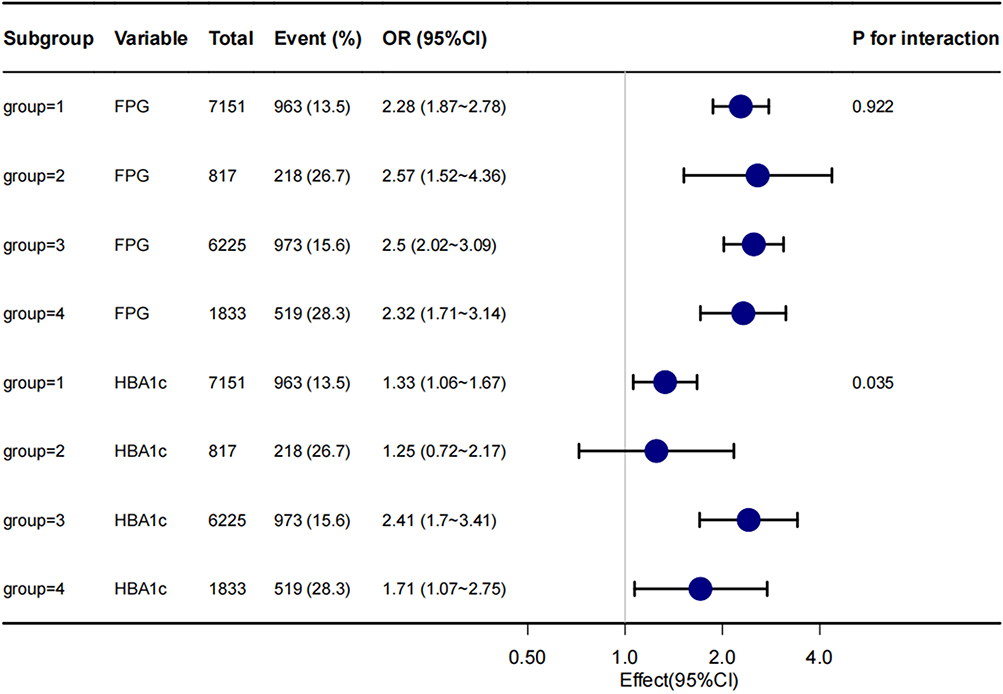 |
Figure 2 The association of different measures of glycemic control and their association with HTN. |
Discussion
Our analysis revealed that higher FPG and HbA1c levels in non-diabetic individuals in a generally healthy population, after excluding individuals with diabetes or HTN at baseline, were identified as HTN risk factors. These findings highlight the role of insulin resistance in HTN development, which shares several risk factors with diabetes, such as endothelial dysfunction, vascular inflammation, arterial remodeling, atherosclerosis, dyslipidemia, obesity, and hyperglycemia on the microcirculation.12–15 Additionally, insulin resistance and hyperglycemia in the microcirculation should not be ignored.16 FPG is dependent on increased hepatic glucose production during fasting, while HbA1c reflects glycemic control during fasting and postprandial periods.17 Thus, we evaluated the varying risk of developing HTN among participants with prediabetes diagnosed by either isolated HbA1C or FPG. Our results showed that both FPG and HbA1c were independently linked to a heightened risk of HTN. Nevertheless, additional adjustments revealed that HbA1c was not associated with hypertension development. This lack of association may be due to the limitations of HbA1c as a measure of blood glucose control, as it may reflect a broad range of glucose levels.18
A community study of Korean individuals, comprising 4039 participants without diabetes or hypertension, found no significant correlation between the incidence of hypertension and either FPG or HbA1c.19 Conversely, a rural Chinese cohort study in females established FPG as an independent risk factor for hypertension. Another investigation of four communities in the United States revealed the association between HbA1c and cardiovascular risk may be partially mediated by the development of hypertension.20 Similarly, a study conducted at the Toranomon Hospital Health Management Center in Japan identified higher FPG levels, rather than HbA1c, as a strong predictor for future hypertension among Japanese.21 Britton et al22 found no significant association between HbA1c levels and an increased risk of HTN after adjusting for BMI in women without diabetes. Boyko et al23 observed a relationship between 2-hour postprandial glucose levels and hypertension occurrence over 5 years, but this relationship did not persist over an overall 11-year prospective study in Mauritius aimed at assessing risk factors for hypertension. These results regarding the association between the development of HTN and FPG and HbA1c reveal conflicting results. The role of HbA1c as a prognosticator for the incidence of cardiovascular morbidity and mortality is currently not clear, potentially due to confounding risk factors.24 However, our findings align with previous research in identifying an increased risk for hypertension associated with both FPG and HbA1c.
However, there are several limitations to our study. First, this retrospective cohort study consisted of only middle-aged men and women from a single area, most of whom worked in similar professions. Consequently, our findings may not be generalizable to the wider multi-ethnic population of China. Second, 24-hour ambulatory blood pressure monitoring is considered one of the best methods for blood pressure evaluation. Since we only measured blood pressure in the hospital, our study could not rule out the possibility of white-coat hypertension or home hypertension. Additionally, due to incomplete baseline data, we were unable to adjust for several potential confounding variables, such as smoking, drinking, and other laboratory measurements during risk analysis. Finally, the exact time of hypertension onset could not be accurately determined, as newly developed hypertension was assessed during clinical examination. As a result, Cox regression analysis could not be conducted, and the hazard ratio could not be obtained.
Conclusion
In summary, our study found that FPG and HbA1c were independent predictors of future HTN development in the prediabetes range. However, our results showed FPG was a stronger predictor than HbA1c.
Funding
We gratefully acknowledge support from the Regional Fund Project of the National Natural Science Foundation (Serial number: 82160402), the Training plan for medical leading talents of Yunnan Health Commission (Serial number: L-2019022).
Disclosure
The authors report no conflicts of interest in this work.
References
1. Wang X, Deng Y, Zhang G, et al. Spliced X-box binding protein 1 stimulates adaptive growth through activation of mTOR. Circulation. 2019;140(7):566–579. doi:10.1161/CIRCULATIONAHA.118.038924
2. Thacher JD, Poulsen AH, Roswall N, et al. Road traffic noise exposure and filled prescriptions for antihypertensive medication: a Danish cohort study. Environ Health Perspect. 2020;128(5):57004. doi:10.1289/EHP6273
3. Remchak ME, Heiston EM, Ballantyne A, et al. Insulin sensitivity and metabolic flexibility parallel plasma TCA levels in early chronotype with metabolic syndrome. J Clin Endocrinol Metab. 2022;107(8):e3487–e3496. doi:10.1210/clinem/dgac233
4. Murtha MJ, Eichler T, Bender K, et al. Insulin receptor signaling regulates renal collecting duct and intercalated cell antibacterial defenses. J Clin Invest. 2018;128(12):5634–5646. doi:10.1172/JCI98595
5. Hashemi Madani N, Ismail-Beigi F, Poustchi H, et al. Impaired fasting glucose and major adverse cardiovascular events by hypertension and dyslipidemia status: the Golestan cohort study. BMC Cardiovasc Disord. 2020;20(1):113. doi:10.1186/s12872-020-01390-8
6. Di Bonito P, Sanguigno E, Forziato C, et al. Fasting plasma glucose and clustering of cardiometabolic risk factors in normoglycemic outpatient children and adolescents. Diabetes Care. 2011;34(6):1412–1414. doi:10.2337/dc10-1783
7. Bower JK, Appel LJ, Matsushita K, et al. Glycated hemoglobin and risk of hypertension in the atherosclerosis risk in communities study. Diabetes Care. 2012;35(5):1031–1037. doi:10.2337/dc11-2248
8. Kuwabara M, Chintaluru Y, Kanbay M, et al. Fasting blood glucose is predictive of hypertension in a general Japanese population. J Hypertens. 2019;37(1):167–174. doi:10.1097/HJH.0000000000001895
9. Schüssler-Fiorenza Rose SM, Contrepois K, Moneghetti KJ, et al. A longitudinal big data approach for precision health. Nat Med. 2019;25(5):792–804. doi:10.1038/s41591-019-0414-6
10. Expert Committee on the Diagnosis and Classification of Diabetes Mellitus. Report of the expert committee on the diagnosis and classification of diabetes mellitus. Diabetes Care. 2003;26(Suppl1):5–20. doi:10.2337/diacare.26.2007.S5
11. Mahinrad S, Kurian S, Garner CR, et al. Cumulative blood pressure exposure during young adulthood and mobility and cognitive function in midlife. Circulation. 2020;141(9):712–724. doi:10.1161/CIRCULATIONAHA.119.042502
12. Sinha S, Haque M. Insulin resistance is cheerfully hitched with hypertension. Life. 2022;12(4). doi:10.3390/life12040564
13. Kanda T, Brown JD, Orasanu G, et al. PPARgamma in the endothelium regulates metabolic responses to high-fat diet in mice. J Clin Invest. 2009;119(1):110–124. doi:10.1172/JCI36233
14. Anker MS, Frey MK, Goliasch G, et al. Increased resting heart rate and prognosis in treatment-naïve unselected cancer patients: results from a prospective observational study. Eur J Heart Fail. 2020;22(7):1230–1238. doi:10.1002/ejhf.1782
15. Lopes-Virella MF, Carter RE, Gilbert GE, et al. Risk factors related to inflammation and endothelial dysfunction in the DCCT/EDIC cohort and their relationship with nephropathy and macrovascular complications. Diabetes Care. 2008;31(10):2006–2012. doi:10.2337/dc08-0659
16. Strain WD, Paldánius PM. Diabetes, cardiovascular disease and the microcirculation. Cardiovasc Diabetol. 2018;17(1):57. doi:10.1186/s12933-018-0703-2
17. American Diabetes Association. Diagnosis and classification of diabetes mellitus. Diabetes Care. 2014;37(Suppl 1):S81–90. doi:10.2337/dc14-S081
18. Association American Diabetes. Updates to the standards of medical care in diabetes-2018. Diabetes Care. 2018;41(9):2045–2047. doi:10.2337/dc18-su09
19. Lee CJ, Lim NK, Kim HC, et al. Impaired fasting glucose and impaired glucose tolerance do not predict hypertension: a community cohort study. Am J Hypertens. 2015;28(4):493–500. doi:10.1093/ajh/hpu186
20. Heianza Y, Arase Y, Kodama S, et al. Fasting glucose and HbA1c levels as risk factors for the development of hypertension in Japanese individuals: Toranomon hospital health management center study 16 (TOPICS 16). J Hum Hypertens. 2015;29(4):254–259. doi:10.1038/jhh.2014.77
21. Britton KA, Pradhan AD, Gaziano JM, et al. Hemoglobin A1c, body mass index, and the risk of hypertension in women. Am J Hypertens. 2011;24(3):328–334. doi:10.1038/ajh.2010.233
22. Boyko EJ, Shaw JE, Zimmet PZ, et al. A prospective study of glycemia, body size, insulin resistance and the risk of hypertension in Mauritius. J Hypertens. 2008;26(9):1742–1749. doi:10.1097/HJH.0b013e328306c965
23. Jarmul JA, Pignone M, Pletcher MJ. Interpreting Hemoglobin A1C in combination with conventional risk factors for prediction of cardiovascular risk. Circ Cardiovasc Qual Outcomes. 2015;8(5):501–507. doi:10.1161/CIRCOUTCOMES.115.001639
24. Geva M, Shlomai G, Berkovich A, et al. The association between fasting plasma glucose and glycated hemoglobin in the prediabetes range and future development of hypertension. Cardiovasc Diabetol. 2019;18(1):53. doi:10.1186/s12933-019-0859-4
 © 2023 The Author(s). This work is published and licensed by Dove Medical Press Limited. The
full terms of this license are available at https://www.dovepress.com/terms
and incorporate the Creative Commons Attribution
- Non Commercial (unported, 3.0) License.
By accessing the work you hereby accept the Terms. Non-commercial uses of the work are permitted
without any further permission from Dove Medical Press Limited, provided the work is properly
attributed. For permission for commercial use of this work, please see paragraphs 4.2 and 5 of our Terms.
© 2023 The Author(s). This work is published and licensed by Dove Medical Press Limited. The
full terms of this license are available at https://www.dovepress.com/terms
and incorporate the Creative Commons Attribution
- Non Commercial (unported, 3.0) License.
By accessing the work you hereby accept the Terms. Non-commercial uses of the work are permitted
without any further permission from Dove Medical Press Limited, provided the work is properly
attributed. For permission for commercial use of this work, please see paragraphs 4.2 and 5 of our Terms.