")
Back to Journals » Clinical Epidemiology » Volume 9
Familial aggregation of myasthenia gravis in affected families: a population-based study
Authors Liu FC, Kuo CF , See LC , Tsai HI , Yu HP
Received 17 July 2017
Accepted for publication 26 September 2017
Published 2 November 2017 Volume 2017:9 Pages 527—535
DOI https://doi.org/10.2147/CLEP.S146617
Checked for plagiarism Yes
Review by Single anonymous peer review
Peer reviewer comments 2
Editor who approved publication: Professor Henrik Sørensen
Fu-Chao Liu,1,2 Chang-Fu Kuo,2–5 Lai-Chu See,4,6 Hsin-I Tsai,1,2,7 Huang-Ping Yu1,2
1Department of Anesthesiology, Chang Gung Memorial Hospital, 2College of Medicine, Chang Gung University, 3Division of Rheumatology, Allergy and Immunology, Chang Gung Memorial Hospital, 4Department of Public Health, College of Medicine, Chang Gung University, 5Office for Big Data Research, Chang Gung Memorial Hospital, 6Biostatistics Core Laboratory, Molecular Medicine Research Center, 7Graduate Institute of Clinical Medical Sciences, Chang Gung University, Taoyuan, Taiwan, Republic of China
Introduction: Myasthenia gravis (MG) is clinically heterogeneous and can be life-threatening if bulbar or respiratory muscles are involved. However, relative contributions of genetic, shared, and nonshared environmental factors to MG susceptibility remain unclear. The aim of this study was to examine the familial aggregation and heritability of MG and the relative risks (RRs) of other autoimmune diseases in the relatives of patients with MG.
Methods: A population-based family study using the Taiwan National Health Insurance (NHI) Database was conducted. Participants included all individuals (N=23,422,955) who were actively registered in the NHI Database in 2013, 15,066 of whom had at least one first-degree relative with MG. We identified 8,638 parent–child relationships, 3,279 with an affected offspring, 3,134 with affected siblings, and 26 with affected twins. Prevalence and RRs of MG and other autoimmune diseases in the relatives of patients as well as the relative contributions of heritability, shared, and nonshared environmental factors to MG susceptibility were measured.
Results: RRs (95% confidence intervals [CIs]) for MG were 17.85 (8.71–36.56) for patients’ siblings, 5.33 (2.79–10.18) for parents, 5.82 (3.03–11.16) for offspring, and 1.42 (0.20–10.10) for spouses without genetic similarities. RRs (95% CIs) in individuals with a first-degree relative with MG were 2.18 (1.53–3.12) for systemic lupus erythematosus, 1.73 (1.09–2.74) for primary Sjögren’s syndrome, 1.90 (1.66–2.18) for autoimmune thyroid disease, and 1.68 (1.22–2.30) for rheumatoid arthritis. Accountability for the phenotypic variance of MG was 82.1% for familial transmission and 17.9% for nonshared environmental factors.
Conclusion: Individual risks of MG and other autoimmune diseases are increased in the relatives of patients with MG. Familial transmission of MG was estimated to be 82.1%.
Keywords: myasthenia gravis, familial risk, population based family study
Introduction
Myasthenia gravis (MG) is a heterogeneous neuromuscular autoimmune disease, occurring in different ethnic groups and both sexes. Clinical features of MG are diverse with mild ocular symptoms to severe generalized muscle weakness and disability. Prevalence and incidence of MG vary considerably. Incidence of MG ranges between 1.7 and 30 cases per million and its prevalence between 15 and 320 cases per million, depending on ethnicity and location.1–3 The most recent estimate of MG prevalence in Taiwan was 140 cases per million population.4
The etiology of MG is generally thought to involve a combination of genetic and environmental factors.5 The magnitude of its genetic contribution is uncertain. However, a review of several familial cases of MG6 suggests that familial factors play an important role in the pathogenesis of MG. Prior studies have shown that 1–7.1% of individuals with MG have a positive familial history for the disease.7 The twin model has been used to estimate the contribution of genetic factors to disease risk and compare disease concordance between monozygotic and dizygotic twins. Ramanujam et al8 showed that MG concordance was 35.5% in monozygotic twins compared to a dizygotic rate of 4–5%. Furthermore, MG has been reported to coaggregate with other autoimmune diseases9 and ~13% of MG patients reported other coexisting autoimmune diseases.10 Moreover, genome-wide association studies (GWAS) have successfully identified at least 12 susceptible loci and numerous single-nucleotide polymorphisms to estimate the heritability associated with MG.11
Few population-based studies have measured the contribution of genetic and environmental factors to MG susceptibility. Furthermore, estimates of the risk of MG and other autoimmune diseases have been associated with an MG family history and provide valuable information for genetic counseling in respect of affected families. In this study, we reconstructed a nationwide genealogy and linked the pedigrees to the health information from the National Health Insurance (NHI) Research Database, which covers the entire Taiwanese population. MG familial clustering was determined through estimating the risks of MG according to specific affected kinship links, and relative contributions of genetic, shared, and nonshared environmental factors to MG susceptibility were assessed. In addition, we further estimated the RRs of other autoimmune diseases in individuals with a positive MG family history.
Methods
Study population
This study was approved by the Institutional Review Board of the Chang Gung Memorial Hospital, Taiwan (IRB 201600658B0), with an exemption from obtaining informed consent as all data involved were totally anonymized. We identified all NHI 2013 beneficiaries as our source population. Individuals without a valid insurance status were excluded from this analysis. The NHI coverage rate was over 99.5% in 2013.12 The unique personal identification number assigned to each resident in Taiwan was used to permit valid internal linkages within the database. NHI database contained registration information and original claims data of all NHI beneficiaries, including birth date, sex, family relationships, vital statistics, place of residence, enrollment, employment categories, discharge dates, insurance fees, medical diagnoses, medical expenditures, operations, procedures, and dates of inpatient and outpatient visits.
Identification of first-degree relatives of MG patients
Methods to identify NHI Research Database first-degree relatives and familial associations have been reported previously.13 In general, parent–offspring or spouse relationships can be directly identified, while full siblings can be identified through their parents. Twins were defined as full siblings with the same date of birth (±1 day), but twin zygosity could not be identified in the database. Individuals were grouped into families according to the relationship and correlation among individuals from the same family.13 Among the 29,505,197 NHI beneficiaries (both alive and dead between March 1, 1995 and December 31, 2013), 7,856,663 individuals were registered as single, without any identifiable relative. The remaining 21,648,534 individuals were classified into 4,042,209 families. Overall, 22,689,489 parent–child relationships, 18,347,866 full sibling pairs, and 381,082 twin pairs were identified. Each individual may appear multiple times in different categories of family relationships depending on their family structure. Data analysis was conducted between January 1 and May 31, 2016.
Ascertainment of MG and other autoimmune diseases
Individuals suspected of having autoimmune diseases are usually referred to specialists for further diagnosis in Taiwan. A waiver, known as a catastrophic certificate, is given when the National Insurance Administration confirms the MG diagnosis, following a review and verification process undertaken by a commissioned expert panel. International classification of disease (ICD) 9 codes (358.00 and 358.01) for MG were included. ICD9 code 358.1 (myasthenic syndromes) was not included. In this study, patients diagnosed with MG or other autoimmune diseases, including rheumatoid arthritis (RA), systemic lupus erythematosus (SLE), Sjögren’s syndrome, and autoimmune thyroid disease, were identified as catastrophic illness patients and entitled to waive medical copayments. Information on the Registry for Catastrophic Illness Patients contains diagnosis, demographics, application date, the diagnosing physician, unique personal identification codes, and other administration data of beneficiaries with the certificate.
Covariates
Sex, age, occupation categories, income level quintiles, residential level of urbanization, and family size were considered as confounding factors that could modify the familial associations of MG.14
Statistical analysis
MG prevalence was calculated for the general population and individuals with affected first-degree relatives. Those who were diagnosed as having MG, per MG definition, between January 1, 1996 and December 31, 2013, and had valid insurance registrations in 2013 were indicated as prevalent cases.
Relative risks (RRs) estimated in this study are essentially the relative recurrence risks according to the original Risch definition;15 there are prevalence ratios between individuals with a specific type of affected relative and the general population. We used the Breslow-Cox proportional hazards model, which estimated the prevalence rate ratios in a cross-sectional study through applying a same follow-up time for all individuals. This method has been used to make consistent estimates for prevalence ratios close to true limits.16 In addition, this model assumes independence among the participants. We used the marginal model to address potential bias because of within-family clustering.17 The RR was adjusted for age, sex, socioeconomic factors, and family size. We calculated RRs for individuals with affected first-degree relatives of any kinship and for individual kinships (parent, offspring, sibling, and twin). We excluded twins from the sibling analyses. In addition to first-degree relatives, we estimated RRs for spouses. We excluded all half-sibling from analysis.
Heritability was defined as the phenotypic variance proportion that is attributable to genetic factors; familial transmission involved the sum of heritability and shared environmental contributions. Both familial transmission and heritability can be calculated with the polygenic liability model.18 In this study, we used the threshold liability model to estimate these variables.19 The original model assumes no effect on common environmental variance; thus, familial transmission equals heritability. We also restricted the family history to first-degree relatives and assumed a mean of two siblings in a family. MG-associated thymoma was also analyzed. We further estimated the familial co-aggregation extent of other autoimmune diseases in affected families using the marginal Cox proportional hazards model, with a same follow-up time for all participants adjusting for age, sex, place of residence, income levels, occupation, and family size. RRs of RA, SLE, primary Sjögren’s syndrome, and autoimmune thyroid disease were estimated as the adjusted prevalence ratios of specified autoimmune diseases between individuals with affected first-degree relatives and those without an MG family history. All analyses were performed using the SAS, Version 9.3 (SAS Institute Inc., Cary, NC, USA), and two-sided P-values £0.05 were considered statistically significant.
Results
MG prevalence in individuals with affected first-degree relatives versus the general population
The study population comprised 23,422,955 individuals enrolled in the NHI Research Database in Taiwan in 2013. Among them, the proportions of individuals with a known parent, child, sibling, or twin were 47.45, 57.45, 47.29, and 1.51%, respectively. We identified 6,638 patients diagnosed with MG, giving a crude prevalence of 0.028%. In the general population of Taiwan in 2013, 15,066 (0.064%) individuals had at least one first-degree relative with MG: 8,638 with affected parents, 3,279 with an affected offspring, 3,134 with affected siblings, and 26 with affected twins. The mean ± SD age of the MG patients was lower in those with a family history of MG (36.3±18.3 years) than in those without a family history (39.0±20.9 years; P<0.001 using the Student’s t-test). MG prevalence in the first-degree relatives with a family history was higher (0.205%) than in those without a family history (0.028%). Age-specific MG prevalence was higher in individuals with affected first-degree relatives with MG than in the general population (Figure 1). Furthermore, onset age-specific MG prevalence was markedly higher in individuals with affected first-degree relatives than in the general population in two age onset group fields (0–9 and 30–39) (Figure 2). Other characteristics of the study population are shown in Table 1. In addition, there were 8.21% of MG patients who had thymoma compared to 0.01% in the general population.
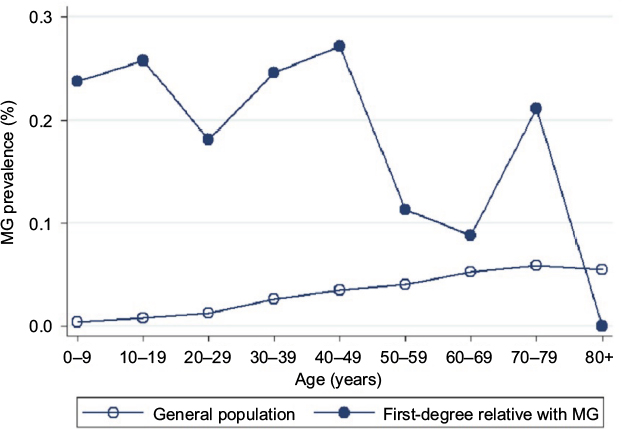 | Figure 1 Age-specific prevalence of myasthenia gravis in individuals with a first-degree (circle) relative affected with MG and in the general population (hollow circle) in Taiwan in 2013. Note: This figure demonstrates a significantly higher prevalence of MG in most age bands among those with a family history than the general population. Abbreviation: MG, myasthenia gravis. |
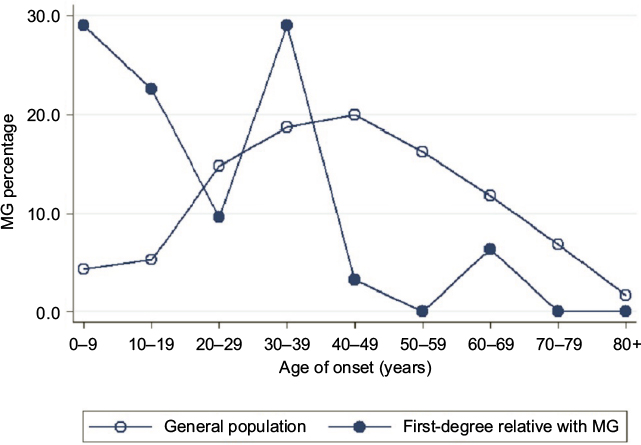 | Figure 2 Comparison of the onset age of MG in affected patients with (circle) and without (hollow circle) a family history in 2013. Abbreviation: MG, myasthenia gravis. |
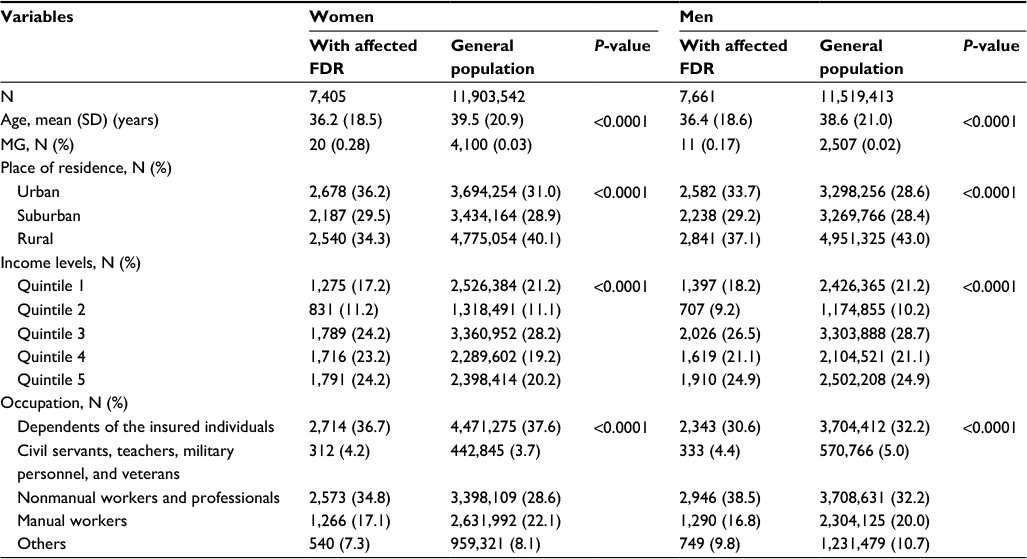 | Table 1 Baseline characteristics of individuals with affected first-degree relatives with myasthenia gravis and the general population Abbreviations: FDR, first-degree relative; MG, myasthenia gravis. |
RRs for MG in individuals with affected first-degree relatives
Table 2 shows the prevalence (RR) of MG in individuals with affected first-degree relatives, according to different relationships and sexes of the affected individuals and their families. Overall, having affected first-degree relatives with MG was associated with an adjusted RR of 7.78 (95% confidence interval [CI] 4.80–12.60) for the disease. Individuals with male- and female-affected relatives had respective MG RRs of 7.50 (95% CI 3.93.15–14.33) and 8.01 (95% CI 4.46–14.41), suggesting that the sex of the affected relative did not influence the RR. In MG, the genetic distance degree among family relatives is associated with RRs. RRs of MG were 17.85 (95% CI 8.71–36.56) in siblings, 5.82 (95% CI 3.03–11.16) in offspring, and 5.33 (95% CI 2.79–10.18) in parents.
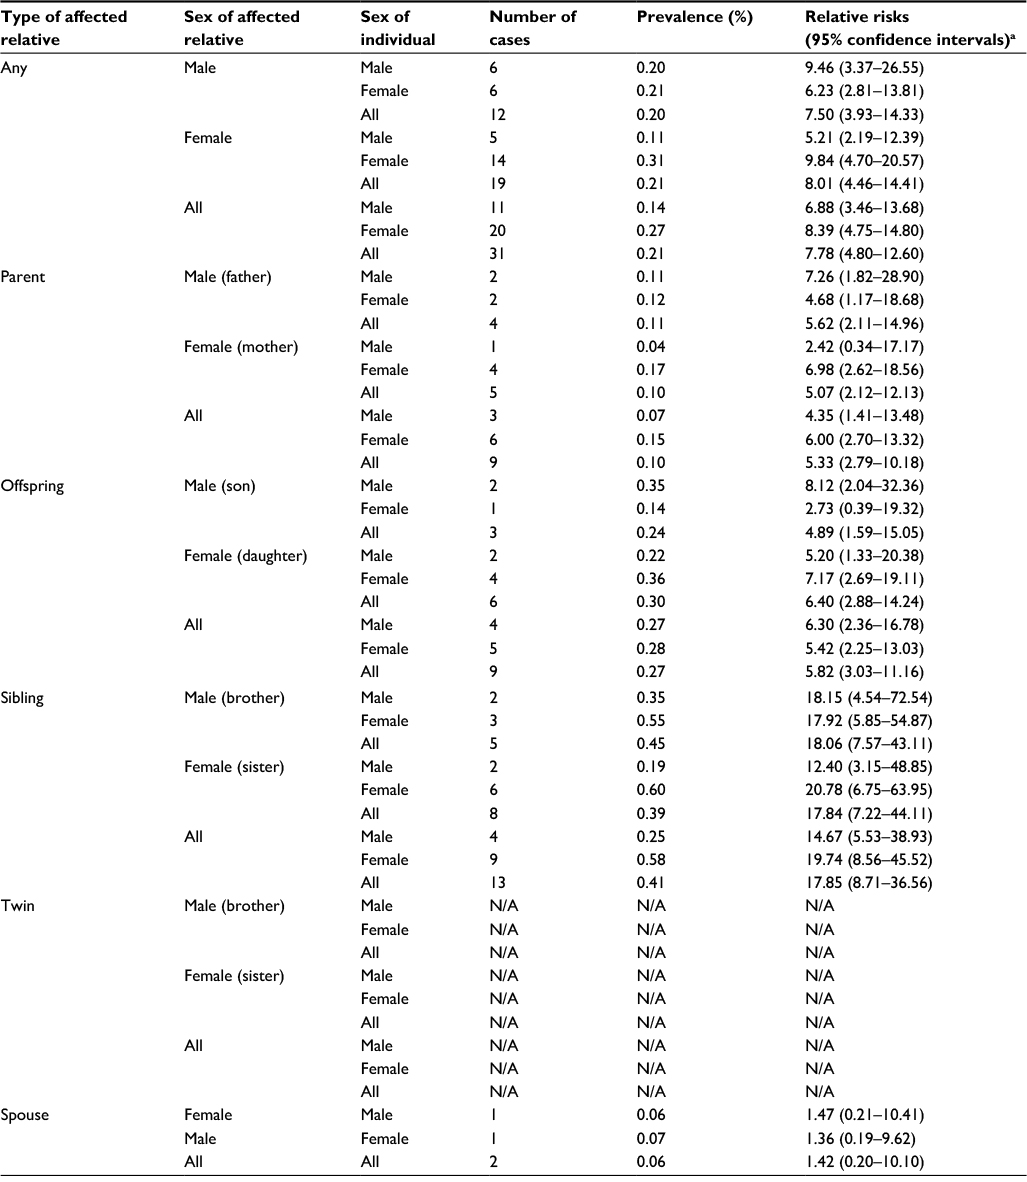 | Table 2 Relative risks for myasthenia gravis in first-degree relatives Notes: aAdjusted for age, sex, place of residence, quintiles of income levels, occupation, and family size. N/A because of no MG cases with affected twin. Abbreviations: MG, myasthenia gravis; N/A, not applicable. |
Coaggregation of other autoimmune diseases
Table 3 shows the adjusted RRs (95% CIs) for other autoimmune diseases in individuals with affected first-degree relatives than in the general population. RR in individuals with first-degree relatives affected with MG was 2.18 (1.53–3.12) for SLE, 1.73 (1.09–2.74) for primary Sjögren’s syndrome, 1.68 (1.22–2.30) for RA, and 1.90 (1.66–2.18) for autoimmune thyroid disease.
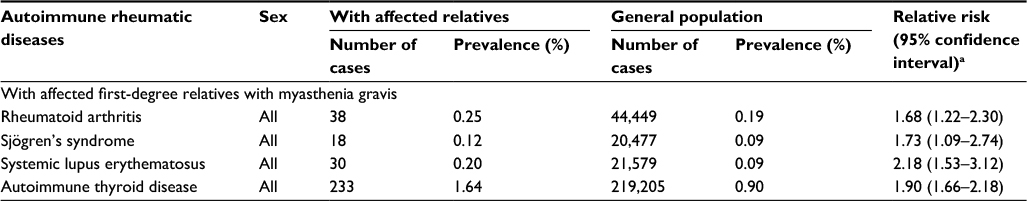 | Table 3 Relative risks of other autoimmune diseases in individuals with affected first-degree relatives affected with myasthenia gravis Note: aAdjusted for age, sex, place of residence, quintiles of income levels, occupation, and family size. |
Familial resemblance and heritability of MG
Using the threshold liability model, we estimated that the accountability for the phenotypic variance of MG was 82.1% for familial transmission and 17.9% for nonshared environmental factors. Given the parameters estimated previously, the probability of the case of an MG patient to be sporadic was 83.5%.
Discussion
This population-based study investigated the risk of MG in individuals with affected first-degree relatives and estimated the heritability and familial transmission of the disease in the general population. Prevalence of MG in the relatives of patients is 7.78-fold higher than in the general population. We observed that genetic distance is associated with the amplitude of risk, and heritability was estimated to be 75.8%. Most MG cases are expected to be sporadic. Furthermore, a higher prevalence of other autoimmune diseases is noted in individuals with affected first-degree relatives than in the general population. Our results indicate several implications. First, the study provides objective quantitative data to evaluate the RRs, familial transmission, and sporadic proportion of MG patients, which are valuable in clinical estimation. Second, information from large populations may help future genetic studies to estimate candidate genes. Third, coaggregation and overlapping pathogenesis of MG with other autoimmune diseases need further elucidations.
Several studies on families with MG patients have been reported.7 However, investigation of familial aggregation and evidence for familial or genetic contributions are rare. This study provides evidence to support the importance of familial effects in MG susceptibility. Familial occurrence of MG is estimated at ~1–7.3%.20 Familial MG tends to occur at a younger age, but some also develop late-onset MG cases (with an onset age of ≥65 years).21 In general, the incidence of younger-onset MG is higher than elderly onset MG.20 However, its incidence has shifted to an advanced age group due to some environmental factors.22 In our study, age-specific MG prevalence was generally higher in the first-degree relatives of MG patients than in the general population. Onset age-specific MG prevalence was particularly higher in the younger-aged individuals than in the general population. Sex is an important confounding factor in several autoimmune diseases.23 Most early-onset MG patients comprise a greater number of women.24 A recent study suggested that women are more predisposed to MG than men because of some risk alleles.5 However, sex differences in MG were not found in the present study. According to the genetic distance analysis, sibling RRs were higher than parental or offspring RRs under the same genetic distance, suggesting that shared environmental factors also contribute to MG susceptibility. Using the polygenic liability model, we estimated that 75.8% of the phenotypic variance can be explained due to familial factors and most MG cases appeared to be sporadic rather than familial.
MG has been studied for >30 years, and genetic factors were thought to contribute to its development. Previous reports showed that the human leukocyte antigen (HLA) locus remains the main genetic risk factor for MG.25 GWAS cases from European and American populations provide an evidence that major histocompatibility complex class II locus, TNIP1, and PTPN22 have been suggested as susceptibility factors for autoimmune MG.26 In addition, the CTLA4 gene has been found to be involved in MG.5,27 HLA-B*08, PTPN22, and TNIP1 were also associated with an early-onset MG.26
Aside from genetic factors contributing to MG, shared environmental factors also play a key role in familial clustering of MG. Previous reports have shown that lower socioeconomic status,28 start of smoking at an early age,28 hepatitis virus (B or C) infection,29 and the postpartum period30 are important environmental MG risk factors, which are dependent on geographical variations.31 We modified the work of Lai and Tseng4 and reviewed previous epidemiological studies of MG (Table 4).31–40 In Northern Europe, the prevalence of MG subgroups is lower in Norway than in the Netherlands, and differences in geographical north–south gradients have also been found between these populations.31 Genetic and environmental factors are likely to be associated with MG in different areas and reflect gene–environmental interactions.40 The etiology of MG is possibly affected depending on geographical variations. Studies have reported that hepatitis infected patients are potentially at a higher risk of MG.29 In addition, socioeconomic status and smoking habits may also affect MG development.28 Therefore, this implies that both genetic and shared environmental factors may influence the phenotypic variance in MG. This study uses the threshold liability model to separate shared and nonshared environmental factors. We compared the liability scale between siblings and spouses in a population setting, which assumes that spouses share environmental factors and siblings share both genes and family environment. Therefore, a further comparison with liability of the general population could partition the phenotypic variance into shared, nonshared, and genetic contributions. We considered age, sex, and socioeconomic factors in the regression model to estimate familial RR, but the model ensures that the overall variations contributed by all the factors are used.
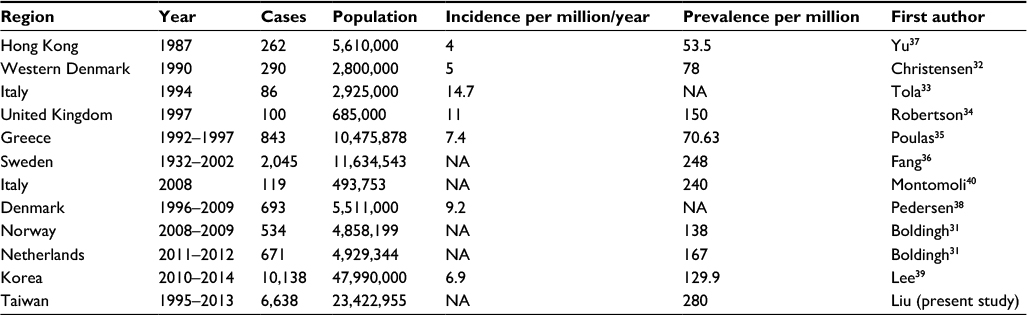 | Table 4 Epidemiological studies of MG in different countries Abbreviations: MG, myasthenia gravis; NA, not available. |
Familial risk and coaggregation of autoimmune diseases with MG have not been studied well. A previous systematic review analyzed English language studies on MG subtypes from 1960 to 2010, and the pooled estimate was 13% (95% CI 12–14%) for MG with coexisting autoimmune diseases.10 Recent reports have shown that autoimmune thyroid diseases share a lot of these factors with RA and SLE, which is expected as RA and SLE often coexist with MG.41 Our results suggest that some autoimmune diseases contribute to MG pathogenesis, but the magnitude of overlapping factors contributing to the disease manifestation is different. The national population data of familial autoimmune disease co-aggregation provide useful information for counseling families of patients with MG.
There are some limitations in this study. First, the NHI Research Database is primarily a health insurance database, which lacks complete information on laboratory data, physical examinations, and clinical findings. Classification of MG cases was through the patients’ diagnoses recorded in the registry with catastrophic illnesses or classification depended on primary care records. However, all MG diagnoses require strong medical evidence to issue catastrophic illness certificates. Therefore, misclassification is considered rare and is unlikely to affect our conclusion. Patients with less severe diseases may not have received a certificate; therefore, they were not identified as cases. Furthermore, the number of these cases is thought to be small. Patients with MG stratified by antibody status were mainly classified into acetylcholine receptor, muscle-specific kinase, lipoprotein related protein 4, and agrin subsets.42 As cause and classification of MG subgroup by antibody status could not be analyzed with the health insurance secondary database, this remains a limitation of this study. Second, some first-degree relative MG sporadic cases may have been lost. Third, our results are limited to the population of Taiwan. Further studies outside of Taiwan are needed. We considered that there was little chance for misclassification. However, it is likely that the total number of MG cases is an underestimation as milder forms of the disease may not have qualified for a catastrophic certificate.
Conclusion
This nationwide family study confirms that an MG family history is associated with a high risk for the disease. Differential risk associated with different kinships suggests a strong genetic component in MG susceptibility. An MG family history also confers an elevated risk of other autoimmune diseases. Our findings may help improve the design of future familial and genetic MG risk studies and may also be useful in counseling families of patients with MG.
Acknowledgments
This study was based in part on data from the NHIRD provided by the Bureau of National Health Insurance, Department of Health, and managed by the National Health Research Institutes. The interpretation and conclusions contained herein do not represent the views of the Bureau of National Health Insurance, Department of Health, or of the National Health Research Institutes. This work was funded by the National Science Council of Taiwan (project nos 103-2314-B-182A-070-MY2 and 103-2314-B-182-043-MY2) and Chang Gung Memorial Hospital (project nos CMRPG3F1011, CMRPG3D1671, and CORPG3E0131).
Disclosure
The authors report no conflicts of interest in this work.
References
Carr AS, Cardwell CR, McCarron PO, McConville J. A systematic review of population based epidemiological studies in myasthenia gravis. BMC Neurol. 2010;10:46. | ||
McGrogan A, Sneddon S, de Vries CS. The incidence of myasthenia gravis: a systematic literature review. Neuroepidemiology. 2010;34(3):171–183. | ||
Breiner A, Widdifield J, Katzberg HD, Barnett C, Bril V, Tu K. Epidemiology of myasthenia gravis in Ontario, Canada. Neuromuscul Disord. 2016;26(1):41–46. | ||
Lai CH, Tseng HF. Nationwide population-based epidemiological study of myasthenia gravis in Taiwan. Neuroepidemiology. 2010;35(1):66–71. | ||
Sun L, Meng Y, Xie Y, et al. CTLA4 variants and haplotype contribute genetic susceptibility to myasthenia gravis in northern Chinese population. PLoS One. 2014;9(7):e101986. | ||
Feng HY, Liu WB, Luo CM, et al. A retrospective review of 15 patients with familial myasthenia gravis over a period of 25 years. Neurol Sci. 2012;33(4):771–777. | ||
Salvado M, Canela M, Ponseti JM, et al. Study of the prevalence of familial autoimmune myasthenia gravis in a Spanish cohort. J Neurol Sci. 2016;360:110–114. | ||
Ramanujam R, Pirskanen R, Ramanujam S, Hammarstrom L. Utilizing twins concordance rates to infer the predisposition to myasthenia gravis. Twin Res Hum Genet. 2011;14(2):129–136. | ||
Bello-Sani F, Anumah FE, Bakari AG. Myasthenia gravis associated with autoimmune thyroid disease: a report of two patients. Ann Afr Med. 2008;7(2):88–90. | ||
Mao ZF, Yang LX, Mo XA, et al. Frequency of autoimmune diseases in myasthenia gravis: a systematic review. Int J Neurosci. 2011;121(3):121–129. | ||
Giraud M, Vandiedonck C, Garchon HJ. Genetic factors in autoimmune myasthenia gravis. Ann N Y Acad Sci. 2008;1132:180–192. | ||
Bureau of National Health Insurance, Department of Health, Executive Yuan [webpage on the Internet]. The National Health Insurance Statistics; 2013. Available from: http://www.nhi.gov.tw/English/webdata/webdata.aspx?menu=11&menu_id=296&WD_ID=296&webdata_id=4645. Accessed September 14, 2014. | ||
Kuo CF, Grainge MJ, Valdes AM, et al. Familial aggregation of systemic lupus erythematosus and coaggregation of autoimmune diseases in affected families. JAMA Intern Med. 2015;175:1518–1526. | ||
Liu CY, Hung YT, Chuang YL, Chen YJ, Weng WS, Liu JS. Incorporating development stratification of Taiwan townships into sampling design of large scale health interview survey. J Health Manag. 2006;14:1–22. | ||
Risch N. Linkage strategies for genetically complex traits. I. Multilocus models. Am J Hum Genet. 1990;46(2):222–228. | ||
Barros AJ, Hirakata VN. Alternatives for logistic regression in cross-sectional studies: an empirical comparison of models that directly estimate the prevalence ratio. BMC Med Res Methodol. 2003;3:21. | ||
Lin DY. Cox regression analysis of multivariate failure time data: the marginal approach. Stat Med. 1994;13(21):2233–2247. | ||
Reich T, Rice J, Cloninger CR, Wette R, James J. The use of multiple thresholds and segregation analysis in analyzing the phenotypic heterogeneity of multifactorial traits. Ann Hum Genet. 1979;42(3):371–390. | ||
Kuo CF, Grainge MJ, See LC, et al. Familial aggregation of gout and relative genetic and environmental contributions: a nationwide population study in Taiwan. Ann Rheum Dis. 2015;74(2):369–374. | ||
Murai H, Yamashita N, Watanabe M, et al. Characteristics of myasthenia gravis according to onset-age: Japanese nationwide survey. J Neurol Sci. 2011;305(1–2):97–102. | ||
Hirunagi T, Tsujikawa K, Hasegawa Y, Mano K, Katsuno M. Elderly-onset familial myasthenia gravis in two siblings. Neuromuscul Disord. 2016;26(6):347–349. | ||
Casetta I, Groppo E, De Gennaro R, et al. Myasthenia gravis: a changing pattern of incidence. J Neurol. 2010;257(12):2015–2019. | ||
Ngo ST, Steyn FJ, McCombe PA. Gender differences in autoimmune disease. Front Neuroendocrinol. 2014;35(3):347–369. | ||
Meriggioli MN, Sanders DB. Autoimmune myasthenia gravis: emerging clinical and biological heterogeneity. Lancet Neurol. 2009;8(5):475–490. | ||
Vincent A, Palace J, Hilton-Jones D. Myasthenia gravis. Lancet. 2001; 357(9274):2122–2128. | ||
Gregersen PK, Kosoy R, Lee AT, et al. Risk for myasthenia gravis maps to a (151) Pro→Ala change in TNIP1 and to human leukocyte antigen-B*08. Ann Neurol. 2012;72(6):927–935. | ||
Wang XB, Pirskanen R, Giscombe R, Lefvert AK. Two SNPs in the promoter region of the CTLA-4 gene affect binding of transcription factors and are associated with human myasthenia gravis. J Intern Med. 2008;263(1):61–69. | ||
Maniaol AH, Boldingh M, Brunborg C, Harbo HF, Tallaksen CM. Smoking and socio-economic status may affect myasthenia gravis. Eur J Neurol. 2013;20(3):453–460. | ||
Halfon P, Levy M, San Marco M, et al. Myasthenia gravis and hepatitis C virus infection. J Viral Hepat. 1996;3(6):329–332. | ||
Boldingh MI, Maniaol AH, Brunborg C, Weedon-Fekjaer H, Verschuuren JJ, Tallaksen CM. Increased risk for clinical onset of myasthenia gravis during the postpartum period. Neurology. 2016;87(20):2139–2145. | ||
Boldingh MI, Maniaol AH, Brunborg C, et al. Geographical distribution of myasthenia gravis in northern Europe – results from a population-based study from two countries. Neuroepidemiology. 2015;44(4):221–231. | ||
Christensen PB, Jensen TS, Tsiropoulos I, et al. Incidence and prevalence of myasthenia gravis in western Denmark: 1975 to 1989. Neurology. 1993;43(9):1779–1783. | ||
Tola MR, Caniatti LM, Casetta I, et al. Immunogenetic heterogeneity and associated autoimmune disorders in myasthenia gravis: a population-based survey in the province of Ferrara, northern Italy. Acta Neurol Scand. 1994;90(5):318–323. | ||
Robertson NP, Deans J, Compston DA. Myasthenia gravis: a population based epidemiological study in Cambridgeshire, England. J Neurol Neurosurg Psychiatry. 1998;65(4):492–496. | ||
Poulas K, Tsibri E, Kokla A, et al. Epidemiology of seropositive myasthenia gravis in Greece. J Neurol Neurosurg Psychiatry. 2001;71(3):352–356. | ||
Fang F, Sveinsson O, Thormar G, et al. The autoimmune spectrum of myasthenia gravis: a Swedish population-based study. J Intern Med. 2015;277(5):594–604. | ||
Yu YL, Hawkins BR, Ip MS, Wong V, Woo E. Myasthenia gravis in Hong Kong Chinese. 1. Epidemiology and adult disease. Acta Neurol Scand. 1992;86(2):113–119. | ||
Pedersen EG, Hallas J, Hansen K, Jensen PE, Gaist D. Late-onset myasthenia not on the increase: a nationwide register study in Denmark, 1996-2009. Eur J Neurol. 2013;20(2):309–314. | ||
Lee HS, Lee HS, Shin HY, Choi YC, Kim SM. The epidemiology of myasthenia gravis in Korea. Yonsei Med J. 2016;57(2):419–425. | ||
Montomoli C, Citterio A, Piccolo G, et al. Epidemiology and geographical variation of myasthenia gravis in the province of Pavia, Italy. Neuroepidemiology. 2012;38(2):100–105. | ||
Tamer S, Gokce Gunes HN, Gokcal E, Yoldas TK. Coexistence of autoimmune diseases and autoantibodies in patients with myasthenia gravis. Neurol India. 2016;64(1):45–49. | ||
Gilhus NE, Verschuuren JJ. Myasthenia gravis: subgroup classification and therapeutic strategies. Lancet Neurol. 2015;14(10):1023–1036. |
 © 2017 The Author(s). This work is published and licensed by Dove Medical Press Limited. The
full terms of this license are available at https://www.dovepress.com/terms.php
and incorporate the Creative Commons Attribution
- Non Commercial (unported, v3.0) License.
By accessing the work you hereby accept the Terms. Non-commercial uses of the work are permitted
without any further permission from Dove Medical Press Limited, provided the work is properly
attributed. For permission for commercial use of this work, please see paragraphs 4.2 and 5 of our Terms.
© 2017 The Author(s). This work is published and licensed by Dove Medical Press Limited. The
full terms of this license are available at https://www.dovepress.com/terms.php
and incorporate the Creative Commons Attribution
- Non Commercial (unported, v3.0) License.
By accessing the work you hereby accept the Terms. Non-commercial uses of the work are permitted
without any further permission from Dove Medical Press Limited, provided the work is properly
attributed. For permission for commercial use of this work, please see paragraphs 4.2 and 5 of our Terms.