Back to Journals » Advances in Medical Education and Practice » Volume 14
Faculty and Students’ Perspective of Health Informatics Programs in Saudi Arabia
Authors Alzghaibi HA ![]()
Received 18 May 2023
Accepted for publication 6 October 2023
Published 30 October 2023 Volume 2023:14 Pages 1193—1207
DOI https://doi.org/10.2147/AMEP.S413742
Checked for plagiarism Yes
Review by Single anonymous peer review
Peer reviewer comments 2
Editor who approved publication: Dr Md Anwarul Azim Majumder
Haitham Ali Alzghaibi
Department of Health Informatics, College of Public Health and Health Informatics, Qassim University, Albukayriah, 52741, Saudi Arabia
Correspondence: Haitham Ali Alzghaibi, Email [email protected]
Background: Health Informatics is a discipline that deals with the acquisition, storage, retrieval and use of health data, information, and technologies for the purpose of improving healthcare quality. It involves the application of information science methods to analyse health information for improved problem solving and healthcare delivery. The use of information system applications in healthcare is increasingly popular and includes the use of applications like medical records, order entry, medical knowledge provision, imaging, as well as guidelines and other types of decision support.
Aim: To examine health informatics undergraduate programs in Saudi Arabian government universities.
Methods: This study follows a quantitative, descriptive cross-sectional design using a self-reported, electronic questionnaire. The data was collected using an online questionnaire via Google Forms. Probability stratified random sampling was utilized.
Result and Conclusion: Findings revealed a response rate at 79% (n=184) of students and 67% (n=38) of faculty members. Variation was detected in the level of agreement toward the examined six variables. Both students and faculty members express same level of agreement toward all variables. A significant correlation was determined between facilities and other variables such as students’ involvement, research, admission and curriculum. Similarly, there is a significant relationship between students’ involvement and curriculum with research, demission, faculty members role and outcomes.
Keywords: health informatics, bachelor’s in health informatics, Saudi universities, education, curriculums
Corrigendum for this paper has been published.
Introduction
Health Informatics (HI) is a discipline that deals with the acquisition, storage, retrieval and use of health data, information and technologies for the purpose of improving healthcare quality.1,2 It involves the application of information science methods to analyse health information for improved problem solving and healthcare delivery.3 The use of information system applications in healthcare is increasingly popular and includes the use of applications like medical records, order entry, medical knowledge provision, imaging, as well as guidelines and other types of decision support.4
HI, also called medical informatics, is an interdisciplinary field that cuts across various disciplines including information science, computer science and health care It is complemented by related fields with similar areas of focus. For instance, biomedical informatics, which refers to the storage, retrieval and use of biomedical information, data and knowledge.3 Bioinformatics, on the other hand, is the application of technology to the biological sciences in order to acquire, analyse, store and visualize biological data. Similarly, clinical informatics is the application of information technology to problems in clinical care. With regard to management of health data, the term health information management is often used. It refers to the management of health data and information as captured in medical or health records. With health records becoming increasingly electronic, health information management tends to overlap with aspects of HI.3,5
The growing interest in the area of HI and the demand for expertise in this field have given rise to an expansion of educational opportunities with degrees at all levels.3,5,6 This has also led to the revision of the HI or medical informatics education structure in 2010 by the International Medical Informatics Association (IMIA). The changes are aimed at meeting the educational needs of a wide range of health professionals, from medicine, nursing and healthcare management to dentistry, pharmacy, public health, health record administration and informatics. It is also developed for the purpose of dedicated programs in biomedical and HI.7
Education in informatics is available at community college level, baccalaureate, master’s and doctoral levels. At community college level, training programs are aimed at preparing workers for technical duties under the supervision of an expert. Academic programs usually consist of coursework in information science, including one health or biomedical domain. There is also strong computational emphasis present throughout the curriculum.3 Other common focus areas in HI educational programs include evidence-based medicine, disease management, complex medicine and population health management.5
Interested students may come from a health or medical professional background, seeking knowledge and skills in information science and technology. On the other hand, they may already possess knowledge and skills in information science and technology, but lack preparation or knowledge in the health sciences.3 HI experts, also known as health informaticians or informaticists, are trained to carry out research in HI, and serve as intermediaries between technical personnel and physicians and nurses. They can also be involved in the design and development of systems. They may also support medical staff in determining requirements for new applications.4
The Bachelor of HI degree offered at the Saudi governmental universities is a four-year-long program that consists of courses in health-care informatics, health-care administration, and clinical informatics. During their studies, students also have the opportunity to specialize in a particular field of health informatics that best represents their interests and helps them achieve their desired career goal. Students gain a strong understanding of information systems and health informatics, as well as how to apply these concepts to health care Finally, Saudi governmental universities are fully supervised, monitored and regulated by the Saudi Ministry of Educational (MoE)8,9
This study aims to examine health informatics undergraduate programs in Saudi Arabian governmental universities.
To compare health informatics programs in Saudi Arabian governmental universities
To determine the differences between students and faculty members perspectives about undergraduate programs in health informatics
To identify the main strengths and weaknesses of undergraduate programs in health informatics in Saudi Arabia
What this study adds
- This study provides comprehensive insight about HI programs in SA from two different populations.
- This study presents a useful data collection tool to evaluate bachelor programs, especially health programs where core internship program is embedded.
- This study also provides useful guide for policymakers in education, program tutors, and curriculum designers.
- This study includes several indicators about the level of HI programs quality and weaknesses
Methods and Materials
This study follows quantitative, descriptive cross-sectional design using self-reported, electronic questionnaire composed of pre-defined items and response options.10–12 To achieve the study aim, I designed a specific online questionnaire using google forms. The utilized questionnaire is divided into three main sections. The first was a letter that explained the nature of the study, the significance of their involvement and their right to withdraw at any moment. Furthermore, the letter described how their responses would be handled and how their participation would be kept anonymous. The second part of the questionnaire seeks demographic information about the participants, specifically gender, age, and university name. The third part of the questionnaire is divided into six main themes each theme represents a significant factor to evaluate bachelor programs. These factors were determined from previous similar published studies. The determined factors are Facilities,13,14 students’ involvements,15 curriculum,14,16,17 research,14,18 admission,19–21 roles of faculty staff,14,22–24 outcome,25,26 and internship,27–29 for full list of items see Table 1. Participants were asked to rate each question on a scale from “strongly disagree” to “strongly agree.” as follows: Strongly Disagree (1); Disagree (2); Neutral (3); Agree (4); and Strongly Agree (5). Although two data collection instruments were disrupted, they are very similar. The only difference between them was the demographic questions to ensure the appropriateness of such a questionnaire to the targeted populations. For instance, students were asked about their level of study, while faculty members were asked about their position.
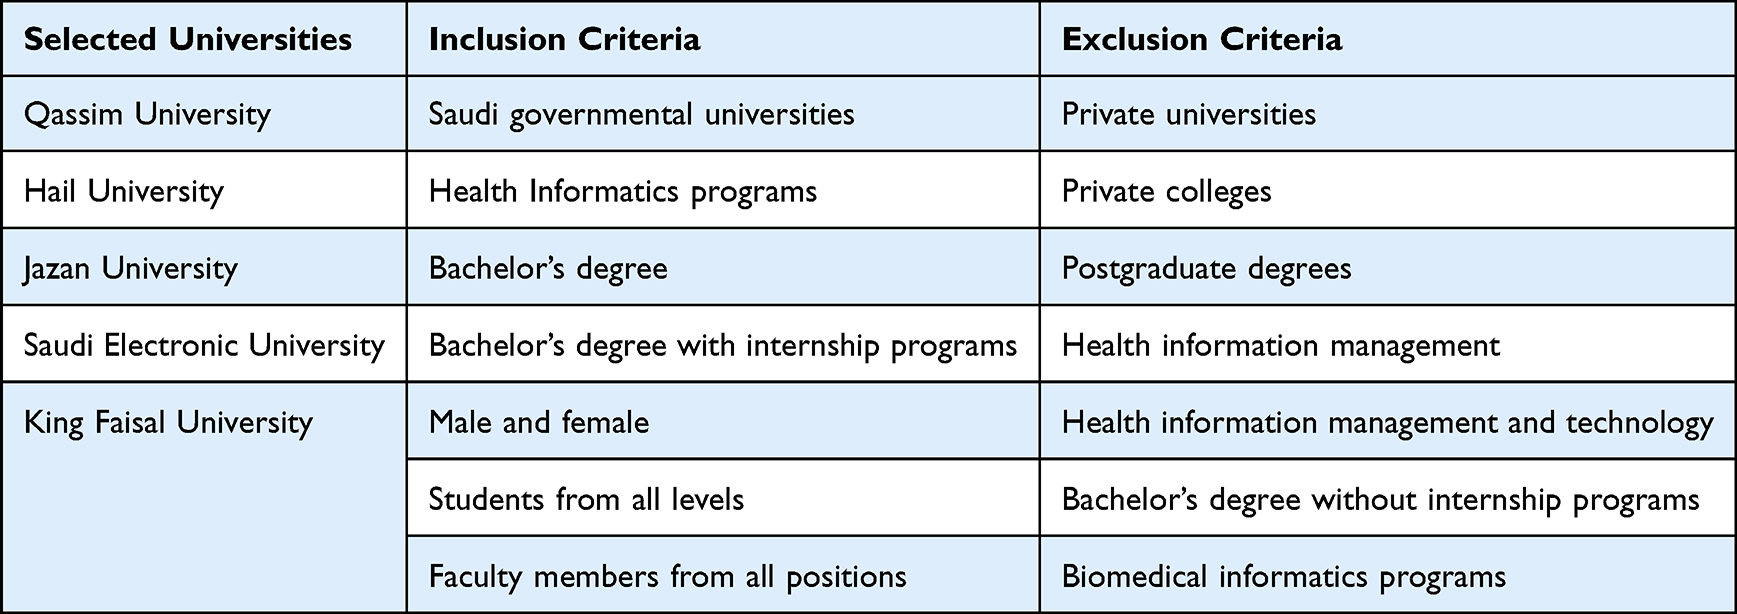 |
Table 1 Name of the Selected Universities and Selection Criteria |
Questionnaire Validity
The preliminary instrument was subjected to review by expert panels, which included external experts such as head of academic department, heads of students affairs and academic department, faculty members. The purpose of the expert panels was to assess the questionnaire’s content, ensure its relevance to the target population, and evaluate the clarity and understandability of the questions. Based on their feedback, demographic questions such as participant gender and level of involvement were added, and adjustments were made to the Likert scale response options to reduce them from eight to seven.
Following the review and feedback from the expert panels, a pilot study was conducted with a small group of project team members (n=9) at Qassim University. The participants were selected based on criteria such as different position levels, departments, and nationalities. The aim of the pilot study was to gather feedback on the questionnaire’s quality, including readability, comprehensiveness, appropriateness, and clarity. Participants were asked specific questions to assess their understanding of the questionnaire and provide suggestions for improvement.
Each participant in the pilot study completed the first draft of the questionnaire and provided comments and feedback on the process, questionnaire administration time, and clarity of the questions. The responses from the pilot study indicated that no additional questions needed to be included or excluded. Overall, the questionnaire was deemed relatively clear and easy to complete. Minor spelling, grammar, and numbering modifications were made based on the feedback to enhance clarity and readability. The pilot study was conducted over a two-week period in September 2022. Volunteer feedback was incorporated into the final version of the questionnaire, as the modifications required were minor.
Population and Sampling
In this research, the targeted population consists of all undergraduate students (n=589) and faculty members (n=66) enrolled in the HI programs at Saudi governmental universities n=5. Probability stratified random sampling was utilized.30,31 Therefore, five governmental universities have been selected as seen in Table 2. The selection of the universities was made through several inclusion and exclusion criteria (see Table 1). Based on a sample size calculation with 95% confidence level and 5% margin of error, a questionnaire was distributed to 233 students and 57 faculty members.
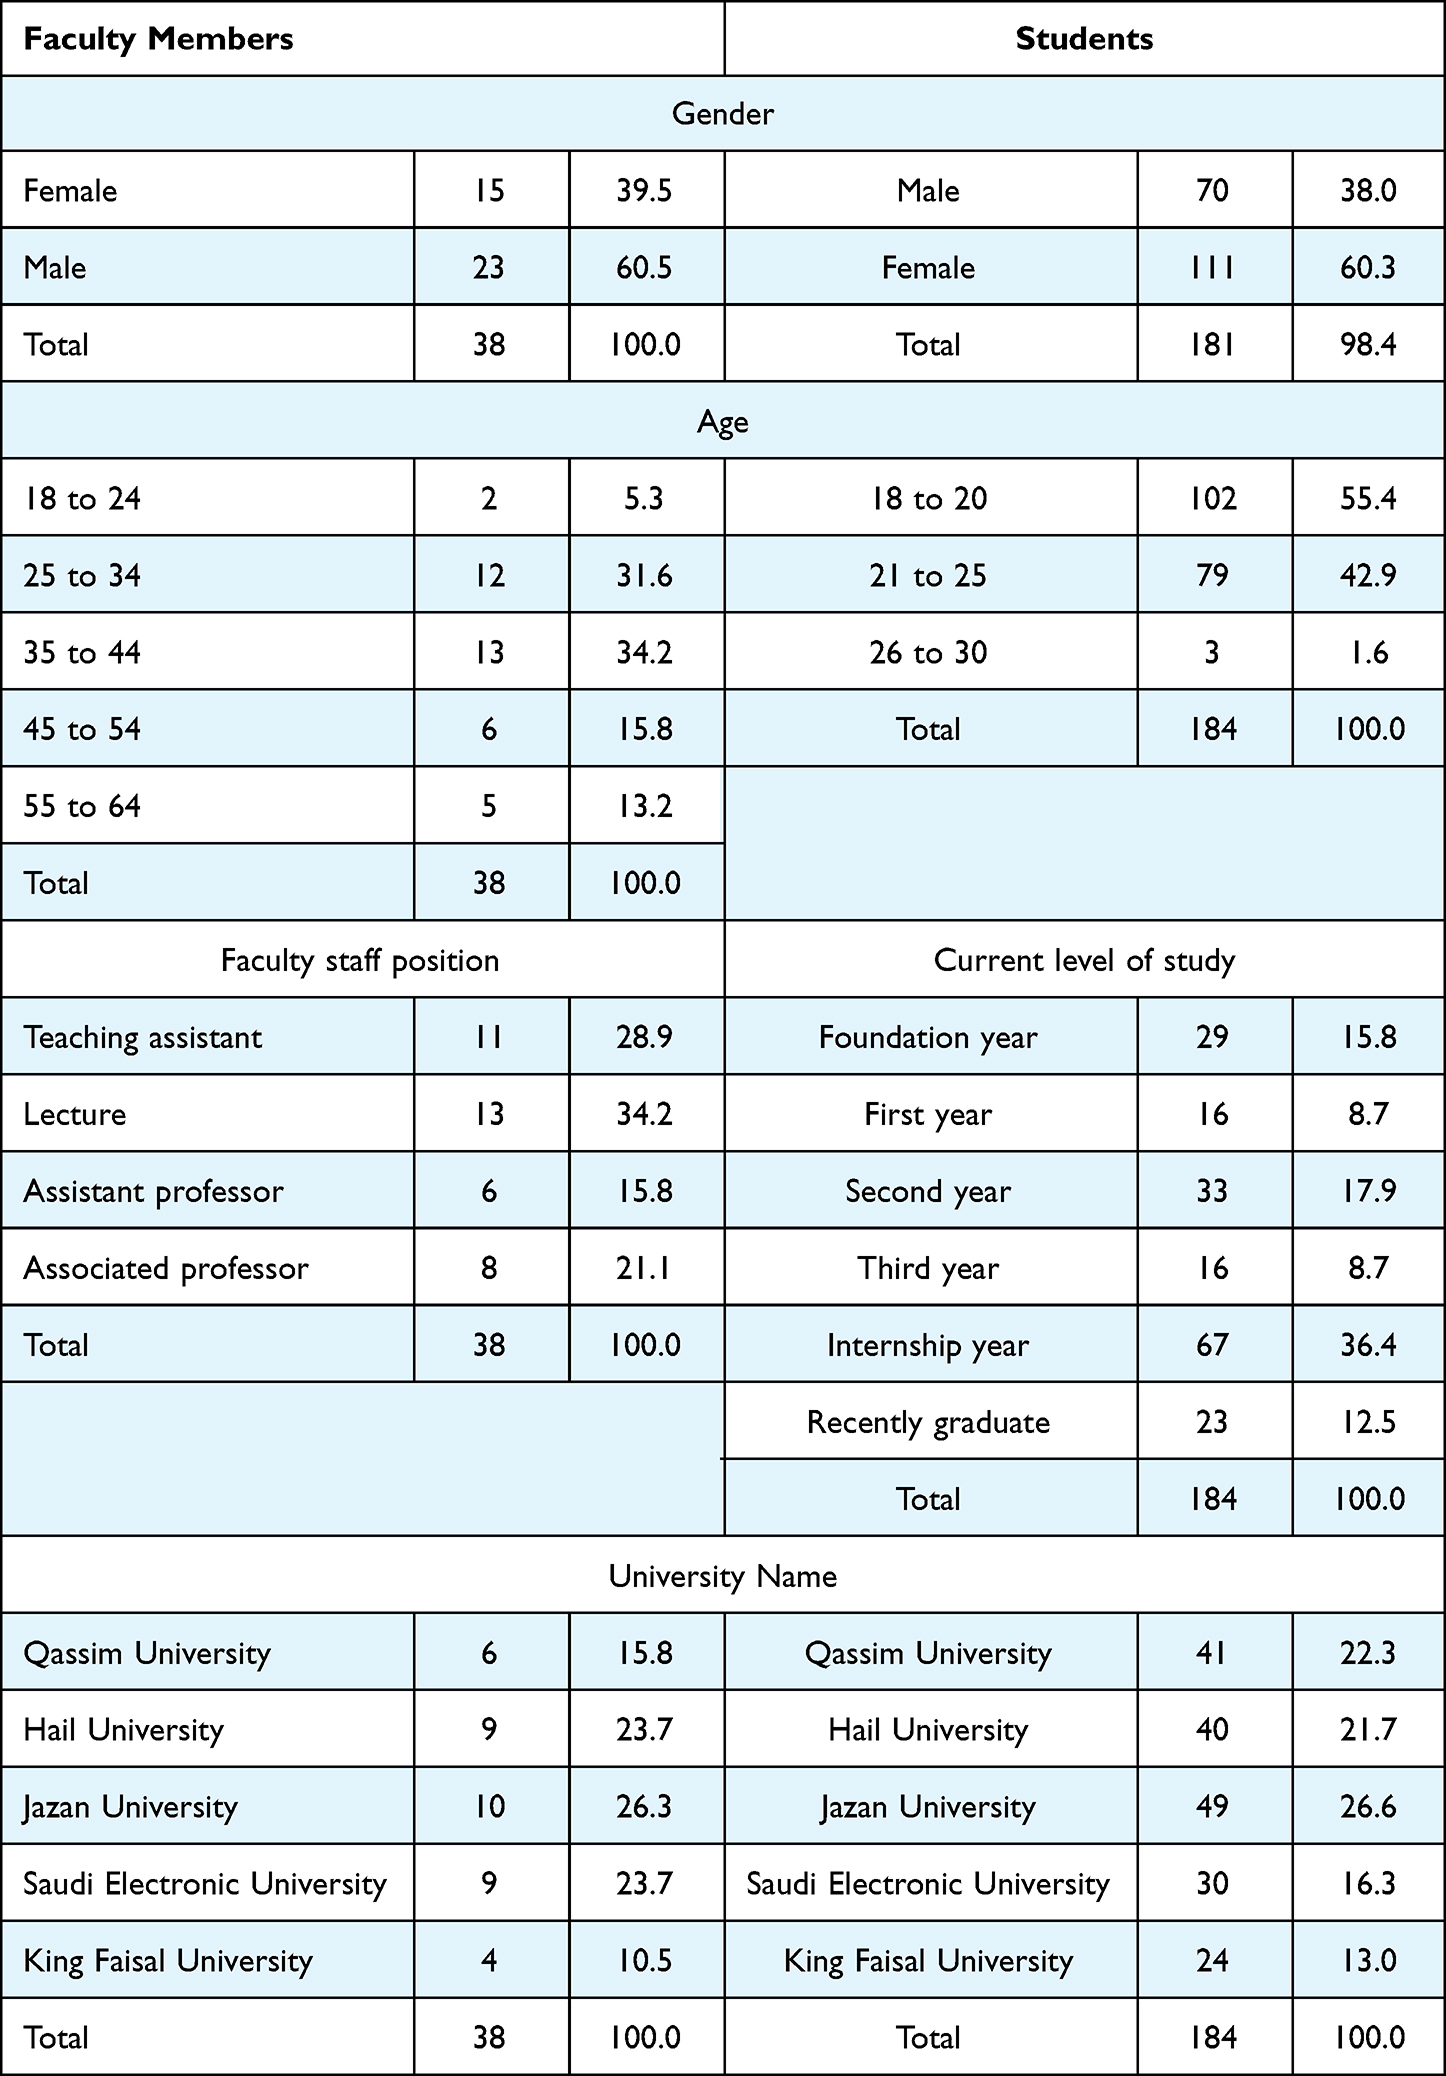 |
Table 2 Distribution of Participants Based on Gender, Age, Faculty Staff Position, Students Level of Study, and University Name |
Data Analysis
All questionnaire data was coded in numerical groups and entered into IBM SPSS, Version 29. Initially, the reliability test was performed using Cronbach’s alpha. Following that, an early descriptive analysis of the questionnaire data was performed. Moreover, inferential statistics were performed to determine any significant differences between groups or correlation between variables.
Result
Initially, Cronbach’s alpha test show that data collection instrument was statistically reliable a=0.84. Findings reveal a response rate at 79% (n=184) of students and 67% (n=38) of faculty members.
Table 2 presents information on the distribution of faculty members and students based on various factors. In terms of gender, the faculty members consist of 15 females (39.5%) and 23 males (60.5%), while the student population includes 111 females (60.3%) and 70 males (38.0%). This indicates a higher representation of female students compared to faculty members, with a slightly higher proportion of male faculty members. Regarding age, faculty members span a wider range of ages. Among them, 2 (5.3%) are in the 18 to 24 age group, 12 (31.6%) are aged 25 to 34, 13 (34.2%) are aged 35 to 44, 6 (15.8%) fall in the 45 to 54 age range, and 5 (13.2%) are aged 55 to 64. On the other hand, the student population is predominantly younger, with 102 (55.4%) falling in the 18 to 20 age range, 79 (42.9%) in the 21 to 25 range, and only 3 (1.6%) in the 26 to 30 range.
Examining faculty staff positions, there are 11 teaching assistants (28.9%), 13 lecturers (34.2%), 6 assistant professors (15.8%), and 8 associate professors (21.1%). For the students, their distribution across different levels of study includes 29 (15.8%) in the foundation year, 16 (8.7%) in the first year, 33 (17.9%) in the second year, 16 (8.7%) in the third year, 67 (36.4%) in the internship year, and 23 (12.5%) who have recently graduated. Lastly, the table presents the distribution of faculty members and students among various universities. Among the faculty members, Qassim University has 6 (15.8%), Hail University has 9 (23.7%), Jazan University has 10 (26.3%), Saudi Electronic University has 9 (23.7%), and King Faisal University has 4 (10.5%). Comparatively, the students are distributed as follows: Qassim University with 41 (22.3%), Hail University with 40 (21.7%), Jazan University with 49 (26.6%), Saudi Electronic University with 30 (16.3%), and King Faisal University with 24 (13.0%).
Table 3 provides descriptive statistics regarding students’ perceptions of various aspects related to their academic program in Health Informatics (HI). A total of 184 students participated in the survey, with a few missing responses across different items. The responses were measured on a Likert scale, with values ranging from 0 to 5, and the median values are reported.
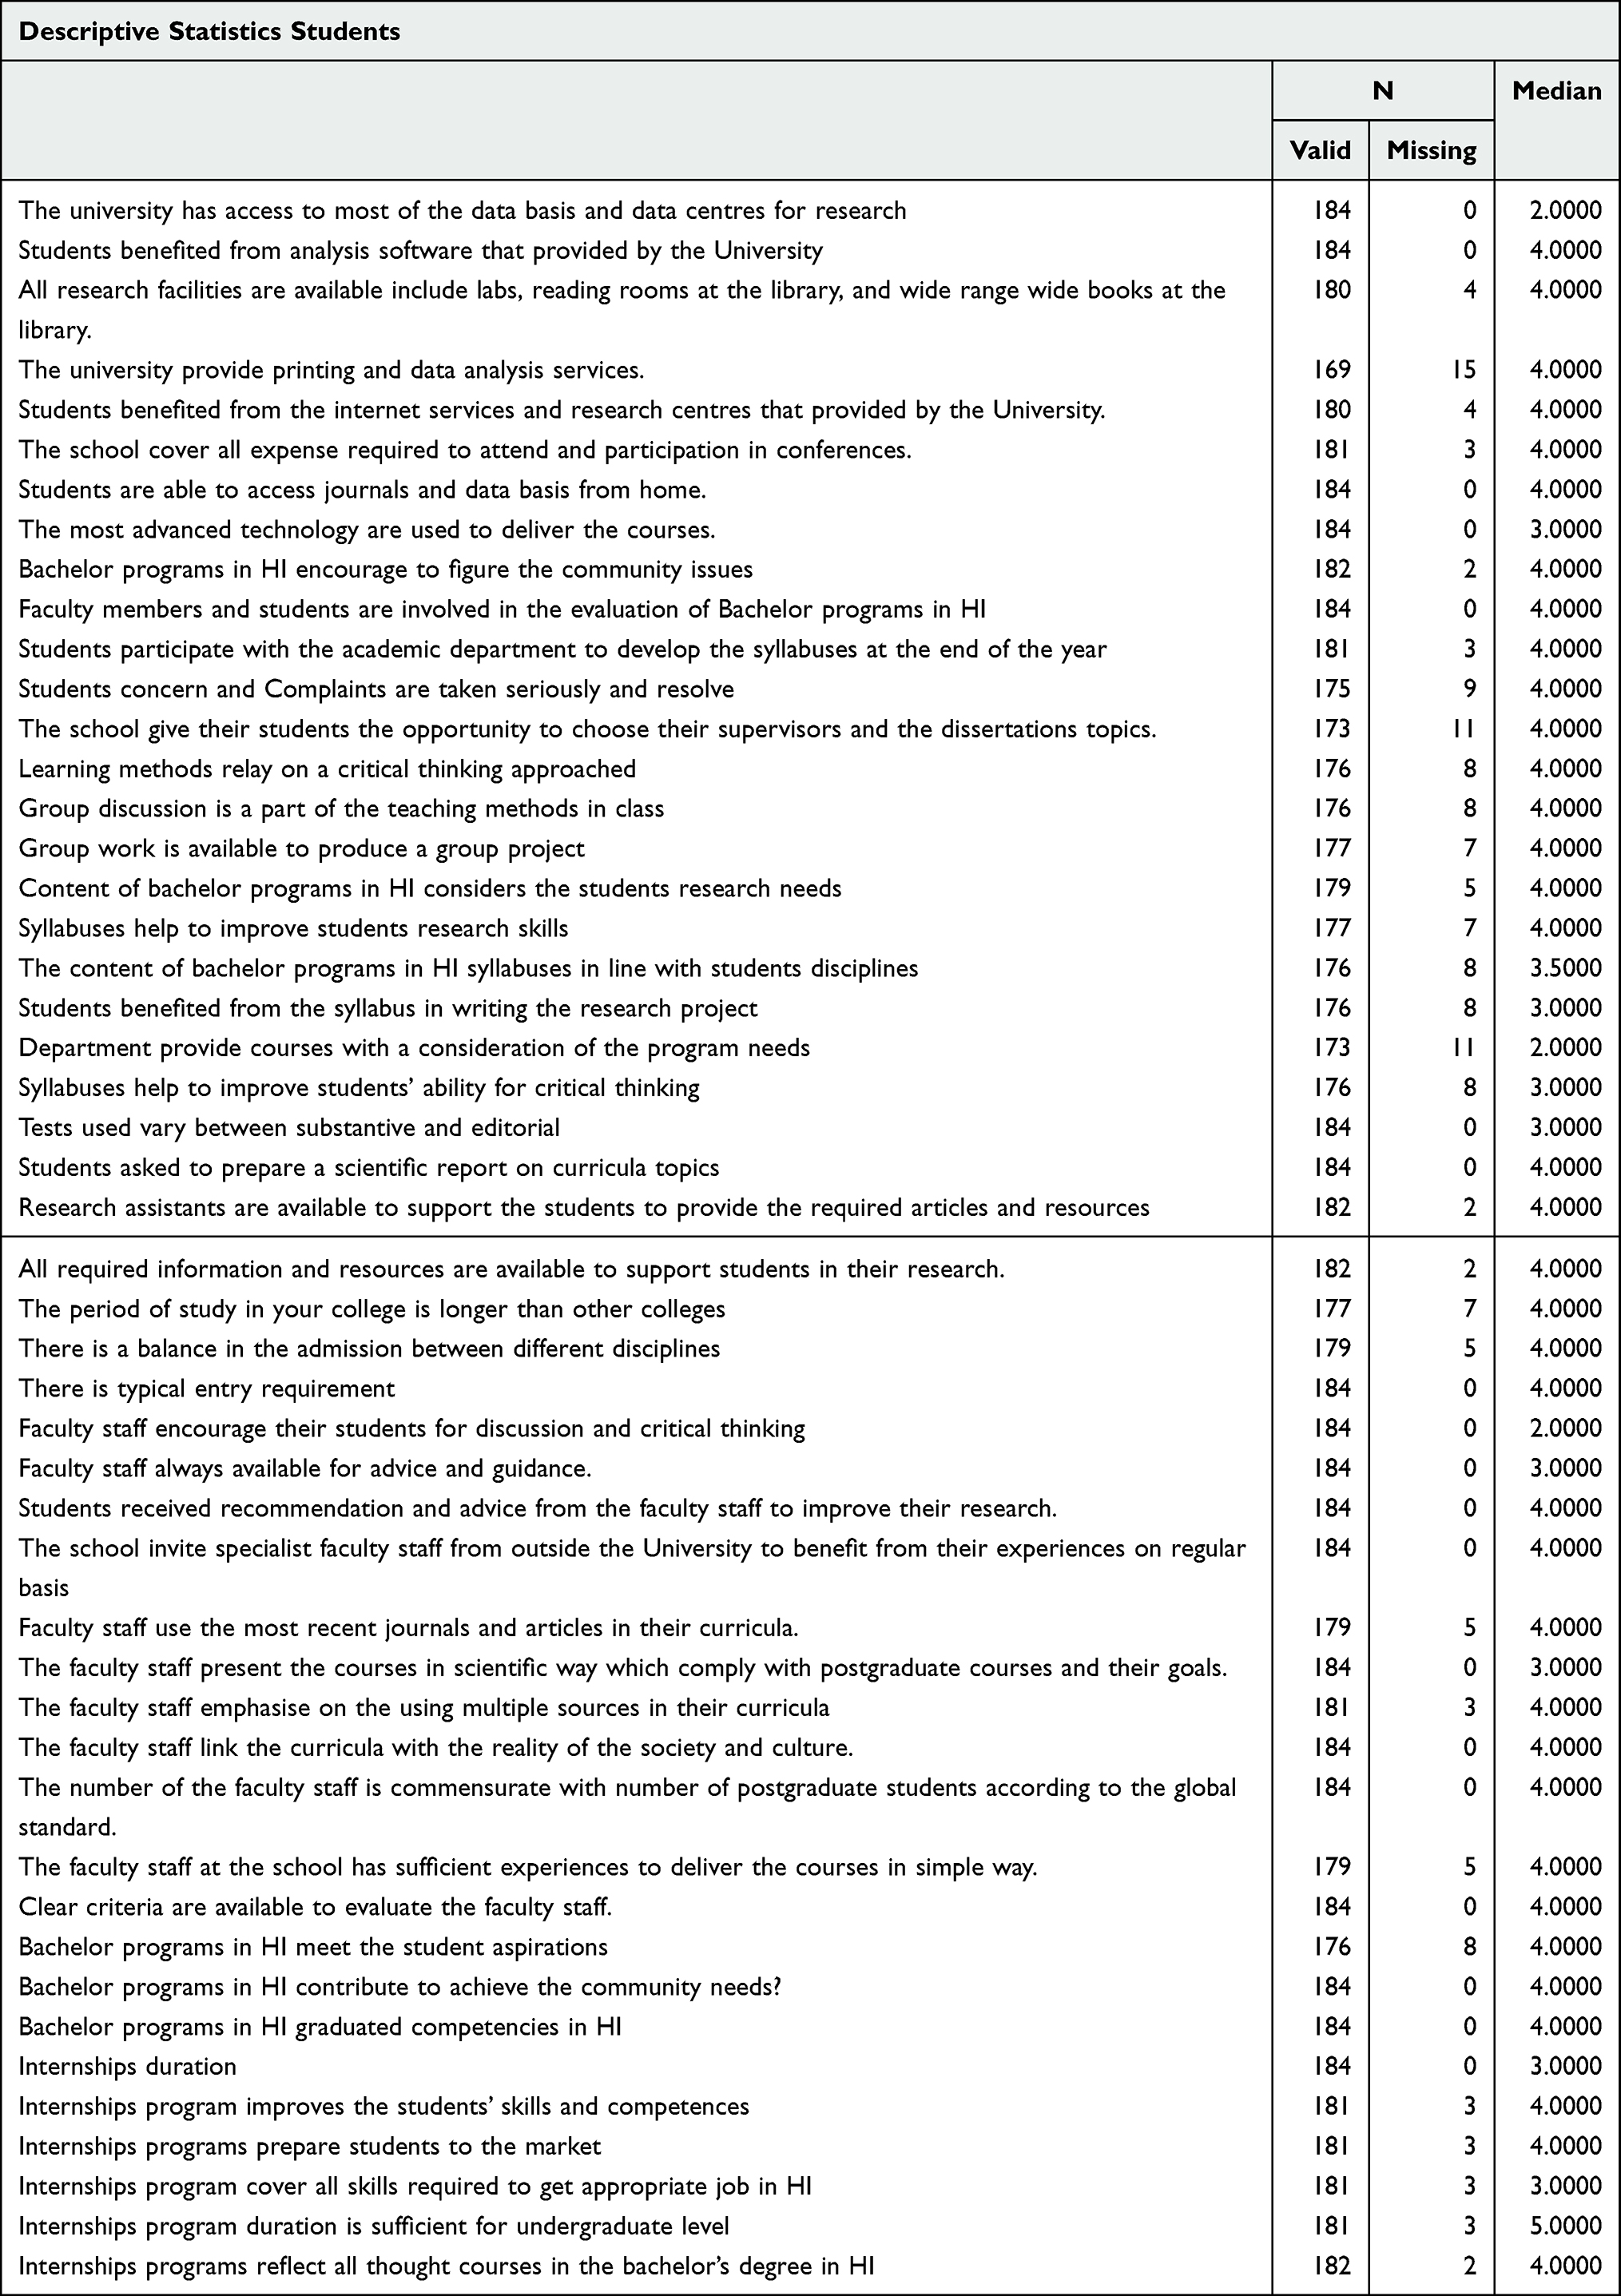 |
Table 3 Descriptive Statistics of Student’s Responses |
Overall, the data indicates positive perceptions of the academic program. For instance, students highly valued the university’s access to data bases and data centers for research (median: 2.00) and the availability of analysis software provided by the university (median: 4.00). They also acknowledged the presence of comprehensive research facilities, including labs and reading rooms at the library, along with access to a wide range of books (median: 4.00). The university’s provision of printing and data analysis services (median: 4.00) and the availability of internet services and research centers (median: 4.00) were also positively perceived.
Furthermore, the academic program was praised for its focus on research and community engagement. Students indicated that the program encouraged them to address community issues (median: 4.00) and involved both faculty members and students in the evaluation of bachelor programs (median: 4.00). The program also emphasized the importance of student input, as students participated in developing syllabi (median: 4.00) and were given the opportunity to choose their supervisors and dissertation topics (median: 4.00). Additionally, the program was recognized for fostering critical thinking skills through learning methods and group discussions (median: 4.00).
Students expressed satisfaction with the availability of resources and support for their research projects. They reported that all required information and resources were available to support their research (median: 4.00), and research assistants were accessible to provide necessary articles and resources (median: 4.00). The program’s emphasis on scientific reports and the encouragement of students to prepare them (median: 4.00) further supported research skills development. Moreover, internships were seen as beneficial, contributing to the improvement of students’ skills and competences (median: 4.00) and preparing them for the job market (median: 4.00).
Table 4 presents descriptive statistics regarding faculty members’ perceptions of various aspects related to the academic program in Health Informatics (HI). The data include responses from 38 faculty members, with no missing values reported. The responses were measured on a Likert scale, ranging from 0 to 5, with the median values provided.
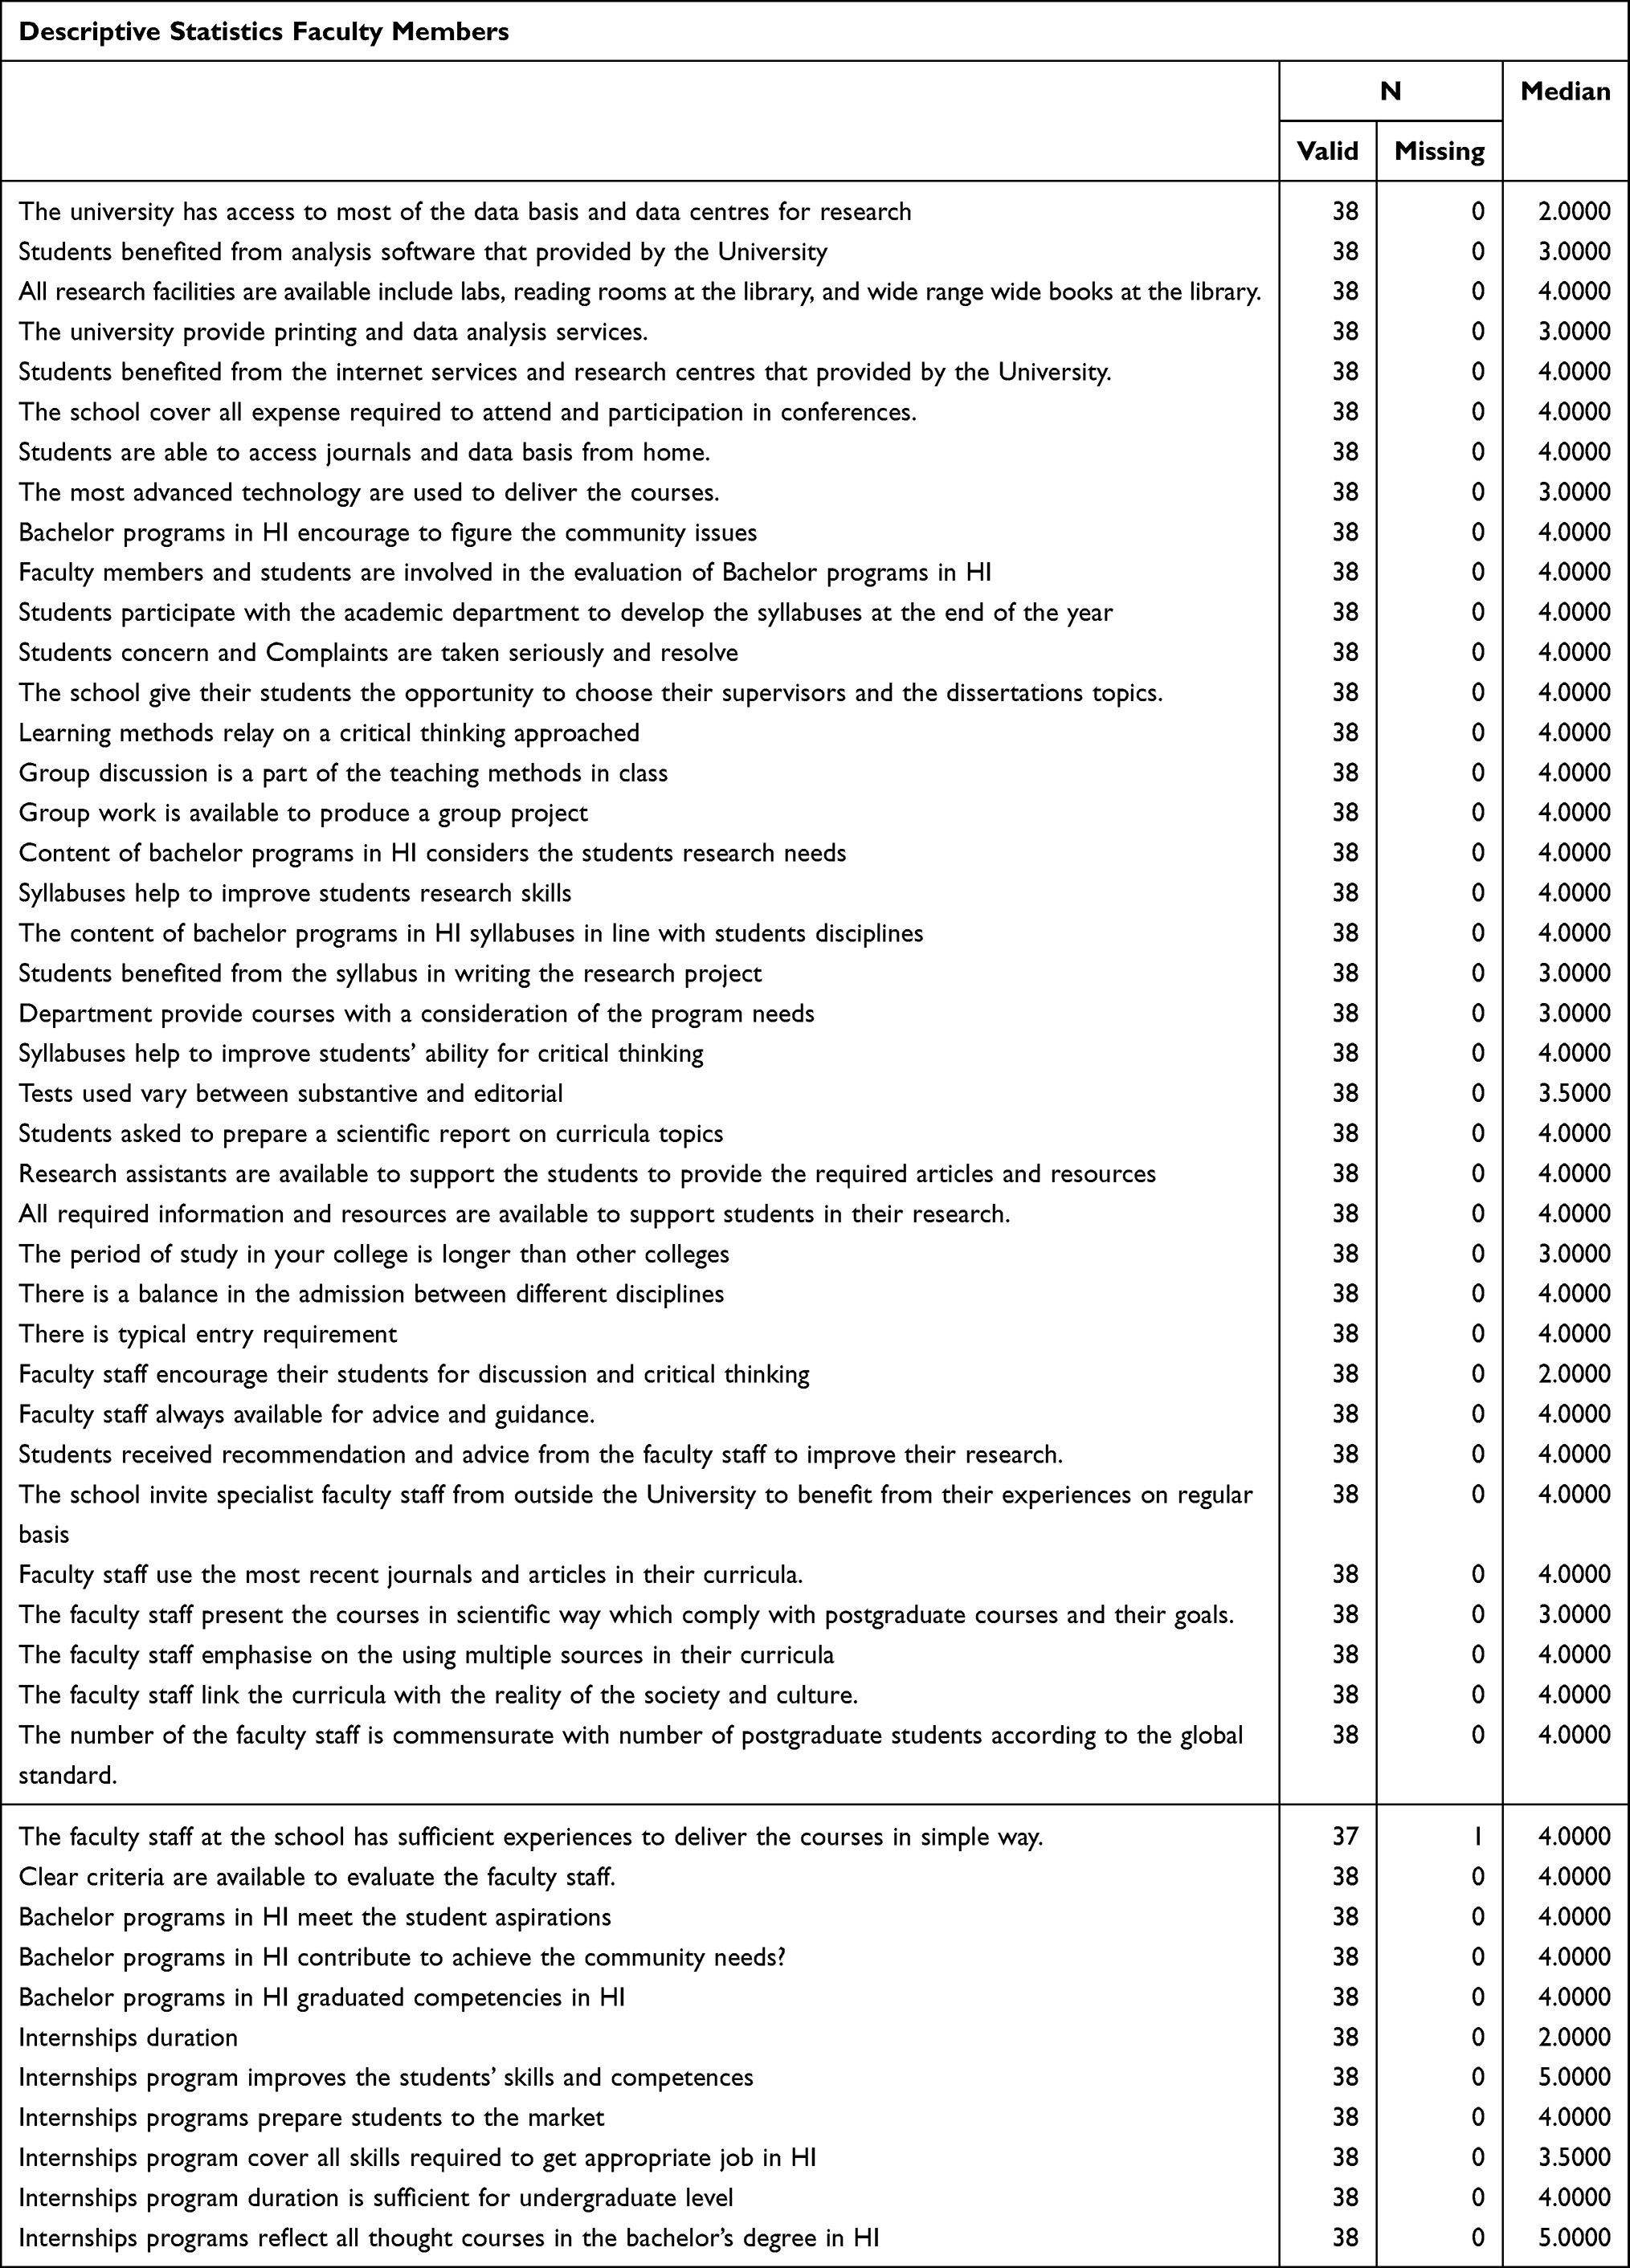 |
Table 4 Descriptive Statistics of Faculty Members Responses |
Overall, faculty members displayed positive perceptions of the academic program. They acknowledged the university’s access to data bases and data centers for research (median: 2.00) and the availability of analysis software provided by the university (median: 3.00). Faculty members also recognized the presence of comprehensive research facilities, including labs, reading rooms at the library, and a wide range of books (median: 4.00). They further acknowledged the university’s provision of printing and data analysis services (median: 3.00) and the availability of internet services and research centers (median: 4.00).
Faculty members highlighted the program’s emphasis on research, community engagement, and student involvement. They noted that bachelor programs in HI encourage students to address community issues (median: 4.00) and involve both faculty members and students in program evaluations (median: 4.00). Faculty members also indicated that students participate in the development of syllabi (median: 4.00) and have the opportunity to choose their supervisors and dissertation topics (median: 4.00). Moreover, faculty members emphasized the use of critical thinking in learning methods (median: 4.00) and the inclusion of group discussions (median: 4.00) and group work for project production (median: 4.00).
Faculty members acknowledged the program’s focus on improving students’ research skills and meeting their research needs through syllabi (median: 4.00). They also recognized the availability of research resources and support for students (median: 4.00) and the involvement of research assistants (median: 4.00) in providing necessary articles and resources. Furthermore, faculty members appreciated the program’s linkages with the reality of society and culture (median: 4.00) and the use of recent journals and articles in the curricula (median: 4.00).
Regarding internships, faculty members considered them to be of sufficient duration for undergraduate level (median: 4.00) and recognized their effectiveness in improving students’ skills and competences (median: 5.00). They also indicated that internships prepare students for the job market (median: 4.00) and cover the skills required to obtain appropriate jobs in HI (median: 3.50). Additionally, faculty members noted that internships reflect the courses taught in the bachelor’s degree program in HI (median: 5.00).
Table 5 shows that faculty members have a mean score of 3.11, while students have a mean score of 3.29 on facilities and faculty members have a mean score of 3.41, whereas students have a mean score 3.51 on students’ involvement. Similarly, faculty members and students have a mean score 3.33 on curriculum and faculty members have a mean score of 3.55, while students have a mean score of 3.51 on research. Furthermore, faculty members have a mean score of 3.39, though students have a mean score of 3.58 on admission and faculty members have a mean score of 3.43, while students have a mean score of 3.35 on role of faculty staff. Similarly, faculty members have a mean score of 3.64, although students have a mean score of 3.79 on the outcome and faculty members have a mean score of 4.06, whereas students have a mean score of 3.75 on internship program.
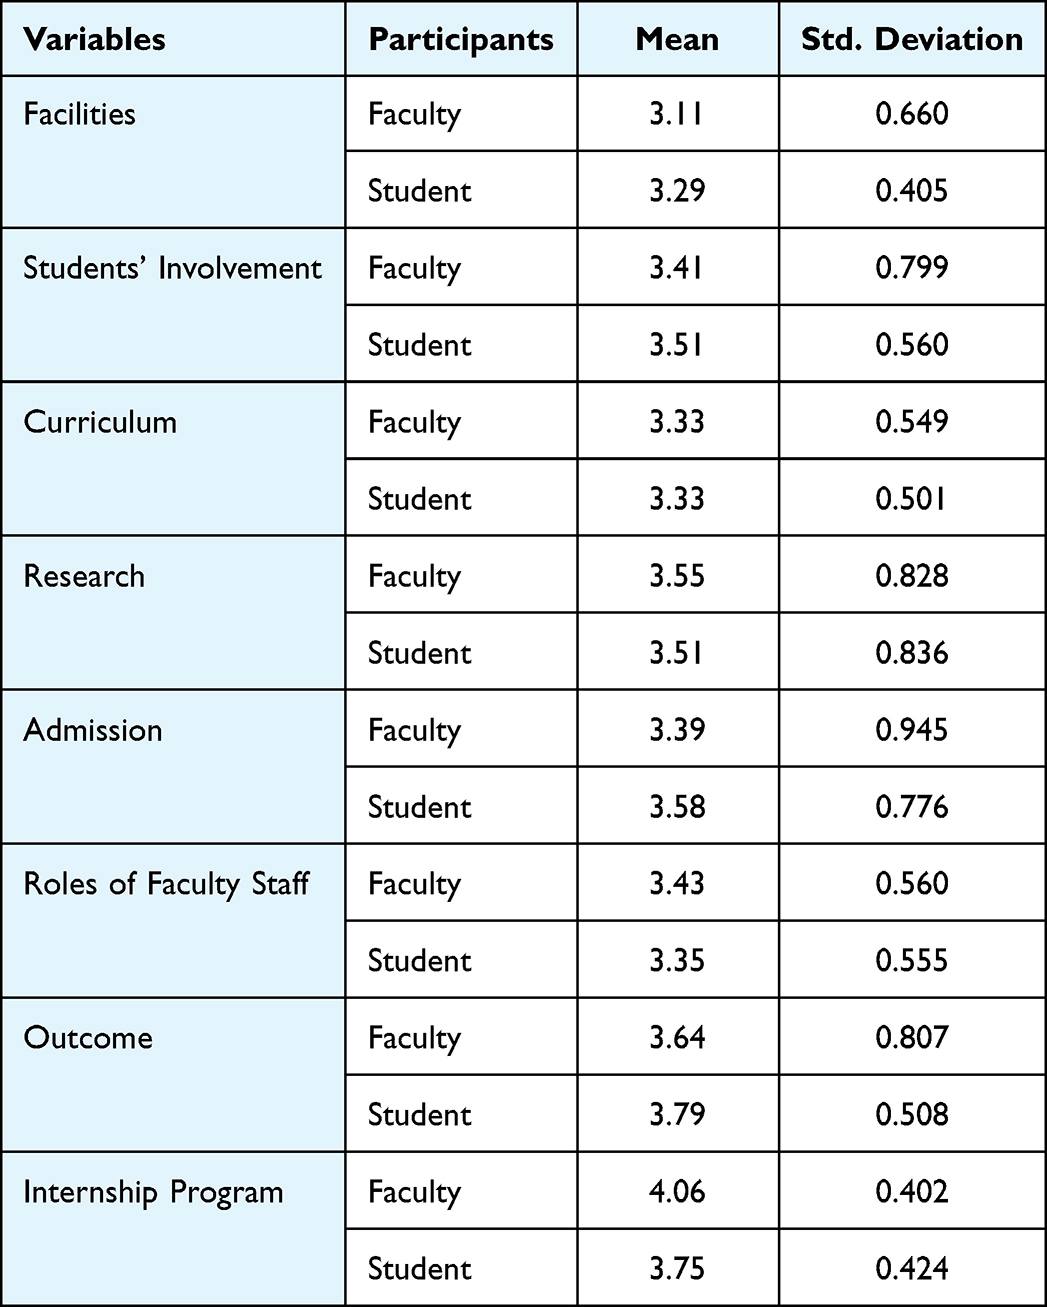 |
Table 5 Descriptive Statistics (Faculty = 38, Students = 184) |
The correlation table (see Table 6) provides depicts the relationships between various variables in the context of facilities, faculty, and students. Each cell in the table represents the correlation coefficient between two variables, with values ranging from −1 to +1. The higher the absolute value of the coefficient, the stronger the correlation between the variables. The first row of the table represents the facilities aspect, with “Faculty” indicating the correlation between faculty and the other variables. In the second row, “Students” denotes the correlation between students and the other variables.
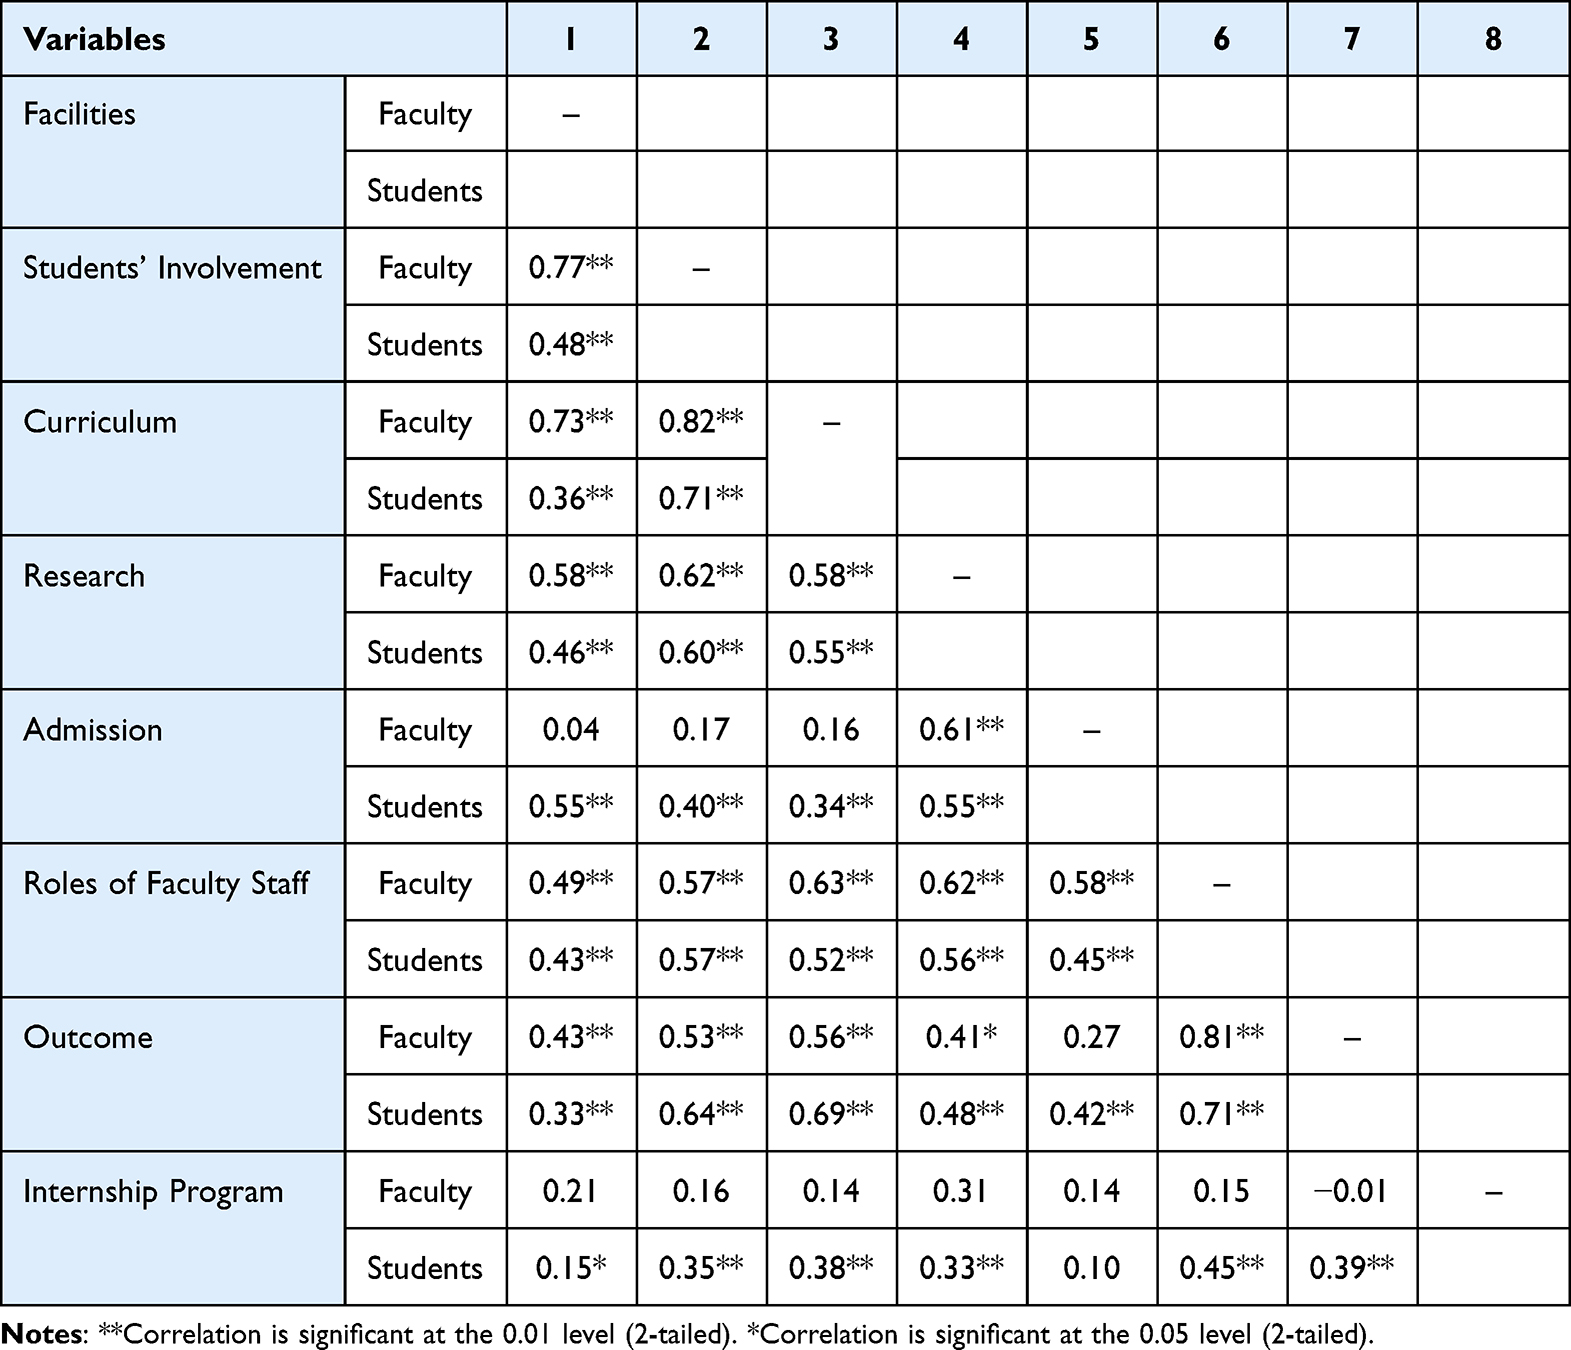 |
Table 6 Correlations Between Variables |
Moving along the table, we observe that “Faculty” and “Students” are positively correlated across multiple dimensions. The correlation coefficient of 0.77** suggests a strong positive relationship between faculty and students’ involvement. This implies that when faculty members are actively engaged, students tend to participate more. Similarly, in terms of curriculum, faculty and students’ correlation coefficient is 0.73**, indicating a strong positive association between the two groups in shaping the curriculum. Regarding research, both faculty and students exhibit positive correlations, suggesting that their involvement in research activities is interconnected. The coefficients of 0.58** and 0.55**, respectively, demonstrate moderate positive relationships between faculty and students in this area.
The correlation between faculty and students in the admission process is relatively weaker. While faculty members have a minor positive correlation (0.17) with students in admission, students’ correlation coefficient is slightly higher (0.40**). This suggests that students may have a greater impact on the admission process compared to faculty. The roles of faculty staff show a positive relationship with both faculty and students, as indicated by the correlation coefficients ranging from 0.49** to 0.63**. This suggests that when faculty staff have defined roles and responsibilities, both faculty and students benefit from clearer structures and expectations. Moving on to outcomes, there is a positive correlation between faculty and students, suggesting that faculty members play a role in influencing student outcomes. The correlation coefficients of 0.43** and 0.53** indicate a moderate positive association between faculty and students in terms of outcomes. Finally, the correlation coefficients for the internship program reveal a relatively weak relationship between faculty and students. While faculty members show minimal positive correlations (0.21 and 0.16), students exhibit a slightly stronger positive correlation (0.35** and 0.38**) with the internship program. This implies that students’ involvement in internships may be more influential than faculty members’ engagement in this aspect.
As seen in Table 7, the comparative analysis of the table reveals that the variables “Curriculum” and “Outcome” exhibit significant differences between groups. The “Curriculum” variable demonstrates a relatively high F-value of 4.288 (p = 0.001), indicating a statistically significant difference between groups. This suggests that the curriculum plays a meaningful role in explaining the variability observed in the data. Similarly, the “Outcome” variable shows a noteworthy F-value of 6.194 (p = 0.000), signifying a significant difference between groups. This implies that the outcomes achieved by these groups have a substantial impact on the observed variability.
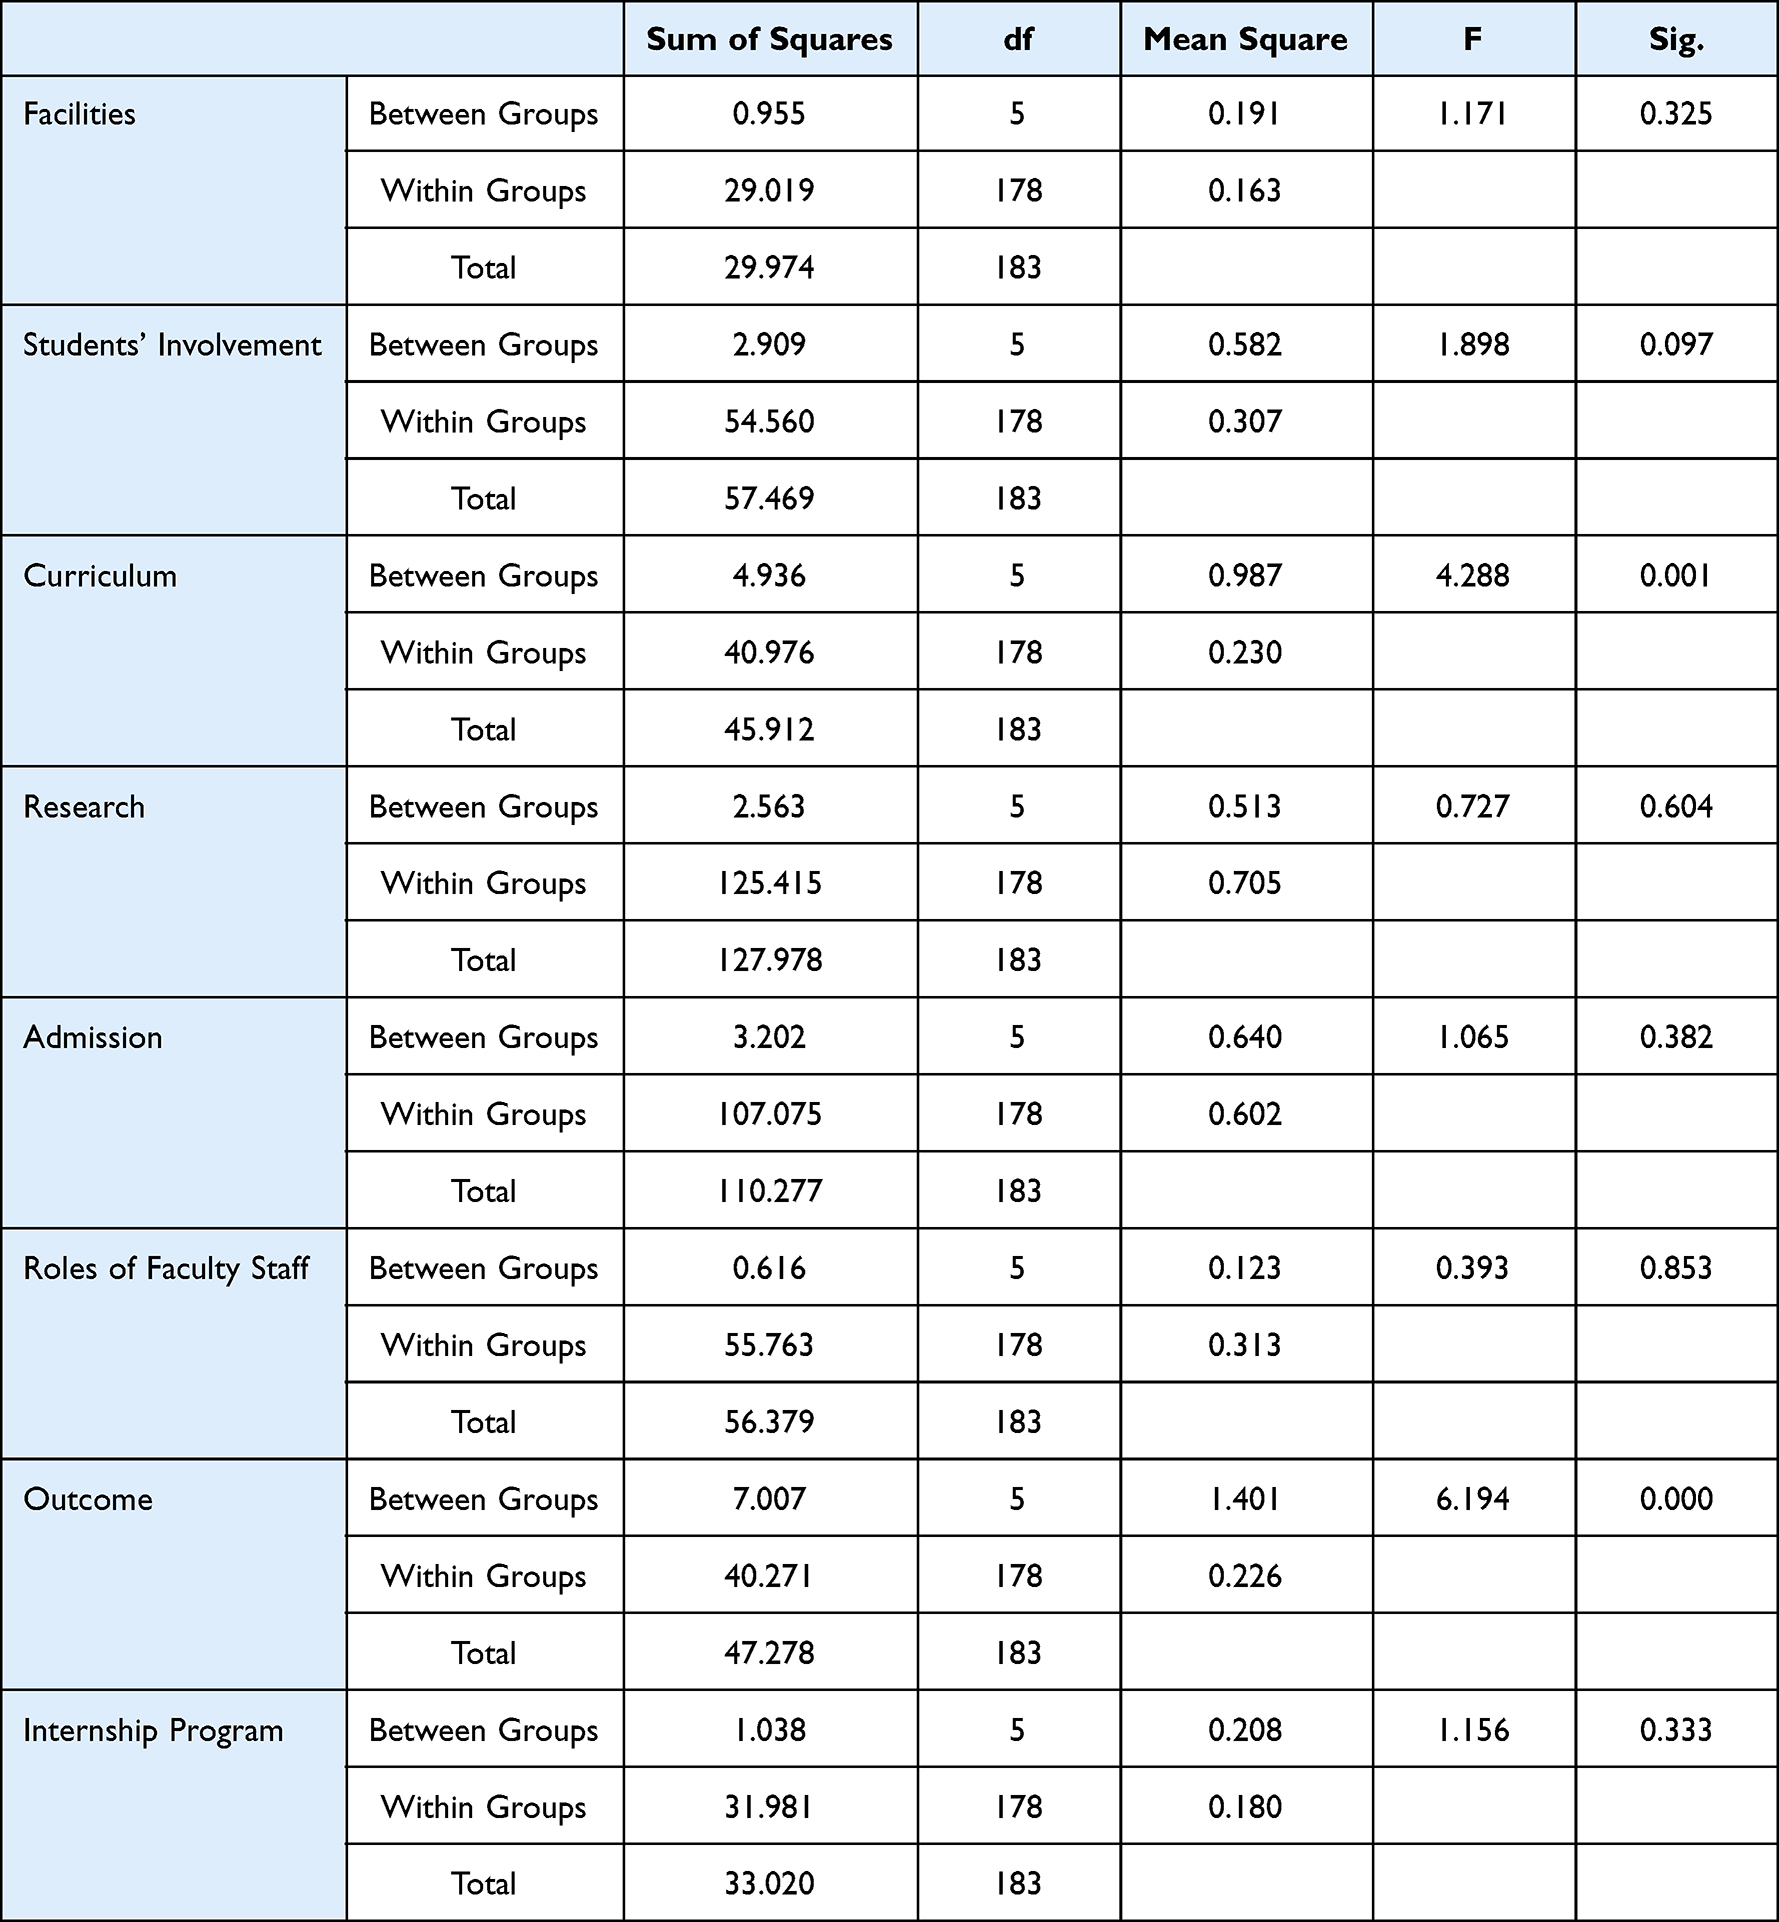 |
Table 7 Comparisons Between Mean Scores of Variables Among Students in Terms of Current Level of Study |
On the other hand, the variables “Facilities”, “Students’ Involvement” “Research” “Admission”, “Roles of Faculty Staff” and “Internship Program” do not exhibit significant differences between groups. These variables have relatively lower F-values and higher p-values, indicating that there is no statistically significant variation between the groups in relation to these variables. This suggests that these variables have a limited impact on the observed variability in the data.
As seen in Table 8 the “Students’ Involvement” variable, significant mean differences are observed between different universities. For instance, comparing “Hail University” and “Saudi Electronic University” shows a mean difference of 0.44 (p = 0.008), indicating that students’ involvement significantly varies between these two institutions. Similarly, comparing “Hail University” and “King Faisal University” yields a mean difference of 0.45 (p = 0.013), suggesting significant differences in students’ involvement levels between these universities.
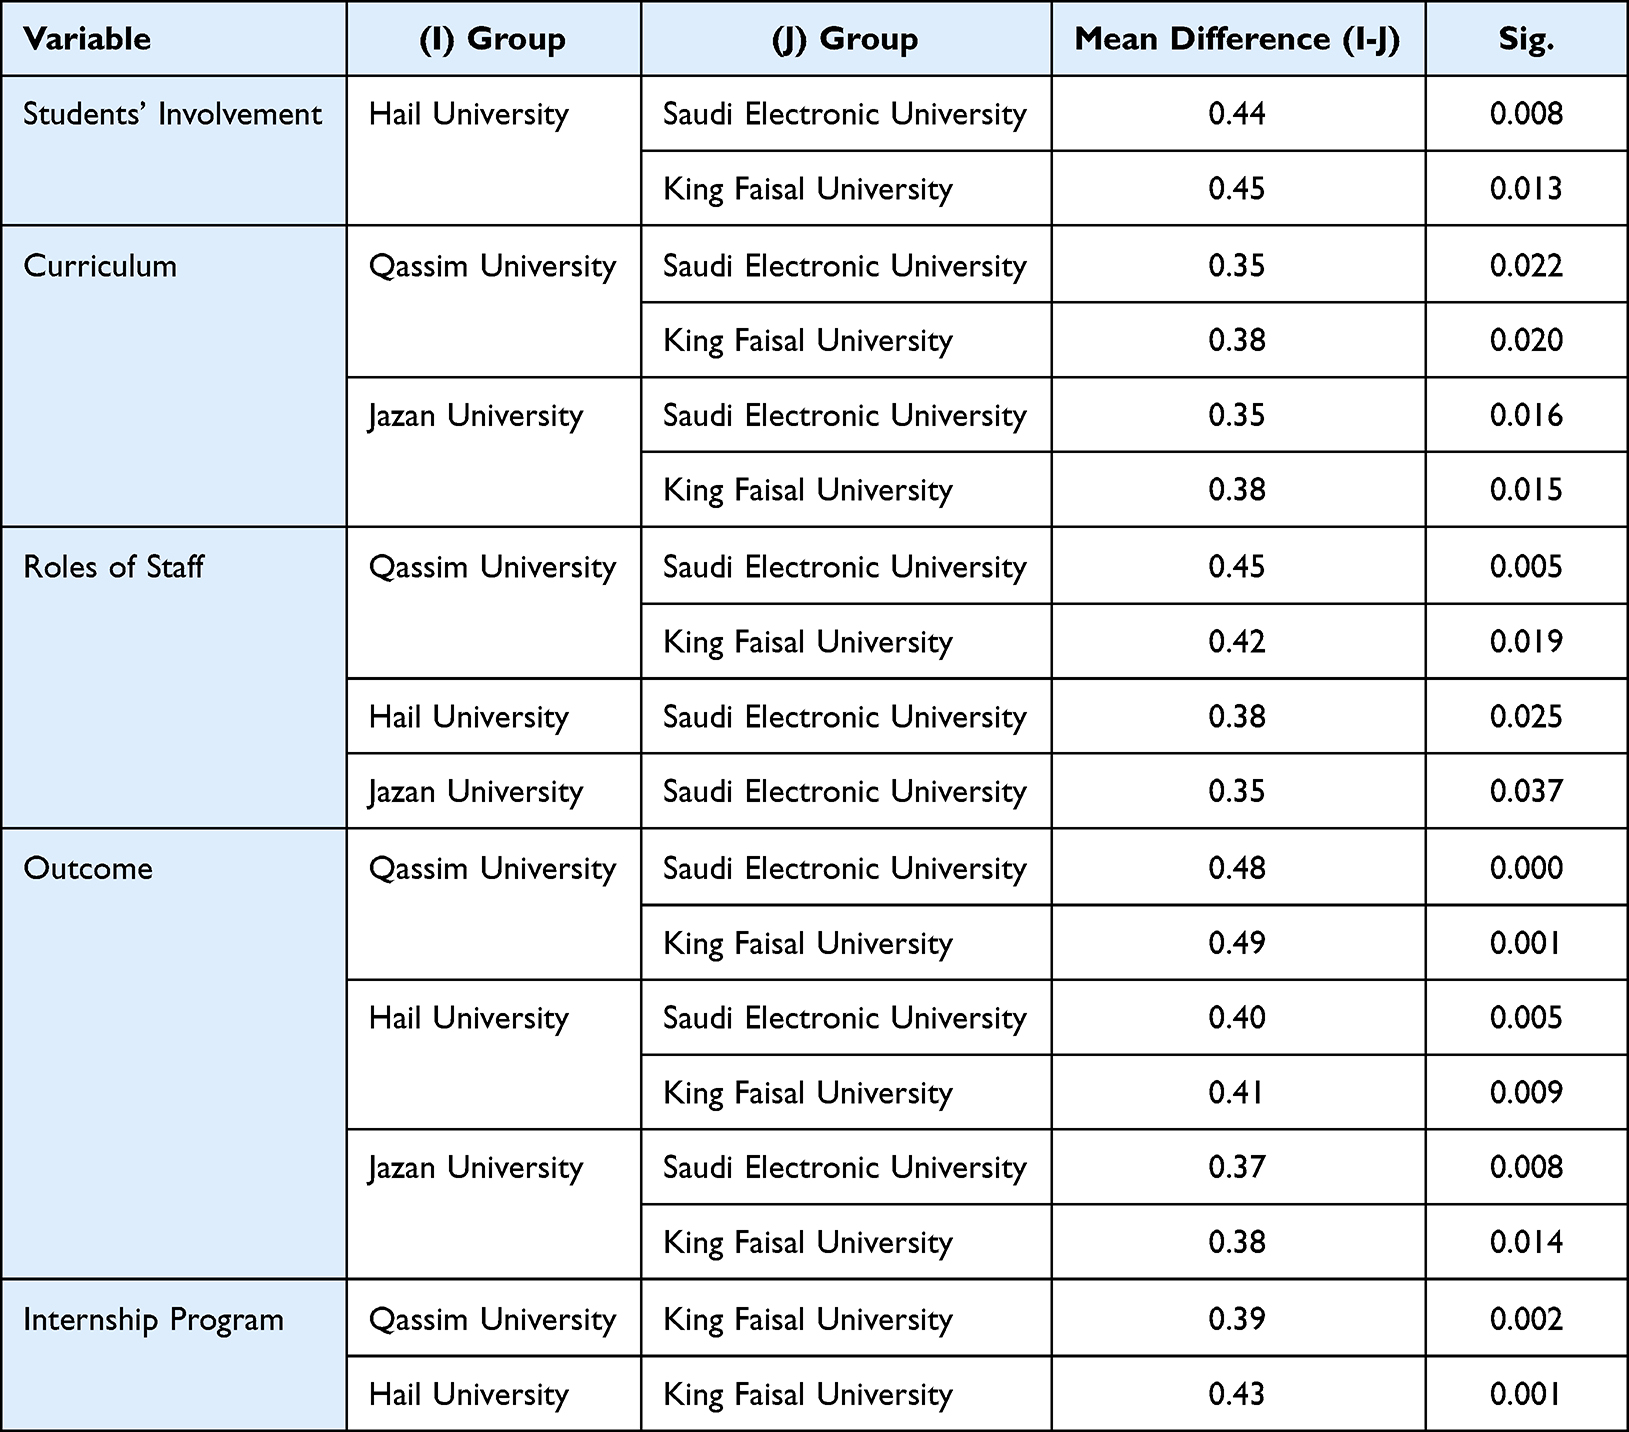 |
Table 8 Comparisons Between Mean Scores of Variables Among Students and Faculty Members in Terms of University Names |
In terms of the “Curriculum” variable, significant mean differences are also observed across universities. For example, comparing “Qassim University” and “Saudi Electronic University” reveals a mean difference of 0.35 (p = 0.022), indicating significant differences in the curriculum between these institutions. Comparing “Jazan University” and “Saudi Electronic University” also shows a mean difference of 0.35 (p = 0.016), emphasizing the variation in curriculum across these universities. Moving on to the “Roles of Staff” variable, significant mean differences are observed between different universities as well. Comparing “Qassim University” and “Saudi Electronic University” yields a mean difference of 0.45 (p = 0.005), indicating significant differences in the roles of staff between these institutions. Similarly, comparing “Hail University” and “Saudi Electronic University” shows a mean difference of 0.38 (p = 0.025), suggesting significant variations in staff roles between these universities.
For the “Outcome” variable, significant mean differences are observed across universities. Comparing “Qassim University” and “Saudi Electronic University” reveals a mean difference of 0.48 (p = 0.000), emphasizing significant differences in outcomes between these institutions. Comparing “Hail University” and “King Faisal University” shows a mean difference of 0.41 (p = 0.009), indicating significant variations in outcomes between these universities. Lastly, in the “Internship Program” variable, significant mean differences are observed between “Qassim University” and “King Faisal University”, with a mean difference of 0.39 (p = 0.002). Additionally, comparing “Hail University” and “King Faisal University” yields a mean difference of 0.43 (p = 0.001), indicating significant differences in the internship programs between these institutions.
Discussion
While the existing literature lacks comprehensive studies on health informatics (HI) in Saudi Arabian governmental universities, this study aims to address this gap by introducing a tool for data collection and analysis. The study examined several variables, including academic aspects (student involvement, academic outcomes, research participation) and logistical factors (facilities, admission, staff, and internships). The findings revealed positive correlations between college facilities and other academic and logistical variables, indicating that better facilities enhance students’ academic capabilities.
Furthermore, significant correlations were observed among all six variables, as well as between each academic variable and each logistical variable. This highlights the interrelation and interdependency of these variables, emphasizing that changes in one variable can impact the others, leading to cumulative effects, either positive or negative. Consequently, universities should prioritize a combination of academic excellence and logistical pillars to ensure overall high student satisfaction.
Demographic analysis showed a predominance of female students, mainly under 20 years old and in foundational or first-year programs. Younger students appeared more eager to participate in academic studies. Moreover, students from various universities responded similarly, indicating consistent reactions to the study, while no significant differences were found among faculty staff demographics.
Interestingly, no significant differences were observed between students and faculty staff across all six variables, indicating that being a student or faculty member did not significantly influence their responses. Only curricula and outcome satisfaction demonstrated variations among students in different academic years. Third-year students had lower beliefs about curricula, possibly due to exposure to the work field through internships, realizing the need for additional practical skills beyond the curriculum. On the other hand, first-year students had higher outcome expectations, assuming their undergraduate years would sufficiently prepare them for the work field.
These findings align with existing literature on HI’s role in facilitating electronic health information management.3,5 The study’s results also revealed varying degrees of satisfaction among students across different universities. For instance, Hail University students showed high levels of student involvement, while Qassim University students expressed greater satisfaction with outcomes. These variations indicate differing priorities among students, with Qassim students valuing staff roles and internship programs.
The limitations of this study include the use of self-reported methods, and while self-reported methods could be the only accessible tool for data collection, they constitute a potential threat to the internal validity of the study, as Heppner and Wampold32 showed how participants’ responses could be biased, or that participants become ashamed to provide accurate information. For instance, students might show social desirability bias when asked about how effective an educational program was, and they might exaggerate the benefits of the programs for fear of feeling not adequate enough to comprehend the program courses. In some instances, students might also guess the study’s objectives and give skewed information as a result, which might either confirms or challenges the researcher’s hypothesis.
Suggestions for future research include controlling the independent variables of the study through semi-structured one-on-one interviews that tackle variables such as student involvement and academic outcomes yet without ascribing any sense of liability or responsibility to the students or staff, which could make them more at ease to reveal their honest inputs. An inductive thematic analysis could be introduced in addition to this quantitative cross-sectional study, as mixed-methods research design would produce more insights into both the qualitative and quantitative aspects of the research question.
Conclusion
This study investigated the health informatics academic programs in Saudi Arabian governmental universities, and in particular, how HI undergraduate programs compare in different Saudi Arabian schools, including Hail University, Jazan University, and Qassim University. The aim of the study was to evaluate HI programs in Saudi Arabian governmental universities, as well as identifying the main strengths and weaknesses of undergraduate HI programs, introducing new insights in Saudi Arabian HI with a useful tool for data collection that could be used for further future research in education field and curriculum designers. The results, in accordance with the current but little literature on HI, show significant correlation between all six variables measured, suggesting that all variables are interrelated and must be perceived as such. As these exploratory results were consistent over all Saudi Arabian colleges included in the study, and for both students and faculty staff members, further research should continue to investigate HI programs in order to have a comprehensive view from which Saudi Arabian schools could move towards developing their academic and logistic facilities while being aware of how impactful such facilities are on both students and staff.
Abbreviations
HI, Health Informatics; IMIA, International Medical Informatics Association; MoE, Ministry of Education; SPSS, Statistical Package for the Social Sciences.
Data Sharing Statement
The datasets used and analysed in the current study are available from the corresponding author upon reasonable request.
Ethical Approval and Consent to Participate
All methods in this study were performed in accordance with the declaration of Helsinki and were approved by the Institutional Review Board (IRB) of Qassim University No. 23-32-10. All participants provided informed consent to participate. In the case of the questionnaire-based study, all participants were informed of the voluntary nature, confidentiality, and aim of the study and the nature of their participation before they participated in the study.
Acknowledgments
Researchers would like to thank the Deanship of Scientific Research, Qassim University For the support of this project
Funding
This project is fully funded by Qassim University
Disclosure
The author declares that they have no competing interests
References
1. Honey M, Collins E, Britnell S. Education into policy: embedding health informatics to prepare future nurses-New Zealand case study. JMIR Nurs. 2020;3(1):e16186. doi:10.2196/16186
2. Hovenga EJ. Health informatics: an overview; 2010.
3. Dalrymple PW. Data, information, knowledge: the emerging field of health informatics. Bull Am Soc Inform Sci Technol. 2011;37(5):41–44. doi:10.1002/bult.2011.1720370512
4. Hasman A, Mantas J. IMIA accreditation of health informatics programs. Healthc Inform Res. 2013;19(3):154–161. doi:10.4258/hir.2013.19.3.154
5. Bichel-Findlay J, Koch S, Mantas J, et al. Recommendations of the International Medical Informatics Association (IMIA) on education in biomedical and health informatics: second revision. Int J Med Inform. 2023;170:104908. doi:10.1016/j.ijmedinf.2022.104908
6. Jaspers MW, Mantas J, Borycki E, Hasman A. IMIA accreditation of biomedical and health informatics education: current state and future directions. Yearb Med Inform. 2017;26(1):252–256. doi:10.15265/IY-2017-011
7. Mantas J, Ammenwerth E, Demiris G, et al. Recommendations of the International Medical Informatics Association (IMIA) on education in biomedical and health informatics. First revision. Methods Inf Med. 2010;49(2):105–120. doi:10.3414/ME5119
8. Alkhazim MA. Higher education in Saudi Arabia: challenges, solutions, and opportunities missed. Higher Educ Policy. 2003;16(4):479–486. doi:10.1057/palgrave.hep.8300035
9. Prokop M. Saudi Arabia: the politics of education. Int Aff. 2003;79(1):77–89. doi:10.1111/1468-2346.00296
10. Bowling A. Research Methods in Health : Investigating Health and Health Services/Ann Bowling.
11. Dawson C. Introduction to research methods: a practical guide for anyone undertaking a research project: how to books; 2009.
12. Offredy M, Vickers P. Developing a Healthcare Research Proposal: An Interactive Student Guide. John Wiley & Sons; 2010.
13. Samara A, Nistrup A, Al-Rammah TY, Aro AR. Lack of facilities rather than sociocultural factors as the primary barrier to physical activity among female Saudi university students. Int J Womens Health. 2015;7:279–286. doi:10.2147/IJWH.S80680
14. Brito RM, Rodríguez C, Aparicio JL. Sustainability in teaching: an evaluation of university teachers and students. Sustainability. 2018;10(2):439. doi:10.3390/su10020439
15. Balva D, Page DT, Collardeau F, Gómez Henao JA, Flores-Camacho AL. International capacity building in psychological science: reflections on student involvement and endeavors. Trends Psychol. 2023;31(3):520–547.
16. Harris L, Driscoll P, Lewis M, Matthews L, Russell C, Cumming S. Implementing curriculum evaluation: case study of a generic undergraduate degree in health sciences. Assess Eval High Educ. 2010;35(4):477–490. doi:10.1080/02602930902862883
17. Gamble AS. Simulation in undergraduate paediatric nursing curriculum: evaluation of a complex ‘ward for a day’ education program. Nurse Educ Pract. 2017;23:40–47. doi:10.1016/j.nepr.2017.02.001
18. Aglen B. Pedagogical strategies to teach bachelor students evidence-based practice: a systematic review. Nurse Educ Today. 2016;36:255–263. doi:10.1016/j.nedt.2015.08.025
19. Majdzadeh R, Nedjat S, Keshavarz H, et al. A new experience in medical student admission in Iran. Iran J Public Health. 2009;38(Suppl 1):36–39.
20. de Boer T, Van Rijnsoever FJ. One field too far? Assessment & evaluation in higher education; 2022:1–14.
21. Ortega KH, Burns SM, Hussey LC, Schmidt J, Austin PN. Predicting success in nurse anesthesia programs: an evidence-based review of admission criteria. Aana j. 2013;81(3):183–189.
22. Wilson Kasule G, Wesselink R, Noroozi O, Mulder M. The current status of teaching staff innovation competence in Ugandan universities: perceptions of managers, teachers, and students. J Higher Educ Policy Manag. 2015;37(3):330–343. doi:10.1080/1360080X.2015.1034425
23. Tovar E. The role of faculty, counselors, and support programs on Latino/a community college students’ success and intent to persist. Commun Coll Rev. 2015;43(1):46–71. doi:10.1177/0091552114553788
24. Bedggood RE, Donovan JD. University performance evaluations: what are we really measuring?. Stud Higher Educ. 2012;37(7):825–842. doi:10.1080/03075079.2010.549221
25. Bhuyan MH, Khan SSA. Assessing and evaluating the course outcomes of electrical circuit course for bachelor of science in electrical and electronic engineering program. Int J Educ Pedagog Sci. 2020;14(12):1163–1171.
26. Coates H, Richardson S. An international assessment of bachelor degree graduates’ learning outcomes. Higher Educ Policy Manag. 2012;23(3):1–19. doi:10.1787/hemp-23-5k9h5xkx575c
27. Warinda T. Accounting students’ evaluation of internship experiences from a skills perspective. Int J Asian Soc Sci. 2013;3(3):783–799.
28. Ebner K, Soucek R, Selenko E. Perceived quality of internships and employability perceptions: the mediating role of career-entry worries. EducationTraining. 2021;63(4):579–596. doi:10.1108/ET-02-2020-0037
29. Phoebe WK. Determinants of Internship Effectiveness for University Students in Hong Kong Unpublished bachelor’s thesis). Hong Kong: Hong Kong Baptist University; 2010.
30. Thompson SK. Sampling. Wiley; 2012.
31. Bryman A. Social Research Methods. OUP Oxford; 2012.
32. Heppner PP, Wampold BE, Owen J, Wang KT. Research Design in Counseling. Cengage Learning; 2015.
 © 2023 The Author(s). This work is published and licensed by Dove Medical Press Limited. The
full terms of this license are available at https://www.dovepress.com/terms
and incorporate the Creative Commons Attribution
- Non Commercial (unported, 3.0) License.
By accessing the work you hereby accept the Terms. Non-commercial uses of the work are permitted
without any further permission from Dove Medical Press Limited, provided the work is properly
attributed. For permission for commercial use of this work, please see paragraphs 4.2 and 5 of our Terms.
© 2023 The Author(s). This work is published and licensed by Dove Medical Press Limited. The
full terms of this license are available at https://www.dovepress.com/terms
and incorporate the Creative Commons Attribution
- Non Commercial (unported, 3.0) License.
By accessing the work you hereby accept the Terms. Non-commercial uses of the work are permitted
without any further permission from Dove Medical Press Limited, provided the work is properly
attributed. For permission for commercial use of this work, please see paragraphs 4.2 and 5 of our Terms.