Back to Journals » Open Access Emergency Medicine » Volume 15
Factors Relating to Decision Delay in the Emergency Department: Effects of Diagnostic Tests and Consultations
Authors Ataman MG ![]() , Sariyer G
, Sariyer G ![]() , Saglam C
, Saglam C ![]() , Karagoz A, Unluer EE
, Karagoz A, Unluer EE
Received 20 January 2023
Accepted for publication 26 April 2023
Published 28 April 2023 Volume 2023:15 Pages 119—131
DOI https://doi.org/10.2147/OAEM.S384774
Checked for plagiarism Yes
Review by Single anonymous peer review
Peer reviewer comments 2
Editor who approved publication: Dr Hans-Christoph Pape
Mustafa Gokalp Ataman,1 Gorkem Sariyer,2 Caner Saglam,3 Arif Karagoz,1 Erden Erol Unluer3
1Department of Emergency Medicine, Bakırçay University Çiğli Training and Research Hospital, İzmir, Turkey; 2Department of Business Administration, Yaşar University, İzmir, Turkey; 3Department of Emergency Medicine, University of Health Sciences Bozyaka Training and Research Hospital, İzmir, Turkey
Correspondence: Mustafa Gokalp Ataman, Department of Emergency Medicine, Bakırçay University Çiğli Training and Research Hospital, 8780/1 Street No: 18 Yeni Mahalle Ata Sanayi / Çiğli, İzmir, Turkey, Tel +90 232 398 37 00, Fax +90 444 35 30, Email [email protected]
Purpose: The purpose of this study is to investigate the factors increasing waiting time (WT) and length of stay (LOS) in patients, which may cause delays in decision-making in the emergency departments (ED).
Patients and Methods: Patients who arrived at a training hospital in the central region of Izmir City, Turkey, during the first quarter of 2020 were retrospectively analyzed. WT and LOS were the outcome variables of the study, and gender, age, arrival type, triage level determined based on the clinical acuity, diagnosis encoded based on International Classification of Diseases-10 (ICD-10), the existence of diagnostic tests or consultation status were the identified factors. The significance of the differences in WT and LOS values based on each level of these factors was analyzed using independent sample t-tests and ANOVA.
Results: While patients for which no diagnostic testing or consultation was requested had a significantly higher WT in EDs, their LOS values were substantially lower than those for which at least one diagnostic test or consultation was ordered (p≤ 0.001). Besides, elderly and red zone patients and those who arrived by ambulance had significantly lower WT and higher LOS values than other levels for all groups of patients for which laboratory-type or imaging-type diagnostic test or consultation was requested (p≤ 0.001 for each comparison).
Conclusion: Besides ordering diagnostic tests or consultation in EDs, different factors may extend patients’ WT and LOS values and cause significant decision-making delays. Understanding the patient characteristics associated with longer waiting times and LOS values and, thus, delayed decisions will enable practitioners to improve operations management in EDs.
Keywords: emergency department, waiting time, length of stay, delay
Introduction
Emergency departments (EDs) are essential units of health systems. EDs provide patients with the required assessment, stabilization and treatment. Besides, these departments are also perceived as the entrance gate to the hospital by many patients. Thus, EDs are used to accomplish hospitals’ initial evaluation and admission processes, accounting for half of the hospital admissions in most developed and developing countries.1 For example, in Turkey, with an approximate population of 85 million, the number of ED applications is around 130 million in 2021.2. Besides, the percentage of ED patients to the total number of patients has steadily increased. In the last five years covering the period 2017–2021, this percentage has been observed to be 31.90% 32.60%, 40.30%, 45.40%, and 48.60% respectively in Turkey.2
The significant increase in admissions to emergency departments (EDs) has led to ED overcrowding, a global problem that health systems struggle with.3–5 Although there is no standard definition, overcrowding can be defined as a situation during which the function of an ED is compromised mainly due to excessive patient numbers waiting for diagnostic tests, consultation, treatment, transfer, or discharge.6 Since overcrowding is a worldwide recurring public health concern, different scoring systems, such as the National ED Overcrowding Scale (NEDOCS) and the National Emergency Access Target (NEAT), are formed to measure how crowded an ED is.7,8 Different variables such as length of stay (LOS), occupancy rate, waiting times (WT), boarding time, and ratios of without being seen are mainly used in these overcrowding scoring systems.
Overcrowding in EDs has severe adverse outcomes for patients and ED personnel, such as decreased patient satisfaction,9,10 increased stress levels of personnel,11,12 increased mortality,13,14 and increased waiting and treatment times.15–19 Since increased waiting and treatment times cause a significant delay in the decision-making of ED personnel, from the operations management perspective, this outcome has received more attention from researchers than all others.3,15
Waiting and treatment times are collectively labelled as the length of stay (LOS), a crucial measure of ED throughput and a marker of overcrowding.20 While various factors such as gender, age, arrival type, clinical acuity, and pre-diagnosis of patients at the time of arrival may significantly affect their waiting time, diagnostic testing and consultation requests required to diagnose and treat the patient properly can affect the treatment times. Thus, patient LOS values may vary based on all these factors.5,15 On the other hand, increased waiting either before admission to the system or for diagnostic tests or consultation processes (from initializing the order until it is completed) may delay decision-making in EDs.21–24
Since measuring and understanding the main factors affecting waiting times and stay lengths of patients in EDs, which may cause significant delays in decision making is critical in managing ED operations, this study aims to analyze the effects of various factors on waiting time and LOS values in EDs. For this aim, a large scaled ED located in a metropolitan region of the third biggest city in Turkey has been studied as a case ED. Gender, age, arrival type, triage level, diagnosis, the existence of diagnostic tests, or consultation status are identified as the study variables. These findings can shed valuable light on planning and managing operations in EDs. Identifying the patient characteristics associated with longer waiting times and LOS values and, thus, delayed decisions will enable ED practitioners to prepare better plans and improve operations management.
Materials and Methods
Study Design
We performed a retrospective review of all patients arriving in a research and training hospital emergency department during the first quarter of 2020. This case hospital is a large-scale hospital in a metropolitan region of Izmir with an average daily ED patient volume of more than 1000.
The patients’ data arriving at this ED during the study period were retrieved from the hospital databases in an Excel sheet. This data set includes patient id, gender, age, arrival type, date of arrival, time of arrival, triage level, and time of admission. The data set for patients requiring diagnostic tests include additional information: type of diagnostic test, time of test ordering, test result, and test completion time. For patients requiring consultation from other services, the data set includes the service from which consultation was ordered, consultant arrival time, consultant examination details, and consultation completion time. These cells related to diagnostic tests and consultation information are blank for the patients who did not require any. The final column of the data set includes data on the patient’s departure time. The date of arrival is represented in the dd.mm.yyyy form and time data are all given in the hh.mm.ss form.
To investigate decision delay in EDs, we identified two indicators, the patient waiting time and length of stay, as this research’s output variable. The patient’s waiting time was calculated in minutes as the time between patient admission and arrival. LOS was calculated as the time between patients’ departure and arrival.
Gender, age, arrival type, triage level, diagnosis encoded based on ICD-10, diagnostic test, and consultation requirement status of a patient were determined as the input variables of the research. While the output variables were continuous, the input variables were discrete as having nominal or ordinal levels of measurement.
Patients were grouped as males/females and young (age ≤14)/middle-aged (age between [15–65]/elderly (age ≥65)) based on their gender and age. The arrival type of a patient was labelled as by walking or by ambulance. Patients were assigned to one of the red, yellow, green, or trauma regions in the triage stage based on their clinical acuities. When the patients are examined, their diagnoses are determined by the responsible physician according to twenty-two different main categories in ICD-10 version 22. These were defined as the categories of this variable in the study. The patients’ waiting time and LOS values for each gender, age, arrival type, triage level, and diagnosis category were measured to explore the ones causing increased times and delays.
While diagnosing some patients, doctors may require diagnostic tests or consultation, which may delay the decision. Thus, we also grouped the patients for whom no diagnostic test or consultation was needed and the others. We also independently analyzed the waiting time and LOS values of patients for whom laboratory-type imaging-type diagnostic tests and consultation were required to investigate better the effect of the type of such additional prompts in decision delay.
Patients with fewer than five minutes of LOS were eliminated from the study data set since these generally represented the left without-seen situations. Data having missing, redundant, or inconsistent entries were also removed from the data set.
Data Analysis
Descriptive analysis was performed to characterize the data set. Frequency distributions and basic univariate statistics were used for the descriptive analysis. Independent sample t-tests and Analysis of Variance (ANOVA) were used to test the significance of the differences in the waiting time and LOS values of different categories of the study input variables. Stacked bar charts were additionally used to visualize the differences in frequencies of various input variables for each patient group as requiring no diagnostic test or consultation, a laboratory-type diagnostic test, an imaging-type diagnostic test, or a consultation from any of the services.
Results
In total, 129,981 patients arrived at this ED during the study period. 4988 (3.837%) had missing, redundant, or inconsistent entries and were removed from the data set. Of the 124,993 patients included in the study, 79,266 (63.416%) required no diagnostic test or consultation. For the remaining 45,727 (36.584%), at least one diagnostic test or consultation type was ordered.
We labelled the first group of patients, Group 1, as the ones for which no diagnostic test or consultation was requested. On the other hand, Group 2 represented the patients requiring at least one type of diagnostic test or consultation. As the labelling means, in Group 2, many patients for which different types of laboratory and imaging diagnostic tests and consultation from other services were requested together. For the two groups of patients, the average and standard deviation of waiting times (WT) and LOS values were represented in Table 1.
 |
Table 1 Average Waiting Time and LOS Values of Patients in the Defined Two Groups (in Minutes) |
Table 1 shows that while the average WT of Group 2 patients was significantly smaller than that of Group 1, the opposite comparison holds for the average LOS values. In addition, the standard deviation statistics of the WT were higher in Group 1 compared to Group 2 patients. This showed that WT had higher variability in Group 1 patients compared to Group 2. Table 1 showed that although Group 2 patients were waiting lower for ED service on average, they stayed longer in the system. This indicates that diagnostic tests or consultation orders and waiting for their result are essential factors that delay ED patients’ decisions.
To analyze the effect of diagnostic test type and consultation requests on WT and LOS values, Group 2 is further divided into three groups: patients for which laboratory-type tests were ordered, imaging-type tests were ordered, and consultation was requested. Table 2 summarizes the patients’ average and standard deviation statistics for each group.
 |
Table 2 WT and LOS Statistics of Patients of Different Types of Requests (in Minutes) |
Based on the summary result statistics presented in Table 2, it was seen that the average waiting time of the patients for which consultation was requested was the lowest, and the ones for which laboratory-type tests were ordered were the highest. On the other hand, while the patients’ LOS values for imaging-type tests were ordered were the lowest, the ones for which consultation was requested were the highest.
To determine the levels of previously mentioned study variables increasing the WT and LOS values, Group 2 patients are further divided into subgroups for which laboratory-type test, imaging-type test, or consultation was requested. Figure 1 visualizes the frequency distributions based on gender, age, arrival type, and triage level for Group 1 and three subgroups of Group 2 patients.
 |
Figure 1 Frequency distributions based on (a) gender, (b) age, (c) arrival type, (d) triage codes. |
Figure 1a shows that all four patient groups were almost uniformly distributed based on gender. While the frequencies of males were some higher compared to females in Group 1 and the patients requiring a laboratory-type test, the female frequency was higher for the patients requiring a consultation.
Figure 1b shows that compared to the other three patient groups, while the frequency distribution of young was the highest in the Group 1 patients, the distribution of elderly was the lowest. Besides, the highest distributions of elderly were observed for patients requiring consultation and laboratory-type tests. Thus, for a significant portion of elderly patients, laboratory-type diagnostic tests or consultations were requested.
According to the distribution based on the arrival type, Figure 1c shows that the highest frequency of patients arriving by walking was observed in Group 1. In addition, the highest distributions of arriving by ambulance were observed for patients requiring consultation and laboratory-type tests. Thus, laboratory-type diagnostic tests or consultations were requested for many patients arriving by ambulance.
Figure 1d shows that compared to the other three patient groups, while the distributions of red zone patients were the lowest, green zone patients were the highest. The highest distributions of red zone patients were observed for patients requiring consultation and laboratory-type tests. Thus, laboratory-type diagnostic tests or consultations were requested for many red-zone patients. Besides, the highest distribution of trauma zone patients was observed for patients requiring an imaging-type test. Thus, imaging-type diagnostic tests were requested for many trauma zone patients.
Figure 2 presents the frequency distributions based on ICD-10 codes for Group 1 and three subgroups of Group 2 patients.
 |
Figure 2 Frequency distributions based on ICD-10 classifications. |
Figure 2 represents that most Group 1 patients were diagnosed with ICD-10 codes J00-J99, Z00-Z99, and M00-M99. Of the patients requiring laboratory-type tests, the highest portion was coded with R00-R99. Besides, of the patients requiring imaging-type tests, most of them were assigned the ICD-10 codes R00-R99 and M00-M99. Most of the patients for which consultation was requested were diagnosed with ICD-10 codes R00-R99 and Z00-Z99. Thus, diagnostic tests or consultations were required for most patients diagnosed with R00-R99, M00-M99, and Z00-Z99.
Table 3 presents WT and LOS statistics for each level of study variables for the patients requiring a laboratory-type diagnostic test.
 |
Table 3 WT and LOS Statistics of Patients Requiring Laboratory Tests (in Minutes) |
As seen in Table 3, for the patients requiring laboratory-type tests, the WT and LOS values were significantly different for each level of gender, age, arrival type, triage level, and ICD-10 codes. While females wait longer than males, the LOS values of females were lower on average. While the average WT of the age≤14 group was the highest, the average LOS was the weakest in this age group. In comparison, while wait times were the lowest in the elderly group, LOS values were the highest for this age group. The highest WT values were observed for the patients who arrived by walking. Besides, the lowest WT and the highest LOS values were observed for the patients arriving by ambulance. The lowest WT and the highest LOS values were observed in the red zone patients. Although green zone patients had notable WT, their LOS values were the lowest among other triage levels. While the patients encoded with V00-Y99, C00-D49, and U00-U85 had the lowest WT values, which were below 10 minutes on average, the patients encoded with C00-D49 and E00-E89 had the most extended LOS values. On the other hand, the patients encoded with R00-R99 and J00-J99, having the highest frequencies in this group (see Figure 1e), had high WT and average LOS values.
WT and LOS statistics of each level of gender, age, arrival type, triage category, and ICD-10 code for the patients requiring an imaging type test are summarized in Table 4.
 |
Table 4 WT and LOS Statistics of Patients Patients Requiring Laboratory Tests (in Minutes) |
Table 4 shows that the WT and LOS values were significantly different for the patients requiring imaging-type diagnostic tests for each level of arrival type, triage level, and ICD-10 codes. However, While WT had significant differences based on gender, LOS values were insignificantly varied. On the other hand, while LOS values were significantly changed based on age, WT had insignificant differences. Both the WT and LOS values were higher in females than males within the patients for whom imaging-type tests were ordered. LOS values were the highest in the elderly and the lowest in the age≤14 groups. The highest WT values were observed for the patients who arrived by walking. Besides, the lowest WT and the highest LOS values were observed for the patients arriving by ambulance. The patients triaged in the red zone had the lowest WT and the highest LOS values. Although green zone patients had a significantly lower WT than yellow zone patients, the opposite comparison was seen for the LOS values. Patients for which the C00-D49 code was assigned had a low WT and the highest LOS values. As mentioned in Figure 2, R00-R99 and M00-M99 codes represented the highest frequency groups according to ICD-10 codes distribution within the patients for which imaging-type tests were ordered. While the patients encoded with M00-M99 had WT and LOS values significantly lower than the average, the ones with R00-R99 had significantly higher WT and LOS values.
As a final analysis, Table 5 shows WT and LOS statistics for each level of study variables for patient consultation required from the other services.
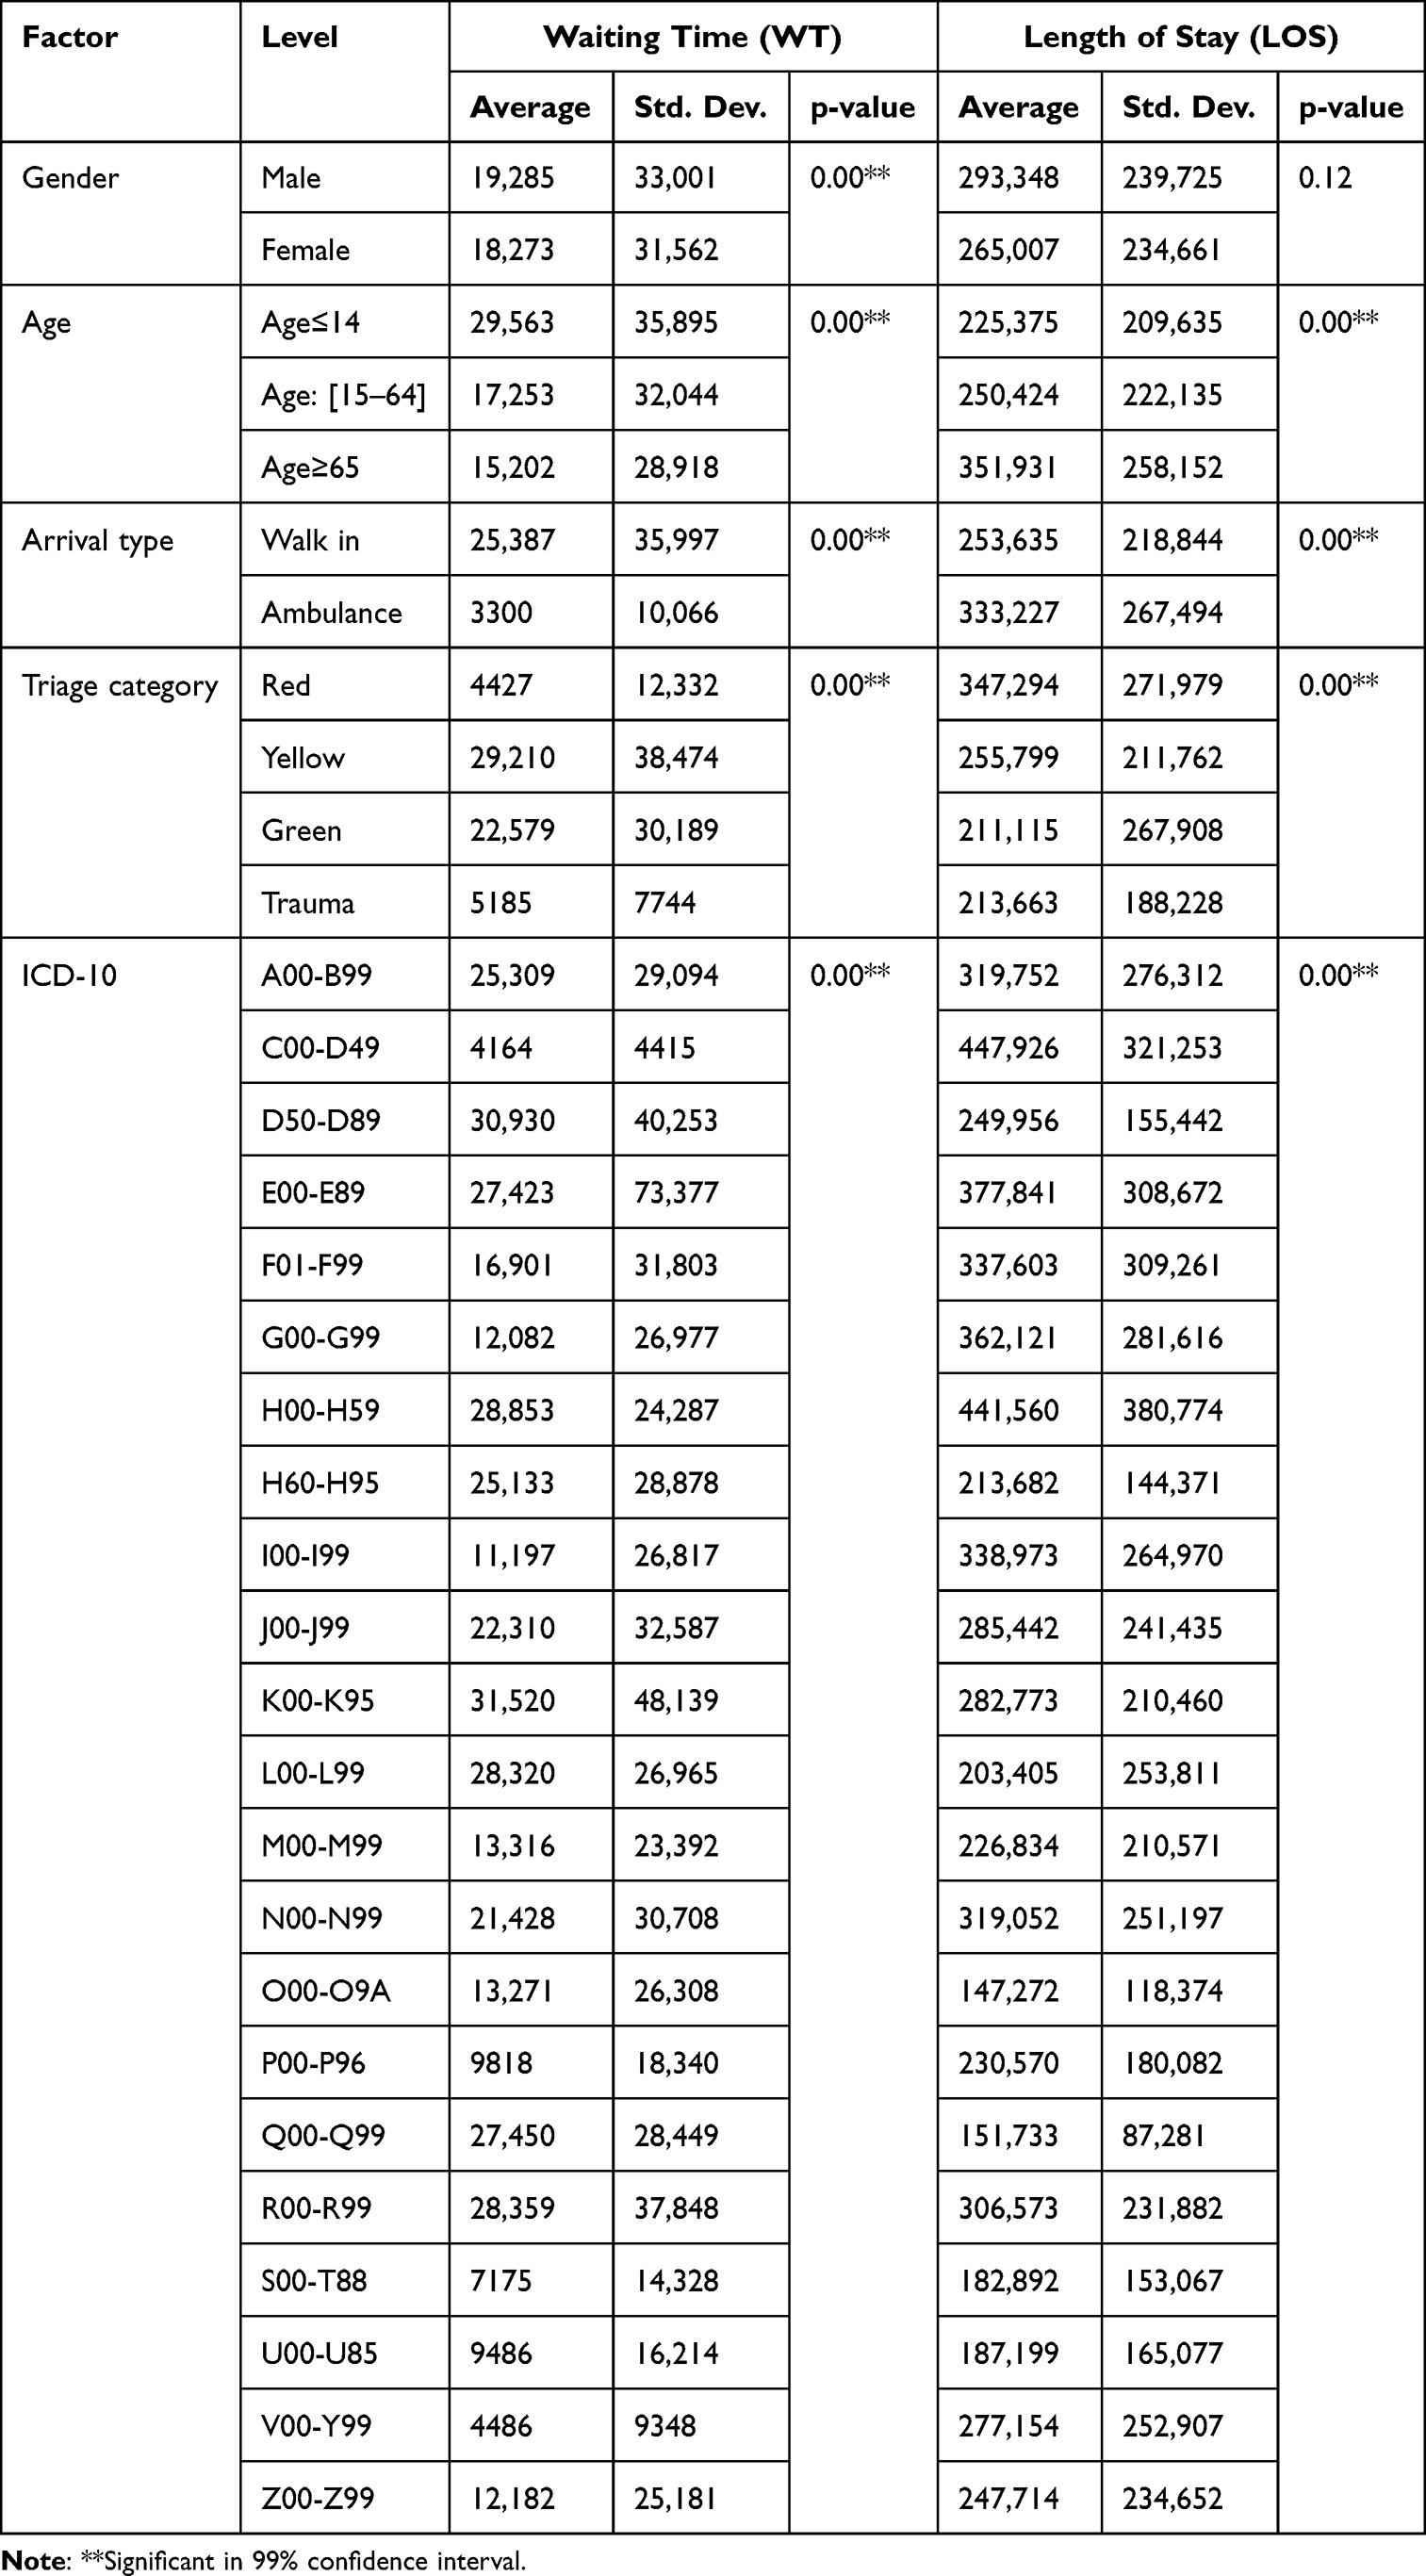 |
Table 5 WT and LOS Statistics of Patients Requiring Consultation (in Minutes) |
Table 5 represents that for the patients requiring a consultation, while WT and LOS values were not significantly varied based on gender, both had significant differences based on age, arrival type, triage level, and ICD-10 codes. The comparison between this group’s age, arrival type, and triage level categories was very similar to those obtained in patients requiring laboratory or imaging tests. R00-R99 and Z00-Z99 codes had the highest frequencies within the patients for which consultation was requested. While the patients encoded with Z00-Z99 had WT and LOS values significantly lower than the average, the ones with R00-R99 had significantly higher WT and LOS values.
When all these findings were collectively analyzed, it was concluded that besides diagnostic test or consultation requests, different factors such as gender, age, arrival type, triage level, and patient diagnosis might affect patients’ wait times and LOS values.
Discussion
Although overcrowded ED environments are a global problem that health systems struggle with, the problem has become more severe in Turkey than in most other countries.5,24 National data obtained from the Ministry of Health in Turkey showed approximately 1475, 1550, 2010, 2145, 1535, and 2050 ED visits per 1000 population, respectively, between 2017–2021. These statistical data showed that the number of annual ED visits is greater than the country’s total population in Turkey. In contrast, annual ED visits per 1000 population are around 430 in the USA25 and 390 in England.26 While these vast numbers of visits can be associated with various national, cultural, and economic reasons, the most common reasons in Turkey are: that emergency care is free of charge, and the most straightforward route to a hospital bed is through EDs,27,28 frequent users,29,30 no appointment requirement,24,31 providing uninterrupted ED service while all other hospital and polyclinics provide service only within working hours.30
Since overcrowded ED environments cause increased patient waiting time and LOS, which leads to delays in decision-making, analyzing WT and LOS values and identifying the factors having significant effects on these ED performance indicators becomes a more crucial problem in Turkey’s case.
The study findings showed that while additional requests, such as diagnostic testing or consultation, may extend the LOS values of the patients, the waiting times of these patients were significantly lower than those for whom no additional requests were seen (Table 1). Besides the patients requiring other requests, the ones for which consultation was requested had the lowest WT and the highest LOS on average compared to the ones for which laboratory-type or imaging-type tests were ordered (Table 2). Since ordering diagnostic tests or consultation can be related to clinical acuity or complexity of ED patients,19,21,32,33 these results showed that although patients with higher acuity or complexity levels wait significantly lower in EDs, they stay longer in the system. Additional requests such as diagnostic tests and consultation may cause delays in making decisions on these patients.
In line with the existing studies,3,15,19,21 this study showed that besides such additional requests, different factors such as gender, age, arrival, type, triage level, and ICD-10 codes might have significant effects on patients’ wait times and stay lengths.
Limitations of this study include the single-institution setting, and findings may not generalize to other settings. Future multi-centre studies evaluating decision delay factors and their impact on ED’s operations management validate these findings. Other potential limitations of this study are the retrospective study design. It would have been ideal to evaluate data from the entire year. Only the first three months of data were reviewed for this study. Since the latter (after Mid-march 2020) was significantly affected by COVID. Since the COVID-19 outbreak affects the type, distribution, and density of applications to the ED, these periods were not included in the study.34,35 Finally, all admitted and discharged patients are analyzed together for research purposes, and grouping is done based on their diagnostic testing or consultation requirement status. The admitted and discharged patients may be grouped and analyzed comparatively for future research.
Conclusion
This study aimed to identify various factors causing delays in decision-making in EDs by retrospectively analyzing 129,981 patient data which arrived at a training hospital in Izmir City, Turkey, during the first quarter of 2020. Since extended wait times and stay lengths may cause delays in the decision-making processes of EDs, WT, defined as the time between patients’ admission and arrival, and LOS, defined as the time between patients’ departure and arrival, were defined as the output variables of this study. Gender, age, arrival type, triage level, ICD-10 coded diagnosis, and diagnostic tests or consultation status were identified as the factors that may significantly affect the WT and LOS of patients. The study findings mainly showed that additional requests such as diagnostic tests or consultation, which may be required to diagnose patients of EDs, cause significant increases in LOS values of patients. However, these patients have significantly lower WT. When a diagnostic test or consultation is required, since the responsible ED doctor waits for the results of these requests to decide appropriately on this patient, these requests cause delays in ED decisions. Besides, different factors such as gender, age, arrival type, triage level, and patient diagnosis were also identified as significant factors affecting the WT and LOS values of patients. If proper strategies and methodologies are developed to reduce these factors causing an increase in WT and LOS values and delays in ED decision-making, besides improving longer wait times and stay lengths, such strategies and methodologies may also provide solutions to the overcrowding problem of EDs.
Abbreviations
ED, emergency department; WT, waiting time (time between admission and arrival); LOS, length of stay (time between departure and arrival); ICD-10, International Classification of Diseases-10; A00-B99, Certain infectious and parasitic diseases; C00-D49, Neoplasms; D50-D89, Diseases of the blood and blood-forming organs and certain disorders involving the immune mechanism; E00-E89, Endocrine, nutritional and metabolic diseases; F01-F99, Mental, Behavioral and Neurodevelopmental disorders; G00-G99, Diseases of the nervous system; H00-H59, Diseases of the eye and adnexa; H60-H95, Diseases of the ear and mastoid process; I00-I99, Diseases of the circulatory system; J00-J99, Diseases of the respiratory system; K00-K95, Diseases of the digestive system; L00-L99, Diseases of the skin and subcutaneous tissue; M00-M99, Diseases of the musculoskeletal system and connective tissue; N00-N99, Diseases of the genitourinary system; O00-O9A, Pregnancy, childbirth and the puerperium; P00-P96, Certain conditions originating in the perinatal period; Q00-Q99, Congenital malformations, deformations and chromosomal abnormalities; R00-R99, Symptoms, signs and abnormal clinical and laboratory findings, not elsewhere classified; S00-T88, Injury, poisoning and certain other consequences of external causes; U00-U85, Codes for special purposes; V00-Y99, External causes of morbidity; Z00-Z99, Factors influencing health status and contact with health services.
Declaration of Helsinki
Guidelines outlined in the Declaration of Helsinki were followed.
Ethics Committee Approval
İzmir Bakırçay University, Non-interventional Clinical Studies, Institutional Review Board, approved in 30.11.2022 meeting, Approval ID:790, Research ID:770.
Informed Consent
Not required. This study is a retrospective and database study. Data acquired is kept anonymized.
Disclosure
The authors report no conflicts of interest in this work.
References
1. Darraj A, Hudays A, Hazazi A, Hobani A, Alghamdi A. The association between emergency department overcrowding and delay in treatment: a systematic review. Healthcare. 2023;11(3):385–396. doi:10.3390/healthcare11030385
2. Beştemir A, Aydın H. 300 million patient examinations per year; evaluation of emergency and polyclinic services of 2nd and 3rd stage public health facilities in Türkiye. Sakarya Med J. 2022;12(3):496–502.
3. Ataman MG, Sarıyer G. Predicting waiting and treatment times in emergency departments using ordinal logistic regression models. Am J Emerg Med. 2021;46:45–50. doi:10.1016/j.ajem.2021.02.061
4. Lindner G, Woitok BK. Emergency department overcrowding. Wien Klin Wochenschr. 2021;133(5):229–233. doi:10.1007/s00508-019-01596-7
5. Sarıyer G, Ataman MG, Kızıloğlu İ. Factors affecting length of stay in the emergency department: a research from an operational viewpoint. Int J Healthc Manag. 2020;13(sup1):173–182. doi:10.1080/20479700.2018.1489992
6. Yarmohammadian MH, Rezaei F, Haghshenas A, et al. Overcrowding in emergency departments: a review of strategies to decrease future challenges. J Res Med Sci. 2017;22:23. doi:10.4103/1735-1995.200277
7. Hoot N, Aronsky D. An early warning system for overcrowding in the emergency department. In:
8. Sullivan C, Staib A, Khanna S, et al. The National Emergency Access Target (NEAT) and the 4‐hour rule: time to review the target. Med J Aust. 2016;204(9):354–359. doi:10.5694/mja15.01177
9. Wang H, Kline JA, Jackson BE, et al. The role of patient perception of crowding in the determination of real-time patient satisfaction at Emergency Department. Int J Qual Health Care. 2017;29(5):722–727. doi:10.1093/intqhc/mzx097
10. Trotzky D, Tsur AM, Fordham DE, et al. Medical expertise as a critical influencing factor on the length of stay in the ED: a retrospective cohort study. Medicine. 2021;100(19):10. doi:10.1097/MD.0000000000025911
11. Suárez M, Asenjo MB, Sánchez M. Job satisfaction among emergency department staff. Australas Emerg Nurs J. 2017;20(1):31–36. doi:10.1016/j.aenj.2016.09.003
12. Rondeau KV, Francescutti LH, Zanardelli JJ. Emergency department overcrowding: the impact of resource scarcity on physician job satisfaction/practitioner application. J Healthc Manag. 2005;50(5):327.
13. McKenna P, Heslin SM, Viccellio P, Mallon WK, Hernandez C, Morley EJ. Emergency department and hospital crowding: causes, consequences, and cures. Clin Exp Emerg Med. 2019;6(3):189. doi:10.15441/ceem.18.022
14. Wessman T, Ärnlöv J, Carlsson AC, et al. The association between length of stay in the emergency department and short-term mortality. Intern Emerg Med. 2022;17(1):233–240. doi:10.1007/s11739-021-02783-z
15. Sarıyer G, Ataman MG, Kızıloğlu İ. Analyzing main and interaction effects of length of stay determinants in emergency departments. Int J Health Polic Manag. 2020;9(5):198–209.
16. Kuo YH, Chan NB, Leung JM, et al. An integrated approach of machine learning and systems thinking for waiting time prediction in an emergency department. Int J Med Inform. 2020;139:104143. doi:10.1016/j.ijmedinf.2020.104143
17. Savioli G, Ceresa IF, Gri N, et al. Emergency department overcrowding: understanding the factors to find corresponding solutions. J Pers Med. 2022;12(2):279. doi:10.3390/jpm12020279
18. Elkum N, Fahim M, Shoukri M, et al. Which patients wait longer to be seen and when? A waiting time study in the emergency department. East Mediterr Health J. 2009;15(2):416–424. doi:10.26719/2009.15.2.416
19. Sariyer G, Taşar CÖ, Cepe GE. Use of data mining techniques to classify length of stay of emergency department patients. Bio-Alg Med Sys. 2019;15(1):154.
20. Yoon P, Steiner I, Reinhardt G. Analysis of factors influencing length of stay in the emergency department. Canad J Emerg Med. 2003;5(3):155–161. doi:10.1017/S1481803500006539
21. Sarıyer G, Öcal Taşar C. Highlighting the rules between diagnosis types and laboratory diagnostic tests for patients of an emergency department: use of association rule mining. Health Informatics J. 2020;26(2):1177–1193. doi:10.1177/1460458219871135
22. Sariyer G, Ataman MG. How machine learning facilitates decision making in emergency departments: modelling diagnostic test orders. Int J Clin Pract. 2021;75(12):e14980. doi:10.1111/ijcp.14980
23. DaGar S, Sahin S, Yilmaz Y, et al. Emergency department during long public holidays. Tur J Emerg Med. 2014;14(4):165–171. doi:10.5505/1304.7361.2014.20438
24. Butun A, Kafdag EE, Gunduz H, et al. Emergency department overcrowding: causes and solutions. Emerg Crit Care Med. 2023. doi:10.1097/EC9.0000000000000078
25. CDC. National hospital ambulatory medical care survey. emergency department visits, by selected characteristics: United States. 2017.
26. NHS. Hospital accident and emergency activity 2018–19 London; 2019. Available from: https://files.digital.nhs.uk/F5/ACF07A/AE1819_Annual_Summary.pdf.
27. Öztürk S, Başar D. Equity in utilization of health care services in Turkey: an index based analysis. East Mediter Health J. 2020;26(5):547–555. doi:10.26719/emhj.19.090
28. Akbayram HT, Coskun E. Paediatric emergency department visits for non-urgent conditions: can family medicine prevent this? Europ J Gen Pract. 2020;26(1):134–139. doi:10.1080/13814788.2020.1825676
29. Işık GÇ, Tandoğan M, Şafak T, Çevik Y. Retrospective analyses of the frequent emergency department users. Euras J Emerg Med. 2020;19(2):89–93. doi:10.4274/eajem.galenos.2019.07108
30. Sariyer G, Ataman MG, Mangla SK, Kazancoglu Y, Dora M. Big data analytics and the effects of government restrictions and prohibitions in the COVID-19 pandemic on emergency department sustainable operations. Ann Oper Res. 2022;15:1–31.
31. Baykan O, Meral O, Öztürk T, Gönüllü H. Characteristics of non-urgent visits in emergency department. Ann Med Res. 2021;28(5):906–911. doi:10.5455/annalsmedres.2020.06.592
32. Gurazada SG, Gao S, Burstein F, Buntine P. Predicting patient length of stay in austra lian emergency departments using data mining. Sensors. 2022;22(13):4968. doi:10.3390/s22134968
33. Oakes SL, Gillespie SM, Ye Y, et al. Transitional care of the long-term care patient. Clin Ger Med. 2011;27(2):259–271. doi:10.1016/j.cger.2011.02.004
34. Al-Wathinani A, Hertelendy AJ, Alhurishi S, et al. Increased emergency calls during the COVID-19 pandemic in Saudi Arabia: a national retrospective study. Healthcare. 2020;9(1):14. doi:10.3390/healthcare9010014
35. Uppal A, Silvestri DM, Siegler M, et al. Critical care and emergency department response at the epicenter of the COVID-19 pandemic: New York City’s public health system response to COVID-19 included increasing the number of intensive care units, transferring patients between hospitals, and supplementing critical care staff. Health Aff. 2020;39(8):1443–1449.
 © 2023 The Author(s). This work is published and licensed by Dove Medical Press Limited. The
full terms of this license are available at https://www.dovepress.com/terms
and incorporate the Creative Commons Attribution
- Non Commercial (unported, 3.0) License.
By accessing the work you hereby accept the Terms. Non-commercial uses of the work are permitted
without any further permission from Dove Medical Press Limited, provided the work is properly
attributed. For permission for commercial use of this work, please see paragraphs 4.2 and 5 of our Terms.
© 2023 The Author(s). This work is published and licensed by Dove Medical Press Limited. The
full terms of this license are available at https://www.dovepress.com/terms
and incorporate the Creative Commons Attribution
- Non Commercial (unported, 3.0) License.
By accessing the work you hereby accept the Terms. Non-commercial uses of the work are permitted
without any further permission from Dove Medical Press Limited, provided the work is properly
attributed. For permission for commercial use of this work, please see paragraphs 4.2 and 5 of our Terms.
Recommended articles
Association Between the Emergency Department Length of Stay and in-Hospital Mortality: A Retrospective Cohort Study
Habib H, Sudaryo MK
Open Access Emergency Medicine 2023, 15:313-323
Published Date: 13 September 2023
An Updated Scoping Review of Factors Associated with Length of Stay in Emergency Department
Kurhayati K, Emaliyawati E, Trisyani Y
Journal of Multidisciplinary Healthcare 2025, 18:3191-3203
Published Date: 4 June 2025
Factors Associated with Length of Stay Among Patients in the Emergency Department of an Indonesian Tertiary Hospital: A Cross-Sectional Study
Kurhayati K, Trisyani Y, Emaliyawati E, Kurniawati ND
Journal of Multidisciplinary Healthcare 2026, 19:613153
Published Date: 24 June 2026