Back to Journals » Integrated Pharmacy Research and Practice » Volume 12
Factors Affecting Inventory Management Performance of Tracer Medicines Across Primary Health Care Units, Gamo Zone, Southern Nations Nationalities and People’s Region, Ethiopia
Authors Alemu AA, Fenta TG, Gebregeorgise DT
Received 28 December 2022
Accepted for publication 17 February 2023
Published 23 February 2023 Volume 2023:12 Pages 49—60
DOI https://doi.org/10.2147/IPRP.S401888
Checked for plagiarism Yes
Review by Single anonymous peer review
Peer reviewer comments 3
Editor who approved publication: Professor Jonathan Ling
Aynoshe Adio Alemu,1 Teferi Gedif Fenta,2 Dawit Teshome Gebregeorgise2
1Department of Pharmacy, College of Medicine and Health Sciences, Arba Minch University, Arba Minch, Ethiopia; 2Department of Pharmaceutics and Social Pharmacy, School of Pharmacy, Addis Ababa University, Addis Ababa, Ethiopia
Correspondence: Aynoshe Adio Alemu, Department of Pharmacy, College of Health Sciences, Arba Minch University, Arba Minch, Ethiopia, Email [email protected]
Background: Inventory management ensures access to tracer medicines (TMs) for priority health-care needs. Factors that impede its performance across primary health-care units (PHCUs) are less explored in Ethiopia. The current study assessed factors affecting the inventory management performance of TMs across PHCUs, Gamo zone.
Methods: A cross-sectional survey was conducted in 46 PHCUs between April 1 and May 30, 2021. The data were collected using document review and physical observation. A stratified simple random sampling was employed. The data were analyzed by SPSS version 20. The results were summarized as mean and percentage. Pearson’s product-moment coefficient and ANOVA were employed at a 95% CI. The correlation test established the relationships between dependent and independent variables. ANOVA test compared the performance between PHCUs.
Results: The inventory management performance of TMs across PHCUs is below the standard. On average stock according to the plan is 18%, the stock-out rate is 43%, the inventory accuracy rate is 78.5%, and availability across PHCUs is 78%. 72.3% of visited PHCUs fulfill storage condition criteria. Inventory management performance decreases downward the levels of PHCUs. There is a positive correlation between the availability of TMs and supplier order fill rate, r = 0.82, p < 0.01; between the availability of TMs and report accuracy, r = 0.54, p < 0.001; and between TMs stocked according to the plan and supplier order fill rate, r = 0.46, p < 0.01. The inventory accuracy was significantly different between primary hospitals and health posts (p = 0.009, 95% C.I = [7.57, 60.93]); and health centers and health posts (p = 0.016, 95% CI = [2.32, 25.97]).
Conclusion: The inventory management performance of TMs is below the standard. It is attributable to supplier performance, the quality of the report, and performance variation across PHCUs. These result in the interruption of TMs in PHCUs.
Keywords: inventory management, performance, PHCUs, TMs
Introduction
Inventory management is planning and controlling inventory levels to meet customer demand through the process of ordering, receiving, storing, issuing, and recording inventory.1 Inventory management ensures access to tracer medicines (TMs) which is crucial to a priority healthcare need of the public.2 Therefore, appraising factors impeding the inventory management performance of TMs outline how well the inventory management operation is working towards its goal.
Inventory management is the heart of health supply chain management (SCM). It is important in multiple health SCM functions of inventory replenishment, demand forecasting, storage space utilization, inventory visibility, and inventory valuation operations.3 Thereby, a well-functioning inventory management operation minimizes shortage and wastage of life-saving TMs4 and is a basis for supply chain efficiency and effectiveness.5 This could help the health sector to properly utilize scarce resources and ensures a steady supply of health products to meet the high standard of patient care. Consequently, the public health sector achieves its performance objective by cost reduction while improving customer satisfaction levels.6
However, different factors influence the operational performance of inventory management. Limited organizational resources and capability determine inventory management performance.7 The limited organizational resources and capabilities such as low adoption of information technology in the inventory management system8,9 influence the inventory management performance of health SCM. Utilization of technology like Enterprise Resource Planning (ERP), Radio Frequency Identification (RFID), virtual centralization of the supply chain, and vendor-managed inventory system ensures a smooth flow of products and information.10 However, due to limited resources, they are not well implemented in developing countries. The inventory management and control system at last- mile supply chains of developing countries is frequently performed manually is tedious and demands human labor. In addition to resource-related factors, delivery performance of re-supply points determine inventory management performance in the public health sector, particularly in last-mile supply chains.11
Consequently, there is frequent interruption of TMs at the last-mile supply chains of health facilities. In Ethiopia, primary health-care units (PHCUs) are last-mile supply chains on which more than 80% of the population rely for primary health-care services.12,13 Despite this enhanced responsibility, there is an interruption of essential medicines in PHCUs and they are usually subjected to providing substandard quality healthcare.14
To mitigate this problem, Ethiopia has implemented an integrated pharmaceutical logistics system (IPLS) which integrates fragmented vertical systems into one supply chain. This is intended to ensure a high-performing healthcare supply chain that ensures access to essential medicines in public health facilities.15 This calls for the well-performing of basic IPLS components such as inventory management and control systems. The inventory control system for the IPLS is a forced ordering maximum/minimum inventory control system. It is a scheduled reporting and re-supply system performed in all public health facilities by using recording, reporting, and ordering tools. Bin cards and stock cards are used to record and track stock in storage. On the other hand, Health Post Monthly Report and Resupply Form (HPMRR); the Internal Facility Report and Resupply (IFRR); and the Report and Requisition Form (RRF) are used to report and order pharmaceutical products.15 In this regard, HPMRR is used to report essential data items to respective health centers; IFRR is used to issue and receive pharmaceuticals within a health facility; and RRF is used to report essential data items and order pharmaceuticals from Ethiopian pharmaceutical supply service, a major supplier.15,16 So, it is imperative to monitor the inventory management operation towards the operating standards.
A study conducted in the Southern Nation’s Nationalities and People’s Region (SNNPR), Ethiopia on human immune deficiency virus/acquired immune deficiency syndrome (HIV/AIDS) revealed that the inventory management performance of HIV/AIDS commodities was defective.17 But it was less inclusive in terms of incorporating multiple health program commodities that are considered better indicators of performance, and it also overlooked health posts whose inventory management practice is as important as other health facilities. Gamo zone is one of the most populous areas in SNNPR. Its health program performance has a greater impact on the overall SNNPR health sector performance. But the anecdotal evidence from service providers and customers shows that health services are frequently interrupted due to low access to TMs. However, there are limited comprehensive data that pinpoint the inventory management performance of TMs and its associated factors across PHCUs.
Therefore, the current study aimed to assess the inventory management performance indicators of TMs and associated factors across PHCUs in the Gamo zone. It described inventory management performance and analyzed factors affecting its performance. To this end, the study pinpointed the performance of inventory management by the level of PHCUs that support a proper decision.
Methods
Study Area
The current study was conducted in the Gamo zone which is one of the most populous zones in SNNPR. The administrative center of the Gamo zone is Arba Minch, which is about 505 kilometers away from Addis Ababa. According to Central Statistics Agency’s 2007 projected population, currently, 1.6 million people live in the Gamo zone.18 Of these, 178, 000 people (20%) live in urban areas while 1.2 million (80%) live in rural areas. Administratively, the Gamo zone is divided into 14 districts, 4 town administrations, and 303 kebeles (35 urban and 268 rural). Currently, there are 363 government-owned health-care facilities (362 PHCUs and one general hospital) and 186 privately owned health facilities (49 retail pharmacies and 137 clinics).
Study Design and Period
A retrospective cross-sectional survey was conducted in PHCUs between April 1 and May 30, 2021. This study design used to compare the inventory management performance with factors that impede the operational performance of inventory management.
Study Units and Participants
All PHCUs such as primary hospitals, health centers, and health posts in the Gamo zone are study units. Moreover, TMs and logistics reporting tools such as RRF and HPMRR, and bin cards for selected TMs are study units.
Inclusion and Exclusion Criteria
PHCUs that manage TMs for health programs such as tuberculosis, HIV/AIDS, malaria, Reproductive Health, and Maternal and Child Health were included in the study. Nevertheless, PHCUs that had a history of an intervention on SCM one year preceding the study period and are difficult to access due to geographical and seasonal factors were excluded from the sampling frame.
Study Variables
Dependent Variable
Inventory management performance indicators.
Independent Variable
RRF/HPMRR performance, supplier delivery performance, storage condition, level of PHCUs.
Sample Size and Sampling Process
A stratified simple random sampling method was employed to select study units from levels of PHCUs. This proportionate stratified sampling method ensures the representativeness of each stratum of PHCU.18 Thereby, the PHCUs are stratified as primary hospitals, health centers, and health posts due to a variation in LMIS reporting schedules and TMs they manage. Health posts are widely dispersed and they incur high data collection costs, so they were stratified under each selected health center. This is because in Ethiopia on average there are five satellite health posts under each health center.
Inventory management performance indicator medicines were selected from a national list of TMs for PHCUs. They were further screened by incorporating viewpoints of experts’ opinions from a major supplier and health program managers at Gamo zone health department (ZHD). The screening criteria were based on current prescription guidelines, client load on the regimen, and a range of or proportion of TMs for each selected health program. Consequently, 18 TMs were selected for the study (Refer to Table 1).
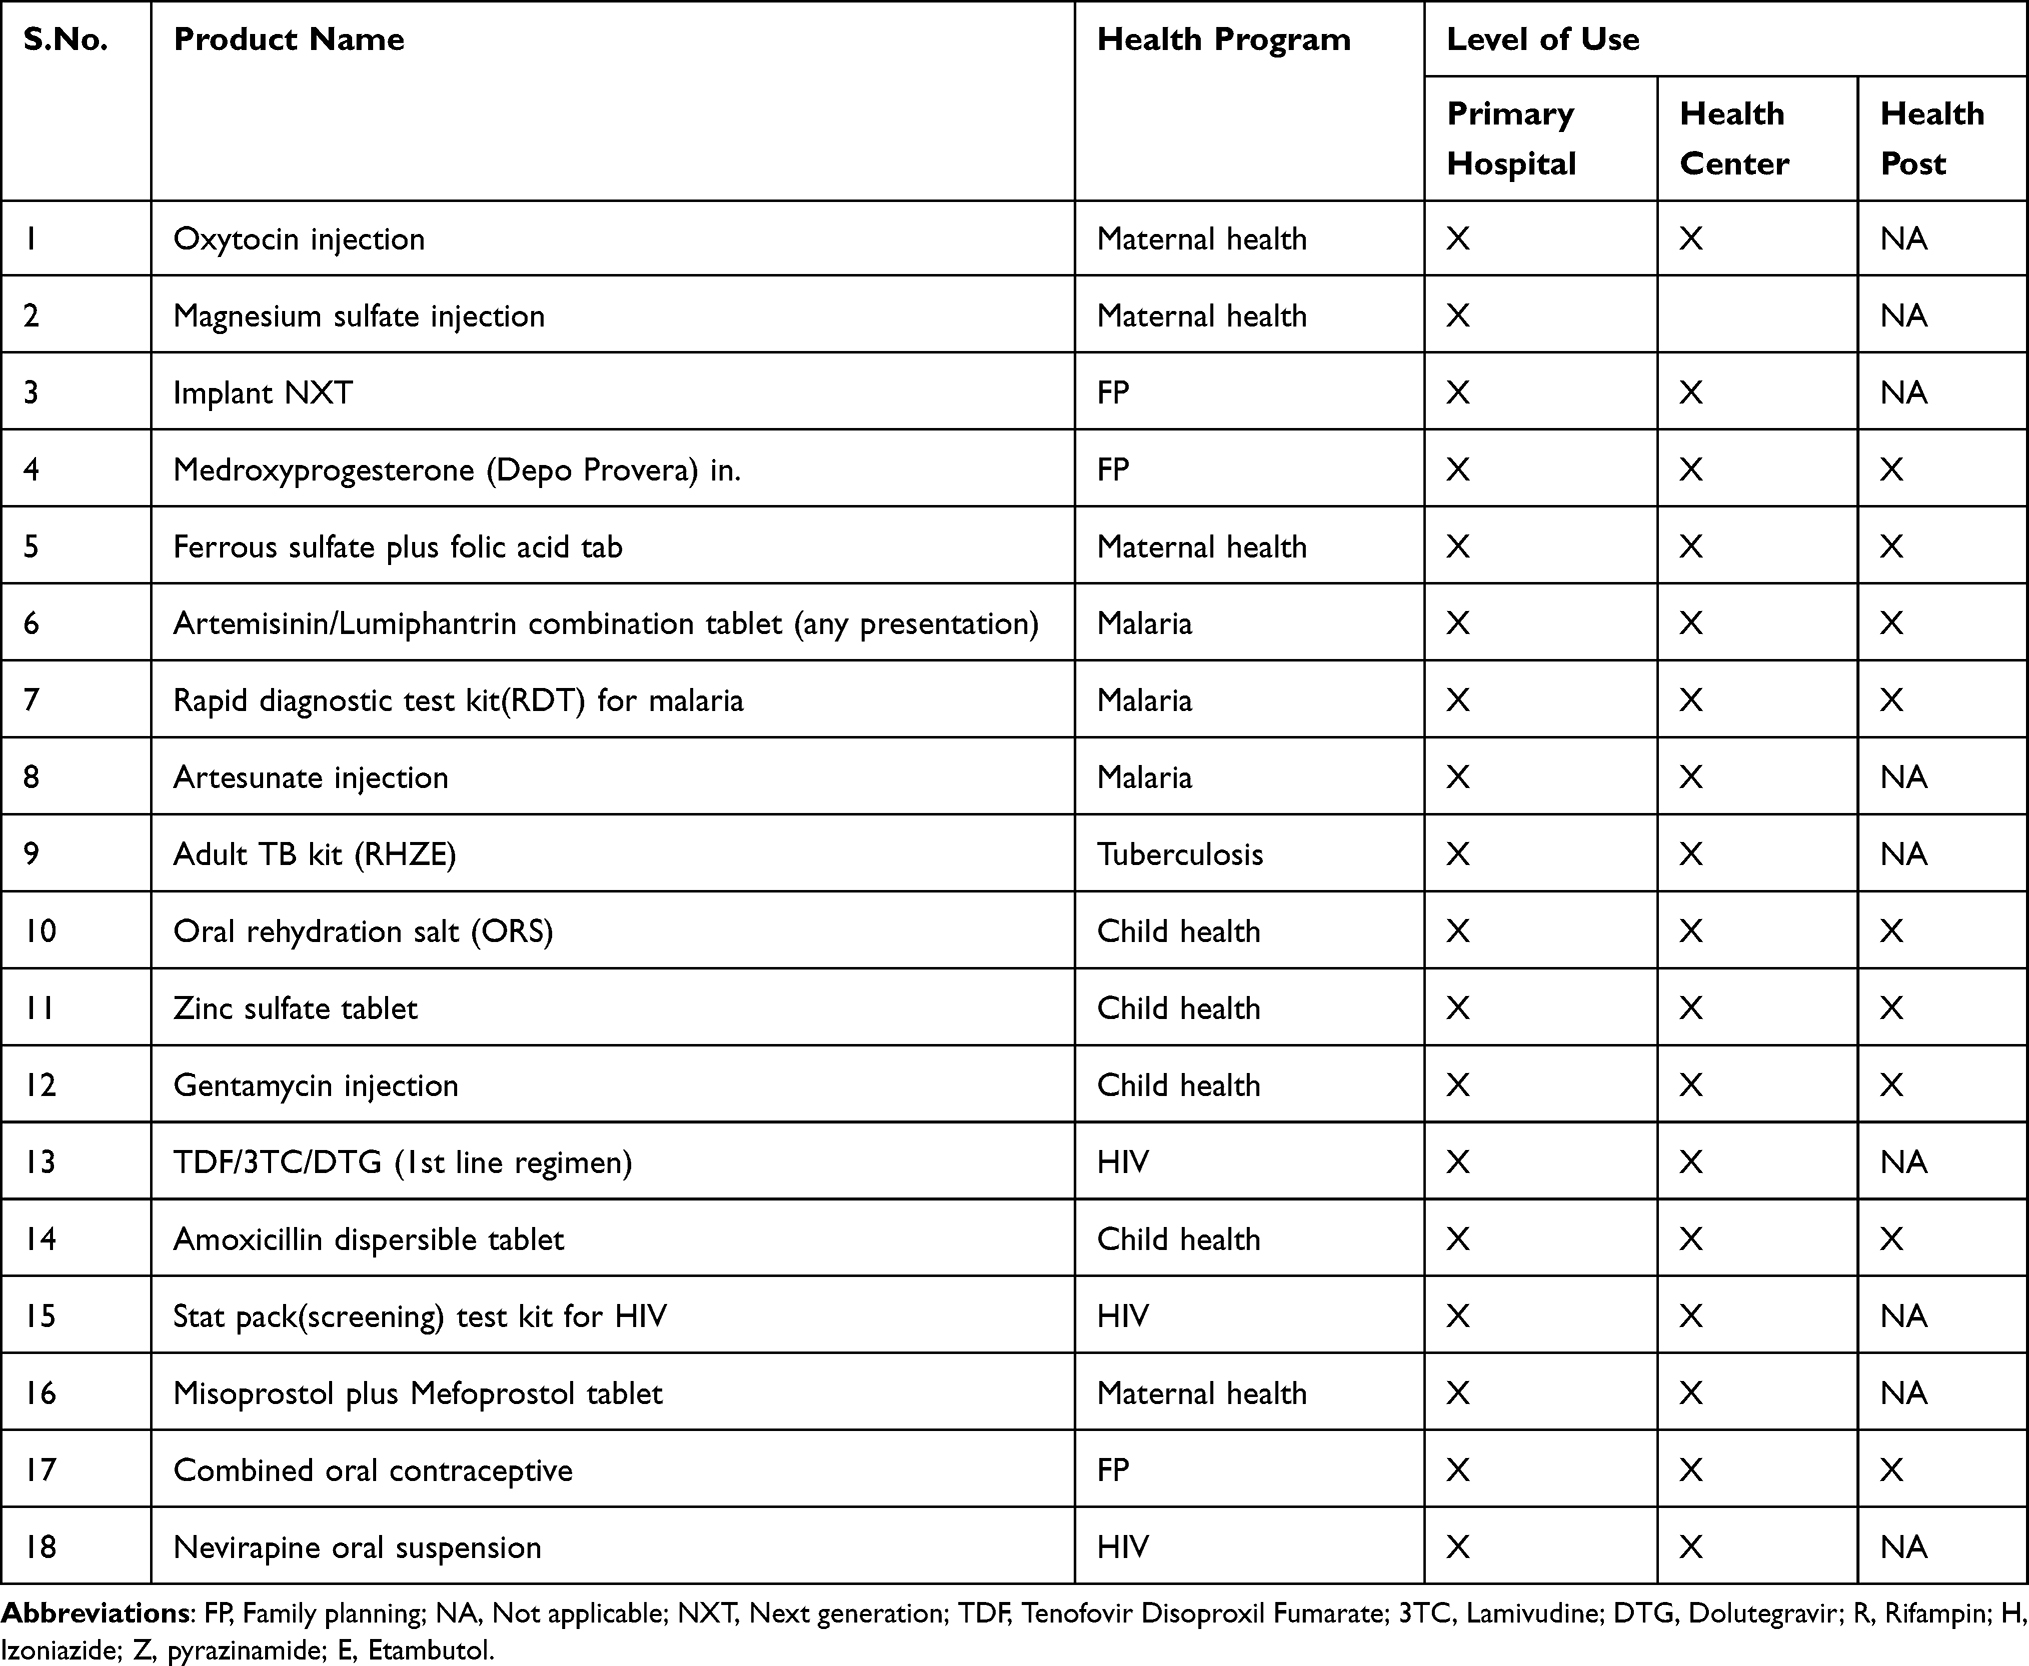 |
Table 1 Selected Inventory Management Performance Indicator TMS Across PHCUs of Gamo Zone, December 2021 (n = 18) |
For a statistically significant sample size in case of resource constraints, John Snow, Inc./DELIVER recommends at least 15% of the target population to maximize the power of generalization.19 Thereby, the sample size of the study would be 362*0.15=54 PHCUs. However, a slight adjustment was done due to the national health delivery system (i.e., on average five satellite health posts per health center) and the risk of low representation of primary hospitals in the target population. Consequently, 2 primary hospitals, 14 health centers, and 30 health posts were included with a total of 46 PHCUs (Refer to Table 2).
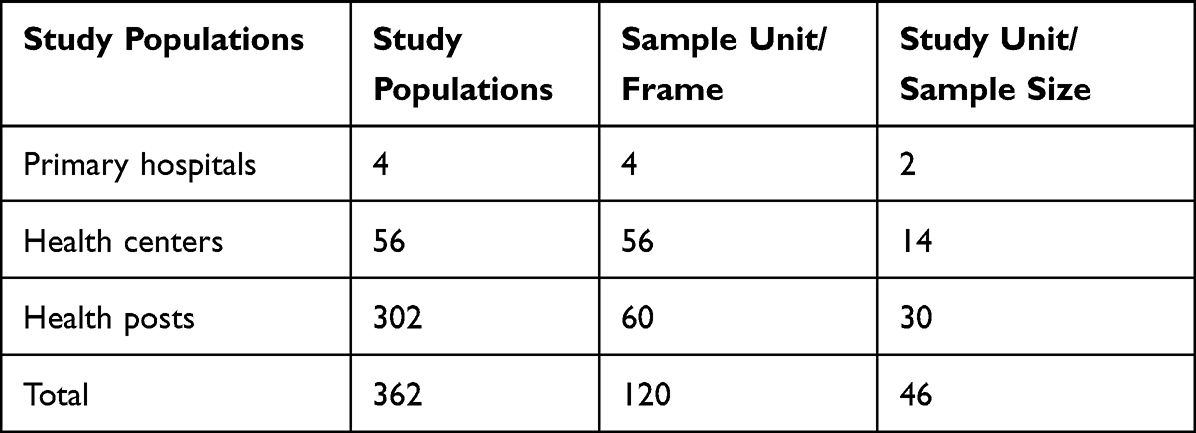 |
Table 2 Sample Size Determination of PHCU, Gamo Zone, December 2021 |
Methods of Data Collection
Data collectors and supervisors were recruited from public health facilities and district health offices. The team comprised six diploma holders and two bachelor’s degree holders. Based on experience and level of education qualification, degree holders were assigned as supervisors.
The questionnaire was adapted from Logistics Indicators Assessment Tool (LIAT) developed by USAID | DELIVER PROJECT and national health supply chain monitoring and evaluation indicator frameworks for inventory management performance.20,21 Inventory management performance indicator data and its determinants were from different levels of PHCUs.
As an inventory management performance indicator, the availability of selected TMs was checked in the facility store and different dispensing units at the time of the visit. Data for the stock status was gathered from current availability and tracing average monthly consumption (AMC) of the most recent months’ data. Likewise, the stock-out data for each TM during the study period were collected from bin cards and RRF/HPMRR complemented by an interview with the store manager and dispenser. For updated bin cards, the inventory record accuracy of selected TMs was checked against the physical count.
As part of the study, essential data elements of ending balance, calculated monthly consumption, and losses/adjustments data were checked for RRF/HPMRR report completeness. Similarly, it was checked for accurate transcription of the beginning versus ending balance of recent and two consecutive reports. Moreover, RRF/HPMRR reports were checked for compliance with their reporting schedule.
The observation checklist adapted from LIAT was used to compare adherence of the facility to good storage condition standards. Eleven storage condition criteria which are commonly practiced in all levels of PHCUs were selected. It is to determine whether the storage condition is appropriate to maintain physical integrity and support the smooth flow of inventory.
Supplier order fulfillment data were collected from RRF/HPMRR and stock transaction vouchers, and model 19. The quantity ordered data of TMs were compared with the receipt voucher of model 19 in PHCUs and the stock transfer vouchers of the supplier. Finally, the ordered fill rate for each TMS was computed.
Data Quality Assurance
A data quality assurance measure was made before, during, and after the data collection procedure. The questionnaire was first prepared in English and then translated into Amharic version and back-translated to English to test consistency. One half-day training was given for data collectors and supervisors on the tools and feedback was incorporated accordingly. Then, a pilot test was conducted on 5% of the population to test validity and the tool was modified based on the findings. The principal investigator oversaw the status of the daily data collection procedure. In the end, data were checked for their consistency and completeness before the analysis.
Data Processing and Analysis
It is the process of interpreting the survey data to answer the research question. Thus, after checking for completeness, quantitative data were entered into the Social Science Statistical Package (SPSS) version 20 (IBM Corporation, Armonk, New York, USA) for analysis. The pre-coded data were entered into SPSS software. Descriptive statistics like the mean and percentage of inventory management performance were summarized.
Inferential statistics such as Pearson’s product-moment coefficient (r) and one-way analysis of variance (ANOVA) were employed at a 95% confidence interval (C.I). The correlation test was adopted to establish the relationships between suppliers’ order fill rate and inventory management performance in PHCUs. A one-way ANOVA test was employed to compare the means of inventory management performance between PHCUs.
Operational Definitions
- Availability: Present of TMs at any quantity of dispensing unit and presentation.
- Health post: Health-care institution at the grass root level that serves between 3000 and 5000 people.
- Inventory accuracy: It is the absence of any discrepancy between inventory records in observed bin cards and the physical count of selected TMs.
- Report accuracy: The ending versus beginning balance quantity of each selected TMs in two consecutive reports of RRF/HPMRR.
- Report completeness: All essential data elements such as ending balance, calculated monthly consumption, and losses/adjustments data fields were completed for each selected TMs.
- Stock status: Quantity of TMs between stock levels of 1 to 4 months for primary hospital and health center, and 0.5 to 2 months for health posts.
- Stock-outs: Absence of selected TMs in PHCUs at least once during six months before the date of the survey.
- Tracer medicine: Essential medicine expected to be managed by all PHCUs and available at a maximum tolerable of 90% stock.
Results
According to the current study, the majority of reviewed TMs across PHCUs are below and/or above the appropriate stock level (Refer to Figure 1). On average, only about 18% of TMS are found to be at appropriate months of stock. Similarly, on average, there is a high percentage (43%) of TMs that encounter stock-outs at least once during the six months of the study period (Refer to Figure 2). There are differences between the stock-out rates of TMs in primary hospitals (18.5%) and health posts (87.7%). Regarding the records, the study reviewed bin cards of selected TMS and identified average inventory accuracy rate of 78.5% (Refer to Figure 3). Average availability of TMS at the time of the visit across PHCUs is 78% (Refer to Figure 4). In the health post (62%), it is below the average of reviewed TMs across all levels of PHCUs.
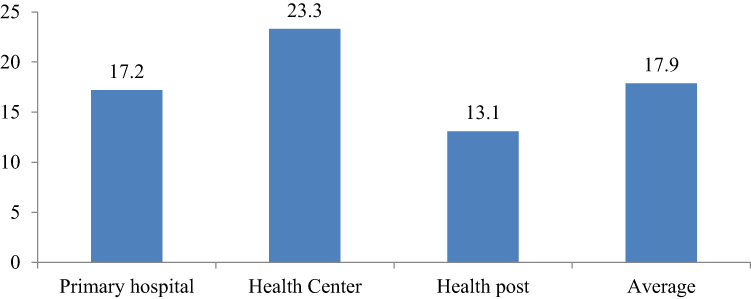 |
Figure 1 Stocked according to the plan of TMs cross PHCUs, Gamo zone, December 2021. |
 |
Figure 2 Stock-out rate of TMs across PHCUs, Gamo zone, December 2021. |
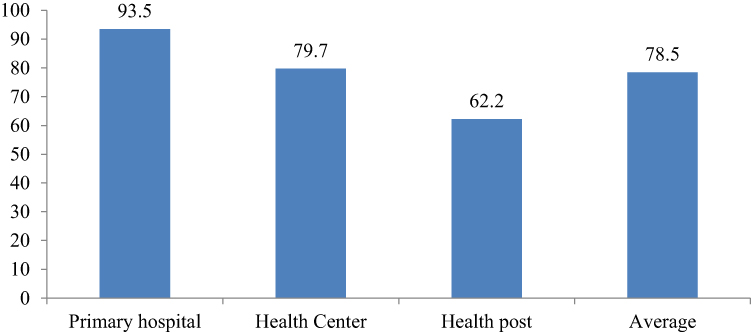 |
Figure 3 Inventory accuracy rate of TMs across PHCUs, Gamo zone, December 2021. |
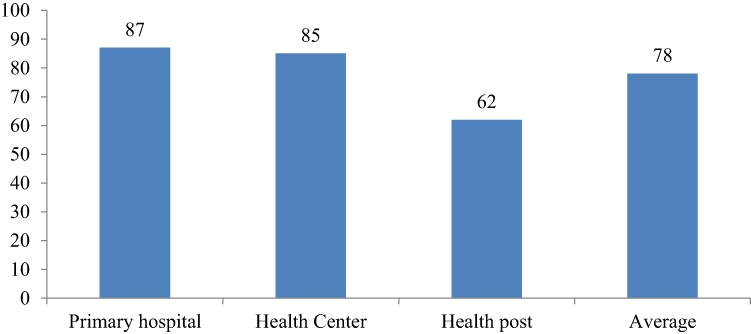 |
Figure 4 Availability of TMs at the time of visit across PHCUs, Gamo zone, December 2021. |
According to the current study, about 72.3% of visited PHCUs fulfill at least 80% of the storage condition criteria (Refer to Table 3). Of these, only 28 (60%) are properly remove damaged and expired health products from the medical store. About 17 (37%) PHCUs stored medicines in condition, it is difficult to track their expiry dates visually. Moreover, only 30 (60%) PHCUs are stored items in the first-to-expire, first-out (FEFO) principle.
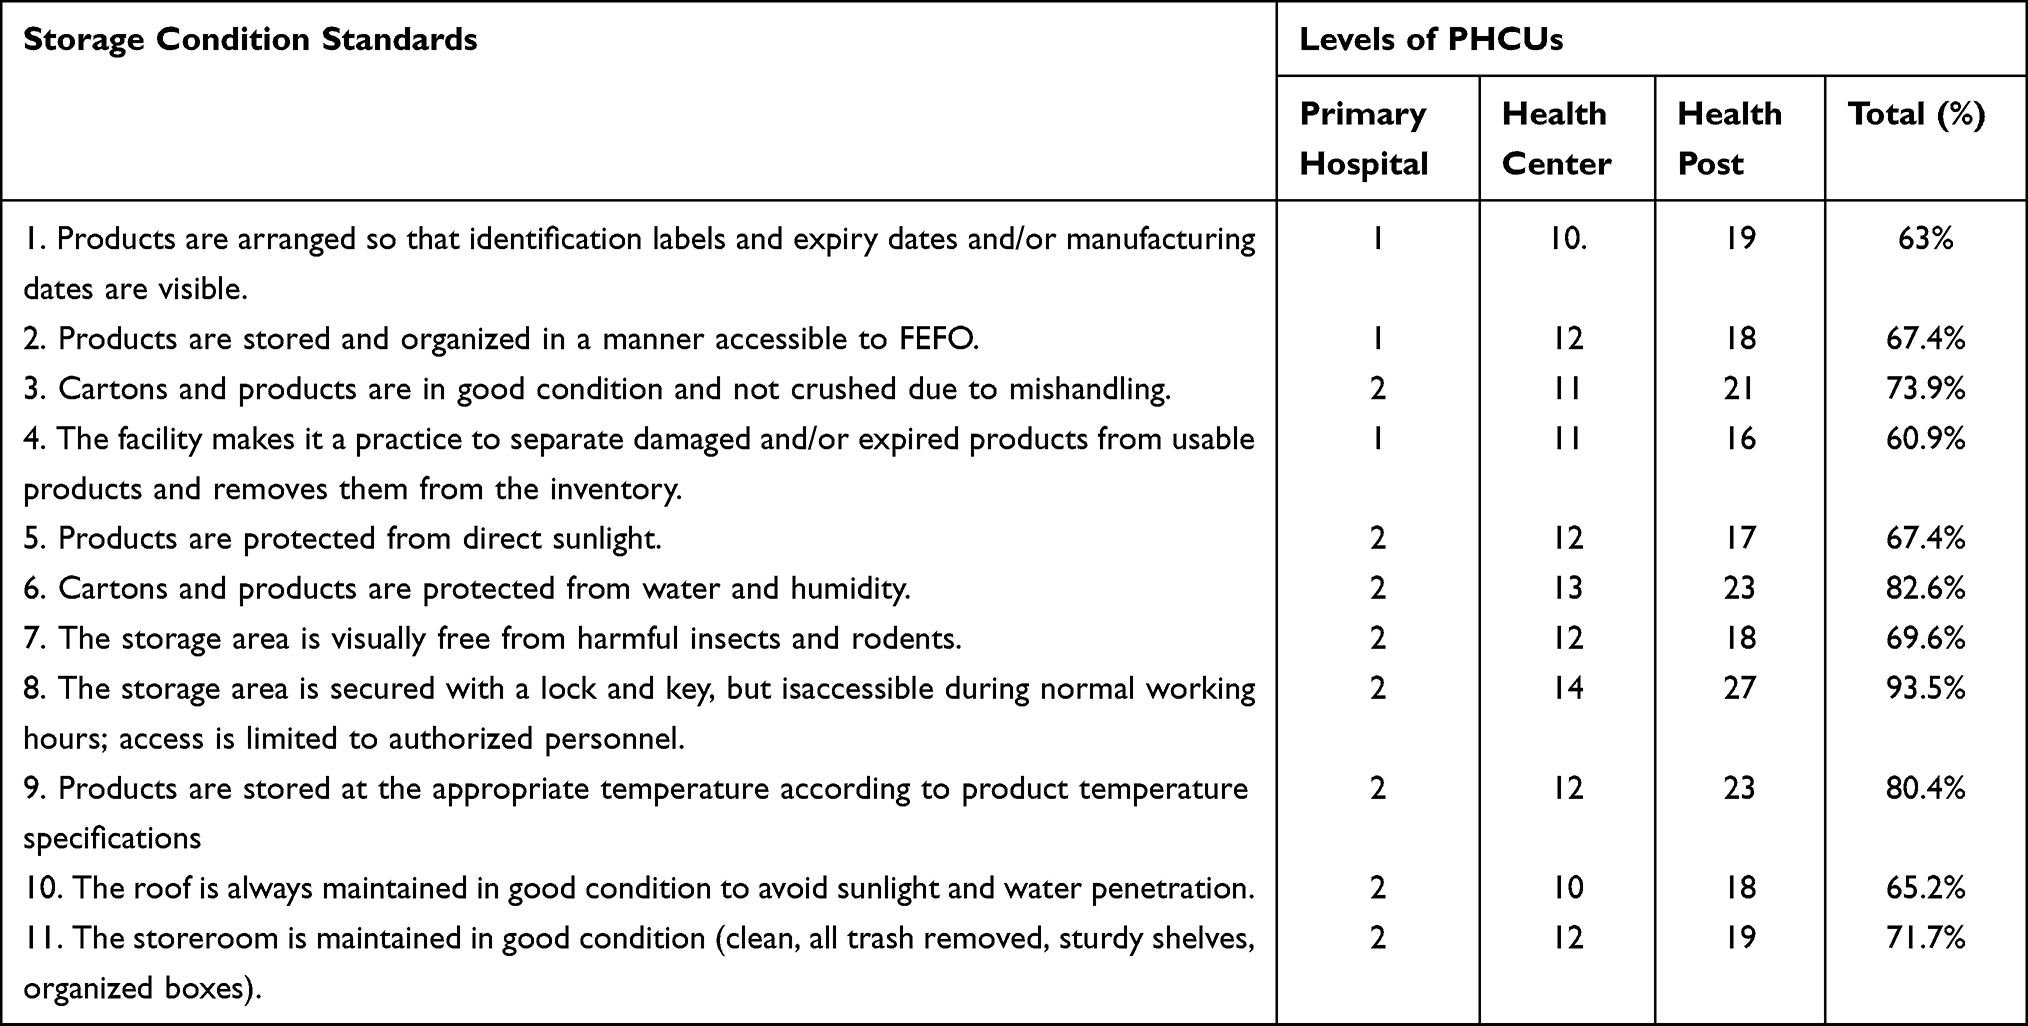 |
Table 3 Pharmaceutical Storage Condition Performance Across PHCUs, Gamo Zone, SNNPR, December 2021 (n = 46) |
The study employed inferential statistics to show the relationship between dependent and independent variables. Thereby, a scatterplot was used to show whether there is a linear relationship between dependent and independent variables. According to the assumption, there was a positive linear relationship between both dependent and independent variables. The bivariate correlation test shows a strong positive correlation between the availability of TMs and supplier order fill rate, r = 0.82, p<0.01 (Refer to Table 4). There is also a moderate positive correlation between TMs stocked according to the plan and supplier order fill rate, r = 0.46, p<0.01.
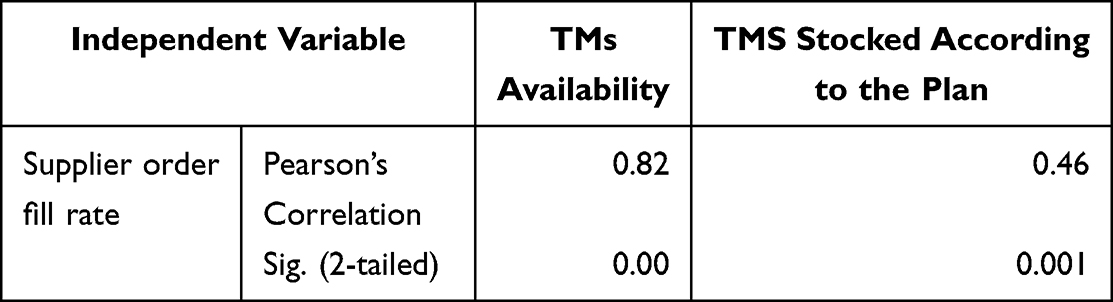 |
Table 4 Correlation Matrix of Supplier Order Fill Rate and Inventory Management Performance Indicators of PHCUs in Gamo Zone, December 2021 (n = 46) |
Similarly, there is a strong positive correlation between average availability of TMs and RRF/HPMRR accuracy rate, r = 0.54, p<0.001 in PHCUs of the Gamo zone (Refer to Table 5).
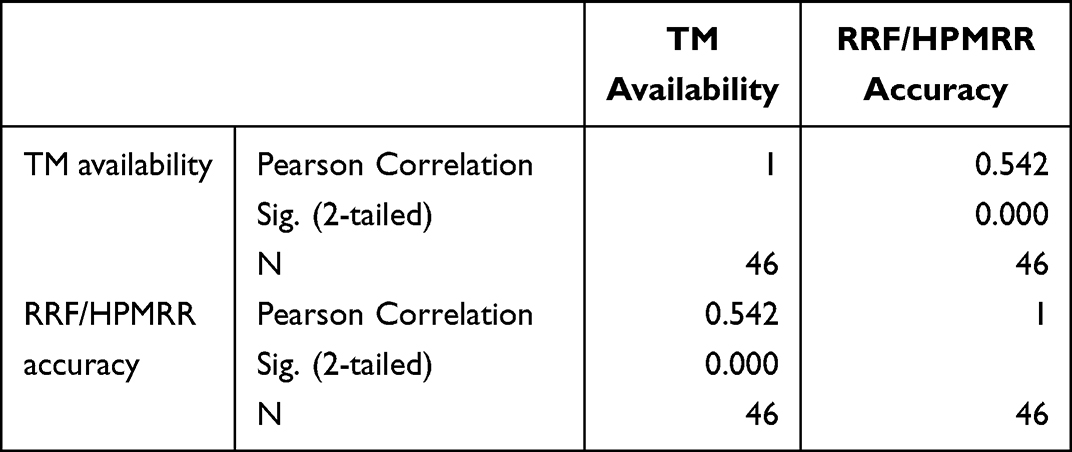 |
Table 5 Correlation Between the TMs Availability and RRF/HPMRR Accuracy Rate in PHCUS, Gamo Zone, December 2021 (n = 46) |
Presuming that PHCUs are independent of inventory management operations, sample data were tested for the fulfillment of the assumption. Levene’s test was used to examine if homogeneity met the assumption and the output showed the variances are equal (Refer to Table 6). Then, a one-way ANOVA was performed to compare the effect of the level of PHCUs on the inventory accuracy rate. A one-way ANOVA revealed that there was a statistically significant difference in mean inventory accuracy rate between at least two groups F (2, 43) = [7.95], p = 0.001 (Refer to Table 7).
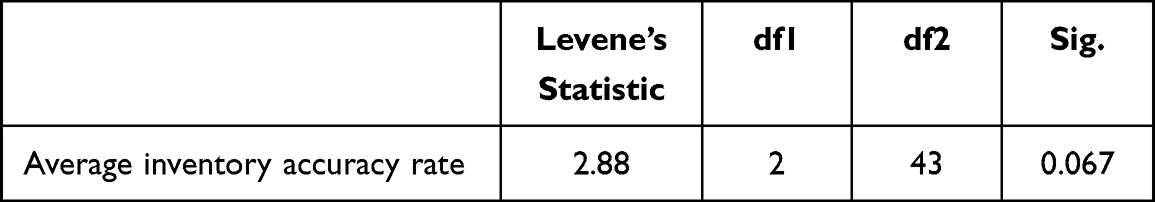 |
Table 6 Test of Homogeneity of Variance |
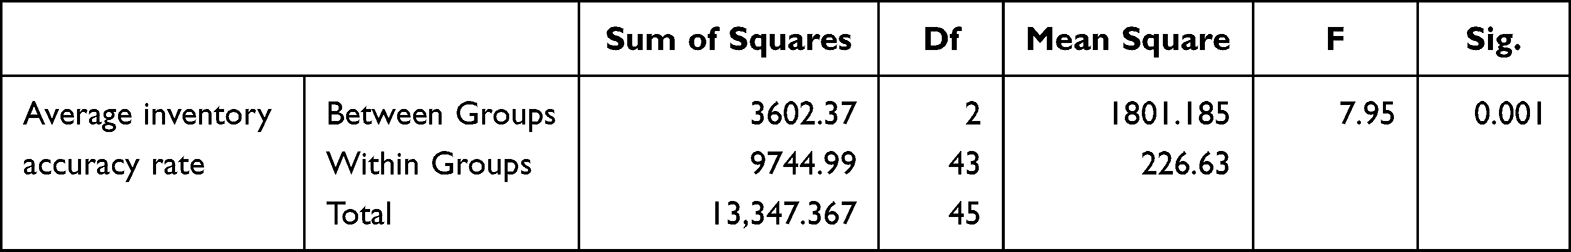 |
Table 7 Table from a One-Way ANOVA |
Tukey’s HSD Test was applied for multiple comparisons (Refer to Table 8) and it found that the mean inventory accuracy rate was significantly different between primary hospitals and health posts (p=0.009, 95% C.I = [7.57, 60.93]); and health centers and health posts (p=0.016, 95% CI = [2.32, 25.97]). However, there was no statistically significant difference in the mean inventory accuracy rate between primary hospitals and health centers (p=0.193).
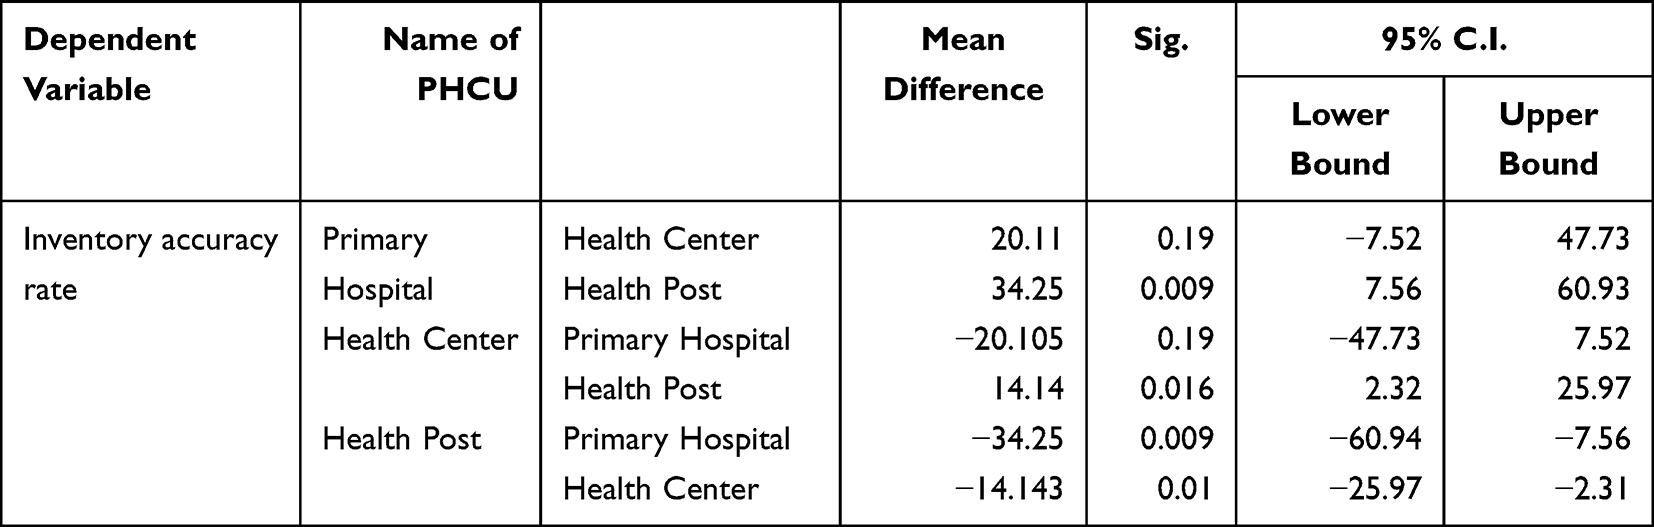 |
Table 8 Tukey’s HSD Multiple Comparisons Post Hoc ANOVA Tests |
Discussion
As part of the inventory management performance indicator, the current study assessed the stock according to the plan of TMs across PHCUs in the Gamo zone. Accordingly, on average only 18% of reviewed TMs are at appropriate months of stock. This deviates fivefold from the standard that recommends at least 90% of TMs should be available at appropriate months of stock at the health facility level in developing countries.22 This implies that there is a poor inventory control practice. Thus, most of the reviewed TMs are either overstocked or under stocked which in turn results in supply interruption and wastage. A lack of regular stock status tracking and intervention is a possible explanation for the finding. Stock according to the plan of TMs varied across PHCUs and the least is found to be in the health posts (13.1%) followed by primary hospitals (17.2%). Besides the aforementioned factors, the quality of AMC or calculated consumption data and supplier order fill rate is a possible factor. The current study analyzed that stock according to the plan of TMs is significantly influenced by supplier order fill rate at p-value <0.01. The qualitative data from the previous study support this finding11 in that frequent shortage of commodities on the supplier side is a major bottleneck of inventory management performance. In this regard, the current study quantitatively measured the strength of the relationship between supplier order fill rate and stock status of TMs across PHCUs.
The stock-out rate is another inventory management performance indicator. The study revealed that on average, 43% of reviewed TMs encountered stock-out at least once within six months of the study period. It deviates from the standard that recommends less than 5% of the stock-out rate in public health facilities for developing countries.22 The maximum stock-out rate is found to be in health posts (87.7%). It is also an implication of poor inventory control systems in the health posts. Relatively, there is a low stock-out rate in health centers (22.7%) and primary hospitals (18.5%). This could be because the primary hospitals and most of the health centers are re-supplied from the main supplier while health posts are re-supplied by respective health centers. These multiple tiers of distribution contribute to a high stock-out rate at health posts. Moreover, the stock-out rate of TMs across PHCUs could be due to a low supplier order fill rate, the quality of logistics reports and records, and the levels of PHCUs.11,23,24 However, the mean stock-out rate in the current study is lower than that of the previous study (53.3%) conducted in public health facilities in SNNPR.17 The difference is attributable to a closed system of some health program laboratory commodities of the previous study that are sourced solely from their respective laboratory machine manufacturer and supplier.
The inventory accuracy rate of TMS is another inventory management performance indicator. According to the current study, the average inventory accuracy rate is below the standard across levels of PHCUs. The national standard recommends an inventory accuracy deviation of a maximum of 10% between inventory records against physical count.25 According to the current study, the primary hospitals (93.5%) fulfill the national standard. However, the mean inventory accuracy rate of TMs across PHCUs is 78.5%. This is attributable to relatively the low performance of health centers (79.7%) and health posts (62.2%). However, the current finding is higher than the inventory accuracy rate (52.4%) and (30.4%) of the previous studies conducted in public health facilities of the West Wollega and Jimma zones of Oromia region, Ethiopia, respectively.11,26 But, the current finding is comparable with the result (77%) of the previous study conducted in public health facilities of SNNPR.17 According to the current study, there is a statistically significant inventory accuracy rate difference between health posts and primary hospitals, and health posts and health centers at 95% CI. Thus, there is an improper utilization of inventory management tools like bin cards in the health posts. This means that there is a significant difference between PHCUs in data quality of reporting, calculating re-ordering quantities, and monitoring stock status.
The average availability of TMs across PHCU (78%) is below the standard (90–100%) which is stipulated by the national health sector transformation plan II.12 The lowest availability of TMs is found to be in the health posts (62%). This could be due to the poor inventory accuracy rate of TMs which negatively affects resupply decisions for health posts. The previous studies conducted in health centers in Adama town, East Shewa of Oromia region, and public health facilities of Dessie, North-East, Ethiopia revealed average availability of TMs 76.3% and 74.7%, respectively.27,28 These findings are similar to the current study despite they are conducted at health facilities in town and hence have better access to a major supplier. The data contribute a clearer understanding of the availability of TMs not only depending on supplier performance but also facility-level inventory management operations. In line with this, there is a strong positive correlation between the average availability of TMs and RRF/HPMRR accuracy rate across PHCUs, r = 0.54, p<0.001. This is to mean that the quality of reporting, which depends on the inventory accuracy rate has a significant effect on the availability of TMs.
About 33 (72.3%) visit PHCUs to fulfill required pharmaceutical storage conditions. About 60% of PHCUs properly segregate usable and unusable pharmaceutical products and apply the FEFO principle. However, only 63% of visited PHCU store pharmaceuticals according to manufacturer labeling. This is to mean that some inventory management practices in the store do not adhere to good storage standards.
The result of the current study is valid for answering the research questions objectively by using appropriate statistical tests. Nevertheless, as a limitation, the current study recommends further qualitative study to build on areas that have not yet been addressed including from a major supplier perspective.
Conclusion
The current study revealed that there is poor inventory management and control system of TMs across PHCUs in the Gamo zone. Operational performance indicators of inventory management and control system are not performing according to the national standards. The problem is increasing downward the level of PHCUs. In addition to internal operation gaps, supplier delivery performance is a significant contributing factor to the low performance. Consequently, the low performance is contributing factor to the frequent interruption of life saving TMs across PHCUs and compromises the quality of healthcare.
Abbreviations
AMC, Average Monthly Consumption; ERP, Enterprise Resource Planning; FEFO, First-to-Expire, First-Out; LIAT, Logistics Indicators Assessment Tool; RFID, Radio Frequency Identification; RRF, Reporting Requisition Form; SNNPR, Southern Nation’s Nationalities and People’s Region; SCM, Supply Chain Management; TM, Tracer Medicine; HPMRR, Health Post Monthly Report and Re-Supply Form; HIV/AIDS, Human Immune Deficiency Virus/Acquired Immune Deficiency Syndrome; IFRR, Internal Facility Reporting and Re-Supply Form; IPLS, Integrated Pharmaceutical Logistics System; PHCU, Primary Healthcare Units; ZHD, Zonal Health Department.
Data Sharing Statement
Data can be obtained from the corresponding author upon request.
Ethics Approval and Consent to Participate
The research protocol was submitted for approval to a research ethics committee before implementation. It was reviewed by the ethical review committee based on operational guidelines. The research procedure complies with the guidelines and ethical approval was granted by the institutional review board of the School of Pharmacy, Addis Ababa University with the reference number ERB/SOP/237/13/2021. The written communication was made between the School of Pharmacy, Addis Ababa University, and the Gamo ZHD. Then, the permission letter was obtained from the Gamo ZHD and the district health offices sequentially. Finally, the PHCUs were communicated using letters received from ZHD and district health offices. Then, the selected health facilities were informed with formal letters after getting permission from the Gamo ZHD. During the consent process, the selected PHCU were provided with written information regarding the purpose of the study, and why and how the facilities are selected to be involved in the study. The authors confirm that the study was implemented per the principles of the Declaration of Helsinki.
Acknowledgments
The authors would like to thank the Addis Ababa University Graduate Study that facilitates this study. We are also grateful to the Gamo ZHD; district health offices; and PHCUs for providing us with all the necessary data for the study. Last but not least, our acknowledgment goes to both data collectors and interviewees.
Author Contributions
All authors made a significant contribution to the work reported, whether that is in the conception, study design, implementation, acquisition of data, analysis and interpretation, or in all these areas; took part in drafting, revising or critically reviewing the article; gave final approval of the version to be published. All authors have agreed on the journal to which the manuscript has been submitted; and agree to be accountable for all aspects of the work.
Disclosure
The authors report no conflicts of interest in this work.
References
1. Boche B, Mulugeta T, Gudeta T. Assessment of inventory management practices at the Ethiopian pharmaceuticals supply agency, Addis Ababa, Ethiopia. Integr Pharm Res Pract. 2020;9:175–183. doi:10.2147/IPRP.S269421
2. Yadav P. Designing global health supply Chains for the future; 2017.
3. Eston K, Onkundi H, Okibo W. Factors influencing inventory management performance in public health sector. A case study of public health sector In Kisii County. Health. 2016;8(12):158–165.
4. Desselle SP, Zgarrick DP, Alston GL. Inventory management. Pharmacy Manage. 2012;2012:1–24.
5. Dixit A, Routroy S, Dubey SK. A systematic literature review of healthcare supply chain and implications of future research. Int J Pharm Healthc Mark. 2019;13(4):405–435. doi:10.1108/IJPHM-05-2018-0028
6. Guliti Buba MM. Effect of inventory management practices on organizational performance in Ethiopian Universities. Parikalpana KIIT J Manag. 2019;15(1/2):270.
7. Okanda S, Namusonge GS, Waiganjo E. Inventory management practice and the performance of the unit of vaccines and immunizations in the ministry Health, Kenya. Int J Acad Res Bus Soc Sci. 2016;6(7):142–158.
8. Allain L, Goentzel J, Bates J, Durgavich J. Reengineering public health supply chains for improved performance guide for applying supply chain segmentation framework; 2010.
9. Atinga RA, Dery S, Katongole SP, Aikins M. Capacity for optimal performance of healthcare supply chain functions, competency, structural and resource gaps in the Northern Region of Ghana. J Health Organ Manag. 2020;34(8):899–914. doi:10.1108/JHOM-09-2019-0283
10. Vilbert A, Makafui M. Assessing the challenges in supply chain of health commodities in the health industry. Afr J Procure Logist Supply Chain Manag. 2019;1(4):1–20.
11. Befekadu A, Cheneke W, Kebebe D, Gudeta T. Inventory management performance for laboratory commodities in public hospitals of Jimma zone, Southwest Ethiopia. J Pharm Policy Pract. 2020;1:1–12.
12. Federal Ministry of Health (FMOH). Health sector transformation plan II; 2020.
13. Tamirat A. Primary health care systems (PRIMASYS), a case study from Ethiopia, abridged version; 2017.
14. Getachew T, Abebe SM, Yitayal M, Bergström A, Persson L-A, Berhanu D. Health extension workers’ perceived health system context and health post preparedness to provide services, a sectional study in four Ethiopian regions. BMJ Open. 2021;11:1–9. doi:10.1136/bmjopen-2020-048517
15. Ethiopian pharmaceuticals Supply Agency (PFSA). Integrated Pharmaceuticals Logistics System (IPLS) in Health Facilities of Ethiopia. Ethiopian pharmaceuticals Supply Agency (PFSA); 2017.
16. Ethiopian Pharmaceuticals Supply Agency (EPSA). National Survey on the Integrated Pharmaceutical Logistics System. Ethiopian Pharmaceuticals Supply Agency (EPSA); 2019.
17. Damtie TA, Ibrahim AJ, Yikna BB. Supply Chain management performance of HIV / AIDS commodities and factors affecting it at health facilities of SNNPRS of Ethiopia; from the perspective of achieving 90- 90-90 Strategies. Integr Pharm Res Pract. 2020;2020(9):1–11.
18. Central Statistics Agency (CSA. The 2007 Population and Housing Census of Ethiopia, Statistical Report for Southern Nations, Nationalities and Peoples’ Region; Part I, Population Size and Characteristics. Central Statistics Agency (CSA; 2007.
19. Bowling A. Investigating Health and Health services. Res Methods Health. 2009;2009:177.
20. John Snow Inc. DELIVER Logistics Indicators Assessment Tool (LIAT). John Snow Inc; 2005.
21. Federal Ministry of Health National Pharmacy Service. Pharmaceuticals Supply Chain and Medical Equipment Management Monitoring and Evaluation Framework. Federal Ministry of Health National Pharmacy Service; 2019.
22. United States Agency for International Development (USAID). DELIVER PROJECT to 1. 2011. The Logistics Handbook a Practical Guide for the Supply Chain Management of Health Commodities. United States Agency for International Development (USAID); 2011.
23. USAID. Government. National Supply Chain Assessment Report. Key Performance Indicators; 2016.
24. Okiria JC, Mwirumubi R, Mpaata KA. Inventory management practices and the effectiveness of the supply Chain of essential medicines in the public sector evidence from six selected public hospitals in Uganda. Int J Sci Res. 2016;5(4):1447–1456.
25. Galvin G, Hirschhorn LR, Shaikh M, et al. Availability of safe childbirth supplies in 284 Facilities in Uttar Pradesh, India. Matern Child Health J. 2019;23(2):240–249. doi:10.1007/s10995-018-2642-7
26. Pharmaceutical Supply Agency (EPSA). Ethiopia, National Survey on the Integrated Pharmaceutical Logistics System (IPLS). Pharmaceutical Supply Agency (EPSA); 2019.
27. Kebede O, Tilahun G. Inventory management performance for family planning, maternal and child health medicines in public health facilities of West Wollega zone, Ethiopia. J Pharm Policy Practi. 2021;14(1):20. doi:10.1186/s40545-021-00304-z
28. Kefale A Teshome and . (2019). Availability of essential medicines and pharmaceutical inventory management practice at health centers of Adama town, Ethiopia. BMC Health Serv Res, 19(1). doi:10.1186/s12913-019-4087-0
 © 2023 The Author(s). This work is published and licensed by Dove Medical Press Limited. The
full terms of this license are available at https://www.dovepress.com/terms
and incorporate the Creative Commons Attribution
- Non Commercial (unported, 3.0) License.
By accessing the work you hereby accept the Terms. Non-commercial uses of the work are permitted
without any further permission from Dove Medical Press Limited, provided the work is properly
attributed. For permission for commercial use of this work, please see paragraphs 4.2 and 5 of our Terms.
© 2023 The Author(s). This work is published and licensed by Dove Medical Press Limited. The
full terms of this license are available at https://www.dovepress.com/terms
and incorporate the Creative Commons Attribution
- Non Commercial (unported, 3.0) License.
By accessing the work you hereby accept the Terms. Non-commercial uses of the work are permitted
without any further permission from Dove Medical Press Limited, provided the work is properly
attributed. For permission for commercial use of this work, please see paragraphs 4.2 and 5 of our Terms.