Back to Journals » International Journal of Nanomedicine » Volume 16
Facilitated Buccal Insulin Delivery via Hydrophobic Ion-Pairing Approach: In vitro and ex vivo Evaluation
Authors Bashyal S ![]() , Seo JE, Keum T, Noh G, Lamichhane S, Kim JH, Kim CH, Choi YW
, Seo JE, Keum T, Noh G, Lamichhane S, Kim JH, Kim CH, Choi YW ![]() , Lee S
, Lee S
Received 10 May 2021
Accepted for publication 21 June 2021
Published 7 July 2021 Volume 2021:16 Pages 4677—4691
DOI https://doi.org/10.2147/IJN.S318092
Checked for plagiarism Yes
Review by Single anonymous peer review
Peer reviewer comments 2
Editor who approved publication: Dr Mian Wang
Santosh Bashyal,1 Jo-Eun Seo,1 Taekwang Keum,1,2 Gyubin Noh,1,2 Shrawani Lamichhane,1,2 Jeong Hwan Kim,1,2 Chang Hyun Kim,3 Young Wook Choi,3 Sangkil Lee1,2
1College of Pharmacy, Keimyung University, Daegu, Republic of Korea; 2Center for Forensic Pharmaceutical Science, Keimyung University, Daegu, Republic of Korea; 3College of Pharmacy, Chung-Ang University, Seoul, Republic of Korea
Correspondence: Sangkil Lee
College of Pharmacy, Keimyung University, 1095 Dalgubeol-Daero, Dalseo-Gu, Daegu, 42601, Republic of Korea
Tel +82 53 580 6655
Fax +82 53 580 5164
Email [email protected]
Background: The clinical use of therapeutic peptides has been limited because of their inefficient delivery approaches and, therefore, inadequate delivery to target sites. Buccal administration of therapeutic peptides offers patients a potential alternative to the current invasive routes of administration.
Purpose: The aim of the study was to fabricate hydrophobic ion-pairing (HIP)-nanocomplexes (C1 and C2) utilizing anionic bile salts and cationic peptides, and to assess their permeability across TR146 buccal cell layers and porcine buccal tissue.
Methods: C1 and C2-nanocomplexes were fabricated using the HIP approach. In addition, their physiochemical and morphological attributes, in vitro and ex vivo permeability properties, and qualitative and quantitative cellular uptake were evaluated and compared. The localization of C1 and C2-nanocomplexes in porcine buccal tissue was determined using confocal laser scanning microscopy.
Results: The C1-nanocomplex was the superior nanocarrier and significantly enhanced the transport of insulin across TR146 cell layers and porcine buccal tissue, exhibiting a 3.00- and 51.76-fold increase in permeability coefficient, respectively, when compared with insulin solution (p < 0.01). C1-nanocomplex was more efficient than C2-nanocomplex at facilitating insulin permeability, with a 2.18- and 27.64-fold increase across TR146 cell layers and porcine buccal tissue, respectively. The C1-nanocomplex demonstrated immense uptake and localization of insulin in TR146 cells and porcine buccal tissue, as evidenced by a highly intense fluorescence in TR146 cells, and a great shift of fluorescence intensity towards the inner region of buccal tissue over time. The increase in fluorescence intensity was observed in the order of C1 > C2 > insulin solution.
Conclusion: In this study, we highlighted the efficacy of potential nanocarriers in addressing the daunting issues associated with the invasive administration of insulin and indicated a promising strategy for the buccal administration and delivery of this life-saving peptide hormone.
Keywords: hydrophobic ion-pairing, bile salts, peptide delivery, buccal drug delivery, buccal absorption, TR146 cells, porcine buccal tissue
Introduction
With advancements in biotechnology and genetic engineering, various therapeutic proteins/peptides have emerged for the alleviation of chronic diseases.1,2 These peptide-based nanomedicines have been considered as first line therapy because of their high specificity and potency, high tolerance, and low toxicity.3,4 Despite the rapid increase in peptides in the global market, these molecules are currently administered by an invasive route (injection) owing to their physicochemical and biological restrictions.5 However, pain, needle-phobia, phlebitis, tissue necrosis due to routine injection, rapid elimination which limits therapeutic efficacy, high cost, and low patient compliance are issues associated with injectables. Owing to this, the need for a more patient-friendly, sustainable, and therapeutically beneficial route of administration is warranted.6,7 Thus, researchers have attempted to investigate alternative platforms for the delivery of peptides, including oral, buccal, nasal, transdermal, and pulmonary routes of administration. Among these, the buccal route has recently garnered great attention owing to its well-vascularized tissues, direct access to the systemic circulation through the jugular vein, few proteolytic enzymes, and avoidance of hepatic first-pass metabolism.8,9 In addition, it is accessible for a versatile design of dosage systems, painless and easily accessible, simple to eliminate in cases of mucosal irritation, and has rapid recovery characteristics and high patient compliance.10,11
Several peptide delivery approaches have been explored to facilitate the transbuccal delivery of peptides. For instance, nanotechnologies, including the application of chemical enhancers, lipids, and polymer-based nanocarriers, are the most widely used strategies for the delivery of peptides via the buccal route.12–15 Owing to the sizes and surface modifications of nanoparticles, these carriers can enhance pharmacokinetic profiles, systemic half-life, and target selectivity of compounds.16–18 Focus should be on the identification and evaluation of excipients that enhance buccal permeability, allow prolonged contact and delivery time at the delivery site to deal with toxicity issues, and improve the pharmacokinetic/pharmacodynamic profiles of peptide drugs.19,20 The excipients chosen for the development of nanocarriers have a substantial impact on the desired clinical outcomes, because the formulation should have minimal toxicity, be biodegradable and biocompatible, and attain regulatory approval for clinical translation in the future.3,21,22 Bile salts are regarded as biomimetic and bioinspired surfactants.23 Recently, the application of bile salts as permeation enhancers was explored in the transbuccal delivery of peptides because of the high biodegradability and biocompatibility and minimum toxicity profiles of these salts. Previous studies revealed that bile salts, including sodium glycodeoxycholate (SGDC), sodium taurodeoxycholate (STGC), sodium glycocholate, and sodium taurocholate, are good permeation enhancers for improving the permeability of peptides across porcine buccal mucosa.24–26 Mahalingam et al reported that dihydroxy bile salts such as SGDC and STGC increased buccal permeability profiles compared with trihydroxy bile salts.25 In another study, the researchers attempted to increase in vitro buccal permeability and in vivo performance of 5-fluorouracil using sodium deoxycholate (SDC), sodium dodecyl sulfate, STGC, and oleic acid. STGC was the most effective in facilitating the permeation of 5-fluorouracil across porcine buccal tissue and exhibited an absolute buccal bioavailability of 58.52% following the fabrication of mucoadhesive gels.26 Furthermore, an insulin-phospholipid complex was encapsulated within a deformable nano-vesicular system containing SDC and exhibited a prolonged hypoglycemic profile of over 4 h in rabbits.27
Considering the advantage offered by the peculiar arrangements of hydroxyl and carboxyl groups, as well as the rigid hydrophobic domains in bile salts, researchers have explored their application in the formation of hydrophobic ion-pairing (HIP)-nanocomplexes.28,29 The HIP approach offers several advantages for macromolecular therapeutic peptides, including increased lipophilicity, structural stability, and enhanced permeability across biological membranes.30 Moreover, owing to the increase in the lipophilic attributes of peptides, HIP-nanocomplexes could be readily encapsulated within lipid-based nanocarriers, contributing to high drug loading and encapsulation capacity.31 Therefore, the HIP-nanocomplex may be a prominent platform for the effective delivery of peptides with improved buccal absorption. This existing technology and knowledge might be a platform for accelerating novel peptide nanomedicine.
Herein, we utilized an anionic bile salt, SGDC, as a counterion for the formation of HIP-nanocomplexes with insulin as a model peptide, via electrostatic and hydrophobic interactions (Figure 1A). Insulin is composed of 51 amino acids with two polypeptide chains and has cationic charge at lower pH (isoelectric point ~5.5). Owing to its number of amino acids, insulin falls on the borderline between a large polypeptide and a small protein.32 However, it is regarded as the most widely used peptide therapeutic for the management of diabetes.33 HIP is the strategy to from hydrophobic complexes from charged hydrophilic molecules, and based on the pH-related and stoichiometric replacement of polar counter-ions with an ionic surfactant.34 Since all therapeutic peptides and proteins have their own specific isoelectric point, the HIP approach can be applicable for both peptides/proteins. The main purpose of the study was to assess the permeability profiles of the nanocomplexes across TR146 cell layers in vitro and porcine buccal tissue ex vivo. In addition, fluorescence-labeled HIP-nanocomplexes were also fabricated, and their uptake and distribution attributes were assessed using confocal laser scanning microscopy (CLSM) to depict the internalization and localization of insulin across the TR146 cells and in porcine buccal tissue, respectively. To the best of our knowledge, this is the first study to utilize the HIP approach to circumvent the barrier of the buccal membrane.
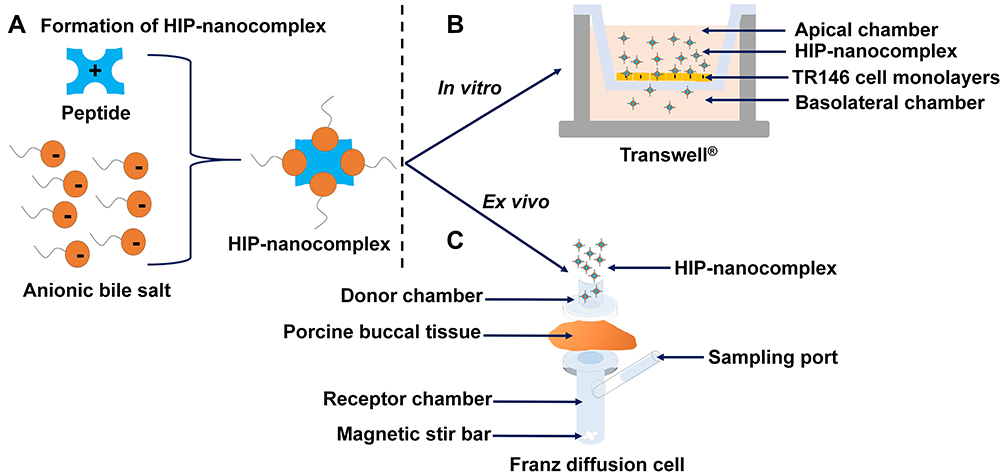 |
Figure 1 Schematic illustration of (A) the fabrication of HIP-nanocomplex, and (B) the delivery of insulin across TR146 cell layers on a Transwell® (in vitro) and (C) porcine buccal tissue (ex vivo). Abbreviation: HIP, hydrophobic ion-pairing. |
Materials and Methods
Materials
Recombinant human insulin, fluorescein isothiocyanate-labeled insulin (FITC-insulin), and SGDC were purchased from Sigma-Aldrich (St Louis, MO, USA). The TR146 cell line was obtained from the European Collection of Authenticated Cell Cultures (ECACC 10032305; Public Health England, Salisbury, UK). Ham’s F-12 nutrient, fetal bovine serum (FBS), trypsin-ethylenediaminetetraacetic acid (EDTA), Dulbecco’s phosphate-buffered saline (DPBS), Hanks’ balanced salt solution (HBSS), and 4-(2-hydroxyethyl)-1-piperazine ethanesulfonic acid (HEPES) were obtained from WELGENE Inc. (Gyeongsan, Republic of Korea). All other chemicals were of reagent grade and were used without further purification.
Fabrication of Nanocomplexes
Insulin-SGDC nanocomplexes (C1 and C2) were fabricated using the HIP technique. Briefly, insulin was dissolved in 0.01 N hydrochloric acid (HCl) and adjusted to pH values of 2.2 and 4.2, respectively (1 mg/mL). To each 1 mL of insulin solution, 5.17 mM or 1.04 mM of SGDC was separately prepended dropwise with magnetic stirring (500 rpm) for 1 h to develop C1 and C2 nanocomplexes, respectively. Subsequently, white precipitates were separated by centrifugation at 15,602 × g for 15 min at 4°C (Smart R17; Hanil Science Industrial Co. Ltd., Gimpo, Republic of Korea). Finally, the prepared HIP-nanocomplexes (C1 and C2) were lyophilized and stored at −20°C. In addition, for bioimaging analysis, fluorescence-labeled HIP-nanocomplexes, that is, FITC-C1 and FITC-C2, were prepared using a similar procedure.
Characterization of HIP-Nanocomplexes
Particle Characterization
The particle size, polydispersity index (PDI), and zeta potential of HIP-nanocomplexes (C1 and C2) were determined using dynamic light scattering (DLS) with a NanoBrook ZetaPALS (Brookhaven Instruments Corp., Holtsville, NY, USA) following dilution with distilled water. All experiments were performed in triplicate at a scattering angle of 90° under ambient conditions.
Complexation Efficiency
The nanocomplex formation efficiencies of C1 and C2 were calculated by determining the free and total amount of insulin initially added in the nanocomplex. Briefly, the free amount of insulin during the preparation of nanocomplex was obtained by centrifuging the sample dispersions at 15,602 × g for 15 min at 4 °C. Subsequently, the concentration in the collected supernatant was analyzed using reverse-phase high-performance liquid chromatography (RP-HPLC) using a previously reported method.35 An Agilent 1200 infinity series LC system (Agilent Technologies Inc., Santa Clara, CA, USA) was used with an Agilent Zorbax SB-C18 5 µm column (150 mm × 4.6 i.d.). Briefly, a gradient method was applied to a mobile phase of acetonitrile (ACN) and 0.1% trifluoroacetic acid (TFA), with an injection volume of 20 µL, a flow rate of 1.2 mL/min, and a UV detection wavelength set at 214 nm. Initially, a ratio of 20:80 (ACN: TFA, v/v) was used, which changed linearly to 50:50 (v/v) from 0 to 5 min. The ratio remained constant for the next 2 min and finally returned to the initial ratio.
The complexation efficiency (CE) was calculated using the following equation:
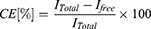
where,  I is the total amount of insulin, and
  is the amount of free insulin in the supernatant.
Partition Coefficient
The partition coefficients of insulin, C1, and C2 were also determined. Briefly, 1 mg of insulin or the freeze-dried powder of C1 or C2 (equivalent to 1 mg insulin) was added to 1 mL of octanol/water (1:1) and incubated at 25°C for 24 h with vigorous stirring (600 rpm). After 24 h, the samples were centrifuged at 15,602 × g for 15 min at 4°C. Finally, the aqueous and oil phases were separated, collected, and analyzed using RP-HPLC as previously described. The partition coefficient was determined as follows:
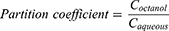
where,  denotes the concentration of insulin in the octanol phase, and
  denotes the concentration of insulin in the aqueous phase at equilibrium.
Transmission Electron Microscopy
The morphological characteristics of the HIP-nanocomplexes (C1 and C2) were evaluated using transmission electron microscopy (TEM). Briefly, the samples were mounted on a carbon-coated copper grid, prestained with 2% (w/v) phosphotungstic acid solution, and dried under mild infrared radiation. The samples were then observed using a transmission electron microscope (H7600; Hitachi, Tokyo, Japan).
Scanning Electron Microscopy
The shape and surface morphology of the freeze-dried samples of HIP-nanocomplexes (C1 and C2) were evaluated using scanning electron microscopy (SEM). Briefly, these samples were affixed onto a brass stub with double-sided adhesive tape, and then coated with platinum using an EMI Tech Ion Sputter system under vacuum. Finally, the microscopic images were obtained from different angles using a Hitachi S-4800 scanning electron microscope (Tokyo, Japan).
High Resolution Optical Microscopic Analysis
High-resolution images of the HIP-nanocomplexes (C1 and C2) were visualized using an optical microscope with a CytoVivaTM ultra-resolution imaging system (Aetos Technologies Inc., Auburn, AL, USA).
Cell Lines and Cell Culture Conditions
Human TR146 cells were used for in vitro cellular experiments. The cells were cultured in Ham’s F-12 medium supplemented with 10% FBS, 1% penicillin/streptomycin, and 2 mM glutamine. The cells were incubated at 37°C in a 5% CO2 atmosphere, and the medium was replaced every 2–3 days.
Cell Viability Studies
The in vitro cell viability of HIP-nanocomplexes (C1 and C2) was evaluated in TR146 cells using the CellTiter 96® AQueous One Solution Cell Proliferation Assay kit (Promega, Madison, WI, USA), containing 3-(4,5-dimethylthiazol-2-yl)-5-(3-carboxymethoxyphenyl)-2-(4-sulfophenyl)-2H-tetrazolium and phenazine ethosulfate, according to the manufacturer’s instructions. Briefly, 2×10⁴ cells per well were seeded in a 96-well plate and incubated for 24 h at 37°C in an incubator. The samples (C1 and C2) were prepared by dilution with HBSS-HEPES buffer (pH 7.4) at different concentrations of insulin (10–200 µg/mL) and added to each well and incubated for 4 h at 37°C. After 4 h, each well was incubated with 20 µL of CellTiter 96® AQueous One Solution Reagent for 4 h at 37°C. Absorbance was determined at 490 nm using a microplate reader. Cell viability (%) was calculated as follows:
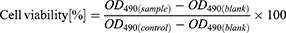
where, OD is the optical density and control is the untreated cells.
Determination of Transepithelial Electrical Resistance
Transepithelial electrical resistance (TEER) was monitored before and after each transport during in vitro permeability studies. It was measured using a Millicell® ERS-2 (Electrical Resistance System; EMD Millipore Corporation, USA) according to the manufacturer’s instructions. The TEER value was calculated as follows:

where,  is the resistance of TR146 cells with the insert,
  is the resistance of the free insert without TR146 cells, and A is the surface area (cm2) of the Transwell® filter.
Permeability Studies Across TR146 Cell Layers
The in vitro permeability studies were performed using a previously well-established method,8 as illustrated in Figure 1B. Briefly, TR146 cells were seeded at a density of 5×10⁴ cells/cm2 in 12-well-Transwell® inserts (1.12 cm2, 0.4 µm pore size; Corning Inc., Corning, NY, USA). The cells were grown, and the medium was replaced every subsequent day until the formation of a differentiated confluent monolayer (26–30 days). Typically, 500 µL of insulin solution, C1, or C2 (equivalent to 50 µg/mL insulin) was placed on the apical chamber, while the basolateral chamber was filled with 1500 µL of pre-warmed HBSS-HEPES buffer (pH 7.4). Subsequently, the studies were directed from the apical to the basolateral chamber, and incubation was performed at 37°C. Consequently, a 500 µL sample was withdrawn from the basolateral chamber at predetermined time points over 4 h and immediately replenished with an equal volume of pre-warmed HBSS-HEPES (pH 7.4). Finally, the amount of permeated insulin was analyzed using a human insulin ELISA kit (Mercodia, Uppsala, Sweden), according to the manufacturer’s instructions.
The linear part of the permeation curve was used to calculate the steady-state flux (Js), permeability coefficient (Kp), and enhancement ratio (ER), as previously described.8 Briefly, Js and Kp were determined from equations (5) and (6), respectively, where Qr is the total permeated insulin (ng), A is the cross-sectional diffusion area (cm2), t is the time of exposure (h), and Cd is the initial concentration in the donor chamber (ng cm−3). In addition, the Kp value of each formulation was divided with that of the control to obtain the ER.
Quantitative Cellular Uptake Studies
Fluorescence-activated cell sorting (FACS) analyses were performed to gauge the uptake characteristics of the HIP-nanocomplexes (C1 and C2) across TR146 cells. Briefly, 3×10⁵ cells were seeded in a 12-well plate and incubated for 24 h at 37°C. After 24 h, the cells were washed with pre-warmed HBSS-HEPES buffer (pH 7.4) and treated with FITC-insulin solution, FITC-C1, or FITC-C2 (equivalent to 50 µg/mL FITC–insulin) for 4 h at 37°C. Subsequently, the cells were trypsinized, harvested, and resuspended in ice-cold FACS buffer (2% FBS in DPBS, pH 7.4). Lastly, the BD FACSCalibur flow cytometer (BD Biosciences, San Jose, CA, USA) was used to analyze the quantitative uptake of FITC-insulin from each prepared sample.
Qualitative Cellular Uptake Studies
CLSM was used to elucidate the intracellular distribution of the HIP-nanocomplexes (C1 and C2) across TR146 cells. Briefly, 1×10⁵ cells were seeded in a confocal dish and incubated for 24 h at 37°C. Then, the cells were treated with FITC-insulin solution, FITC-C1, or FITC-C2 (equivalent to 50 µg/mL FITC–insulin) for 2 h at 37°C. After washing with ice-cold HBSS-HEPES buffer (pH 7.4), the cells were fixed with 4% paraformaldehyde solution for 10 min at room temperature. Subsequently, the cell membranes and nuclei were stained with Cell MaskTM Deep Red (Life Technologies Inc., USA) and Hoechst 33342 (Thermo Fisher Scientific Inc., Waltham, MA, USA), respectively. Finally, the cells were mounted with mounting solution (Dako North America, Inc., Carpinteria, CA, USA) and visualized using Zeiss CLSM 800 with an Ariyscan system (Carl Zeiss Meditec AG, Jena, Germany).
Permeability Studies Across Porcine Buccal Tissue
Buccal tissue preparation and ex vivo buccal permeation studies were performed using our previously established protocol.24 Briefly, porcine buccal tissue (cheeks) was affirmed and obtained through a slaughterhouse (Daegu, Republic of Korea). This study did not require animal ethics committee approval in accordance with the national guidelines of Institutional Animal Care and Use Committee (IACUC) and Korean Animal Protection Act 2020. The tissue was collected from freshly sacrificed pigs (6-month-old, ~110 kg), stored at 4°C, and then brought to the laboratory. The underlying connective and adipose tissue was carefully removed from the buccal mucosa. Subsequently, the tissue was soaked in isotonic phosphate-buffered saline (PBS) buffer (pH 7.4) at 60°C for 1 min. Finally, the prepared porcine buccal mucosa was stored at −20°C and used within 24 h.
Ex vivo permeation studies were performed in a vertical static Franz diffusion cell with an effective diffusion area of 0.79 cm2, using porcine buccal tissue as illustrated in Figure 1C. The buccal tissue was horizontally set between the donor and receptor chambers. Subsequently, the receptor chamber of the Franz diffusion cell was filled with PBS buffer (pH 7.4), while 500 µL of insulin solution, C1, or C2 nanocomplexes (equivalent to 2 mg/mL insulin) was added to the donor chamber. The studies were directed from the donor to receptor chambers with constant magnetic stirring (600 rpm) at 37°C. Samples (500 µL) were withdrawn from the receptor chamber through the sampling port at predetermined time intervals over 4 h and immediately replaced with an equal volume of PBS buffer (pH 7.4). Finally, the collected samples were analyzed using a human insulin ELISA kit, according to the manufacturer’s instructions. Furthermore, Js, Kp, and ER were determined from the linear portion of the permeation curve, as previously described.
The amount of insulin retained in buccal tissue was also determined. Briefly, after 4 h of permeability studies, the effective diffusion area of buccal tissue was cut, collected, washed several times with PBS buffer (pH 7.4), and dried with soft paper. Then, the obtained buccal tissue was homogenized. For homogenization, the tissue was cut into small pieces using scissors and soaked in PBS solution. Subsequently, it was introduced to the homogenizer (DAIHAN Scientific Co., Ltd., Wonju, Republic of Korea) at 10,000 rpm for 5 min to obtain tissue homogenates and then, centrifuged at 15,602 × g for 15 min at 4°C. The clear supernatant was collected and analyzed using a human insulin ELISA kit.
Localization Studies in Porcine Buccal Tissue
Ex vivo studies were performed to evaluate the distribution of HIP-nanocomplexes across porcine buccal tissue using a vertical static Franz diffusion cell by using the procedure reported previously.36 Briefly, the Franz diffusion cell system was set up as described earlier, and 500 µL of FITC-insulin solution, FITC-C1, or FITC-C2 (equivalent to 200 µg/mL FITC–insulin) was loaded into the donor chamber. The studies were directed from the donor to receptor chambers with constant magnetic stirring (600 rpm) at 37°C, and at predetermined time points (0.5, 2, and 4 h), the buccal tissues were washed with PBS buffer (pH 7.4) and dried with soft paper. Subsequently, the tissues were fixed with Tissue-Tek® optimal cutting temperature compound (Sakura Finetek USA, Inc., Torrance, CA, USA) and frozen in liquid nitrogen. The frozen buccal tissues were vertically sectioned into 9 µm-thick slices using a cryostat (Cryotome® FE; Thermo Fisher Scientific), placed onto glass slides, fixed with 4% paraformaldehyde, and mounted with coverslips. Finally, Zeiss CLSM 800 with an Ariyscan system (Carl Zeiss Meditec AG) was used to capture the distribution of fluorescence across the tissues.
Statistical Analysis
Data are expressed as the mean ± standard error of mean (SEM). One-way analysis of variance followed by Tukey’s multiple comparison test was performed to determine statistically significant differences between groups. Statistical significance was set at p < 0.05.
Results and Discussion
Fabrication and Characterization of Nanocomplexes
Peptides possess an isoelectric point, which is a crucial characteristic of the molecules for the formation of HIP.31 Because insulin has a net positive charge at a pH below its isoelectric point, it was ion-paired with anionic bile salt (SGDC) using the HIP technique to form HIP-nanocomplexes (C1 and C2). The isoelectric point of insulin is approximately 5.5, and possesses a net positive charge of 6 at low pH levels (pH < 5.5).37 Therefore, to compare and evaluate the formation of HIP-nanocomplexes at different pH values, we investigated two different pH points (pH 2.2 and pH 4.2) below the isoelectric point of insulin. Based on preliminary studies, we screened and optimized the molar ratios for the formation of the C1 and C2-nanocomplexes. The C1 and C2-nanocomplexes were prepared at stoichiometric molar ratios of 30:1 and 6:1 (SGDC: insulin), respectively. As listed in Table 1, the particle sizes of C1 and C2 were 364.37 ± 11.79 nm and 256.73 ± 17.74 nm, respectively. In addition, their PDI values were 0.005 ± 0.000 and 0.189 ± 0.014, respectively, indicating that the C1-nanocomplex was monodispersed, that is, believed to be of similar-sized particles which were narrower and homogeneously distributed than those of C2. Similarly, the zeta potential of C1 was −0.26 ± 0.95, while that of C2 was −0.13 ± 0.53, suggesting the complete neutralization of the cationic charge of insulin with the anionic charge of SGDC at the investigated stoichiometric molar ratios. In addition, the CEs of C1 and C2 at their stoichiometric molar ratios were 92.71 ± 2.64% and 99.28 ± 0.13%, respectively. These findings are in good agreement with a previously published report on a study conducted by Sun et al, which revealed that the insulin-SDC complex afforded a 99.65% CE and nearly zero zeta potential owing to the complete complexation and neutralization of the positive charges of insulin by counter ions (anionic deoxycholate).38 Furthermore, the partition coefficient was evaluated as a measure of lipophilicity. As shown in Table 1, the partition coefficients of insulin, C1, and C2 were 0.0041 ± 0.0004, 0.5339 ± 0.1131, and 0.0241 ± 0.0075, respectively. The partition coefficient of the C1 nanocomplex was 22.15-fold greater than that of C2, suggesting that C1 was more lipophilic.
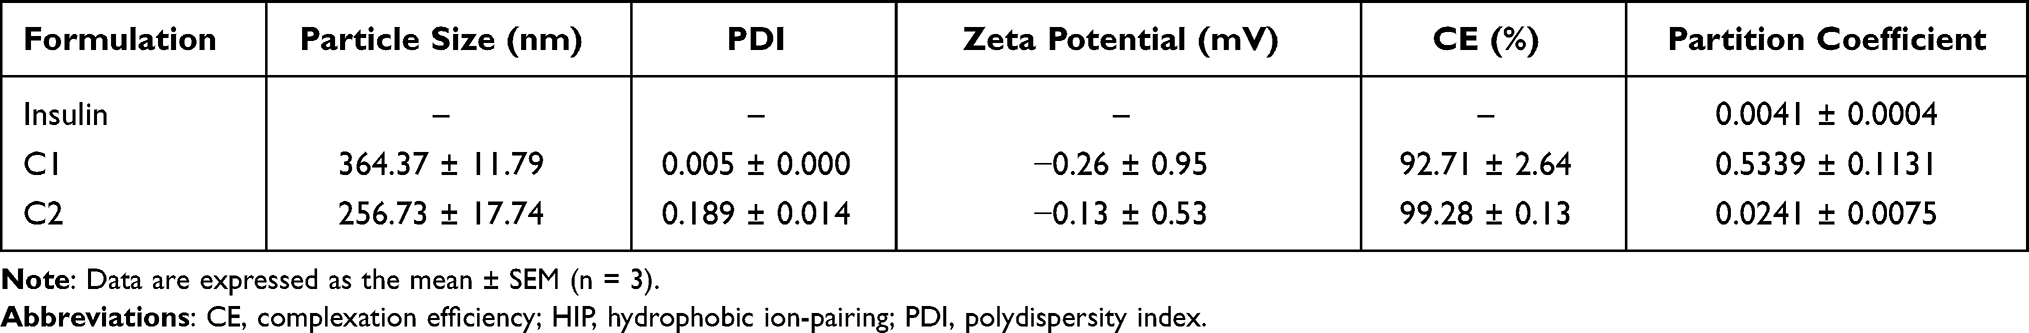 |
Table 1 Physical Characterization of HIP-Nanocomplexes (C1 and C2) |
Morphological characterization of both HIP-nanocomplexes was determined by TEM, SEM, and CytoVivaTM. As presented in Figure 2A, the morphology of the C1-nanocomplex was completely globular, with a diameter of <140 nm. In contrast, the C2-nanocomplex was slightly spherical or lacked a distinct shape, with a diameter of <120 nm (Figure 2B). Owing to the elimination of the hydration shell of the nanocomplexes during the drying step in TEM, the observed particle sizes of C1 and C2 by DLS were slightly larger than those observed by TEM.39 Moreover, the morphologies of these nanocomplexes were further confirmed by SEM. As depicted in Figure 2C, C1 was spherical with almost monodispersed distribution, while C2 exhibited no distinct shape and a rough morphology (Figure 2D). Overall, TEM and SEM observations corroborated the formation of nanosized formulations with consistent morphologies. The nanocomplexes were further observed using high-resolution optical microscopy with CytoVivaTM. Insulin and SGDC are represented with red and green colors, respectively, and their mapping process revealed the specific absorption wavelength emitted by insulin and SGDC (Figure 2E). These results confirmed the formation of nanocomplexes by overlapping the two distinct colors, thus implying the successful interlinkage of insulin and SGDC.
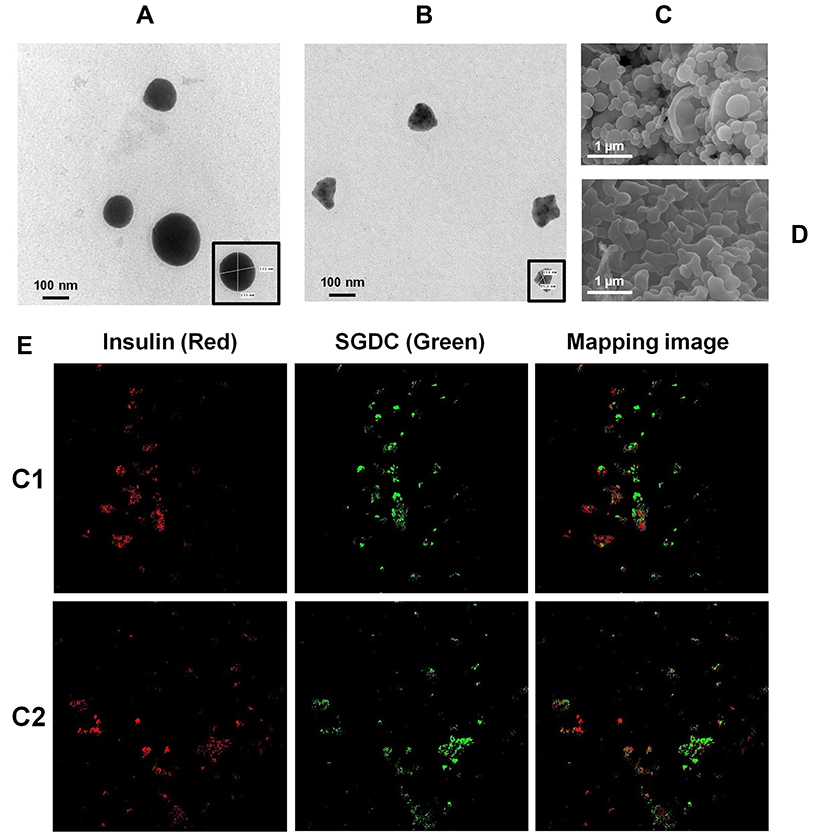 |
Figure 2 Morphological characterizations of HIP-nanocomplexes (C1 and C2). TEM analysis of C1 (A) and C2 (B). SEM analysis of C1 (C) and C2 (D). (E) CytoVivaTM ultra resolution images of C1 and C2; insulin (red), SGDC (green), and mapping image of insulin and SGDC in the nanocomplexes. Abbreviations: HIP, hydrophobic ion-pairing; SEM, scanning electron microscopy; SGDC, sodium glycodeoxycholate; TEM, transmission electron microscopy. |
Cell Viability Studies
The in vitro cellular viability of the nanocomplexes (C1 and C2) was determined in TR146 cells, representing the human buccal environment. As depicted in Figure 3, C1 and C2-nanocomplexes were treated with various concentrations of insulin (10–200 µg/mL) for 4 h and then exposed to TR146 cells. The results demonstrated no significant change in cell viability upon treatment with both nanocomplexes at different concentrations of insulin over the tested period, implying that C1 and C2 are safe for the transbuccal delivery of peptides. It has been reported that glycine and taurine conjugates of bile salts cause relatively less irritation to the nasal mucosa.40 Owing to the fabrication of both nanocomplexes with glycine-conjugated bile salt (SGDC), they exhibited minimum toxicity profiles and showed the potential for use in clinical settings. Herein, C1 and C2 at an insulin concentration of 50 µg/mL did not induce significant cytotoxicity; therefore, this concentration was used for further cellular experiments.
 |
Figure 3 Cell viability of HIP-nanocomplexes (C1 and C2) in TR146 cells at different concentrations of insulin treated for 4 h and incubated at 37°C. Data are expressed as mean ± SEM (n = 5). Abbreviation: HIP, hydrophobic ion-pairing. |
In vitro Permeability Studies
TR146 cells are continuous cells that emanate from neck node metastasis of human buccal carcinoma. They differentiate into four–seven cell layers of stratified non-keratinized epithelium, intermediate filaments, and other organelles similar to membrane-coating granules and microvilli-like processes after being cultured for 3–4 weeks.41,42 These cells simulate the human buccal epithelium; thus, they were used as an in vitro model in permeability studies to assess the transbuccal absorption of insulin. As the TEER value is a crucial parameter for gauging the integrity of cell layers, it was determined before and after each transport during in vitro permeability studies. As depicted in Table 2, the insulin solution, C1, and C2-nanocomplexes did not show a significant decrease in TEER values and exhibited recoveries of >96%. After 28 days, the maximum TEER value of confluent TR146 cell layers reached 79.40 ± 1.94 Ω∙cm2 (~96% recovery), which is in accordance with observations of previously reported studies. According to studies by Jacobsen et al and Teubl et al, maximum TEER values after 28 days were 68.2 ± 2.3 Ω·cm2 and 50.02 ± 0.83 Ω·cm2, respectively.42,43 As depicted in Figure 4, the profiles of cumulative permeated insulin from HIP-nanocomplexes (C1 and C2) across TR146 cell layers are presented as a function of time. The cumulative insulin permeated from the C1-nanocomplex formulation was approximately 3- and 2.18-fold greater than that observed from the insulin solution and the C2-nanocomplex, respectively. The various permeation parameters such as Js, Kp, and ER were determined based on these permeability studies, and Table 3 summarizes the results. The findings revealed that the C1-nanocomplex significantly increased the Js and the Kp of insulin following the formation of HIP, and the overall permeation parameters were ranked in the order of C1 > C2 > insulin solution. The C1-nanocomplex revealed the highest Js, which was significantly greater than those of the insulin solution and the C2-nanocomplex (**p < 0.01 vs insulin solution and ##p < 0.01 vs C2). Similarly, the C1-nanocomplex significantly enhanced the permeation of insulin across TR146 cell layers, with a 3-fold increase in Kp compared with that of the insulin solution. In contrast, the C2-nanocomplex enhanced the permeation of insulin across TR146 cell layers with a 1.38-fold increase in Kp when compared with that of the insulin solution. This might be attributed to the HIP approach, as the formation of HIP-nanocomplexes between insulin and SGDC increased the apparent partition coefficient of insulin and enhanced insulin permeability across TR146 cell layers (Table 1). In addition, SGDC is a dihydroxy bile salt and is reported to be a good buccal permeability enhancer.44 The HIP-nanocomplex may synchronize the diffusion of insulin with SGDC bile salt at the absorption site and thus maintain maximum concentration gradients, increasing the permeability of insulin across TR146 cell layers.45 As corroborated by previous investigations, because of the generation of reverse micelles, bile salts may increase the transcellular transport of hydrophilic drugs by forming aqueous channels.46 Furthermore, owing to the extraction of membrane lipids, bile salts can enhance the transcellular pathways by forming micelles at high concentrations.47
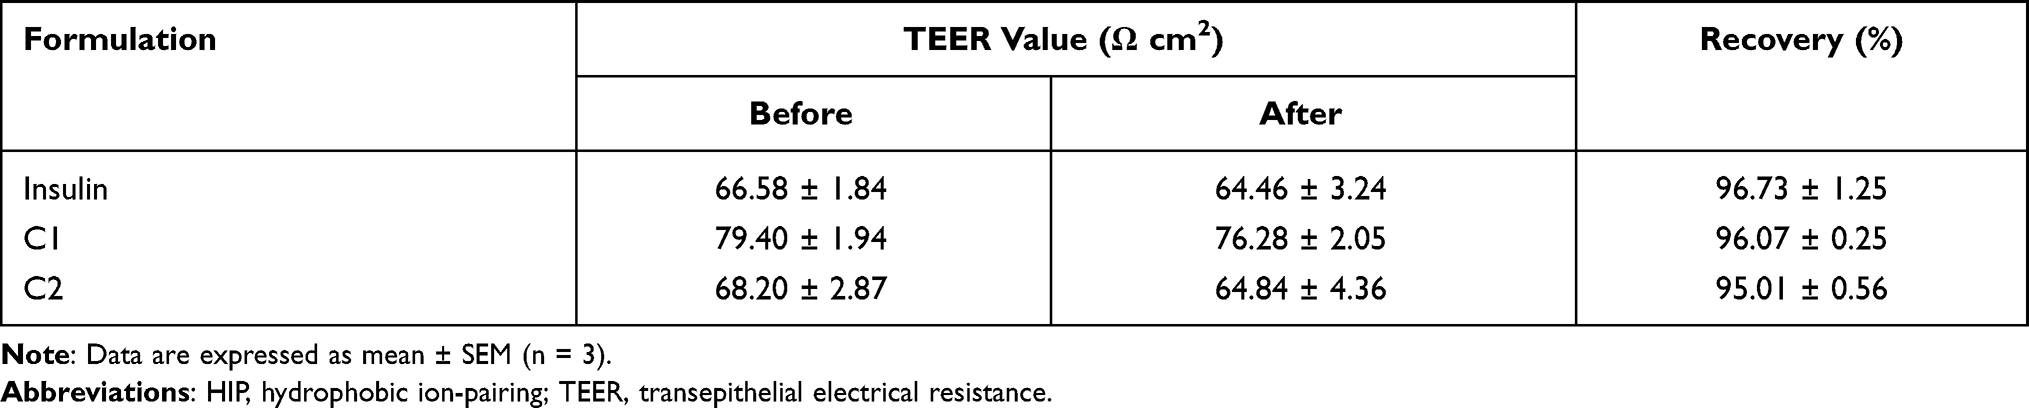 |
Table 2 Effect of Insulin Solution and HIP-Nanocomplexes (C1 and C2) on the TEER Value of TR146 Cell Layers Before (0 h) and After (4 h) Permeability Studies |
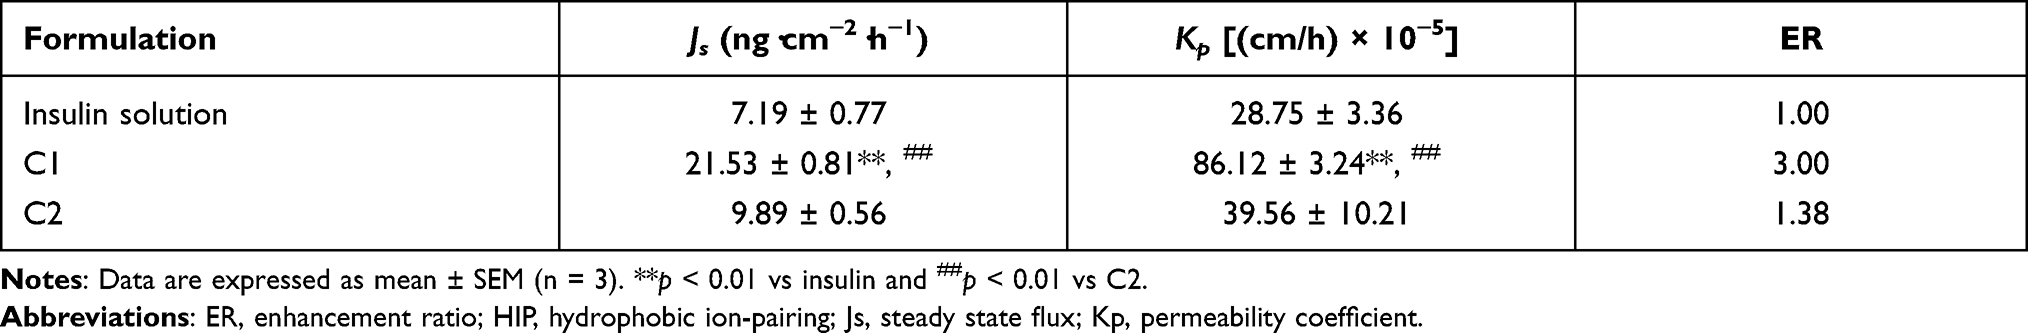 |
Table 3 Permeation Parameters Calculated Following Permeability Studies of HIP-Nanocomplexes (C1 and C2) Across TR146 Cell Layers |
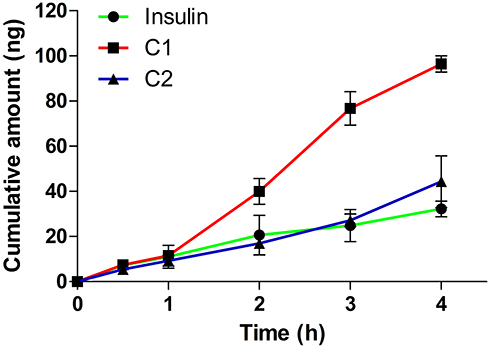 |
Figure 4 Permeability profiles of insulin from HIP-nanocomplexes (C1 and C2) across TR146 cell layers. All studies were directed from the apical to the basolateral chamber in HBSS-HEPES buffer (pH 7.4) at 37°C. Abbreviations: HBSS, Hanks’ balanced salt solution; HEPES, 4-(2-hydroxyethyl)-1-piperazine ethanesulfonic acid; HIP, hydrophobic ion-pairing. Note: Data are expressed as mean ± SEM (n = 3). |
Quantitative Cellular Uptake Studies
FITC–insulin-loaded HIP-nanocomplexes (FITC-C1 and FITC-C2) were fabricated to evaluate the interactions of the nanocomplexes with TR146 cells. These were quantitatively analyzed using FACS. Using FACS, the uptake patterns of FITC-C1 and FITC-C2 were observed (Figure 5). As shown in Figure 5A, an increased shift in the fluorescence intensity of FITC-insulin was observed after the formation of HIP-nanocomplexes. The relative median fluorescence intensity (MFI) values were determined to compare the fluorescence intensities of these nanocomplexes and the fluorescence intensity of free FITC-insulin solution. As depicted in Figure 5B, the nanocomplexes of FITC-C1 and FITC-C2 significantly enhanced the uptake of FITC-insulin by 2- and 1.46-fold, respectively, compared with FITC-insulin solution (***p < 0.001 vs FITC–insulin). This finding might be attributed to the increased lipophilic characteristic of the formulations and the solubilization and micellar entrapment of intracellular lipids with SGDC, which could have led to an increase in cellular uptake.25 Similarly, the FITC-C1 nanocomplex showed a 1.37-fold increase in the cellular uptake of FITC-insulin compared with the FITC-C2 nanocomplex (###p < 0.001 vs FITC-C2). Overall, these results revealed the relative MFI values in the order of FITC-C1 > FITC-C2 > free FITC-insulin solution, which is consistent with the findings obtained from in vitro insulin permeability studies performed across TR146 cell layers.
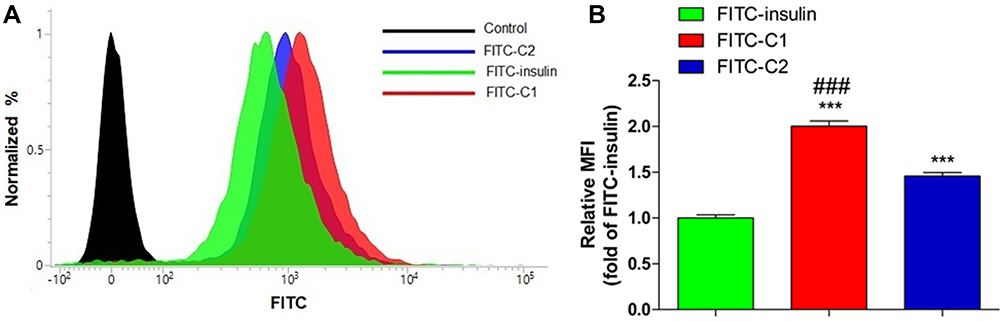 |
Figure 5 Cellular uptake of HIP-nanocomplexes (FITC-C1 and FITC-C2) across TR146 cells. (A) Representative fluorescence intensity showing cellular uptake characteristics of FITC-C1 and FITC-C2. (B) Relative MFI values of FITC-C1 and FITC-C2 compared with the relative MFI values of free FITC–insulin. Abbreviations: FITC, fluorescein isothiocyanate, FITC-insulin; HIP, hydrophobic ion-pairing; MFI, median fluorescence intensity. Note: Data are expressed as mean ± SEM (n = 3). ***p < 0.001 vs FITC-insulin and ###p < 0.001 vs FITC-C2. |
Qualitative Cellular Uptake Studies
CLSM analysis was used to illustrate the qualitative uptake of HIP-nanocomplexes (FITC-C1 and FITC-C2), as depicted in Figure 6. Herein, the blue fluorescence emitted by Hoechst 33342 represents the nuclei of the cells, the green fluorescence emitted by the FITC is indicative of insulin, and the red fluorescence emitted by CellMaskTM Deep Red denotes the cell membranes. Upon treatment with HIP-nanocomplex FITC-C1, a highly intense green fluorescence was observed in the vicinity of the cell membrane. In contrast, following incubation with FITC-C2, a relatively low green fluorescence was observed in the vicinity of the cell membrane. These findings clearly implied that the internalization of FITC-insulin was more abundant with the FITC-C1-nanocomplex than the FITC-C2-nanocomplex. Owing to the presence of fewer H-bond donors and acceptors, the greater lipophilic attributes of dihydroxy bile salts, such as SGDC, might have led to an increased internalization of the FITC-C1-nanocomplex.47
 |
Figure 6 Confocal microscope images of TR146 cells after cellular uptake of free FITC-insulin and HIP-nanocomplexes (FITC-C1 and FITC-C2). Abbreviations: FITC, fluorescein isothiocyanate, FITC-insulin; HIP, hydrophobic ion-pairing. Note: Blue: the nuclei stained with Hoechst 33,342; green: FITC-insulin; and red: the cell membrane with CellMaskTM Deep Red. The scale and magnification are 20 µm and ×40, respectively. |
Ex vivo Permeability Studies
Porcine buccal tissue can simulate the in vivo environment of the human cheeks; thus, they were used as an ex vivo model in permeability studies to assess the transbuccal absorption of insulin. The profiles of cumulative permeated insulin from HIP-nanocomplexes (C1 and C2) across porcine buccal tissue are illustrated as a function of time in Figure 7A. Herein, the cumulative amount of permeated insulin from the C1-nanocomplex formulation was approximately 51.76- and 27.64-fold higher than that of the insulin solution and the C2-nanocomplex, respectively. Based on these results, buccal permeation parameters such as Js, Kp, and ER were calculated, and the results are shown in Table 4. The increase in these parameters was ranked as follows: C1 > C2 > insulin solution. The C1-nanocomplex exhibited the highest Js, which was significantly greater than those of the insulin solution and C2 (**p < 0.01 vs insulin solution and ##p < 0.01 vs C2). In addition, the C1-nanocomplex significantly increased the permeation of insulin across porcine buccal tissue, with a 51.76-fold increase in Kp compared with that of the insulin solution. Moreover, the C2-nanocomplex also increased the permeation of insulin across porcine buccal tissue, with a 1.87-fold increase in Kp compared with that of the insulin solution. In addition, as shown in Figure 7B, the C1-nanocomplex deposited 5.71- and 2.77-fold greater amounts of insulin in buccal tissue than those with the insulin solution and C2, respectively (**p < 0.01 vs insulin and ##p < 0.01 vs C2). The C2 nanocomplex deposited 2.06-fold higher amounts of insulin in buccal tissue than that with the insulin solution. This finding might be due to the increase in the apparent partition coefficient of the nanocomplex formulation, leading to a lipophilic complex (Table 1). Furthermore, SGDC acts as a permeation enhancer and enhances the permeability of hydrophilic compounds via paracellular and transcellular pathways across porcine buccal tissue.24,48 Dihydroxy bile salts such as SGDC were also shown to enhance paracellular transport at concentrations below 10 mM and opened the transcellular route at concentrations of 10 mM or higher, whereas 0.4 mM SGDC did not show enhancement flux.49 As per this observation, our findings might have followed a similar trend, as seen from increased insulin permeability from the C1-nanocomplex via increasing intracellular transport as C1 had 5.17 mM SGDC content. In contrast, C2 was composed of 1.04 mM SGDC, which is close to the concentration of 0.4 mM; therefore, this might be the reason for the low permeability of insulin observed from the C2-nanocomplex formulation. Moreover, a previous study reported by Mahalingam et al revealed an underlying mechanism behind permeability enhancement of 5-aza-2´-deoxycytidine with 10 mM SGDC across porcine buccal tissue. A 38-fold increase in the apparent permeability of 5-aza-2´-deoxycytidine compared with that of the control was postulated to have occurred because of a complex process, including enzyme inactivation and tissue swelling, solubilization and micellular entrapment of intercellular lipids, and extraction and denaturation of proteins.25
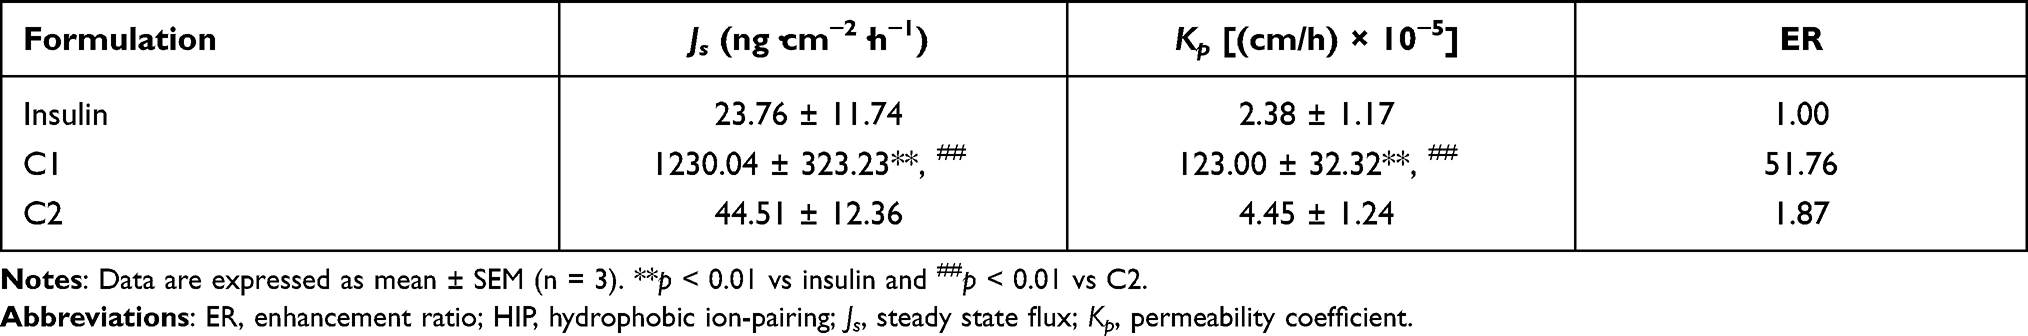 |
Table 4 Permeation Parameters Calculated from Permeability Studies of HIP-Nanocomplexes (C1 and C2) Across Porcine Buccal Tissue |
 |
Figure 7 Ex vivo permeability studies. (A) Permeability profiles of HIP-nanocomplexes (C1 and C2) across porcine buccal tissue, and (B) insulin deposited in porcine buccal tissue. Abbreviations: HIP, hydrophobic ion-pairing; PBS, phosphate-buffered saline. Note: All studies were directed from the donor to the receptor chamber in PBS buffer (pH 7.4) at 37°C. Data are expressed as mean ± SEM (n = 3). **p < 0.01 vs insulin and ##p < 0.01 vs C2. |
Ex vivo Localization Studies
CLSM analysis was used to evaluate the distribution of HIP-nanocomplexes (FITC-C1 and FITC-C2) across porcine buccal tissue. As illustrated in Figure 8, localized insulin is represented by green fluorescence (FITC–insulin) and was observed at predetermined time points (0.5, 2, and 4 h). Upon treatment with FITC-insulin solution, there was minimal localization of FITC-insulin across buccal tissue, and this did not persist much with time, remaining only in the upper layer of the epidermis over 4 h. In contrast, significant green fluorescence was observed across buccal tissue and changed noticeably with time, remaining in the upper layer of the epidermis for over 2 h following treatment with both nanocomplex formulations. Interestingly, a more intense green fluorescence of localized FITC-insulin was observed in the inner regions of the buccal tissue at 4 h following treatment with both nanocomplexes. However, the localization of FITC-C1-insulin was more abundant than that of FITC-C2-insulin at 4 h, as confirmed by the presence of a more intense green fluorescence in the inner region of buccal tissue. Overall, these findings revealed that the FITC-C1-nanocomplex had the highest fluorescence intensity of FITC-insulin across porcine buccal tissue. The increment in fluorescence intensity was observed to be FITC-C1 > FITC-C2 > free FITC-insulin and was in agreement with the results obtained from ex vivo permeability studies.
 |
Figure 8 CLSM assessment of porcine buccal tissue after application of (A) FITC-insulin solution and HIP-nanocomplexes [(B) FITC-C1 and (C) FITC-C2] at predetermined time points - 0.5, 2, and 4 h. Abbreviations: CLSM, confocal laser scanning microscopy; FITC, fluorescein isothiocyanate, FITC-insulin, FITC-insulin solution; HIP, hydrophobic ion-pairing. Note: The scale bar and magnification are 100 µm and ×10, respectively. |
Conclusions
In this study, we explored the feasibility of HIP-nanocomplexes to circumvent the daunting issues associated with the permeability barrier of the buccal mucosa. HIP-nanocomplexes (C1 and C2) were successfully characterized based on particle size, PDI, zeta potential, and partition coefficient. In addition, the morphologies of C1 and C2 were assessed using TEM, SEM, and CytoVivaTM. Compared with C2, the C1-nanocomplex exhibited tremendous potential for enhancing the permeation of insulin across TR146 cell layers and porcine buccal tissue, displaying a 2.18- and 27.64-fold increase in permeability coefficient, respectively. Furthermore, the C1-nanocomplex expressed a higher fluorescence intensity towards the inner region of buccal tissue over time than did the C2-nanocomplex. However, further studies are required to elucidate the underlying mechanism(s) and in vivo performance of these HIP-nanocomplexes. Overall, the study has revealed a feasible alternative for injectable formulations, and thus, the HIP-nanocomplex strategy could serve as a platform for buccal delivery of peptide drugs.
Acknowledgments
This research was supported by the Basic Science Research Program through the National Research Foundation of Korea (NRF) funded by the Ministry of Sciences, ICT & Future Planning (NRF-2013R1A1A2012193, NRF-2016R1D1A1B01015369) and the ministry of Education (NRF-2016R1A6A1A03011325).
Disclosure
The authors report no conflicts of interest in this work.
References
1. Drucker DJ, Jacob R. Advances in oral peptide therapeutics. Nat Rev Drug Discov. 2019;18(1):1–13. doi:10.1038/nrd.2018.92
2. Vargason AM, Anselmo AC, Mitragotri S. The evolution of commercial drug delivery technologies. Nature Biomed Eng. 2021;1–17.
3. Aguirre TA, Teijeiro-Osorio D, Rosa M, Coulter I, Alonso M, Brayden D. Current status of selected oral peptide technologies in advanced preclinical development and in clinical trials. Adv Drug Deliv Rev. 2016;106:223–241. doi:10.1016/j.addr.2016.02.004
4. Fosgerau K, Hoffmann T. Peptide therapeutics: current status and future directions. Drug Discov Today. 2015;20(1):122–128. doi:10.1016/j.drudis.2014.10.003
5. Montenegro-Nicolini M, Morales JO. Overview and future potential of buccal mucoadhesive films as drug delivery systems for biologics. AAPS PharmSciTech. 2017;18(1):3–14. doi:10.1208/s12249-016-0525-z
6. Bashyal S, Noh G, Keum T, Choi YW, Lee S. Cell penetrating peptides as an innovative approach for drug delivery; then, present and the future. J Pharm Investig. 2016;46(3):205–220. doi:10.1007/s40005-016-0253-0
7. Vaidya A, Mitragotri S. Ionic liquid-mediated delivery of insulin to buccal mucosa. J Control Release. 2020;327:26–34. doi:10.1016/j.jconrel.2020.07.037
8. Bashyal S, Seo J-E, Keum T, Noh G, Choi YW, Lee S. Facilitated permeation of insulin across TR146 cells by cholic acid derivatives-modified elastic bilosomes. Int J Nanomedicine. 2018;13:5173–5186. doi:10.2147/IJN.S168310
9. Caon T, Jin L, Simões CM, Norton RS, Nicolazzo JA. Enhancing the buccal mucosal delivery of peptide and protein therapeutics. Pharm Res. 2015;32(1):1–21. doi:10.1007/s11095-014-1485-1
10. Barua S, Kim H, Jo K, et al. Drug delivery techniques for buccal route: formulation strategies and recent advances in dosage form design. J Pharm Investig. 2016;46(7):593–613. doi:10.1007/s40005-016-0281-9
11. Reis CP, Damge C. Nanotechnology as a promising strategy for alternative routes of insulin delivery. In: Methods Enzymol. Vol. 508. Elsevier; 2012:271–294.
12. Macedo AS, Castro PM, Roque L, et al. Novel and revisited approaches in nanoparticle systems for buccal drug delivery. J Control Release. 2020;320:125–141. doi:10.1016/j.jconrel.2020.01.006
13. Fonseca-Santos B, Chorilli M. An overview of polymeric dosage forms in buccal drug delivery: state of art, design of formulations and their in vivo performance evaluation. Mater Sci Eng C Mater Biol Appl. 2018;86:129–143. doi:10.1016/j.msec.2017.12.022
14. Hassan N, Ahad A, Ali M, Ali J. Chemical permeation enhancers for transbuccal drug delivery. Expert Opin Drug Deliv. 2010;7(1):97–112. doi:10.1517/17425240903338758
15. Keum T, Noh G, Seo J-E, Bashyal S, Lee S. In vitro and ex vivo evaluation of penetratin as a non-invasive permeation enhancer in the penetration of salmon calcitonin through TR146 buccal cells and porcine buccal tissues. Pharmaceuticals. 2020;13(11):408. doi:10.3390/ph13110408
16. Bajracharya R, Song JG, Back SY, Han H-K. Recent advancements in non-invasive formulations for protein drug delivery. Comput Struct Biotechnol J. 2019;17:1290–1308. doi:10.1016/j.csbj.2019.09.004
17. Kesharwani P, Gorain B, Low SY, et al. Nanotechnology based approaches for anti-diabetic drugs delivery. Diabetes Res Clin Pract. 2018;136:52–77. doi:10.1016/j.diabres.2017.11.018
18. Kim NA, Heo B, Jeong SH. Rapid methodology for basal system selection of therapeutic proteins during the early stage biopharmaceutical development. J Pharm Investig. 2019;1–10.
19. Batista P, Castro PM, Madureira AR, Sarmento B, Pintado M. Recent insights in the use of nanocarriers for the oral delivery of bioactive proteins and peptides. Peptides. 2018;101:112–123. doi:10.1016/j.peptides.2018.01.002
20. Pinto S, Pintado ME, Sarmento B. In vivo, ex vivo and in vitro assessment of buccal permeation of drugs from delivery systems. Expert Opin Drug Deliv. 2020;17(1):33–48. doi:10.1080/17425247.2020.1699913
21. Hua S. Advances in nanoparticulate drug delivery approaches for sublingual and buccal administration. Front Pharmacol. 2019;10.
22. Maharjan P, Cho KH, Maharjan A, Shin MC, Moon C, Min KA. Pharmaceutical challenges and perspectives in developing ophthalmic drug formulations. J Pharm Investig. 2019;49(2):215–228. doi:10.1007/s40005-018-0404-6
23. Nurunnabi M, Khatun Z, Revuri V, et al. Design and strategies for bile acid mediated therapy and imaging. RSC Adv. 2016;6(78):73986–74002. doi:10.1039/C6RA10978K
24. Oh D-H, Chun K-H, Jeon S-O, Kang JW, Lee S. Enhanced transbuccal salmon calcitonin (sCT) delivery: effect of chemical enhancers and electrical assistance on in vitro sCT buccal permeation. Eur J Pharm Biopharm. 2011;79(2):357–363. doi:10.1016/j.ejpb.2011.05.010
25. Mahalingam R, Ravivarapu H, Redkar S, Li X, Jasti BR. Transbuccal delivery of 5-Aza-2′-deoxycytidine: effects of drug concentration, buffer solution, and bile salts on permeation. AAPS PharmSciTech. 2007;8(3):E28–E33. doi:10.1208/pt0803055
26. Dhiman MK, Dhiman A, Sawant KK. Transbuccal delivery of 5-fluorouracil: permeation enhancement and pharmacokinetic study. AAPS PharmSciTech. 2009;10(1):258–265. doi:10.1208/s12249-009-9203-8
27. Xu Y, Zhang X, Zhang Y, et al. Mechanisms of deformable nanovesicles based on insulin-phospholipid complex for enhancing buccal delivery of insulin. Int J Nanomedicine. 2018;13:7319–7331. doi:10.2147/IJN.S175425
28. Kim D-H, Larson AC. Deoxycholate bile acid directed synthesis of branched Au nanostructures for near infrared photothermal ablation. Biomaterials. 2015;56:154–164. doi:10.1016/j.biomaterials.2015.03.048
29. Thomas C, Pellicciari R, Pruzanski M, Auwerx J, Schoonjans K. Targeting bile-acid signalling for metabolic diseases. Nat Rev Drug Discov. 2008;7(8):678–693. doi:10.1038/nrd2619
30. Meyer JD, Manning MC. Hydrophobic ion pairing: altering the solubility properties of biomolecules. Pharm Res. 1998;15(2):188–193. doi:10.1023/A:1011998014474
31. Ristroph KD, Prud’homme RK. Hydrophobic ion pairing: encapsulating small molecules, peptides, and proteins into nanocarriers. Nanoscale Advances. 2019;1(11):4207–4237. doi:10.1039/C9NA00308H
32. Norman AW, Henry HL. Pancreatic hormones: insulin and glucagon. In: Hormones.
33. Zizzari AT, Pliatsika D, Gall FM, Fischer T, Riedl R. New perspectives in oral peptide delivery. Drug Discov Today. 2021;26(4):1097–1105. doi:10.1016/j.drudis.2021.01.020
34. Sikora K, Jaśkiewicz M, Neubauer D, Migoń D, Kamysz W. The role of counter-ions in peptides—an overview. Pharmaceuticals. 2020;13(12):442. doi:10.3390/ph13120442
35. Shrestha N, Araújo F, Shahbazi MA, et al. Thiolation and cell‐penetrating peptide surface functionalization of porous silicon nanoparticles for oral delivery of insulin. Adv Funct Mater. 2016;26(20):3405–3416. doi:10.1002/adfm.201505252
36. Bashyal S, Seo J-E, Keum T, Noh G, Lamichhane S, Lee S. Development, characterization, and ex vivo assessment of elastic liposomes for enhancing the buccal delivery of insulin. Pharmaceutics. 2021;13(4):565. doi:10.3390/pharmaceutics13040565
37. Rastogi R, Anand S, Koul V. Evaluation of pharmacological efficacy of ‘insulin–surfoplex’encapsulated polymer vesicles. Int J Pharm. 2009;373(1–2):107–115. doi:10.1016/j.ijpharm.2009.01.022
38. Sun S, Liang N, Kawashima Y, Xia D, Cui F. Hydrophobic ion pairing of an insulin-sodium deoxycholate complex for oral delivery of insulin. Int J Nanomedicine. 2011;6:3049–3056. doi:10.2147/IJN.S26450
39. Lee SH, Song JG, Han H-K. Development of pH-responsive organic-inorganic hybrid nanocomposites as an effective oral delivery system of protein drugs. J Control Release. 2019;311:74–84. doi:10.1016/j.jconrel.2019.08.036
40. Gordon G, Moses A, Silver R, Flier J, Carey M. Nasal absorption of insulin: enhancement by hydrophobic bile salts. Proc Natl Acad Sci USA. 1985;82(21):7419–7423. doi:10.1073/pnas.82.21.7419
41. Shrestha N, Araújo F, Sarmento B, Hirvonen J, Santos HA. Cell-based in vitro models for buccal permeability studies. In: Sarmento B, editor. Concepts and Models for Drug Permeability Studies. New York: Elsevier; 2016:31–40.
42. Teubl BJ, Absenger M, Fröhlich E, Leitinger G, Zimmer A, Roblegg E. The oral cavity as a biological barrier system: design of an advanced buccal in vitro permeability model. Eur J Pharm Biopharm. 2013;84(2):386–393. doi:10.1016/j.ejpb.2012.10.021
43. Jacobsen J, van Deurs B, Pedersen M, Rassing MR. TR146 cells grown on filters as a model for human buccal epithelium: i. Morphology, growth, barrier properties, and permeability. Int J Pharm. 1995;125(2):165–184. doi:10.1016/0378-5173(95)00109-V
44. Brayden DJ, Stuettgen V. Sodium glycodeoxycholate and sodium deoxycholate as epithelial permeation enhancers: in vitro and ex vivo intestinal and buccal bioassays. Eur J Pharm Sci. 2021;159:105737. doi:10.1016/j.ejps.2021.105737
45. Dai W-G, Dong LC, Song Y. Enhanced bioavailability of poorly absorbed hydrophilic compounds through drug complex/in situ gelling formulation. Int J Pharm. 2013;457(1):63–70. doi:10.1016/j.ijpharm.2013.07.066
46. Pavlović N, Goločorbin-Kon S, Ðanić M, et al. Bile acids and their derivatives as potential modifiers of drug release and pharmacokinetic profiles. Front Pharmacol. 2018;9:1283. doi:10.3389/fphar.2018.01283
47. Moghimipour E, Ameri A, Handali S. Absorption-enhancing effects of bile salts. Molecules. 2015;20(8):14451–14473. doi:10.3390/molecules200814451
48. Oh D-H, Kim M-J, Jeon S-O, et al. Strategic approaches for enhancement of in vivo transbuccal peptide drug delivery in rabbits using iontophoresis and chemical enhancers. Pharm Res. 2015;32(3):929–940. doi:10.1007/s11095-014-1507-z
49. Hoogstraate A, Senel S, Cullander C, Verhoef J, Junginger H, Bodde H. Effects of bile salts on transport rates and routes of FITC-labelled compounds across porcine buccal epithelium in vitro. J Control Release. 1996;40(3):211–221. doi:10.1016/0168-3659(95)00187-5
 © 2021 The Author(s). This work is published and licensed by Dove Medical Press Limited. The
full terms of this license are available at https://www.dovepress.com/terms
and incorporate the Creative Commons Attribution
- Non Commercial (unported, 3.0) License.
By accessing the work you hereby accept the Terms. Non-commercial uses of the work are permitted
without any further permission from Dove Medical Press Limited, provided the work is properly
attributed. For permission for commercial use of this work, please see paragraphs 4.2 and 5 of our Terms.
© 2021 The Author(s). This work is published and licensed by Dove Medical Press Limited. The
full terms of this license are available at https://www.dovepress.com/terms
and incorporate the Creative Commons Attribution
- Non Commercial (unported, 3.0) License.
By accessing the work you hereby accept the Terms. Non-commercial uses of the work are permitted
without any further permission from Dove Medical Press Limited, provided the work is properly
attributed. For permission for commercial use of this work, please see paragraphs 4.2 and 5 of our Terms.