")
Back to Journals » International Journal of Nanomedicine » Volume 9 » Issue 1
Facile electrochemical synthesis of antimicrobial TiO2 nanotube arrays
Authors Zhao Y, Xing Q, Janjanam J, He K, Long F, Low K, Tiwari A, Zhao F, Shahbazian-Yassar R, Friedrich C, Shokuhfar T
Received 2 April 2014
Accepted for publication 1 June 2014
Published 11 November 2014 Volume 2014:9(1) Pages 5177—5187
DOI https://doi.org/10.2147/IJN.S65386
Checked for plagiarism Yes
Review by Single anonymous peer review
Peer reviewer comments 3
Yu Zhao,1 Qi Xing,2 Jagadeesh Janjanam,3 Kun He,1,4 Fei Long,1 Ke-Bin Low,5 Ashutosh Tiwari,3 Feng Zhao,2 Reza Shahbazian-Yassar,1 Craig Friedrich,1,8 Tolou Shokuhfar1,6–8
1Department of Mechanical Engineering-Engineering Mechanics, Michigan Technological University, Houghton, MI, USA; 2Department of Biomedical Engineering, Michigan Technological University, Houghton, MI, USA; 3Department of Chemistry, Michigan Technological University, Houghton, MI, USA; 4School of Materials Science and Engineering, Shandong University, Jinan, People’s Republic of China; 5Research Resources Center, University of Illinois at Chicago, Chicago, IL, USA; 6Department of Physics, University of Illinois at Chicago, Chicago, IL, USA; 7Mechanical and Industrial Engineering Department, University of Illinois at Chicago, Chicago, IL, USA; 8Multi-Scale Technologies Institute, Michigan Technological University, Houghton, MI, USA
Abstract: Infection-related complications have been a critical issue for the application of titanium orthopedic implants. The use of Ag nanoparticles offers a potential approach to incorporate antimicrobial properties into the titanium implants. In this work, a novel and simple method was developed for synthesis of Ag (II) oxide deposited TiO2 nanotubes (TiNTs) using electrochemical anodization followed by Ag electroplating processes in the same electrolyte. The quantities of AgO nanoparticles deposited in TiNT were controlled by selecting different electroplating times and voltages. It was shown that AgO nanoparticles were crystalline and distributed throughout the length of the nanotubes. Inductively coupled plasma mass spectrometry tests showed that the quantities of released Ag were less than 7 mg/L after 30 days at 37°C. Antimicrobial assay results show that the AgO-deposited TiNTs can effectively kill the Escherichia coli bacteria. Although the AgO-deposited TiNTs showed some cytotoxicity, it should be controllable by optimization of the electroplating parameters and incorporation of cell growth factor. The results of this study indicated that antimicrobial properties could be added to nanotextured medical implants through a simple and cost effective method.
Keywords: TiO2 nanotube arrays, anodization, AgO nanoparticles, antimicrobial, cytotoxicity
Introduction
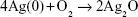
Currently, bacterial infection is one of the most challenging issues for biomedical implants. Ag nanoparticles have strong antimicrobial function and this has been extensively studied.1,2 The antimicrobial function is possibly contributed by four mechanisms.1,3 The first is the attachment of Ag nanoparticles (1–10 nm) on the cell membrane. The second is that Ag nanoparticles penetrate into the cell and interact with sulfur and phosphorus in the cells. Ag nanoparticles can also produce reactive oxygen species (ROS).3 The last is the release of Ag ions from Ag particles to destroy the DNA replication ability.2 The release mechanism of Ag+ from Ag nanoparticles includes the oxidation of Ag nanoparticles and Ag+ release under acidic conditions, which is described in the following equation.4,5
| (1) |
| (2) |

Another critical issue for Ag in medical implants is the cytotoxicity problem. It was found that relatively small Ag nanoparticles led to lower cell viability.6 This was related to the large release of Ag ions due to the high surface energy of smaller Ag nanoparticles. The release of Ag ions from Ag nanoparticles is associated with one or two oxidized monolayers on the surface of the nanoparticles.7 For biomedical implant applications, smaller Ag particle size does not always lead to better performance. The cell cytotoxicity of Ag nanoparticles can be controlled by reducing the total quantity of small Ag nanoparticles or utilizing relatively large nanoparticles.
In recent years, researchers have shown much interest in TiO2 nanotubes (TiNTs) due to their unique properties for bio-applications.8–18 TiNT structures are particularly interesting because of their large specific surface areas and tube-like structure, which may supply many more reactive sites for the reaction. Due to the antimicrobial function of Ag nanoparticles, depositing Ag on TiNTs may bring better performance for biomedical implants. Some studies investigated the antimicrobial and cytotoxic effects of sputtering-coated Ag nanoparticles on TiNTs.19,20 It was found that just 0.01 mg/cm2 Ag on TiNTs could effectively kill the Staphylococcus epidermidis without significant damage to the cells.
Many fabrication methods have been developed to deposit Ag onto and in TiNTs, including pulsed current deposition,21 successive ionic layer adsorption and reaction,22,23 photochemical reduction,24–26 layer by layer assembly,27,28 chemical assembly,29 and sputtering.19,20 Pulsed current deposition method can produce a uniform deposition of Ag nanoparticles, but this method needs a special pulsed current control system. Successive ionic layer adsorption and reaction, layer by layer and chemical assembly require several different chemical reagents and multiple steps. Sputtering can produce a very consistent distribution of Ag nanoparticles, but sputtering is a relatively time consuming and high cost operation. Photochemical reduction is a relatively simple method, but this method requires different electrolytes for anodization and Ag depositing.
In this study, a novel and cost effective method was developed to synthesize the AgO-deposited TiNT arrays. Anodization and AgO-depositing processes were performed in the same electrolyte containing AgF to supply both the fluoride ions for Ti anodization and Ag ions for synthesis of AgO nanoparticles by electroplating at constant voltages. Only one DC power supply was required for both the anodization and Ag-electroplating processes. In the present work, bacterial and cell cytotoxic tests were performed to evaluate the antimicrobial and cytotoxic properties of the AgO-deposited TiNTs.
Materials and methods
Specimen preparation
Pure Ti foil (Alfa, 0.25 mm thick, 99.5%) was selected as the substrate to form the TiNT layer by electrochemical anodization. Prior to anodization, the samples were polished with sand paper 300, 400 and 1,200 and then cleaned in ethanol for 10 minutes. During each anodization operation, the back side and edges of the samples were covered with nail polish leaving four 10×10 mm2 areas uncovered. Figure 1 shows the setup for anodization and Ag-depositing (Ag electroplating). The anodization system was a two-electrode electrochemical cell. Ti foils served as the anode while a carbon rod was used as the cathode. All samples were anodized in fresh electrolyte containing 0.686 g AgF, 98 mL ethylene glycol and 2 mL deionized water. The anodization process was performed at 60 VDC for 90 minutes in a 25°C water bath. During anodization, TiNTs were formed at the Ti substrate. Ag+ in the electrolyte was adsorbed onto the surface of the carbon cathode as the electric field supplied electrons for Ag deposition. For the Ag depositing process, the samples were first covered by Spectra/Por® 7 semi-permeable membrane (Spectrum Laboratories, Inc., Rancho Dominguez, CA, USA). Then the electrodes were switched and 20 VDC was applied to rapidly deposit Ag nanoparticles onto the TiNTs. During the Ag deposition process, Ag on the cathode lost electrons and dissolved into the electrolyte. Under the electric field, Ag+ in the electrolyte migrated into the TiNTs, took up electrons, and formed Ag nanoparticles. Three Ag-deposition times were applied, 30, 60, and 90 seconds. These samples were denoted as TiNT-Ag30s, TiNT-Ag60s, and TiNT-Ag90s, respectively. After Ag-deposition, the samples were rinsed in acetone, isopropanol, and deionized water each for 5 minutes.
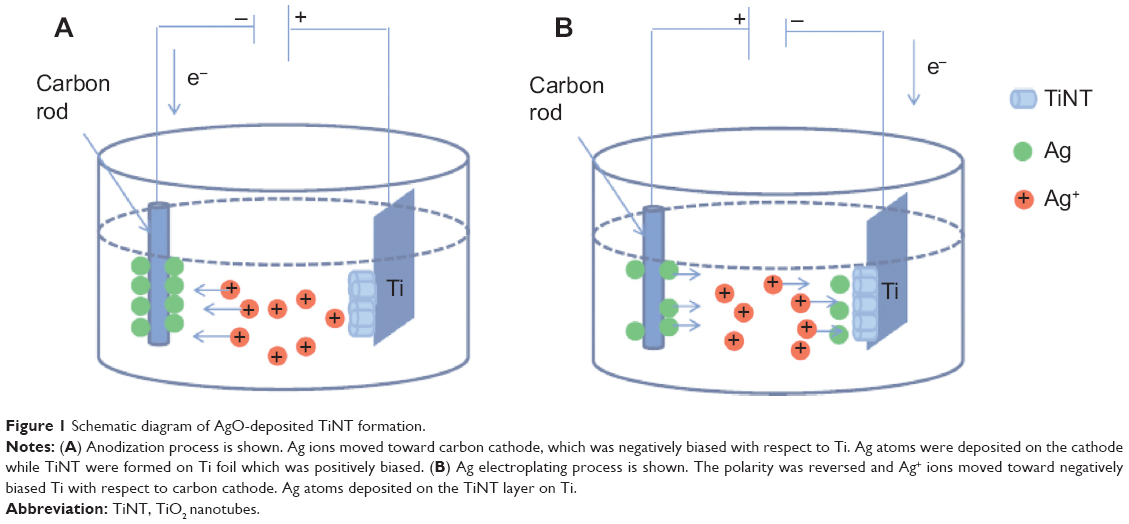 | Figure 1 Schematic diagram of AgO-deposited TiNT formation. |
Characterization and Ag release tests
The surface topography of AgO-deposited TiNTs was observed by Hitachi S-4700 scanning electron microscopy (Hitachi Ltd, Tokyo, Japan). The elemental composition of the AgO-deposited TiNTs were measured by energy-dispersive X-ray spectroscopy. The crystal structure of the AgO-deposited TiNTs was characterized by JEOL JEM-3010 (JEOL, Tokyo, Japan) transmission electron microscope (TEM). For Ag release tests, the samples were incubated in 5 mL α-Minimum Essential Medium (α-MEM), 10% fetal bovine serum (FBS), and 1% pen-strep at 37°C. The Ag+ concentration in the medium was analyzed by Perkin-Elmer® Optima 7000 DV (PerkinElmer Inc., Waltham, MA, USA) inductively coupled plasma mass spectrometry.
Cell culture
MC3T3 mouse osteoblast cells were selected for cytotoxicity and proliferation tests. The cells were cultured in a complete medium composed of α-MEM, 10% FBS, and 1% pen-strep and incubated in a humidified atmosphere containing 5% CO2 at 37°C.
Cell proliferation tests
The MC3T3 cells were grown in 2 mL of medium with AgO-deposited TiNT samples (10×10 mm2) in the 12-well plate. Before the cell tests, all samples were sterilized with 70% ethanol and rinsed with sterile water. The DNA content in the medium was determined fluorometrically using PicoGreen assay kit (Thermo Fisher Scientific, Waltham, MA, USA). The medium was removed and the samples were rinsed with phosphate buffer saline (PBS) solution. Then, the cells were lysed using 1 mL proteinase K solution at 37°C for 1 hour. One hundred μL proteinase K solution was placed in triplicate in a 96-well plate and mixed with 100 μL PicoGreen. The plate was incubated at room temperature for 10 minutes in the dark and then read on a Fluoroskan Ascent™ FL fluorescent plate reader (Thermo Fisher Scientific). For each data point, four samples were tested. The statistical significance was calculated by analysis of variance (ANOVA) test.
Lactate dehydrogenase activity assay
The cytotoxicity of Ag-deposited TiNTs was determined by lactate dehydrogenase (LDH) assay. After 1 and 4 days, the supernatant culture media was collected and used for the LDH assay. The assay was operated based on the manufacturer’s instructions (Promega Corporation, Fitchburg, WI, USA). Similar to the cell proliferation tests, four samples were tested for each data point. The statistical significance was calculated by ANOVA test.
Antimicrobial tests
Antimicrobial effects of AgO-deposited TiNT samples were evaluated using E. coli (One Shot® Mach1™ T1 Phage E. coli from Thermo Fisher Scientific) as previously reported.30 Briefly, E. coli was initially cultured in 15 mL Luria broth (Sigma-Aldrich Co., St Louis, MO, USA, L3522) overnight at 37°C and plated on agar plates at a density of approximately 107 cfu. Ti-nanotubes were cut into 10×10 mm2 squares, sterilized with ethanol, and rinsed with sterile water before placing them on top of the inoculated agar plates. The agar plates were incubated at 37°C for 24 hours (hr). The zone of inhibition (ZoI; clear zone formed around the samples) was measured using a ruler and values reported are average of three independent samples for each condition.
The viability of bacteria on the surface of AgO-deposited TiNTs was measured based on differential fluorescence staining for live and dead bacteria as reported previously.31 Briefly, E. coli from a glycerol stock was inoculated into 15 mL of Luria broth and incubated at 37°C overnight. Approximately 8×10⁶ cells from the culture were inoculated on the surface of nanotubes with fresh media that was incubated overnight at 37°C. All samples incubated with bacterial culture overnight were replaced with fresh media and were further incubated at 37°C for 7 days with fresh media being replaced every 24 hr. This was followed by adding fresh bacterial suspension to nanotubes and incubating it for another 7 hr before rinsing with PBS. Samples were stained using acridine orange (4 μg/mL) and ethidium bromide (0.5 μg/mL) for 15 minutes in the dark and observed under fluorescence microscopy (EVOS-fl, AMAG Pharmaceuticals Inc., Lexington, MA, USA). The images were taken with red fluorescent protein (RFP) filter for ethidium bromide and green fluorescent protein (GFP) filter for acridine orange. All the images were acquired using 60× objective. The live cells stained with acridine orange appear green whereas the dead cells stained with ethidium bromide appear red.
Results
Characterization of AgO-deposited TiNTs
Figure 2A–C shows the surfaces of AgO-deposited TiNTs for different electroplating times. Nanoparticles (about 80 nm) were found on the surface of the TiNTs. With increased deposition time, more nanoparticles were observed. Energy-dispersive X-ray spectroscopy (Figure 2D) shows a small peak of Ag at 3 keV. Figure 2E and F show the topography and surface potential of TiNT-Ag60s by atomic force microscopy (AFM). The size of surface nanoparticles and the TiNT diameters were similar. So, it was difficult to distinguish the surface nanoparticles from TiNT substrate by AFM topography image (Figure 2E). Due to the potential difference between AgO and TiO2, AgO nanoparticles showed some much brighter areas in Figure 2F, which means a higher surface potential is associated with AgO. To confirm the crystal structure of the nanoparticles and TiNT substrate, TEM images and diffraction patterns were obtained. Figure 3 shows the TEM images of the TiNT-Ag60s. Based on the diffraction pattern in Figure 3A, the TiNT substrate was amorphous. As shown in Figure 3A and B, about 10 nm black nanoparticles attached inside the TiNT. Based on the scanning electron microscopy and TEM images, the Ag nanoparticles fabricated in present work were composed of relatively large nanoparticles (about 80 nm) at the surface and small nanoparticles (about 10 nm) inside the TiNTs. Figure 3C shows the atomic resolution images of the black particles. Based on the diffraction pattern (Figure 3D), the black nanoparticles are AgO. Figure 4 shows the high resolution X-ray photon spectroscopy (XPS) spectrum of Ag 3d in TiNT-Ag60s. The binding energy peaks of Ag 3d are at 367.4 eV and 373.4 eV. Ag 3d5/2 peak for AgO is at 367.4 eV.32 So, the XPS spectrum of Ag 3d in TiNT-Ag60s (Figure 4) further confirms that the nanoparticles are AgO. Both TEM and XPS results clearly show that AgO nanoparticles were on the TiNTs. Based on the Ag–H2O Pourbaix diagram,33 Ag particles should have formed during the electroplating process. But the electrolyte was acidic, which was more favorable for the oxidation of Ag. It was also found that AgO tended to form during electrochemical oxidation in acid and neutral solution of Ag+ salt.34,35 In another aspect, the small Ag nanoparticles had a high surface energy which made them more susceptible to oxidation in an acidic solution. Both the acidic environment and the high surface energy might have caused the transition from Ag to AgO.
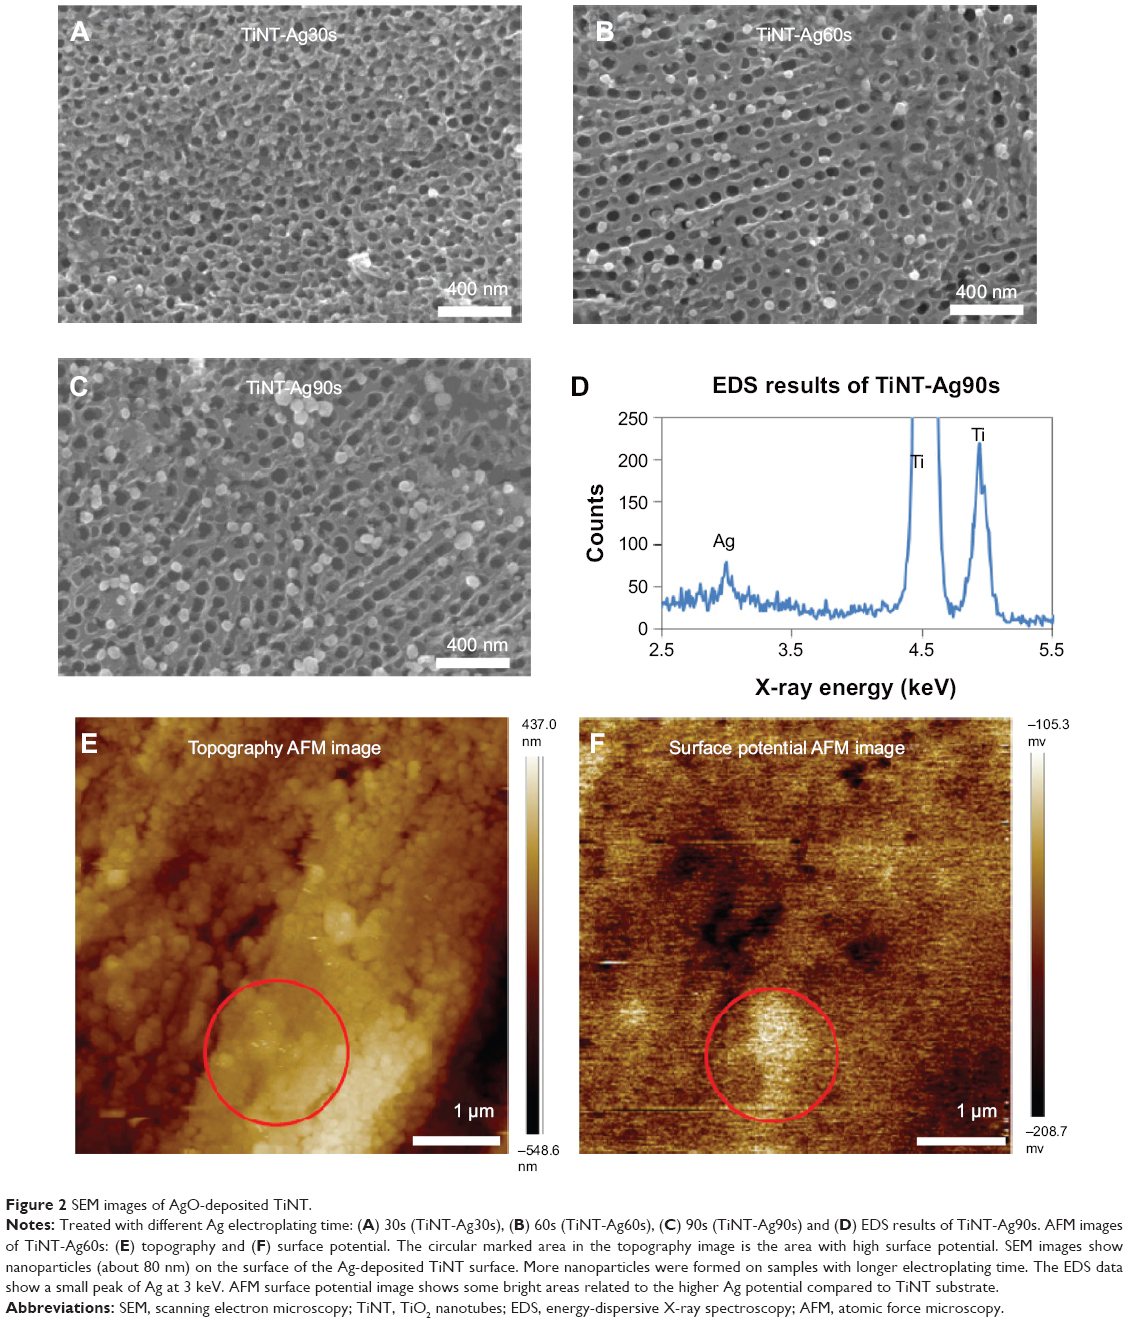 | Figure 2 SEM images of AgO-deposited TiNT. |
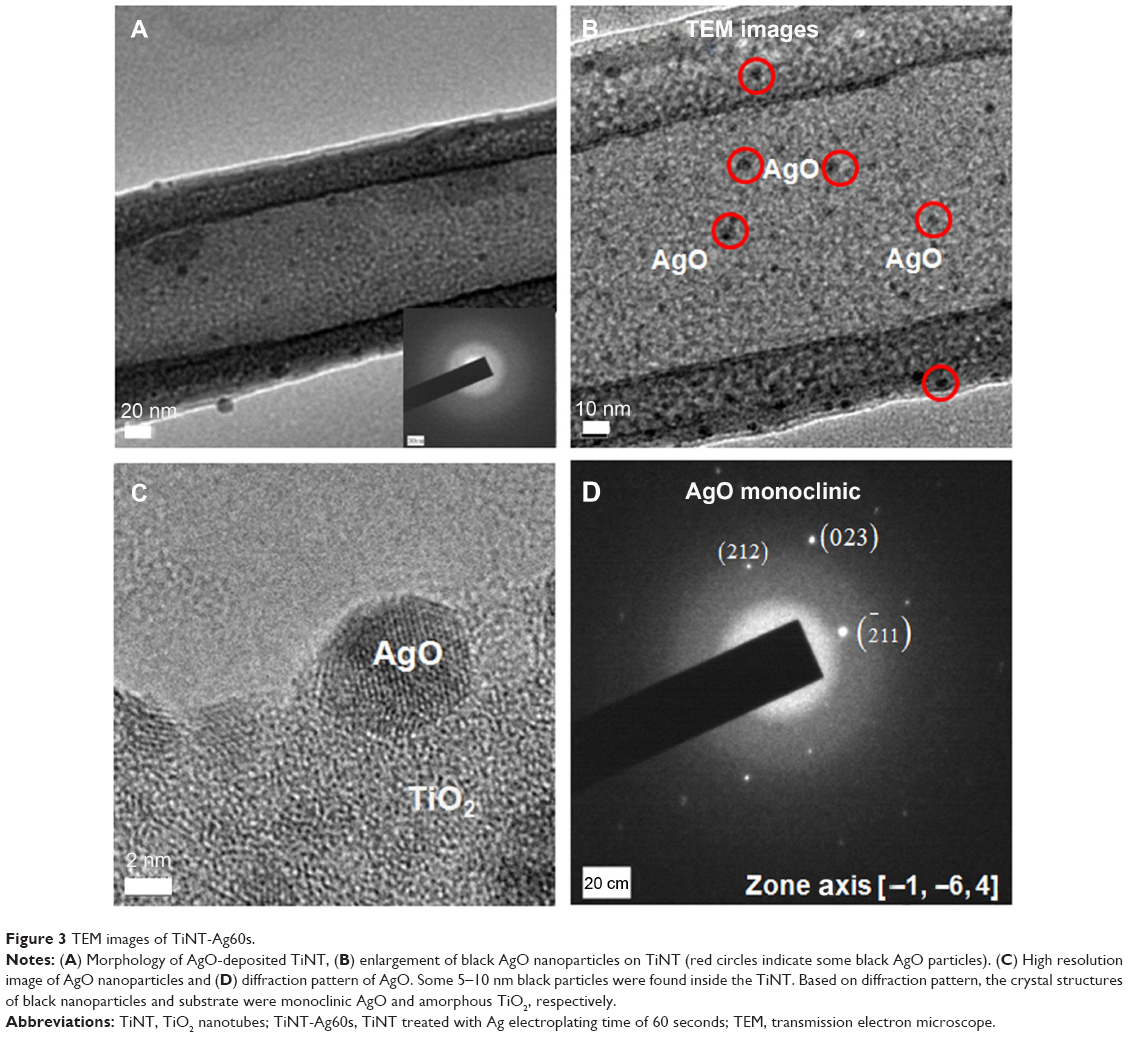 | Figure 3 TEM images of TiNT-Ag60s. |
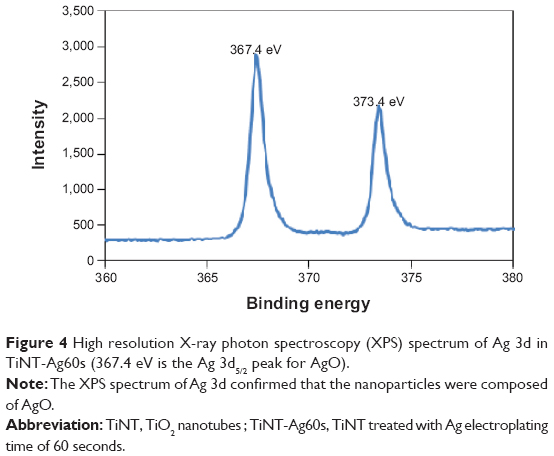 | Figure 4 High resolution X-ray photon spectroscopy (XPS) spectrum of Ag 3d in TiNT-Ag60s (367.4 eV is the Ag 3d5/2 peak for AgO). |
Ag-released test results
Figure 5 shows Ag release from the TiNTs as a function of time in the cell culture medium at 37°C. The total Ag released from TiNT control samples was less than 2 mg/L after 30 days. The released Ag ions from the TiNT control samples were from the residual electrolyte in the TiNTs. The highest cumulative Ag release was less than 7 mg/L after 30 days. The amount of Ag released from the AgO-deposited samples increased with the electroplating time. The basic Ag release mechanism has been described by equation 1 and 2. Ag nanoparticles firstly interact with oxygen to form Ag2O and then Ag2O reacts with hydrogen ions to form Ag+ and water.4,5 In our study, AgO may have followed the similar reaction as equation 2 to form Ag+. With longer Ag depositing time, more Ag was deposited onto the TiNTs. More Ag nanoparticles supplied more surface area for the release of Ag ions. The amount of Ag released from Ag nanoparticles followed an exponential curve, which is described by:36
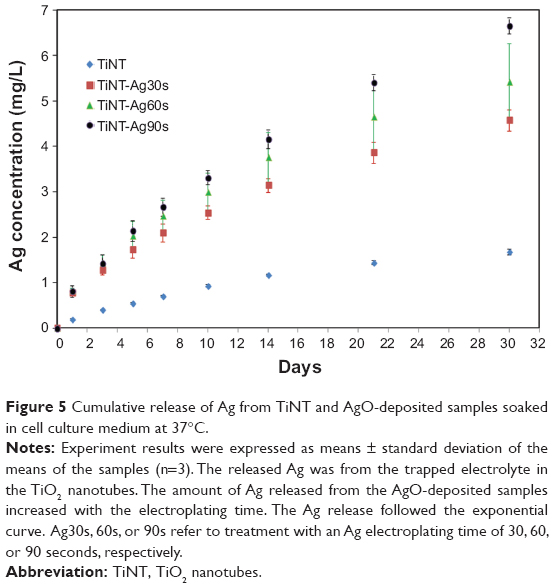 | Figure 5 Cumulative release of Ag from TiNT and AgO-deposited samples soaked in cell culture medium at 37°C. |
| (3) |
Where [Ag]initial is the initial Ag concentration, a is fitting parameter and t is time. In the current work, the release rate of Ag+ decreased in longer release time, which was consistent with the exponential curve.
Cell cytotoxicity test
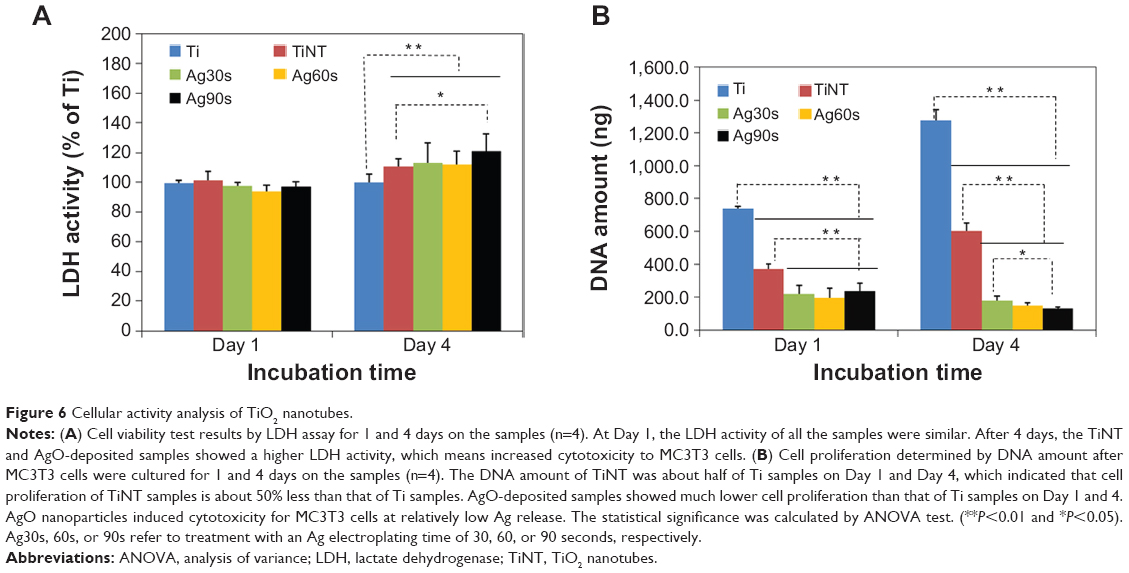
The cytotoxicity of the substrates on MC3T3 osteoblasts was evaluated by LDH assay. As shown in Figure 6A, on Day 1 all the samples show similar LDH activity (P>0.05). After 4 days, all AgO-deposited samples show significantly higher LDH activity than pure Ti samples (P<0.01). Even the TiNT samples showed a higher LDH activity than the Ti specimen. The cytotoxicity caused by TiNT samples is due to the Ag ions trapped in the TiNT during the anodization process. On Day 4, the LDH activities of TiNT-Ag30s and TiNT-Ag60s were a little higher than the TiNT samples. But the difference is statistically insignificant. Only TiNT-Ag90s showed significantly higher LDH activity than TiNT samples.
 | Figure 6 Cellular activity analysis of TiO2 nanotubes. |
Cell proliferation
The amount of DNA released from lysed MC3T3 cells grown on different substrates is shown in Figure 6B. On days 1 and 4, the cell growth on the TiNT samples, as represented by the amount of lysed DNA, was about 50% less than that of Ti control samples. The AgO-deposited samples showed much lower cell proliferation than the Ti control samples. The difference among Ag30s, Ag60s, and Ag90s samples was not significant after 1 day. But on day 4, the cell numbers decreased with the increased Ag electroplating time. The current work showed cytotoxicity for MC3T3 cells apparently due to the relatively high Ag release from the AgO-deposited TiNT samples.
Bacterial test
Figure 7 shows the inhibition zone test results by control Ti, TiNTs and AgO-deposited TiNTs on E. coli bacteria. Ti and TiNT samples did not show any significant inhibition zone, even though it was shown that the TiNT samples released a small amount of Ag+. All of the AgO-deposited TiNT samples showed a clear inhibition zone, which indicated antimicrobial effects of these samples. The diameter of the bacteria inhibition zone was similar for all the AgO-deposited samples. Based on the Ag release in Figure 5, the amount of Ag was about 0.8 mg/L for all AgO-deposited samples on Day 1. Only after 7 days, did samples with longer Ag electroplating times release more Ag into the medium. Although, Ag is a leaching antimicrobial agent, 1 day is not long enough to show the effect of different Ag depositing times. This explains why all the AgO-deposited samples showed similar bacteria inhibition zones.
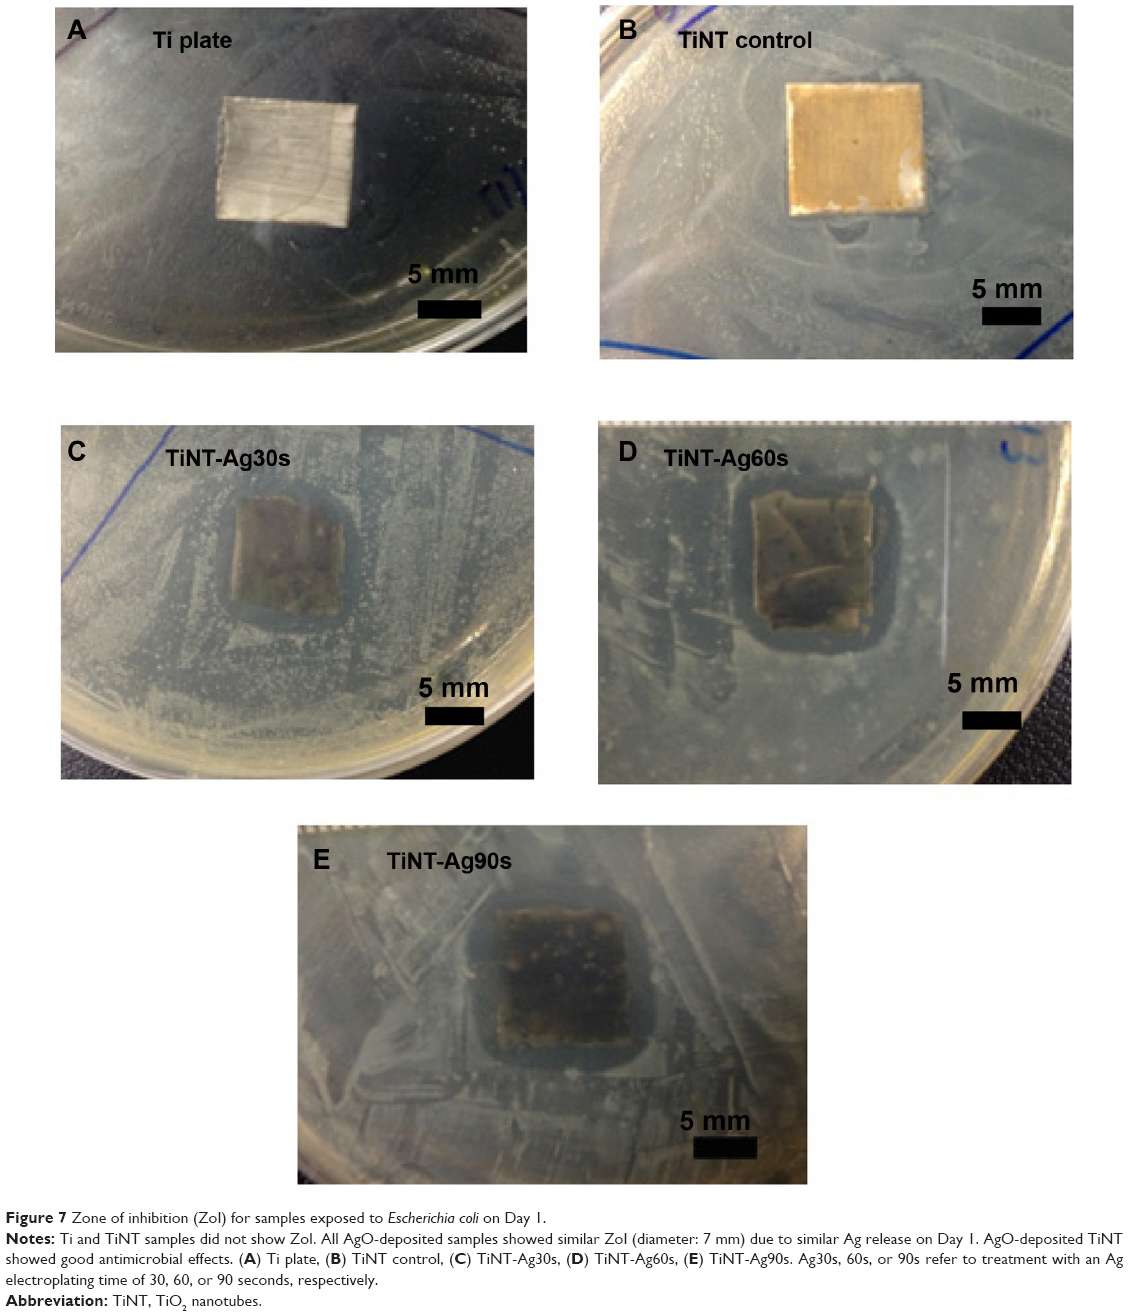 | Figure 7 Zone of inhibition (ZoI) for samples exposed to Escherichia coli on Day 1. |
The antimicrobial effect of AgO nanoparticles was also confirmed by bacteria viability after 7 days incubation. As shown in Figure 8A, large amounts of viable bacteria were found at the surface of the Ti plate (Figure 8B). There were relatively small amounts of live bacteria on the TiNT samples. Due to the residual Ag+ from the electrolyte, the fluorescent images of the TiNT samples show relatively few living cells (Figure 8C) and some dead bacteria (Figure 8D). With the increase of Ag electroplating time, less bacteria were found on AgO-deposited samples. No live bacteria were found on TiNT-Ag60s and TiNT-Ag90s samples. In the present study, the TEM analysis (Figure 3A) indicated that the TiNT substrate had an amorphous structure. The antimicrobial effects of amorphous TiNT is negligible.37 Therefore, the strong antimicrobial effects of AgO-deposited TiNT samples should be attributed to the AgO nanoparticles.
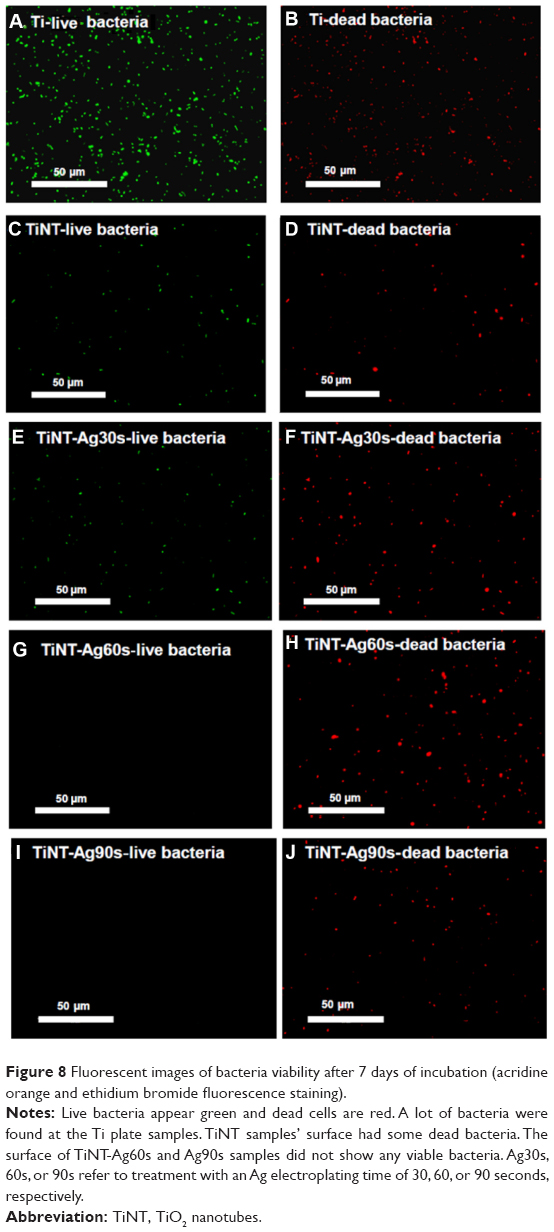 | Figure 8 Fluorescent images of bacteria viability after 7 days of incubation (acridine orange and ethidium bromide fluorescence staining). |
Discussion
In this study, the antimicrobial effects of AgO-deposited TiNTs were shown to be caused by Ag+ release from AgO nanoparticles. Xiu et al5 compared the antimicrobial properties of Ag nanoparticles under aerobic and anaerobic environments. It was found that the quantities of Ag+ released from Ag nanoparticles decreased greatly in an anaerobic environment. Correspondingly, Ag nanoparticles in the anaerobic environment did not induce significant death of E. coli. The antimicrobial behavior comparison of Ag nanoparticles and Ag+ also showed that the bacteria inhibition zones were mainly determined by Ag+ concentration for both Ag nanoparticles and AgNO3 solution.38 Ag ions can interrupt bacteria cellular processes and produce ROS.39 These ROS can increase the permeability of the bacteria membrane, which make the bacteria more susceptible to the antimicrobial agent. The antimicrobial effects of AgO-deposited TiNTs should be mainly attributed to the Ag+ released from AgO nanoparticles. One should note that the species most often associated with infections in orthopedic devices are Staphylococcus aureus and S. epidermidis. Others such as: Acinetobacter baumannii and E. coli are not predominant. Further bacteria testing is needed to better understand the reaction of S. aureus and S. epidermidis to Ag release from our nanotubes.
As shown in Figure 6, AgO-deposited TiNT samples showed cytotoxicity to the MC3T3 osteoblast cells. Even TiNT samples, which only contained about 0.5 mg/L Ag+ on Day 4, showed a 50% reduction of the cell numbers. The cytotoxicity test in the current work demonstrated that MC3T3 cells are sensitive to the Ag+ even at relatively low concentration (~0.5 mg/L). This is in agreement with the in vitro study about Ag-deposited TiNTs where a similarly low Ag+ cytotoxicity concentration was reported.31 In general, it has been suggested that Ag ions are considered to be biocompatible only at relatively low concentrations. For osteoblasts from calvariae of 1–2 day old mice, the cytotoxic concentration of Ag ions was found to be ~5 mg/L.38 For osteoblast cells of a neonatal rat, 2 mg/L Ag+ was still safe.30 The Ag+ cytotoxic concentration for human mesenchymal stem cells and osteoblast cells are about 10 mg/L.40 The present work showed cytotoxic behavior of Ag ions at a lower concentration. While it is not fully clear, several scenarios may contribute to this discrepancy. First, it is known that the use of different cell lines may explain this difference. Second, the cytotoxic concentration greatly depends on the original number of cells. Generally, higher initial cell numbers required more Ag+ to cause cell cytotoxicity. In the present study, the initial seeded cells were exposed to AgO-deposited samples even at the beginning, therefore affecting the first stage of proliferation and differentiation. The true cytotoxicity behavior of our AgO-deposited TiNTs should be studied in vivo. In fact, the in vivo tests of some Ag-TiNTs showed a strong antimicrobial effect without serious cytotoxicity for osteoblast cells even though the in vitro test suggested cytotoxicity of their Ag-deposited TiNTs.31,41 This is possibly related to the large quantities of osteoblast cells available near the implant site. Another scenario would be that Ag nanoparticles could have induced the bone growth by enhancing the mesenchymal stem cells’ differentiation to osteoblast and/or have induced bone remodeling by enhanced osteoblast-osteoclast activity. In in vivo models many factors are involved in bone growth and osseointegration for which the in vitro tests are not sufficient and representative enough to form a conclusive argument on cytotoxicity of Ag. Therefore, it is important to confirm the cytotoxic concentration threshold by in vivo tests in future research.
Ag release from AgO nanoparticles was determined by many factors, especially the particle size. With the reduction of particle size, more surface area is available for AgO to react with water to produce Ag+. Smaller Ag nanoparticles can facilitate fast dissolution and release of Ag+.30,31,38,42 In the present study, two different AgO nanoparticles were fabricated, including 80 nm at the surface and 5–10 nm inside the nanotubes. The small AgO nanoparticles inside the TiNTs could possibly release Ag+ faster and may prevent the patient from infection at an early stage. The large AgO nanoparticles at the surface may supply long-lasting antimicrobial effects, which is a critical issue for biomedical implants. The AgO-deposited TiNTs prepared by electroplating could possibly supply long-term antimicrobial effects. Further experimental work on the release of Ag+ from large AgO particles versus smaller particles would be needed to clarify this conclusion.
To avoid in vitro cell cytotoxicity in the AgO-deposited TiNTs, it is necessary to reduce Ag release. It has been found that 0.2 mg/L Ag+ concentration could effectively kill bacteria.5 It is possible that the bacteria can be killed without inducing cell cytotoxicity at relatively low Ag+ concentration. There may be several methods to reduce the cytotoxicity of AgO-deposited TiNTs. First, the Ag release can be reduced by modifying the Ag electroplating parameters. Another method is to add cell growth factor into the AgO-deposited TiNTs. For example, bone morphogenetic protein-2 (BMP-2) may be coated on TiNTs to improve the growth of osteoblast cells.43–45 More cell growth can increase the cytotoxicity threshold concentration and may reduce cell cytotoxicity induced by Ag ions. Future work will focus on the optimization of the Ag-deposition parameters and incorporation of BMP-2 or other growth factor into the AgO-deposited TiNTs. In vivo testing is necessary to confirm the Ag+ cytotoxic concentration for practical applications of AgO-deposited TiNTs as biomedical implants.
Conclusion
In this study, a novel and simple method was developed to deposit AgO nanoparticles on and in TiNTs by electroplating at constant voltages. The AgO nanoparticles in the TiNTs were mainly composed of 80 nm diameter at the surface and 5–10 nm inside the TiNTs. Bacteria ZoI and viability tests indicated that AgO-deposited TiNTs effectively killed E. coli bacteria. The small AgO nanoparticles can release Ag+ quickly and possibly avoid infection at the initial stage, whereas the larger nanoparticles may supply long-lasting antimicrobial effects. Current work found that the Ag+ cytotoxicity concentration of MC3T3 cells is low and this is related to the initial cell numbers. Although the AgO-deposited TiNTs showed some cell cytotoxicity, this may be reduced by optimization of the Ag electroplating parameters and incorporation of a growth factor. The results of this study indicate that antimicrobial properties can be added to nanotextured medical implants through a simple and cost effective method.
Acknowledgments
This work was financially supported by Michigan Technological University through startup funds and the Multi-Scale Technologies Institute. The help of Emily Shearier during cell culture and proliferation tests is gratefully acknowledged.
Disclosure
The authors report no conflicts of interest in this work.
References
Morones JR, Elechiguerra JL, Camacho A, et al. The bactericidal effect of silver nanoparticles. Nanotechnology. 2005;16(10):2346. | ||
Feng QL, Wu J, Chen GQ, Cui FZ, Kim TN, Kim JO. A mechanistic study of the antibacterial effect of silver ions on Escherichia coli and Staphylococcus aureus. J Biomed Mater Res. 2000;52(4):662–668. | ||
Guo D, Zhu L, Huang Z, et al. Anti-leukemia activity of PVP-coated silver nanoparticles via generation of reactive oxygen species and release of silver ions. Biomaterials. 2013;34(32):7884–7894. | ||
Liu J, Hurt RH. Ion release kinetics and particle persistence in aqueous nano-silver colloids. Environ Sci Technol. 2010;44(6):2169–2175. | ||
Xiu ZM, Zhang QB, Puppala HL, Colvin VL, Alvarez PJ. Negligible particle-specific antibacterial activity of silver nanoparticles. Nano Lett. 2012;12(8):4271–4275. | ||
Carlson C, Hussain SM, Schrand AM, et al. Unique cellular interaction of silver nanoparticles: size-dependent generation of reactive oxygen species. J Phys Chem B. 2008;112(43):13608–13619. | ||
Sotiriou GA, Meyer A, Knijnenburg JTN, Panke S, Pratsinis SE. Quantifying the origin of released Ag+ ions from nanosilver. Langmuir. 2012;28(45):15929–15936. | ||
Chu R, Yan J, Lian S, Wang Y, Yan F, Chen D. Shape-controlled synthesis of nanocrystalline titania at low temperature. Solid State Communications. 2004;130(12):789–792. | ||
Song YY, Schmidt-Stein F, Bauer S, Schmuki P. Amphiphilic TiO2 nanotube arrays: an actively controllable drug delivery system. J Am Chem Soc. 2009;131(12):4230–4232. | ||
Yu W, Zhang Y, Xu L, Sun S, Jiang X, Zhang F. Microarray-based bioinformatics analysis of osteoblasts on TiO2 nanotube layers. Colloids Surf B Biointerfaces. 2012;93:135–142. | ||
Cao X, Yu WQ, Qiu J, Zhao YF, Zhang YL, Zhang FQ. RGD peptide immobilized on TiO2 nanotubes for increased bone marrow stromal cells adhesion and osteogenic gene expression. J Mater Sci Mater Med. 2012;23(2):527–536. | ||
Chen J, Zhou H, Santulli AC, Wong SS. Evaluating Cytotoxicity and Cellular Uptake from the Presence of Variously Processed TiO2 Nanostructured Morphologies. Chem Res Toxicol. 2010;23(5):871–879. | ||
Indira K, Kamachi Mudali U, Rajendran N. Corrosion behavior of electrochemically assembled nanoporous titania for biomedical applications. Ceramics International. 2013;39(2):959–967. | ||
Wang N, Li H, Lu W, et al. Effects of TiO2 nanotubes with different diameters on gene expression and osseointegration of implants in minipigs. Biomaterials. 2011;32(29):6900–6911. | ||
Brammer KS, Oh S, Cobb CJ, Bjursten LM, van der Heyde H, Jin S. Improved bone-forming functionality on diameter-controlled TiO2 nanotube surface. Acta Biomater. 2009;5(8):3215–3223. | ||
Park J, Bauer S, von der Mark K, Schmuki P. Nanosize and vitality: TiO2 nanotube diameter directs cell fate. Nano Lett. 2007;7(6): 1686–1691. | ||
Bauer S, Park J, Faltenbacher J, Berger S, von der Mark K, Schmuki P. Size selective behavior of mesenchymal stem cells on ZrO2 and TiO2 nanotube arrays. Integr Biol (Camb). 2009;1(8–9):525–532. | ||
Oh S, Brammer KS, Li YS, et al. Stem cell fate dictated solely by altered nanotube dimension. Proc Natl Acad Sci U S A. 2009;106(7): 2130–2135. | ||
Roguska A, Belcarz A, Piersiak T, Pisarek M, Ginalska G, Lewandowska M. Evaluation of the Antibacterial Activity of Ag-Loaded TiO2 Nanotubes. European Journal of Inorganic Chemistry. 2012; 2012(32): 5199–5206. | ||
Pisarek M, Roguska A, Kudelski A, Andrzejczuk M, Janik-Czachor M, Kurzydłowski KJ. The role of Ag particles deposited on TiO2 or Al2O3 self-organized nanoporous layers in their behavior as SERS-active and biomedical substrates. Materials Chemistry and Physics. 2013;139(1): 55–65. | ||
Xie K, Sun L, Wang C, et al. Photoelectrocatalytic properties of Ag nanoparticles loaded TiO2 nanotube arrays prepared by pulse current deposition. Electrochimica Acta. 2010;55(24):7211–7218. | ||
Wang Q, Yang X, Liu D, Zhao J. Fabrication, characterization and photocatalytic properties of Ag nanoparticles modified TiO2 NTs. Journal of Alloys and Compounds. 2012;527:106–111. | ||
Wang Q, Yang X, Liu D, Chi L, Hou J. Ag and CdS nanoparticles co-sensitized TiO2 nanotubes for enhancing visible photoelectrochemical performance. Electrochimica Acta. 2012;83:140–145. | ||
Chen K, Feng X, Hu R, et al. Effect of Ag nanoparticle size on the photoelectrochemical properties of Ag decorated TiO2 nanotube arrays. Journal of Alloys and Compounds. 2013;554:72–79. | ||
Chang W-T, Hsueh YC, Huang S-H, Liu K-I, Kei C-C, Perng T-P. Fabrication of Ag-loaded multi-walled TiO2 nanotube arrays and their photocatalytic activity. Journal of Materials Chemistry A. 2013;1(6): 1987–1991. | ||
Sun L, Li J, Wang C, et al. Ultrasound aided photochemical synthesis of Ag loaded TiO2 nanotube arrays to enhance photocatalytic activity. J Hazardous Mater. 2009;171(1–3):1045–1050. | ||
Xiao F. Layer-by-Layer Self-Assembly Construction of Highly Ordered Metal-TiO2 Nanotube Arrays Heterostructures (M/TNTs, M = Au, Ag, Pt) with Tunable Catalytic Activities. Journal of Physical Chemistry C. 2012;116(31):16487–16498. | ||
Xiao F. An efficient layer-by-layer self-assembly of metal-TiO2 nanoring/nanotube heterostructures, M/T-NRNT (M = Au, Ag, Pt), for versatile catalytic applications. Chem Commun (Camb). 2012;48(52): 6538–6540. | ||
Liang YQ, Cui ZD, Zhu SL, Liu Y, Yang XJ. Silver nanoparticles supported on TiO2 nanotubes as active catalysts for ethanol oxidation. Journal of Catalysis. 2011;278(2):276–287. | ||
Chen X, Cai K, Fang J, et al. Dual action antibacterial TiO2 nanotubes incorporated with silver nanoparticles and coated with a quaternary ammonium salt (QAS). Surface and Coatings Technology. 2013;216(0): 158–165. | ||
Zhao L, Wang H, Huo K, et al. Antibacterial nano-structured titania coating incorporated with silver nanoparticles. Biomaterials. 2011;32(24): 5706–5716. | ||
Lai Y, Zhuang H, Xie K, et al. Fabrication of uniform Ag/TiO2 nanotube array structures with enhanced photoelectrochemical performance. New Journal of Chemistry. 2010;34(7):1335–1340. | ||
Wei W, Mao X, Ortiz LA, Sadoway DR. Oriented silver oxide nanostructures synthesized through a template-free electrochemical route. Journal of Materials Chemistry. 2011;21(2):432–438. | ||
Breyfogle BE, Hung CJ, Shumsky MG, Switzer JA. Electrodeposition of Silver (II) Oxide Films. Journal of The Electrochemical Society. 1996;143(9):2741–2746. | ||
Selbin J, Usategui M. Higher oxidation states of silver – I: Reaction of ozone with simple silver salts. Journal of Inorganic and Nuclear Chemistry. 1961;20(1–2):91–99. | ||
Zhang W, Yao Y, Sullivan N, Chen Y. Modeling the Primary Size Effects of Citrate-Coated Silver Nanoparticles on Their Ion Release Kinetics. Environmental Science and Technology. 2011;45(10):4422–4428. | ||
Li H, Cui Q, Feng B, Wang J, Lu X, Weng J. Antibacterial activity of TiO2 nanotubes: influence of crystal phase, morphology and Ag deposition. Applied Surface Science. 2013;284(0):179–183. | ||
Albers CE, Hofstetter W, Siebenrock KA, Landmann R, Klenke FM. In vitro cytotoxicity of silver nanoparticles on osteoblasts and osteoclasts at antibacterial concentrations. Nanotoxicology. 2013;7(1):30–36. | ||
Morones-Ramirez JR, Winkler JA, Spina CS, Collins JJ. Silver Enhances Antibiotic Activity Against Gram-Negative Bacteria. Sci Transl Med. 2013;5(190):190ra181. | ||
Pauksch L, Hartmann S, Rohnke M, et al. Biocompatibility of silver nanoparticles and silver ions in primary human mesenchymal stem cells and osteoblasts. Acta Biomater. 2014;10(1):439–449. | ||
Cheng H, Li Y, Huo K, Gao B, Xiong W. Long-lasting in vivo and in vitro antibacterial ability of nanostructured titania coating incorporated with silver nanoparticles. J Biomed Mater Res A. 2014; 102(10):3488–3499. | ||
Johnston HJ, Hutchison G, Christensen FM, Peters S, Hankin S, Stone V. A review of the in vivo and in vitro toxicity of silver and gold particulates: particle attributes and biological mechanisms responsible for the observed toxicity. Crit Rev Toxicol. 2010;40(4):328–346. | ||
von Wilmowsky C, Bauer S, Roedl S, Neukam FW, Schmuki P, Schlegel KA. The diameter of anodic TiO2 nanotubes affects bone formation and correlates with the bone morphogenetic protein-2 expression in vivo. Clin Oral Implants Res. 2012;23(3):359–366. | ||
Sun SJ, Yu WQ, Zhang YL, Jiang XQ, Zhang FQ. Effects of TiO2 nanotube layers on RAW 264.7 macrophage behaviour and bone morphogenetic protein-2 expression. Cell Prolif. 2013;46(6):685–694. | ||
Lai M, Cai K, Zhao L, Chen X, Hou Y, Yang Z. Surface functionalization of TiO2 nanotubes with bone morphogenetic protein 2 and its synergistic effect on the differentiation of mesenchymal stem cells. Biomacromolecules. 2011;12(4):1097–1105. |
 © 2014 The Author(s). This work is published and licensed by Dove Medical Press Limited. The
full terms of this license are available at https://www.dovepress.com/terms.php
and incorporate the Creative Commons Attribution
- Non Commercial (unported, v3.0) License.
By accessing the work you hereby accept the Terms. Non-commercial uses of the work are permitted
without any further permission from Dove Medical Press Limited, provided the work is properly
attributed. For permission for commercial use of this work, please see paragraphs 4.2 and 5 of our Terms.
© 2014 The Author(s). This work is published and licensed by Dove Medical Press Limited. The
full terms of this license are available at https://www.dovepress.com/terms.php
and incorporate the Creative Commons Attribution
- Non Commercial (unported, v3.0) License.
By accessing the work you hereby accept the Terms. Non-commercial uses of the work are permitted
without any further permission from Dove Medical Press Limited, provided the work is properly
attributed. For permission for commercial use of this work, please see paragraphs 4.2 and 5 of our Terms.