Back to Journals » Clinical Epidemiology » Volume 16
Extracting Systemic Anticancer Treatment Lines from the Danish National Patient Registry for Solid Tumour Patients Treated in the North Denmark Region Between 2009 and 2019
Authors Vesteghem C ![]() , Bøgsted M
, Bøgsted M ![]() , Cronin-Fenton D
, Cronin-Fenton D ![]() , Poulsen LØ
, Poulsen LØ
Received 2 November 2023
Accepted for publication 5 February 2024
Published 6 March 2024 Volume 2024:16 Pages 165—174
DOI https://doi.org/10.2147/CLEP.S442591
Checked for plagiarism Yes
Review by Single anonymous peer review
Peer reviewer comments 2
Editor who approved publication: Professor Irene Petersen
Charles Vesteghem,1,2 Martin Bøgsted,1,2 Deirdre Cronin-Fenton,3 Laurids Østergaard Poulsen2,4
1Center for Clinical Data Science, Aalborg University and Aalborg University Hospital, Aalborg, Denmark; 2Clinical Cancer Research Centre, Aalborg University Hospital, Aalborg, Denmark; 3Department of Clinical Epidemiology, Department of Clinical Medicine, Aarhus University and Aarhus University Hospital, Aarhus, Denmark; 4Department of Oncology, Aalborg University Hospital, Aalborg, Denmark
Correspondence: Charles Vesteghem, Center for Clinical Data Science, Aalborg University and Aalborg University Hospital, Selma Lagerløfs Vej 249, Gistrup, 9260, Denmark, Email [email protected]
Background: Reconstructing patient treatment trajectories is important to generate real-world evidence for epidemiological studies. The Danish National Patient Registry (DNPR) contains information about drug prescriptions and could therefore be used to reconstruct treatment trajectories. We aimed to evaluate and enhance two existing methods to reconstruct systemic anticancer treatment trajectories.
Methods: This study was based on data from 8738 consecutive patients with solid tumors treated in the North Denmark Region between 2009 and 2019. Two approaches found in the literature as well as two new approaches were applied to the DNPR data. All methods relied on time intervals between two consecutive drug administrations to determine if they belonged to the same treatment line. MedOnc, a local dataset from the Department of Oncology, Aalborg University Hospital was used as a reference. To evaluate the performance of each method, F1-scores were calculated after matching the lines identified in both datasets. We used three different matching strategies: stringent matching, loose matching, and matching based on line numbers, controlling for overfitting.
Results: Overall, the two new approaches outperformed the simpler and best performing of the two existing methods, with F1-scores of 0.47 and 0.45 vs 0.44 for stringent matching and 0.84 and 0.83 vs 0.82 for loose matching. Nevertheless, only one of the new methods outperformed the existing simpler method when matching on the number of lines (0.73 vs 0.72). Large differences were seen by cancer site, especially for the stringent and line number matchings. Performances were relatively stable by calendar year.
Conclusion: The high F1-scores for the new methods confirm that they should be generally preferred to reconstruct systemic anticancer treatment trajectories using the DNPR.
Keywords: anticancer treatment, epidemiology, patient trajectory, Danish National Patient Register, treatment line
Background
The Danish National Patient Registry (DNPR) contains administrative data from all hospitals in Denmark. These data can be reliably linked to other Danish datasets using the civil personal registration (CPR) number.1 The DNPR contains information on inpatient, outpatient, and emergency room hospital contacts, including cancer diagnoses and treatments, such as drug-based treatments, surgery, or radiotherapy. This facilitates the generation of real-world data for epidemiological studies in Denmark.2,3
A key aspect in cancer epidemiology is the ability to reconstruct the patient treatment trajectory to evaluate the real-world benefit of such treatments and identify potential long-term side effects of treatments. The primary type of medical treatments for oncology patients are systemic anticancer treatments and include chemotherapy, immunotherapy, and targeted and hormonal therapy. As the DNPR is an administrative repository, its validity for epidemiological studies is of primary importance. Validation studies on the registration of systemic anticancer treatments in the DNPR have been conducted, reporting good overall validity, but have almost exclusively evaluated individual drug registrations.4–6 As such, the question of reconstructing the patient systemic anticancer treatment trajectory in an aggregated manner has not been directly addressed.
The main challenge in this aggregation process is to group individual drug registrations into treatment lines. This is typically done by defining time thresholds between consecutive registrations to determine if they belong to the same treatment line (see Figure 1).
 |
Figure 1 Joining consecutive drug prescriptions into lines. Illustration for joining 5 drug prescriptions into 2 lines based on a unique time threshold. In this example we have used a time threshold (TT) of 45 days, regardless of the type of drug used. The first three drug registrations are less than 45 days apart so are joined in the same line. The time interval between the third and fourth drug prescriptions being more than the time threshold, they are considered as belonging to different lines. The time interval between the fourth and fifth drug prescriptions being less than the time threshold, they are grouped together as the second line. Abbreviation: SACT, systemic anticancer treatment. |
Sørup et al developed two approaches for joining codes into treatment lines based on a time threshold strategy.7
Yet, these approaches have some limitations. The first approach does not consider the codes used, which could be relevant. For example, for the same time interval, two consecutive drug administrations with the same code are more likely to be from the same treatment line than in the case of different codes.
The second approach may not adequately account for certain relatively frequent scenarios. Such scenarios include treatment lines with alternating drugs, detecting a new line for every change in drugs, or when two identical lines are used after a significant amount of time, leading to merging them into one. Furthermore, the methods were only trained and tested on a small cohort (n = 179) and few cancer sites.
The main objective of this work was to optimize and validate in a larger cohort the reconstruction of patient trajectories in terms of systemic anticancer treatment from the DNPR.
Materials and Methods
Data Sources
This study was based on data from the DNPR and the prescription software ARIA OIS for Medical Oncology v13.78 (MedOnc) used at the Department of Oncology, Aalborg University Hospital, including all prescriptions of systemic anticancer treatment drugs between 2009 and 2019.
This validation study included data on all patients diagnosed with solid malignancies between 2009 and 2017(n = 17,100) at Aalborg University Hospital. Among those patients, 8738 were treated with systemic anticancer treatment at the Department of Oncology, Aalborg University Hospital. The treated patients were followed for two additional years until 2019 enabling a suitable follow-up time for patients diagnosed in the later years. The 8362 patients who did not receive systemic anticancer treatment in the 2009–2019 period were excluded.
The diagnosis and treatment information were obtained from the DNPR based on codes following the Danish Health Care Classification System9 (SKS). Diagnoses were mapped to the 10th Edition of the International Classification of Diseases (ICD-10)10 and grouped according to primary tumor location. The primary tumor locations were defined as gastro-esophageal, colorectal, pancreatic, lung, breast, endometrial, ovarian, prostate, urinary, brain, or others (see Supplementary Table 1).
For treatment information, we focused on the SKS codes included in the “Special medical treatments and treatment principles” category (ie, SKS codes starting with “BWH”) and “Treatment with antibodies and immunomodulatory therapy” category (ie, SKS codes starting with “BOHJ”). These treatment codes were mapped to the Anatomical Therapeutic Chemical (ATC) classification11 (see “Mapping SKS procedure codes to ATC” in Supplementary Material and Supplementary Figure 1). Only treatment registrations related to anti-neoplastic agents (ATC codes starting with “L01”) were considered in this study. SKS codes that were not directly relatable to one or a set of ATC codes were considered generic. The high completeness of the mapping was confirmed in a previous study.6 For each treatment line, a list of ATC codes was created based on the corresponding SKS codes. To assess the validity of the registration in the DNPR, the extracted data were compared with the prescriptions found in the MedOnc dataset. This dataset is a direct extract from a prescription solution used by oncologists to define treatment plans. The lines from the MedOnc dataset were identified using the regimen name, consecutive drug prescriptions with the same regimen name were subsequently grouped in one treatment line. To avoid grouping repeated treatment lines as one, a maximum of 180 days was allowed between two drug prescriptions. In rare cases (<1‰), the regimen was not provided, and a limit of 30 days was used to group the prescription with existing treatment lines or create a new one. Patient data were linked across datasets using a patient identifier, an encoded version of the CPR1 number. Not directly using CPR numbers allowed to maintain pseudonymization of the data.
Each treatment line is defined with the patient identifier, a start date, an end date, and a list of ATC codes.
Extracting Treatment Lines
To evaluate the correspondence between the two datasets, we extracted data on treatment lines from the DNPR based on the SKS codes. As data on treatment lines are not specified in the DNPR, we used four categories to define two consecutive systemic anticancer treatment registrations (see Supplementary Table 2):
- “Same drug” if the SKS codes were identical and neither code was generic.
- “Different drugs” if the SKS codes were different and neither code was generic.
- “Same drug class” if at least one of the SKS codes was generic and the SKS codes were directly related (see Figure 2).
- “Different drug classes” if at least one of the SKS codes was generic and the SKS codes were not directly related.
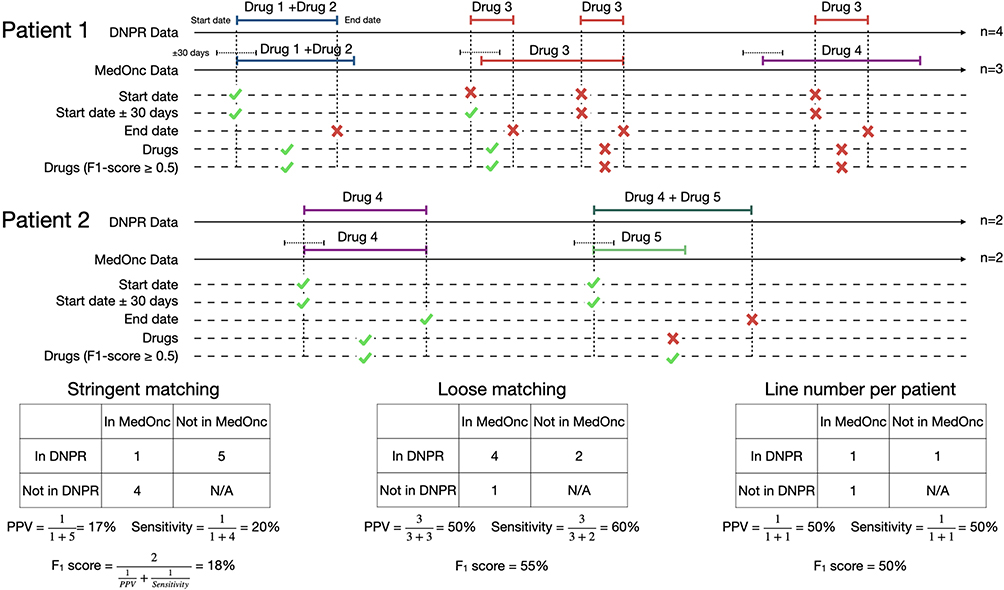 |
Figure 2 Illustration of stringent, loose and line number matchings. In this example, the second treatment for patient 1 using drug 3 as seen in MedOnc is split into two treatments according to the DNPR, leaving the second of these two treatments unmatched. For the stringent matching, only the first treatment for patient 2 with drug 4 is matched. Following the loose matching criteria, treatments 1 and 2 for both patients are matched. The number at the end of each timeline indicates the number of lines identified. The matching on the line number is done at the patient level. Abbreviations: N/A, not applicable; PPV, positive predictive value. |
These categories were used to define four corresponding time thresholds in days (outlined below) to determine if two consecutive registrations belonged to the same systemic anticancer treatment line. These time thresholds can be adjusted separately to evaluate the concordance for different combinations of values. For each identified line, a sorted list of unique ATC codes, excluding generic ATC codes, was generated from the individual systemic anticancer treatment registrations. For each time threshold, the systemic anticancer treatment lines were generated from the DNPR dataset, each line with a patient identifier, a start date, an end date, and a list of ATC codes.
We implemented the two methods proposed by Sørup et al7 using a combination of the thresholds (see Table 1):
- Time-based method: for this simpler method, all thresholds were set to the same adjustable value.
- Drug-based method:
- the “same drug” threshold was set at a high value (100,000 days in practice), ie, two consecutive non-generic systemic anticancer treatment registrations with the same SKS code were considered the same treatment, regardless of the time in between.
- the “different drugs” threshold was set at 0, ie, two consecutive non-generic systemic anticancer treatment registrations with different SKS codes were considered different treatments, regardless of the time in between.
- the “same drug class” and “different drug classes” thresholds were set to the same adjustable value, ie, an adjustable time threshold was used for generic systemic anticancer treatment registrations.
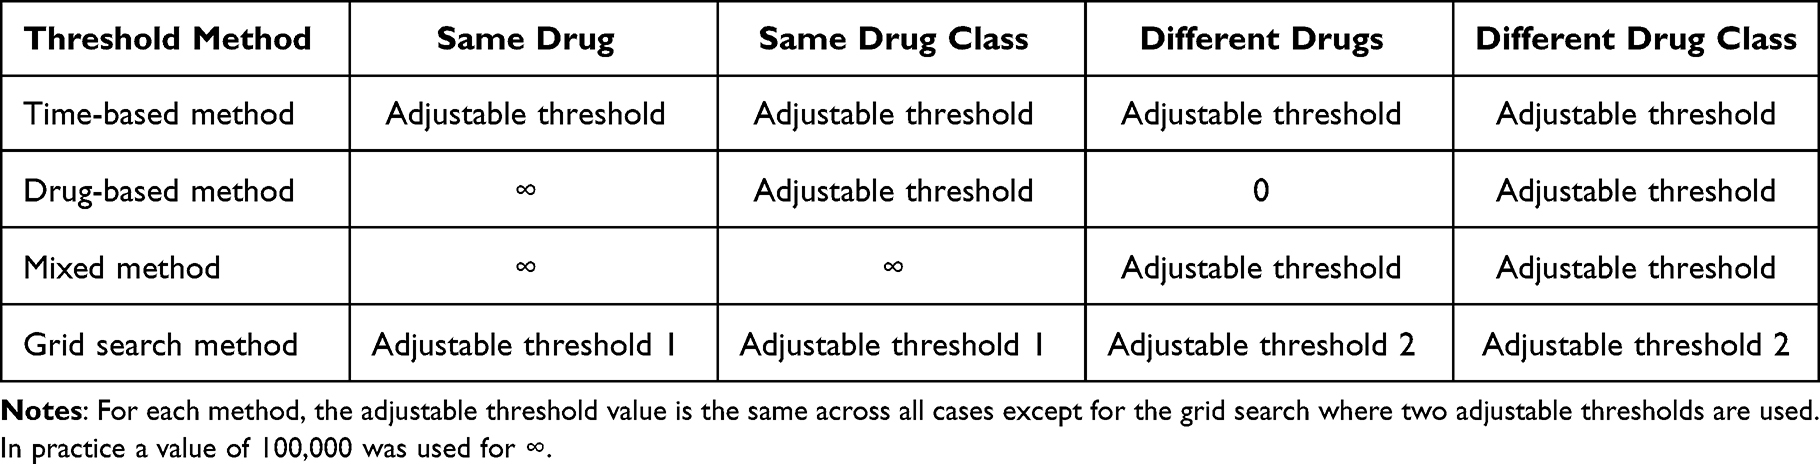 |
Table 1 Threshold Values Used According to Method |
Additionally, we propose two new methods:
- Mixed method:
- the “different drugs” and “different drug classes” thresholds set at an adjustable value.
- the “same drug” and “same drug class” thresholds were set at a high value similar to the drug-based method.
- Grid search method:
- the “different drugs” and “different drug classes” thresholds were set at an adjustable value, referred to as the “different drugs” threshold in the following.
- the “same drug” and “same drug class” thresholds were set at another adjustable value, referred to as the “same drug” threshold in the following.
Pseudocode illustrating the functioning of these methods is presented in Supplementary Figure 2.
For the time-based, drug-based, and proposed mixed methods, the line extraction was performed for values of the threshold between 0 and 360 days.
For the proposed grid search method, a grid search was performed with pairs of values between 0 and 360 days for both thresholds.
In both cases, the search was done using large intervals initially and then reducing the intervals between each probed value around the best value. The intervals used were 90 days, 45 days, 20 days, 10 days, 5 days, 2 days and 1 day. For the non-grid search methods, this meant extracting treatment lines using 0, 90, 180, 270, and 360 days as threshold for the first step. Based on the value with the best accuracy (see below), for example 90 days, the process would be repeated using 0, 45, 90, 135, 180 days and so on. For the grid search, pairs of values were used, ie, for the first step [0, 0], [0, 90], [0, 180] … [360, 270], [360, 360], amounting to 25 pairs in total. Based on the pair of values with the best accuracy, for example [90, 90], the process would be repeated using [0, 0],[0, 45], [0, 90] … [180, 135], [180, 180], ie 25 pairs in total and so on. An example of the results of a grid search are shown in Supplementary Figure 3.
Matching Systemic Anticancer Treatment Lines and Evaluating Concordance
The concordance was evaluated using the F1 score which is the harmonic mean of the positive predictive value (PPV) and the sensitivity.12
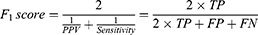
where TP stands for true positives, FP for false positives, and FN for false negatives. The F1 score is a single metric which is impacted by both the false positives and the false negatives in addition to the true positives and therefore can be interpreted as a balanced evaluation of the performance of the model.
The main objective is to be able to reconstruct the patient trajectory in terms of systemic anticancer treatment from the DNPR. Accordingly, the lines from the DNPR and MedOnc datasets were matched following 3 types of matching (see Figure 2):
- Stringent matching: matching on all information available (patient identifier, start date, end date, and ATC codes).
- Loose matching: Matching on the patient identifier, start date with a margin of 30 days and an F1-score for the ATC code matching above 0.5. To calculate this F1-score, a matching ATC code between MedOnc and the DNPR was considered a TP, a code seen only in MedOnc an FN, and a code seen only in the DNPR an FP. This matching approach will be primarily used in the following.
- Line number matching: The number of lines per patient found to generate results comparable to Sørup et al.7
The confidence intervals (CI) were calculated using bootstrapping by resampling the 8738 patients with replacement from the cohort and that 100 times. Replaced patients were given a unique identifier to avoid pooling the corresponding records when calculating the number of lines per patient.
To evaluate potential overfitting from getting the thresholds from the full dataset and using them on this same dataset, we also obtained the optimum thresholds using the data from patients diagnosed between 2009 and 2016 (referred to as training set in the following). We used these thresholds to evaluate the performances on the data from patients diagnosed in 2017 (referred to as test set in the following). These thresholds and performances were compared to the values obtained using only the full dataset.
SAS Enterprise Guide 71 and Python 3.8 in Jupyter notebooks were used for the data management and statistical analyses, respectively.
Approval
This study was approved by the Regional Council of the NDR under the Danish Health Act § 46, sec. 2 with reference number 2022-044174 and registered at the NDR’s research project inventory under the number F2022-186 to comply with Article 30 of the Danish Data Protection Regulation.
Results
Study Population and Drug Prescriptions
Breast, lung, and colorectal cancer patients were overrepresented, constituting 57% of all patients (see Table 2). After breast cancer patients, lung cancer patients were the second largest group (n=3206); 64% of whom received systemic anticancer treatment, often receiving the same regimen (Vinorelbine + Carboplatin, 34% of the lines). Lung cancer therefore had a strong impact on the overall cohort illustrated by their main regimen being also the main regimen for the overall cohort (8%).
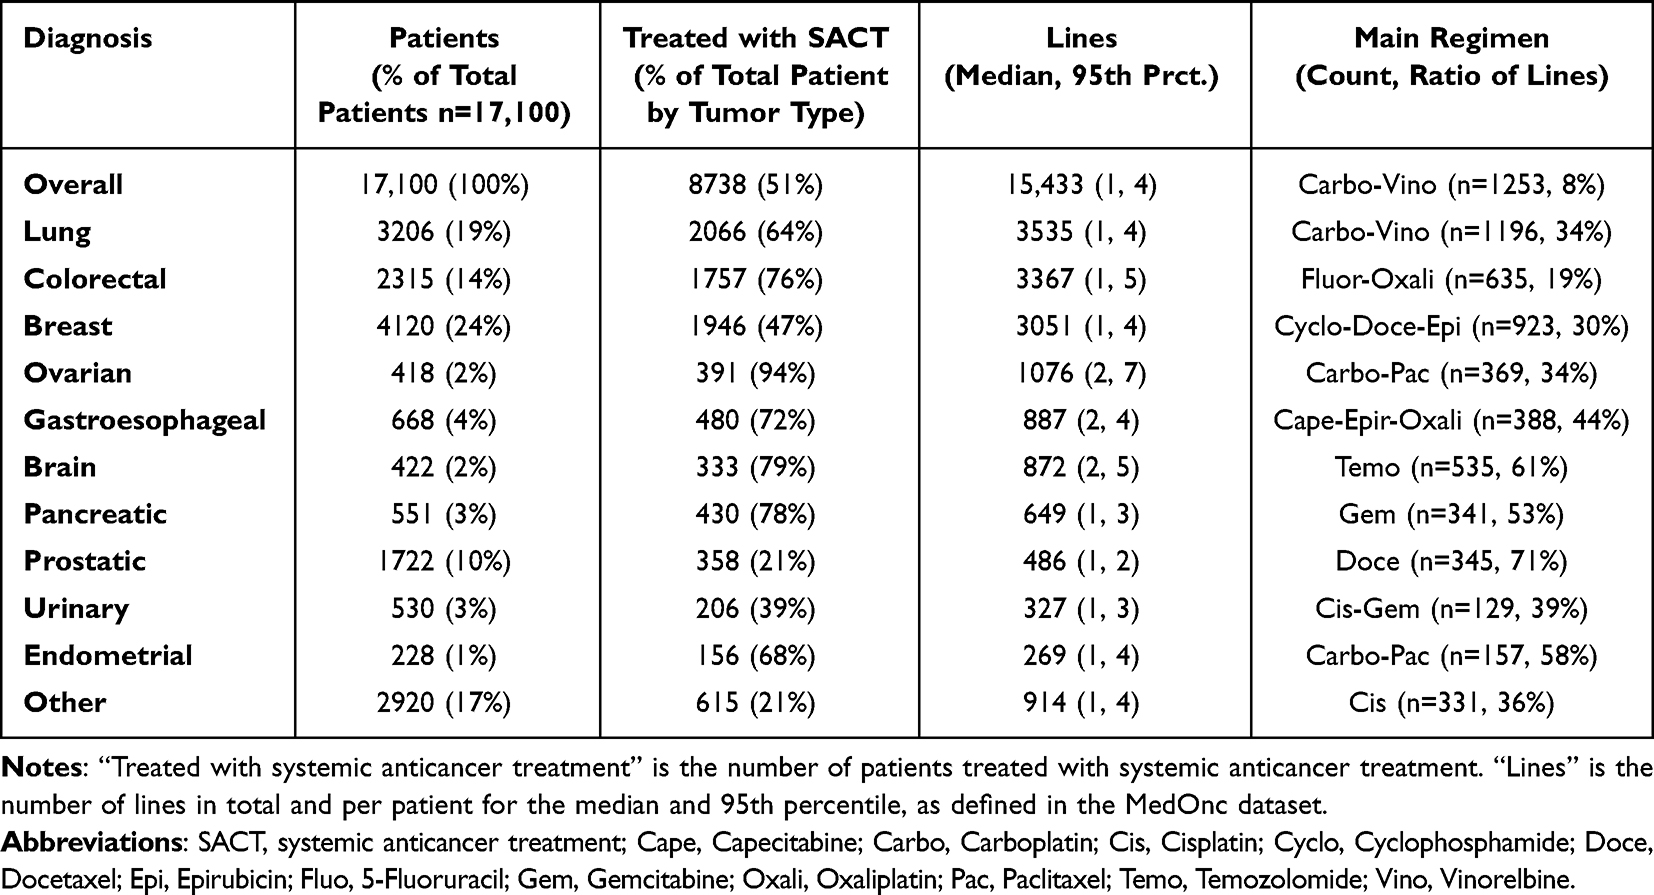 |
Table 2 Description of the Study Population of Patients Diagnosed with Cancer Between 2009 and 2017 in North Denmark Region, and Corresponding Systemic Anticancer Treatment Lines Given at Aalborg University Hospital, Aalborg, Denmark According to the MedOnc Dataset |
Overall Performances and Evaluating Overfitting
The grid search outperformed the other approaches by a few hundredths in terms of F1 score (see Table 3). The drug-based approach had poorer performance than the other approaches with F1 scores around 0.3 below the other approaches. The mixed approach was better than the time-based approach but only by around 0.01 in terms of F1 score except for the line number matching. The optimum threshold for the time-based approach was between 45 and 50 days while it was around 30 days for the mixed approach.
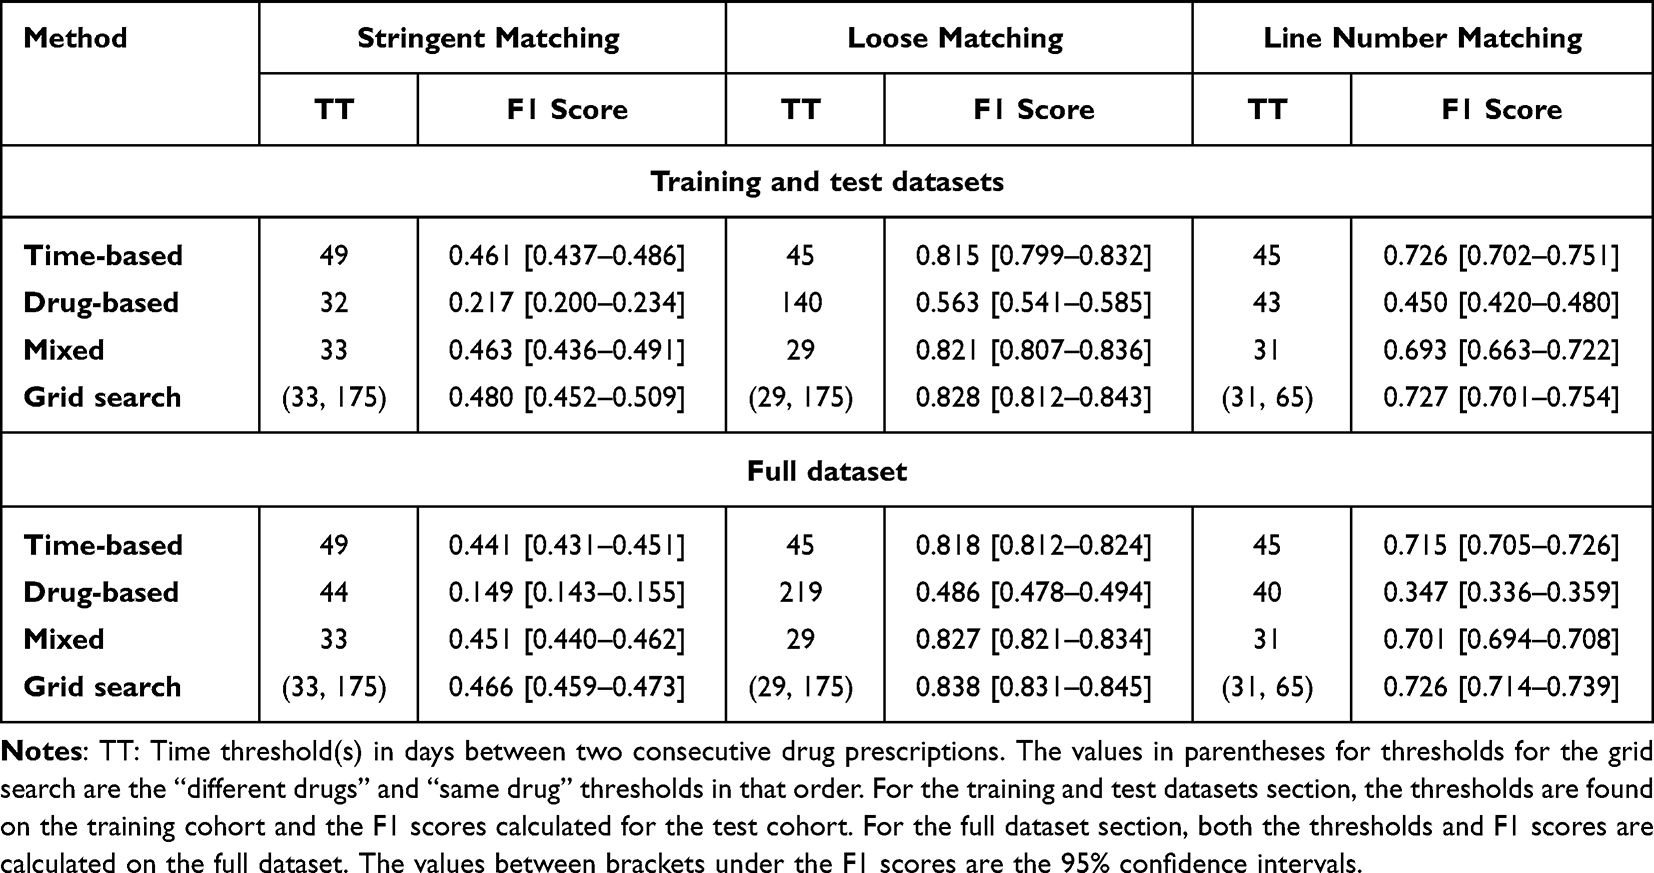 |
Table 3 Optimum Thresholds in Days and F1 Scores for the Different Methods with the 3 Matching Types in a Training/Test Context, in Which the Training Set is Composed of Patients Diagnosed Between 2009 and 2016 and Test Set of Patients Diagnosed in 2017, and with the Full Dataset, ie for Patients Diagnosed Between 2009 and 2017 |
The results for the F1 scores were similar when splitting the data into training and test sets compared with only using the full dataset. The thresholds were identical in both cases, except for the drug-based method which performed poorly. This illustrates the absence of noticeable overfitting when using the same cohort for finding the thresholds and calculating the F1 scores. This simpler strategy, using the same dataset for the thresholds and F1 scores, will be exclusively considered in the following.
Additionally, due to the poor performance of the drug-based approach, the results presented hereafter focus only on the two new approaches and the time-based approach, for comparison.
Additional information about PPV and sensitivity can be found in Supplementary Table 3.
Matching per Diagnosis
When comparing the performances using the loose matching, separating treatments per diagnosis, and using the thresholds found on the whole cohort, some diagnoses had relatively poor performances such as brain and ovarian cancers with F1 scores below 0.75 using the grid search method (see Figure 3). On the contrary, for pancreatic and prostatic cancers, F1 scores were above 0.9 for this same method. The time-based approach also outperformed the proposed methods when using the thresholds found on the whole cohort, notably for gastro-oesophageal cancer. Optimizing the thresholds for each diagnosis improved the performance and allowed the grid search approach to outperform the time-based approach in terms of F1 score in every scenario.
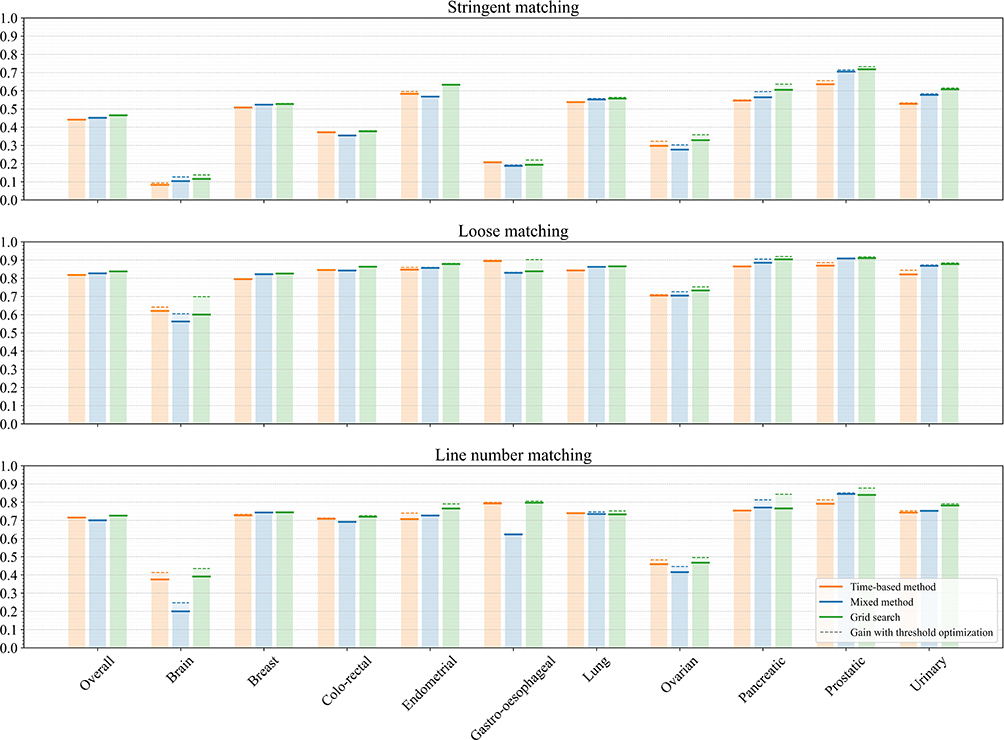 |
Figure 3 Accuracy measured with F1 scores per diagnosis and methods. The dashed line shows the potential benefit in using optimized thresholds for the diagnosis instead of the ones defined in the whole cohort. |
Matching per Year
The performances were relatively stable across the years (see Figure 4). Nevertheless, a modest decrease in recent years can be observed. The proposed two new methods outperformed the time-based approach by few hundredths on average.
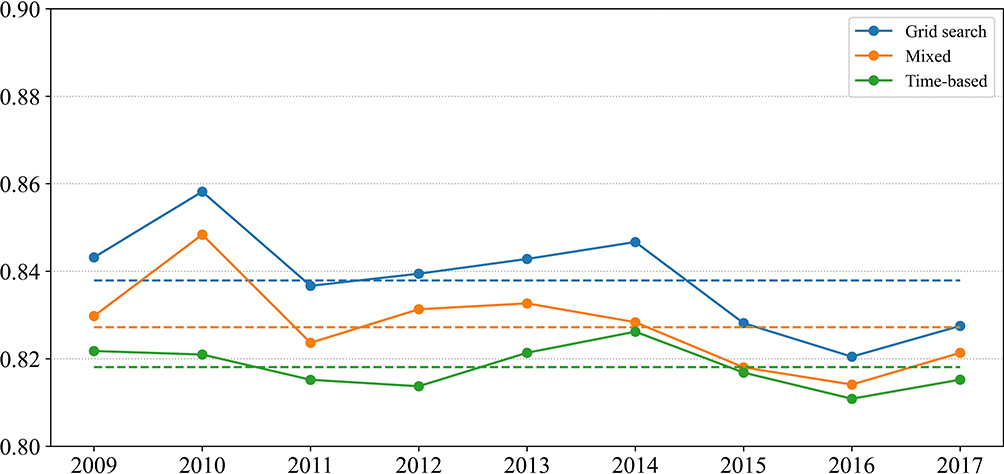 |
Figure 4 Accuracy measured with F1 scores for the loose matching approach over the years. The thresholds used were those identified for the whole cohort, ie, 45 days for the time-based approach, 29 days for the mixed approach, and in the case of the grid search method, 29 days for the “different drugs” threshold and 175 days for the “same drug” threshold. The dashed lines represent the mean value over the whole period. |
Discussion
Main Results
We have proposed two new methods (mixed and grid search) that generally improved upon two methods (drug- and time-based) found in the literature for identifying systemic anticancer treatment lines. The drug-based approach did not perform well in this study. For the identification of the number of lines per patient, the time-based approach was only outperformed by the new grid search approach. The general performance improvements were relatively modest, especially for the mixed method, with an increase in F1 scores close to 0.01. Stringent matching on the start date, end date, and ATC codes led to relatively poor performances with F1 scores below 0.5, but loose matching allowed acceptable performances with F1 scores above 0.8. Large variability could be seen by cancer diagnosis. This was notable for brain and ovarian cancers with poor performances. For brain cancer, previously identified reporting issues could be the reason.6 Concerning ovarian cancer, frequent changes in treatment regimen could explain the poor performance. Indeed, allergic reactions and toxicities which are common in systemic anticancer treatment for ovarian cancer often lead to adjustments in treatment, which could be reported as a new regimen, impacting the accuracy of the matching.
Complexity versus Accuracy
The proposed methods are potentially more complex to implement since they rely on thresholds that depend on the type of successive drugs and are therefore potentially prone to errors and sensitive to coding practices. Therefore, the time-based method could be seen as an acceptable trade-off, generating comparable results with a lower complexity. If accuracy is of primary importance, more complex methods such as the new methods should be recommended since they allow for measurable improvements.
Strengths and Limitations
The main strengths of this study are the long follow-up period, enabling the analysis of trends and the large spectrum of cancer diagnoses. These two aspects allowed us to evaluate the consistency in the data reported in DNPR.
Concerning the generalizability, this work was conducted using data from a single Danish university hospital with potentially some local specificities that could diminish the generalizability of the results, such as the frequency and dose of some regimens. Still, university hospitals in Denmark follow the same procedures, as cancer treatments are primarily administered according to national guidelines. These findings should therefore be generalizable at the national level.
MedOnc has errors such as incorrect regimen names, spelling mistakes in drug names, and prescribed drugs that are not administered due to diminishing performance status of the patient. Some of these errors could be addressed through manual curation. However, this system is used by oncologists to plan and follow the administration of systemic anticancer treatment to cancer patients. The validity should therefore be close to other clinical tools used by clinicians, such as patient journals.
Comparison to Other Studies
Our previous work focused on the validity of individual drug registrations in the DNPR and confirmed its high completeness but did not address specifically the issue of reconstructing patient treatment trajectories.6
The most comparable study was performed by Sørup et al and published in 2022.7 We used the methods proposed by Sørup et al as a benchmark in the current study. For the time-based approach, our results are comparable to those observed by Sørup et al, with the same threshold of 45 days and relatively good performance with F1 scores above 0.8. In contrast, our findings suggest that the drug-based method did not produce accurate results. An explanation could be the presence of treatments using a repeating sequence of different drugs. The drug-based method identifies a new line whenever two consecutive drug registrations differ. A repeating sequence of different drugs leads to the incorrect detection of a very large number of lines, reducing the overall performance.
Conclusions
This study confirms that for a wide variety of primary tumor locations, patient history in terms of systemic anticancer treatment can be extracted from the DNPR, if the precise start date and duration of the treatment is not of primary importance. These findings could be used to conduct epidemiological studies to evaluate long-term side effects of specific anticancer treatments.
Disclosure
The authors report no conflicts of interest with respect to this work.
References
1. Schmidt M, Pedersen L, Sørensen HT. The Danish Civil Registration System as a tool in epidemiology. Eur J Epidemiol. 2014;29(8):541–549. doi:10.1007/s10654-014-9930-3
2. Beck MK, Westergaard D, Jensen AB, Groop L, Brunak S. Temporal order of disease pairs affects subsequent disease trajectories: the case of diabetes and sleep apnea. Biocomputing. 2017;2017:380–389. doi:10.1142/9789813207813_0036
3. Beck MK, Jensen AB, Nielsen AB, et al. Diagnosis trajectories of prior multi-morbidity predict sepsis mortality. Sci Rep. 2016;6(1):1–9. doi:10.1038/srep36624
4. Lund JL, Frøslev T, Deleuran T, et al. Validity of the Danish National Registry of patients for chemotherapy reporting among colorectal cancer patients is high. Clin Epidemiol. 2013;5:327–334. doi:10.2147/CLEP.S49773
5. Broe MO, Jensen PB, Mattsson TO, Pottegård A. Validity of antineoplastic procedure codes in the Danish national patient registry: the case of colorectal cancer. Epidemiology. 2020;31(4):599–603. doi:10.1097/EDE.0000000000001208
6. Vesteghem C, Brøndum RF, Falkmer UG, et al. High validity of the Danish National Patient Registry for Systemic Anticancer Treatment Registration from 2009 to 2019. Clin Epidemiol. 2021;13:1085–1094. doi:10.2147/CLEP.S332776
7. Sørup S, Darvalics B, Knudsen JS, et al. Identifying valid algorithms for number of lines of anti-neoplastic therapy in the Danish National Patient Registry Among Patients with Advanced Ovarian, Gastric, Renal Cell, Urothelial, and Non-Small Cell Lung Cancer Attending a Danish University Hospital. Clin Epidemiol. 2022;14:159–171. doi:10.2147/CLEP.S342238
8. Varian Medical Systems Inc. ARIA OIS for Medical Oncology. Available from: https://www.varian.com/fi/products/software/digital-oncology/oncology-management-systems/aria-ois-medical-oncology.
9. Sundhedsdatastyrelsen. Disease Classification System - SKS (in Danish). Available from: https://sundhedsdatastyrelsen.dk/da/rammer-og-retningslinjer/om-klassifikationer/sks-klassifikationer/klassifikation-sygdomme.
10. World Health Organization. ICD-10 Version: 2016; 2016. Available from: https://icd.who.int/browse10/2016/en.
11. WHO Collaborating Centre for Drug Statistics Methodology. Anatomical Therapeutic Chemical (ATC) classification system. Available from: https://www.whocc.no/atc/structure_and_principles/.
12. Chinchor N. MUC-4 evaluation metrics. In:
 © 2024 The Author(s). This work is published and licensed by Dove Medical Press Limited. The
full terms of this license are available at https://www.dovepress.com/terms
and incorporate the Creative Commons Attribution
- Non Commercial (unported, 3.0) License.
By accessing the work you hereby accept the Terms. Non-commercial uses of the work are permitted
without any further permission from Dove Medical Press Limited, provided the work is properly
attributed. For permission for commercial use of this work, please see paragraphs 4.2 and 5 of our Terms.
© 2024 The Author(s). This work is published and licensed by Dove Medical Press Limited. The
full terms of this license are available at https://www.dovepress.com/terms
and incorporate the Creative Commons Attribution
- Non Commercial (unported, 3.0) License.
By accessing the work you hereby accept the Terms. Non-commercial uses of the work are permitted
without any further permission from Dove Medical Press Limited, provided the work is properly
attributed. For permission for commercial use of this work, please see paragraphs 4.2 and 5 of our Terms.