Back to Journals » Journal of Inflammation Research » Volume 16
Extracellular Vesicle Content Changes Induced by Melatonin Promote Functional Recovery of Pancreatic Beta Cells in Acute Pancreatitis
Authors Shao Y, Wu W, Fan F, Liu H, Ming Y, Liao W, Bai C, Gao Y ![]()
Received 24 August 2023
Accepted for publication 14 November 2023
Published 27 December 2023 Volume 2023:16 Pages 6397—6413
DOI https://doi.org/10.2147/JIR.S430916
Checked for plagiarism Yes
Review by Single anonymous peer review
Peer reviewer comments 3
Editor who approved publication: Professor Ning Quan
Yuming Shao,1 Wenxiang Wu,2 Fangzhou Fan,2 Haifeng Liu,3 Yongliang Ming,2 Wangwei Liao,2 Chunyu Bai,2 Yuhua Gao2
1Institute of Forensic Medicine and Laboratory Medicine, Jining Medical University, Forensic Science Center of Jining Medical University, Jining, Shandong, 272067, People’s Republic of China; 2Precision Medicine Laboratory for Chronic Non-Communicable Diseases of Shandong Province, Institute of Precision Medicine, Jining Medical University, Jining, Shandong, 272067, People’s Republic of China; 3Department of Laboratory Medicine, Affiliated Hospital of Jining Medical University, Jining, Shandong, 272067, People’s Republic of China
Correspondence: Chunyu Bai; Yuhua Gao, No. 133 Hehua Road, Jining, Shandong, 272067, People’s Republic of China, Tel +86-573-3616565, Email [email protected]; [email protected]
Aim: Acute pancreatitis is an inflammatory disorder of the pancreas, which causes abnormal activation of immune cells. The macrophages were accumulated in pancreas and infiltrated into islets during the AP process to induce abnormal glucose metabolism. However, the role of macrophages in abnormal glucose metabolism remains understood. Extracellular vesicles act in the regulation of intercellular function, but whether EVs secreted by macrophages contribute to β cell failure and apoptosis in AP is unclear. Based on this, the aim of this study was to reveal the role of macrophages-EVs in AP and develop a treatment for symptoms of hyperglycemia in AP.
Methods: The AP model was established and treated by various doses of melatonin to analyze the therapeutic effect. The accumulation and polarization of macrophages in the AP pancreas were observed, and the β cells were incubated with pancreatic derived EVs to analyze the role in β cell failure and apoptosis.
Results: The results showed that macrophages were recruited and polarized to M1 phenotype macrophages in the pancreas of AP mice, which obtained inflammatory EVs that contained specific miRNAs to induce β cell failure and apoptosis. Then, the EVs derived from M1 macrophages triggered β cell failure and apoptosis. Melatonin prevented polarization of macrophages to the M1 phenotype in vivo, which reduced the secretion of inflammatory EVs, changed the abundance of miRNAs in EVs, and therefore decreased inflammatory EV-mediated β cell failure and apoptosis.
Conclusion: Our results demonstrate that similar to 20S proteasome inhibitor MG132, analyses indicated that melatonin prevented degradation of IκBα through the ubiquitylation pathway to restrict p50 subunits to the cytoplasm of macrophages, inhibited activation of the NF-κB pathway to downregulate the transcription of specific miRNAs, and reduced miRNA transport into EVs.
Keywords: acute pancreatitis, diabetes mellitus, macrophages, EVs, melatonin
Introduction
Acute pancreatitis (AP) is an inflammatory disorder of the pancreas, digestive enzymes in pancreatic acinar cells are activated prematurely, which leads to auto-digestion of pancreatic acinar tissue and subsequent inflammation in the pancreas. Such inflammation can then spread to the whole body.1 AP has been reported to cause abnormal glucose metabolism,2,3 during AP onset, the monocytes/macrophages are acutely accumulated in the pancreas and infiltrated into islets.4 Pancreatic resident macrophages are plastic cells that adapt their activation state when the niche changes. They are seen as negatively affecting the functions and survival of pancreatic β cell in diabetes mellitus.5 However, the role of macrophages in AP-caused abnormal glucose metabolism remains poorly understood.
Extracellular vesicles (EVs) are nanometer-scale vesicles with a diameter of 50–200 nm and secreted by cells of all types. EVs play an important role in communication between cells, which transport DNA, RNA, lipid and protein that can be transferred into recipient cells to regulate cellular function. Guay et al reported EVs from CD4+ and CD8+ T lymphocytes cause pancreatic cells to fail and apoptosis, which transported miR-142-3p, miR-142-5p, and miR-155 into pancreatic β cells and triggered chemokine expression to cause type 1 diabetes mellitus.6 Meanwhile, macrophages also have been reported to participate in pancreatic β cell fail and apoptosis,4 AP mice have predominantly M1 macrophages during acute inflammation, whereas M2 macrophages repair the damaged pancreas. However, the underlying molecular mechanisms are unknown.
Melatonin is a small neurohormone produced in the mammalian pineal gland, which is a free-radical scavenger and stimulates the activities of several antioxidative enzymes to modulate cerebrovascular, reproductive, visual, neuroendocrine and neuroimmunological activities.7 Lipopolysaccharide (LPS)-activated macrophages produce and release a variety of cytokines to stimulate the acute inflammatory response, which include IFN, IL-1, IL-12, and TNF-α. However, melatonin suppresses production of IL-6, significantly reduces IL-12 production, and decreases TNF-α production in RAW 264.7 cells.8,9 In tissue-resident macrophages, melatonin suppresses the differentiation of intraplaque macrophages toward the proinflammatory M1 phenotype to ameliorate intraplaque inflammation by regulating the AMPKα-STAT pathway downstream of a circadian nuclear receptor retinoid acid receptor‐related orphan receptor-α-dependent signaling pathway.10 These data prompted us to investigate whether melatonin also affects the phenotype of macrophages in the pancreas under AP conditions and changes their EV contents to reduce the influence on recipient cells.
Studies on the pathogenesis of inflammation and abnormal glucose metabolism in acute pancreatitis patients are limited because of the unavailability of human pancreatic tissues. Therefore, animal models, especially the caerulein-induced AP model, have been well used to investigate the pathogenesis of AP. In this study, AP mice and pancreas-resident macrophages were used to investigate the role of melatonin in amelioration of the proinflammatory phenotype of macrophage, changes in macrophage EV contents, improvement of functional recovery of pancreatic β cells, and the molecular mechanisms underlying such processes.
Methods
Animal Model of Acute Pancreatitis (AP)
Six weeks KM mice were purchased from Jinan Pengyue Experimental Animal Breeding Co. Ltd. (Jinan, Shandong Province, China). All animal studies were approved by the Jining Medical University Institutional Review Board’s Animal Welfare Committee and adhered to the institution’s guidelines for animal experimentation (License ID: 2017-JZ-003). All surgery was performed under pentobarbital anesthesia, and all efforts were made to minimize suffering. The AP model was established in accordance with a previous report,4,11 with some improvements. Mice were intraperitoneally injected with caerulein (a cholecystokinin analogue, dosage: 50 mg/g every 1 hour; Shanghai Yuanye Bio-Technology Co., Ltd, HY-A0190), nine times with the last injection consisting of caerulein with LPS (10 mg/kg, Sigma, St Louis, MO, L2630) to establish the AP model.
To assess the AP model, serum amylase was measured using an ELISA kit (Sinogenes Biotech, Beijing, China). The more than or equal to 400 pg per milliliter serum amylase in AP mice were used for subsequent experiments. All tissue and serum of animal model were collected after euthanasia by anesthetic gases.
To analyze the function of melatonin in polarization of macrophage and the effect of their extracellular vesicles on β cell failure and apoptosis during the AP process, melatonin (4, 8, or 12 mg/kg/day) was intraperitoneally injected at 24 hour after the cerulean and LPS injection. Melatonin was dissolved in corn oil and administered at a fixed time once a day. The duration of melatonin administration was until serum amylase returned to normal. The melatonin content in mouse blood was measured with high performance liquid chromatography (HPLC) using an Agilent 1200. A glucose tolerance test was performed during the AP process at various time points after intraperitoneal injection of 2 g glucose/kg body. Peripheral blood was obtained from the tail after 0, 30, 60, 90, and 120 min to determine the blood glucose level using a glucometer (SANNUO Biotech Ltd., China). Non-treatment mice as a normal control.
Isolation and Culture of Pancreatic-Resident Macrophages (PRMs)
Pancreatic-resident macrophages (PRMs) were isolated and sorted from pancreatic tissue through MCAS with antibodies (CD45, CD11b, F4/80, and MHC11, Cell Signaling Technology, Danvers, MA) according to previously described procedure for mouse tissue macrophage isolation.12 The purified PRMs were cultured in H-DMEM (Gibco, USA) supplemented with 10% (v/v) FBS (PAN Biotech, Germany), 100 mg/mL streptomycin, and 100 U/mL penicillin. For M1 polarization of PRMs, LPS (1 μg/mL) and IFN-γ (20 ng/mL) and was added in cell cultures for 48 h. For M2 polarization of PRMs, IL-4 (20 ng/ml) was added to cell cultures for 48 h.
Mouse β Cells Culture and Glucose Tolerance Test
Mouse β cells (Beta-TC-6 cells) were cultured in H-DMEM (supplemented with 10% (v/v)) FBS, 100 mg/mL streptomycin, and 100 U/mL penicillin. To determine whether insulin release from Beta-TC-6 cells was dependent on glucose, we applied two glucose concentrations (2 mM and 20 mM) to stimulate insulin release in accordance with a previous report,13 and then measured insulin content using an ELISA kit (Solarbio, China).
EVs Isolation from Pancreatic Tissue and Macrophages, and Their Characterization
The literature on EVs isolation from tissue was consulted, and valuable enhancements were implemented,14 a qEV original size-exclusion column (Cambridge, MA, USA) was used to isolate EVs from pancreatic tissue. Firstly, 0.1 g of pancreatic tissue was cut into small pieces (1 mm3) and incubated in DMEM for 2 hours, followed by 30 minutes of digestion using 1% collagenase IV at room temperature. The digestion was terminated by DMEM containing 10% EV-depleted FBS to obtain a suspension of tissue. The suspension was centrifuged at 2000 g for 10 min and then filtered through an 80mm mesh sieve, which included EVs derived from the pancreatic tissue. The macrophage and pancreatic supernatant were concentrated with centrifugal filter units (Millipore, Massachusetts, US) by centrifuging at 1500 g for 15 minutes. In a column, the supernatants were added, and 7 to 9 fractions of 0.5 ml were selected and then concentrated in centrifugal filter units (Millipore, Massachusetts, US). As described previously, purified EVs were characterized using electron microscopy, NTA (NanoSight LM10), and immunoblotting.15 Beta-TC-6 cells were incubated for 24 h at 37°C with 10 μg/mL purified EVs to investigate their role in β cell failure and apoptosis.
Microarray Analysis
The Agilent Mouse miRNA (8×60K) array analysis was performed by the National Engineering Center for Biochips (Shanghai, China). All data were analyzed using the SBC Analysis System (online tools for analysis of microarrays, http://sas.ebioservice.com/portal/root/molnet_shbh/index.jsp) to identify differentially expressed genes.16 The significance of differential expression was assessed by the Student’s t-test. Fold changes of ≥2 and a p-value of <0.05 were used as the thresholds. Heat maps were generated using Java TreeView software.
Detection of Reactive Oxygen Species in β Cells
Mitochondrial ROS production in β cells was detected using MitoSox Red (Invitrogen, USA). Intracellular oxidative stress in β cells was analyzed by oxidation of 6-carboxy-2′,7′-dichlorodihydrofluorescein diacetate (DCFH-DA, Invitrogen). For MitoSox Red staining, TC-6 cells were incubated with 5 mM MitoSox Red for 20 minutes in the dark. After the dye was loaded, TC-6 cells were rinsed thrice with D-PBS and examined under a TE-2000-E confocal microscope (Nikon). For flow cytometric analysis of DCFH-DA, TC-6 cells were digested into single cells, resuspended with 10 mM DCFH-DA and incubated at 37°C for 20 minutes in the dark. After incubation, the TC-6 cells were resuspended in fresh growth medium and analyzed by flow cytometry. The fluorescence intensity reflected the level of intracellular ROS.
Immunofluorescence
Macrophages were seeded on glass coverslips, washed three times with PBS, fixed with 4% paraformaldehyde, and then permeabilized with PBS containing 0.25% Triton X-100. TC-6 cells were washed three times, blocked with 10% goat serum, and then incubated with primary antibodies against IκBα (Cell Signaling Technology, L35A5), NF-κB (p50, Abcam, ab14059), and proteasomes (PA28γ, Cell Signaling Technology, 2412) overnight at 4°C. The cells were washed three times with PBS and then incubated with secondary antibodies (IκBα, anti-Mouse-FITC; p50, anti-Chicken-PE; proteasomes, anti-Rabbit-Alexa 647) for 1 h in the dark. Finally, cells were incubated with 1 μg/ml DAPI for 15 min and then washed three times with PBS. Images were acquired under a laser-scanning confocal microscope.
Analysis of Recruited Macrophages in the Pancreas
Pancreatic tissue was obtained from normal, AP mice and melatonin treated with AP mice, sectioned, and then stained with HE for histological analysis. F4/80, a marker of macrophages, was used to mark and count macrophages in the pancreas and islets by immunohistochemistry and immunofluorescence. Positive cells were counted and analyzed using ImageJ/IHC profiler tools.17
Electron Microscopy
To analyze granular ultrastructures, insulin granules were observed by transmission electron microscopy (TEM) after fixation, dehydration, permeabilization and sectioning of β cells collected after various treatments. Images from at least two independent groups and at least three independent different batches for each treatment were recorded. Image J software was used to analyze and quantify images.13
qPCR
MiRNAs were isolated with a miRcute miRNA isolation kit (Tiangen, Beijing, China). cDNA was synthesized using a High Capacity RNA-to-cDNA Kit (Tiangen). Primers for U6, miR-29a-3p, miR-146a-5p, miR-24-3p, miR-21-5p, and miR-25-3p were purchased from Tiangen. qPCR was performed using SYBR PCR Mix (SYBR Green; Tiangen) in a Light Cycler 480 PCR system (Roche, USA). An external control (exosomes, Tiangen) or U6 small nuclear RNA (cells) was used for normalization. Each experiment was performed in duplicate in 96-well plates and repeated three times.
Western Blot
Ubiquitin, IkBα, β-actin, p65, p50, histone H3, Bax, Bcl-2, and cleaved caspase-3 were detected by western blot analysis after various treatments. Cells were lysed using M-PER Protein Extraction Reagent (Beyotime, Beijing, China) containing a protease inhibitor (Beyotime). A nuclear extract was obtained using a Nuclear and Cytoplasmic Protein Extraction Kit (Beyotime). Protein concentrations of the extracts were measured with a BCA assay kit (Beyotime). Equal amounts of proteins were loaded and subjected to SDS-PAGE, followed by transfer onto nitrocellulose membranes (Beyotime). Primary antibodies (Ubiquitin, 1:500; IkBα, 1:500; β-actin, 1:5000; p65, 1:1000; p50, 1:1000; histone H3, 1:5000; Bax, 1:1000; Bcl-2, 1:1500; and cleaved caspase-3, 1:1000) and horseradish peroxidase-coupled secondary antibodies (1:5000) were purchased from Abcam (USA). Membranes were probed using ultra-enhanced chemiluminescence Western blot detection reagents (Beyotime). β-Actin and histone H3 were used as internal controls. Protein abundance was analyzed using ImageJ tools.
TUNEL Analysis
β cells after various treatments were analyzed using a One Step TUNEL Apoptosis Assay Kit (Beyotime) in accordance with a previous report.18 β cells were fixed for 30 min at room temperature and then incubated in permeabilization solution for 5 min at room temperature. Subsequent staining was carried out in accordance with the manufacturer’s instructions. Images were acquired under the laser-scanning confocal microscope. ImageJ software was used to analyze and quantify images.
ChIP-qPCR
ChIP was performed using a ChIP assay kit (Beyotime) with an anti-NF-κB1 antibody (p50, 1:50, Cell Signaling Technology) and anti-IgG (negative control). The DNA obtained from ChIP products was extracted using a DNA purification kit in accordance with the manufacturer’s instructions. The DNA samples were subjected to qPCR amplification with primers that spanned the p50-binding site as follows: miR-146a, F5′GTTGGTCTGGAACCCATAATGCTACCGACGTTGAC3′, R5′ TTAAGGCTGCACGATTTCTGTGAGTTCAAGGTCAT3′. miR-29a, F5′ TGTAAGCCTCGTGCTCACTGTCCCACGTCTGCTCT3′, R5′ CCTAATTTCAGGCGATCCTATGCTGACCTCATCTA3′. miR-25, F5′ ATGACCCTCAAGCCGCCTCCTTCCCTCCTACCAGC3′, R5′ ATTCAAGTCCTAGCCCTCATGGATTCAAGCAGCAA3′. miR-24, F5′ CACATGATGTCCCACAGCACCAGAGGGCTGCCAAAC3′, R5′ TGAGCCTTCTAGCTGTTCCTGAGGACCCACCTTGC3′. miR-21, F5′ AAAACATGTCTCCCTGAAGGCAGTTTAGTCCACAT3′, R5′ TTTGTTAAGTTTCGAGCAGAACATCATATCCACCC3′.
Generation of Eukaryotic Expression Vectors
An miRNA overexpression plasmid was constructed using the backbone of the pcDNA3.1 plasmid by inserting miRNAs arranged in a tandem array. The miRNA sponge was constructed in accordance with a previous report.19 The interrupted palindromic SanDI (Fermentas) restriction site was used to insert miRNA-binding sites for miR-24-3p, miR-25-3p, miR-21-3p, and miR-29a-3p (Table S1).
Statistical Analysis
There was at least three independent experiments performed in triplicate. Results were presented as the mean ± standard error of the mean (SEM). Differences were assessed using Student’s t-test (two groups) or one-way ANOVA (more than two groups) unless noted otherwise. p <0.05 was considered statistically significant.
Results
Melatonin Administration in AP Mice
Amylase levels in serum are important for diagnosing acute pancreatitis. In AP mice, serum amylase was dramatically raised after treatment with cerulein and LPS at different time points, and it returned to normal after 8 weeks when mice were not treated (Figure 1A). To measure pancreatic islet function during the AP process, a glucose tolerance test was performed at various times during the process. AP mice showed an abnormal glycometabolism compared to normal mice, which returned to normal after 6 weeks of non-treatment (Figure 1B).
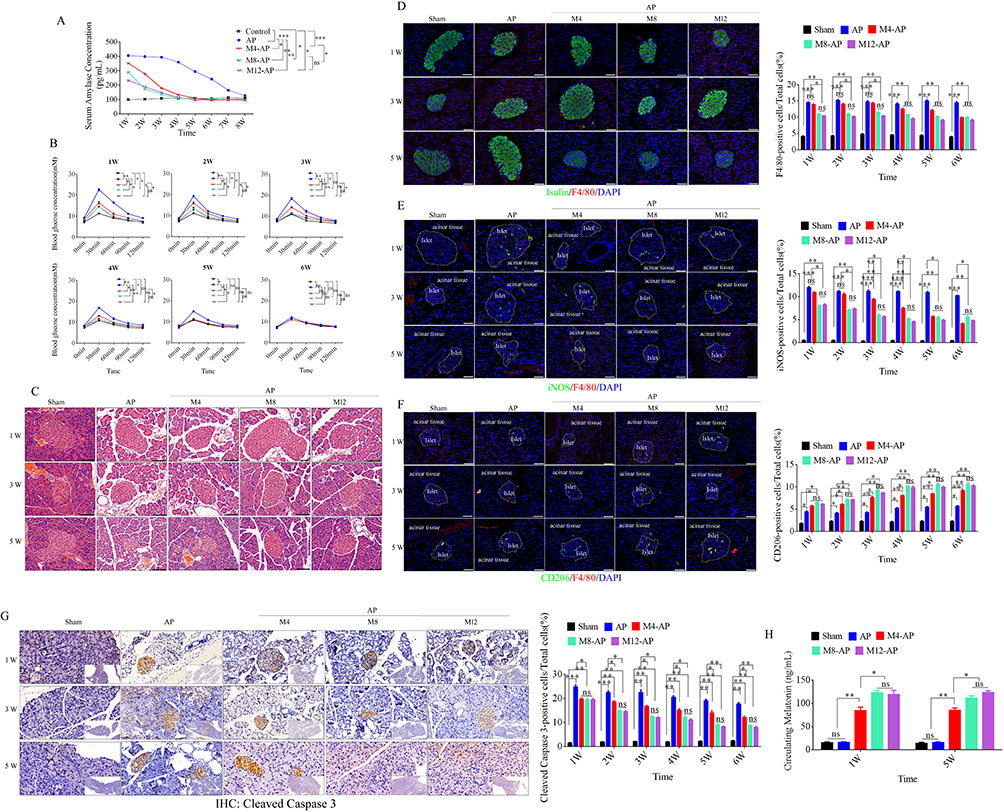 |
Figure 1 Abnormal glucose metabolism, β cell apoptosis, M1 macrophage recruitment, and melatonin administration in AP mice. (A) Measurement of serum amylase in AP mice after treatment with various doses of melatonin. Sera were collected at the various time points listed on the x-axis and serum amylase was measured using an ELISA. (B) Improvement of abnormal glucose metabolism in AP mice by various doses of melatonin. (C) Representative images of histopathological examination of the pancreas in AP mice after various treatments at the various time points. (Scale bar=100 μm) (D) Representative immunofluorescence images of insulin and F4/80-positive cells in the pancreas of variously treated AP mice (left), and quantification of F4/80-positive cells in pancreatic tissue at the various time points after different treatments of AP mice (right). (Scale bar=100 μm) (E and F). Representative immunofluorescence images of iNOS and CD206-positive cells in the pancreas of variously treated AP mice (left), and quantification of iNOS and CD206-positive cells in pancreatic tissue at the various time points after different treatments of AP mice (right). (Scale bar=100 μm) (G) Representative immunohistochemical images of cleaved caspase 3-positive cells in the pancreatic tissue of variously treated AP mice (left), and quantification of cleaved caspase 3-positive cells in pancreatic tissue (right). (Scale bar=50 μm) (H) Quantification of circulating melatonin after melatonin administration at various concentrations. M4 (4 mg/kg/day), M8 (8 mg/kg/day), and M12 (12 mg/kg/day), (n=5). *P < 0.05, **P < 0.01, ***P < 0.001. Abbreviation: ns, not significant. |
Melatonin (4, 8, and 12 mg/kg/day) was injected at 24 h after the last injection of cerulein into AP mice to ameliorate symptoms. Serum amylase was reduced in M8 (8 mg/kg/day) and M12 (12 mg/kg/day) groups relative to M4 (4 mg/kg/day) and non-treatment groups and recovered to the normal level after 4 weeks, except in M4 group (4 mg/kg/day), which returned after 5 weeks (Figure 1A).10 The glucose tolerance test also showed effective improvement in M8 and M12 groups, which recovered to the normal level after 3 weeks, except in the M4 group, which recovered after 4 weeks (Figure 1B). Changes in serum amylase and abnormal glycometabolism are caused by acute inflammation in the pancreas. Next, we examined recruitment and polarization of macrophages and β cell apoptosis in AP mice. Hematoxylin-eosin (HE) staining was used to analyze pathological changes in pancreas at 1, 3, and 5 weeks after treatment. Enlarged cell gaps, an increased volume of the nucleus, obvious vacuoles, and large nuclei pushed out to the cell edge by vacuoles were observed in AP mice, which were accompanied by inflammatory cell infiltrates in the whole pancreas including islets (Figure 1C). Moreover, immunofluorescence was used to observe recruitment and polarization of macrophages with antibodies against F4/80, iNOS, and CD206 and analyze the positive rate and distribution of these markers. F4/80 is a major marker for macrophages, iNOS is marker of M1 macrophages, and CD206 is marker of M2 polarization. Our data revealed that the number of F4/80-positive cells was increased significantly in the pancreatic acinar tissue and islets of AP mice. A mass of monocytes was also recruited from blood and had differentiated into macrophages, but the amount of F4/80-positive cells was significantly decreased in M8 and M12 groups. This effect was observed after 4 weeks in the M4 group (Figure 1D). To further analyze the polarization of these macrophages, iNOS and CD206 were used to assess the polarization types. The results demonstrated that the percentage of iNOS-positive cells was also significantly decreased and CD206-positive cells were dramatically elevated in M8 and M12 groups compared with the M4 group (Figure 1E and F). We next examined β cell apoptosis by immunohistochemistry (IHC) of cleaved caspase 3. Cleaved caspase 3-positive cells were gradually increased during acute inflammation, but they were effectively suppressed in M8 and M12 groups compared with the M4 group (Figure 1G). Next, we measured the level of circulating melatonin by HPLC in sham, AP, M4, M8, and M12 groups at 1 and 5 weeks after treatments. As shown in Figure 1H, the serum levels of melatonin were dramatically elevated after melatonin administration compared with sham and AP groups, and M8 and M12 group had significantly higher levels than the M4 group. Therefore, the M8 group was used for subsequent experiments.
Melatonin Alters Macrophage Polarization and Changes Their EV Contents in AP Mice
Extracellular vesicles (EVs) efficiently deliver their biomolecules to recipient cells and assist in intracellular communication without direct cell-to-cell contact. To illustrate the role of EVs in β cell apoptosis during AP progression, pancreatic tissue EVs were isolated from normal, AP, and melatonin-treated AP (Mel-AP) mice, and applied to β cells to analyze their function and apoptosis (Figure 2A). The results revealed that pancreatic tissue EVs exhibited a round shape with sizes ranging from 50 to 200 nm and contained characteristic EV marker proteins CD63, CD9, and Alix (Figure 2B–E). Interestingly, compared with normal mice, AP mice displayed the largest increase in EV release and the concentration of EV proteins was elevated markedly in AP mice, which were effectively alleviated after melatonin administration (Figure 2B–E) (Figure S1. Whole blot images for Figure 2E). Next, these EVs were labeled with Dil and applied to Beta-TC-6 cells to analyze their function and apoptosis. We observed a decrease in insulin secretion under treatment with 20 mM glucose after incubation with pancreatic tissue EVs from AP mice in a concentration-dependent manner compared with normal and Mel-AP mice (Figure 2F), TUNEL staining also indicated a dramatic elevation in apoptotic cells after incubation with pancreatic tissue EVs from AP mice in a concentration-dependent manner (Figure 2G and H).
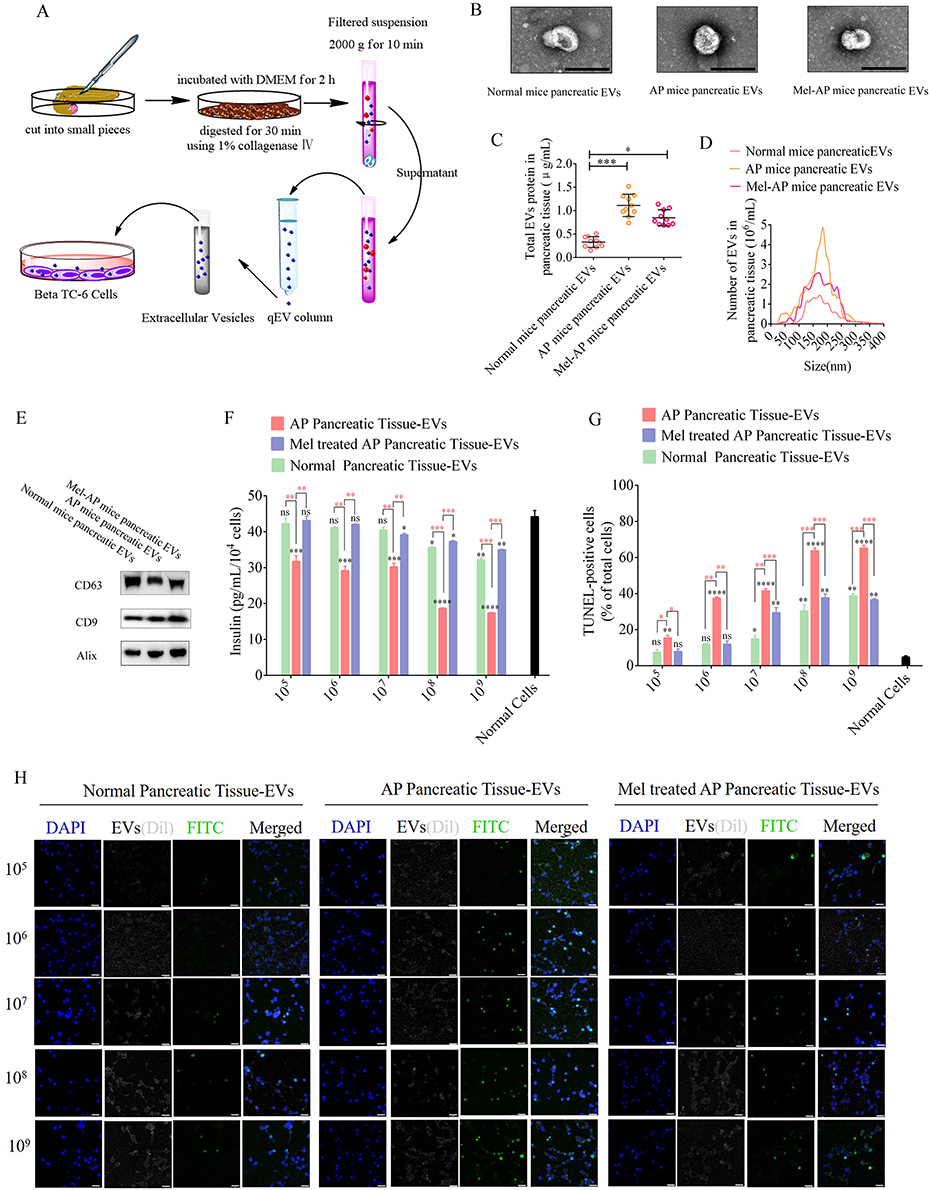 |
Figure 2 Role of EVs derived from different pancreatic tissues in β cell function and apoptosis. (A) Schematic diagram of EV isolation from pancreatic tissue. (B) Representative electron microscopy images of EVs from pancreatic tissue after various treatments. (Scale bar=200 μm) (C) EV protein concentrations in pancreatic tissue from mice after various treatments. (D) Size distributions of EVs from pancreatic tissues. (E) Western blot analysis of EV markers CD63, CD9, and Alix. (F) Analysis of insulin secretion from Beta-TC-6 cells after treatment with various concentrations of EVs derived from pancreatic tissue. The insulin content in culture supernatants of Beta-TC-6 cells incubated with tissue EVs and then treated with 20 mM glucose was measured by an ELISA. (G) Quantification of TUNEL-positive cells in Beta-TC-6 cells after treatment with various concentrations of EVs. (H) Representative fluorescence images of TUNEL staining in Beta-TC-6 cells after treatment with various concentrations of EVs. (Scale bar=100 μm) Black superscript, normal cells vs each group; Tangerine superscript, AP pancreatic tissue EVs vs each group; (n=5). *P < 0.05, **P < 0.01, ***P < 0.001, ****P < 0.0001. Abbreviation: ns, not significant. |
Melatonin is the main chronobiotic hormone that is produced and secreted by the pineal gland, which has diverse functions, including suppressing the differentiation of intraplaque macrophages toward the proinflammatory M1 phenotype. On the basis of a previous report,10 to further determine the role of melatonin in ameliorating symptoms of AP by converting the macrophage phenotype, pancreatic resident macrophages (PRMs) were isolated from normal mice and purified by fluorescence-activated cell sorting. The cells were then treated with LPS and IFN-γ to induce M1 polarization or IL-4 for M2 polarization. Various doses of melatonin were added to M1-polarized PRMs to investigate the phenotype. As a result, optimal suppression of the M1 polarization in PRMs was obtained at melatonin concentrations of 100 and 150 μM, and approximately 40% of M1-polarized PRMs activated by LPS were negative for iNOS after melatonin treatment. These data were consistent with IF results in the pancreas, which showed that melatonin ameliorated inflammation of AP by suppressing the polarization of PRMs toward the proinflammatory M1 phenotype (Figure 3A). However, the molecular mechanisms underlying M1 PRMs promoting apoptosis of β cells and melatonin converting the PRM phenotype were unclear.
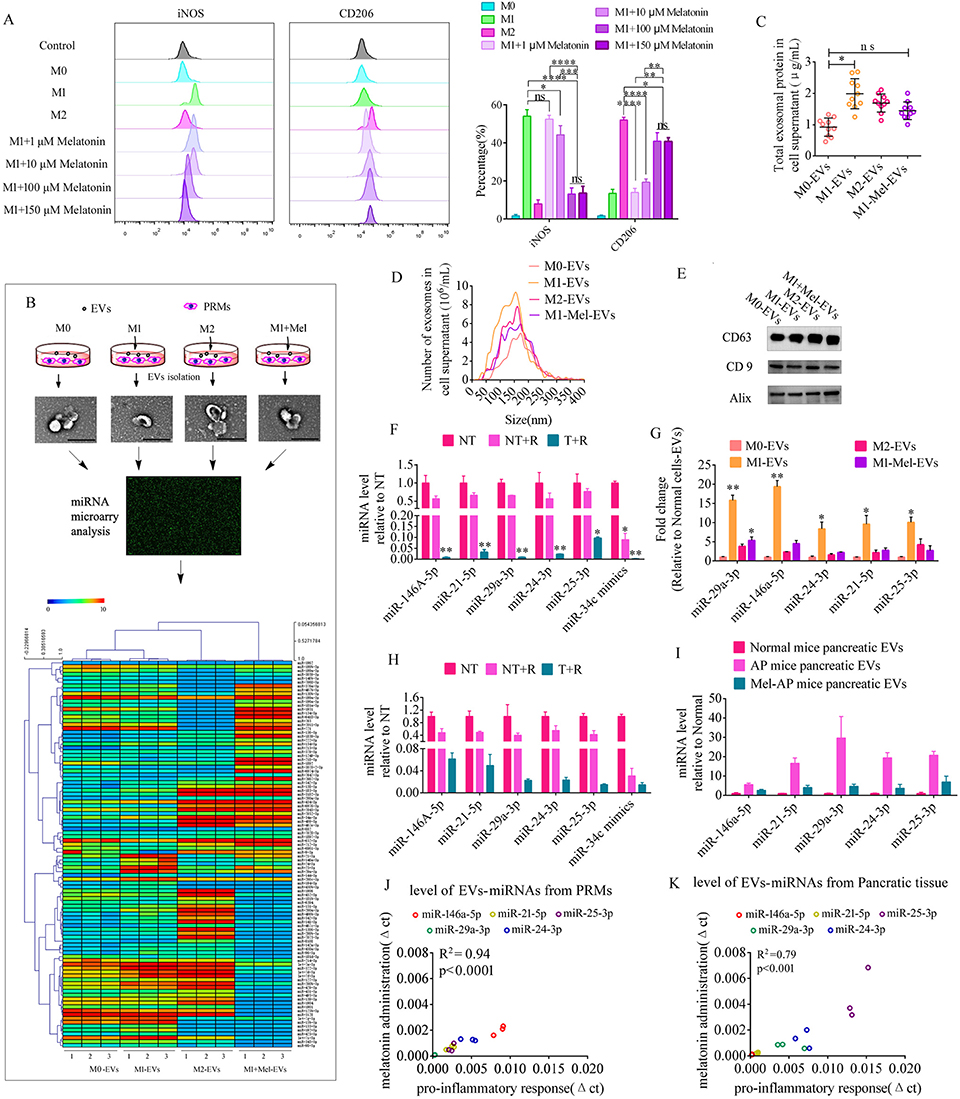 |
Figure 3 Melatonin converts the macrophage phenotype and changes their EV contents. (A) Flow cytometry of M1 (iNOS) and M2 (CD206) macrophage markers in pancreatic resident macrophages after treatment with various doses of melatonin (left) and (right) quantification of the expression levels of iNOS and CD206 in melatonin-treated macrophages (n=3). (B) Schematic diagram of profile analysis of EV miRNAs in PRMs before and after various treatments. (C) EV protein concentrations in PRMs after various treatments. (D) Size distributions of EVs in PRMs. (E) Western blot analysis of EV-markers CD63, CD9, and Alix. (F) Levels of specific miRNAs in EVs from LPS and IFN-γ-treated PRMs (LPS-EVs). MiR-34c mimic was used a positive control for RNase digestion and spiked in the LPS-EV preparation. Samples treated with (T) or without (NT) Triton X-100 were incubated with RNase (R) and then miRNA levels were measured by qPCR and expressed as a percentage of NT (n=3). (G) EV miRNA abundance in cellular supernatants was measured by qPCR and expressed as the fold change versus normal cell EVs (n=3). EVs from PRMs (Normal cell EVs), EVs from LPS and IFN-γ-treated PRMs (LPS-EVs), EVs from IL-4-treated PRMs (IL-4-EVs), and EVs from melatonin and LPS and IFN-γ-treated PRMs (LPS-Mel-EVs). (H) Levels of specific miRNAs in EVs from AP mice. MiR-34c mimic was used a positive control for RNase digestion and spiked in the EV preparation. Samples treated with (T) or without (NT) Triton X-100 were incubated with RNase (R) and then miRNAs levels were measured by qPCR and expressed as a percentage of NT (n=3). (I) EV miRNA abundance in pancreatic tissue was measured by qPCR and expressed as the fold change versus normal mouse pancreatic EVs (n=3). (J and K) Abundances of specific miRNAs in EVs showed positive correlations between before and after LPS treatment of PRMs or pancreatic tissue. These data demonstrated that LPS treatment played an important role in upregulating EV miRNAs. *P < 0.05, **P < 0.01, ***P < 0.001, ****P < 0.0001. |
EVs derived from M1 and M2 phenotype macrophages have significantly different contents and biological roles. EVs secreted by M1 macrophages contain numerous proinflammatory molecules that cause a series of inflammatory responses when received by recipient cells.20 MiRNAs are one of the main components of EVs, and studies have reported that EV-miRNAs play important roles in cellular communication.21,22 Therefore, we collected EVs from PRMs, M1 phenotype PRMs (LPS-treated PRMs), M2 phenotype PRMs (IL-4-treated PRMs), and 100 μM melatonin LPS, and IFN-γ-cotreated PRMs (LPS-Mel) to analyze EV miRNA profiles (Figure 3B) and characterize them. The results were consistent with the data obtained from pancreatic tissue. EV release and the concentration of EV proteins were elevated markedly in M1 phenotype PRMs compared with normal cells. However, EV proteins were decreased significantly after melatonin administration (Figure 3C–E) (Figure S2 Whole blot images for Figure 3E).These EVs were also incubated with Beta-TC-6 cells to analyze their function and apoptosis. The results indicated a decrease of insulin secretion under treatment with 20 mM glucose after treatment with EVs from LPS-treated PRMs in a concentration-dependent manner compared with normal and LPS-Mel PRMs (Figure S3A). TUNEL staining demonstrated a dramatic elevation of apoptotic cells after incubation with EVs from LPS-treated PRMs in a concentration-dependent manner (Figure S3B and C). EVs at 1×10⁸ particles/mL were selected to assess the role of EVs from PRMs in β cell failure and apoptosis.
The miRNA profiles of EVs derived from the variously treated PRMs showed significant changes. We selected about 100 significantly changed miRNAs (P value 1.3-fold) as shown in Figure 3B. The top 10 miRNAs included miR-29a-3p, miR-155-5p, miR-146a-5p, miR-24-3p, miR-25-3p, miR-142a-3p, miR-200b, miR-21-5p, miR-181b-5p, and miR-192-5p. Some of these miRNAs have capacity to induce β cell failure and apoptosis upon ectopic expression, such as miR-146a-5p,23 miR-29a-3p,24 miR-21-5p,23,25 miR-24-3p,26 and miR-25-3p.27,28 Bioinformatics analysis suggested that miR-146a-5p, miR-29a-3p, miR-21-5p, miR-24-3p, and miR-25-3p shared some common target genes (Figure S4 and Table S2). These target genes, which participate in the regulation of cytokines or the NF-κB signaling pathway, are listed in Table S2. Therefore, signaling pathways activated in response to an increase of these miRNAs may potentially converge. First, we determined whether EVs derived from PRMs carried specific miRNAs. EVs from LPS-treated PRMs were treated with Triton X-100 or RNase and then miRNA levels were quantified by qPCR. MiR-34c mimic was used as a positive control for RNase digestion and spiked in the EV preparations. The results revealed significant changes under the different treatments and implied that the EVs carried specific miRNAs (Figure 3F). To verify data from miRNA microarray analysis, the levels of miR-146a-5p, miR-29a-3p, miR-21-5p, miR-24-3p, and miR-25-3p in EVs derived from the variously treated PRMs were analyzed by qPCR. The results demonstrated that these miRNAs were dramatically elevated in EVs after LPS treatment, but the opposite trend was observed in normal and IL-4-treated PRMs. Moreover, the levels of miRNAs were significantly decreased when melatonin was applied to LPS-treated PRMs (Figure 3G). These data prompted us to determine whether melatonin changed the contents of EVs derived from PRMs by affecting the phenotype of macrophages. Next, we determined whether EVs from the pancreas of AP mice carried specific miRNAs, which revealed significant changes under the various treatments (Figure 3H). The EV miRNA level was elevated dramatically in AP mice, but the opposite trend was observed after melatonin treatment in AP mice (Figure 3I). Changes in the miRNA levels of EVs from PRMs and pancreatic tissue showed a positive correlation between proinflammatory response and melatonin-suppressed inflammatory groups (Figure 3J and K).
Roles of EVs in β Cell Failure and Apoptosis During AP Progression
To further investigate the role of EVs derived from PRMs in β cell failure and apoptosis, we isolated EVs from PRMs under the various treatments for incubation with Beta-TC-6 cells (mouse β cells) to analyze their influence. First, EVs derived from the variously treated PRMs were labeled with Dil, and Dil was observed in Beta-TC-6 cells after 48 h (Figure 4A). Meanwhile, to further investigate the role of EVs miRNAs in the failure and apoptosis of Beta-TC-6 cells, miRNAs, including miR-146a-5p, miR-24-3p, miR-25-3p, miR-21-5p, and miR-29a-3p, which were markedly changed in EVs upon phenotypic conversion of PRMs, were selected and their overexpression vector or inhibitors (miRNA sponge for miR-24-3p, miR-25-3p, miR-21-3p and miR-29a-3p, and miR-146-5p inhibitor) combined with the EVs were applied to Beta-TC-6 cells. An important functional feature of pancreatic β cell is their ability to repeatedly undergo glucose tolerance tests. Therefore, we investigated insulin synthesis and glucose tolerance in Beta-TC-6 cells after incubation with EVs derived from the variously treated PRMs. The glucose tolerance test revealed that, when Beta-TC-6 cells were incubated with EVs derived from M0 PRMs, M2 PRMs, melatonin-treated M1 PRMs, or EVs combined with specific miRNAs or inhibitors, they exhibited normal promotion of insulin secretion. However, when the cells were incubated with EVs derived from M1 PRMs or EVs combined with miRNAs, we observed decreased insulin secretion under treatment with 20 mM glucose (Figure 4B).
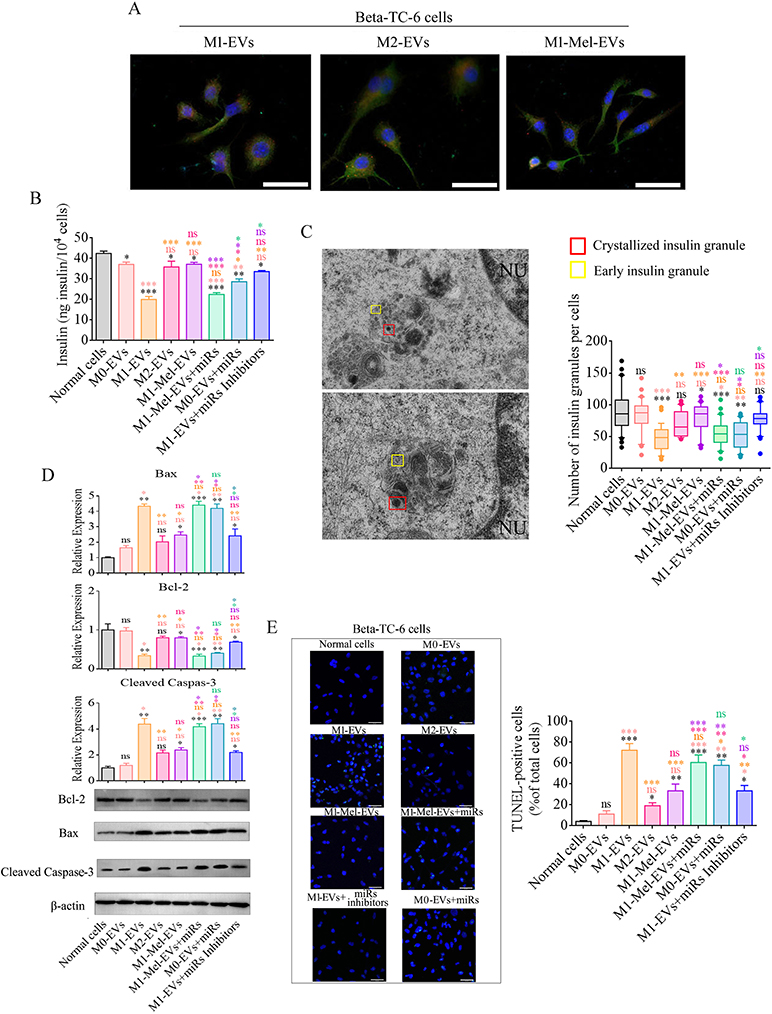 |
Figure 4 Cellular functions and apoptosis of β cells after various treatments. To investigate the roles of EVs and their specific miRNAs in insulin secretion and apoptosis of β cells, glucose tolerance tests and granule analysis of β cells were performed following various treatments and then relative expression of mitochondrial apoptosis pathway genes and the number of apoptotic cells were analyzed. (A) β cells were incubated with various Dil-labeled EVs, and then red EV signals (Dil) were detected by confocal microscopy (scale bar=50 μm). (B) glucose-stimulated insulin secretion of β cells following various EVs incubations (n=10). Insulin secretion of all groups of β cells was decreased by treatment with 20 mM glucose except when the cells were incubated with EVs from normal PRMs, IL-4-treated PRMs, or EVs combined with miRNA inhibitors. (C) Electron microscopy images of granules within sectioned cells highlighting representative crystallized insulin granules (red) and early insulin granules (yellow) in β cells before and after various treatments. Left panel shows Representative electron microscopy images of granules from normal β cells (top image) and LPS-EVs-treated β cells (bottom image). Other electron microscopy images are shown in Figure S11. Right panel shows a box and whisker plot of the number of insulin granules per cell (n=10, Scale bar=1 μm.). (D) Western blot analysis of apoptosis-related proteins in β cells before and after various treatments. Bax and cleaved caspase 3 proteins were significantly upregulated after incubation with EVs from M1 phenotype PRMs or EVs combined with miRNAs. (E) Representative images of TUNEL staining in apoptotic β cells before and after various treatments. These data were consistent with the protein levels of apoptosis-related genes in β cells before and after various treatments. Scale bar=100 μm. Normal β cells, EVs from PRMs (M0-EVs, M0-EVs), EVs from LPS and IFN-γ-treated PRMs (M1-EVs), EVs from IL-4-treated PRMs (M2-EVs), and EVs from melatonin and M1 PRMs (M1-Mel-EVs). MiRs: miR-146a-5p, miR-24-3p, miR-25-3p, miR-21-5p, and miR-29a-3p overexpression. Inhibitors: miRNA sponge and miR-146a inhibitor. Black superscript, Normal cells vs each group; Tangerine superscript, M0-EVs vs each group; Orange superscript, M1-EVs vs each group; Pink superscript, M2-EVs vs each group; Purple superscript, M1-Mel-EVs vs each group; laurel-green superscript, M1-Mel-EVs+miRs vs each group. *P < 0.05, **P < 0.01, ***P < 0.001. |
Insulin is packaged into secretory granules that initially appear as pale gray cores surrounded by a small electron-lucent area or light halo in pancreatic β cells. These condense into granules with dark polygonal crystalline cores surrounded by a light halo.13,29,30 Because Beta-TC-6 cells secreted insulin in a physiological manner after various treatments, we detected insulin granules by transmission electron microscope and analyzed the amount of insulin granules per cell under the various treatment. The amounts of insulin granules in Beta-TC-6 cells treated with EVs derived from M1 PRMs, normal PRMs combined with specific miRNAs, or melatonin-treated M1 phenotype PRMs were markedly decreased compared with those in normal Beta-TC-6 cells. In contrast, the amounts of insulin granules in Beta-TC-6 cells treated with EVs derived from M0 PRMs, M2 PRMs, or M1 PRMs combined with specific miRNA inhibitors showed no significant changes. Moreover, these cells packaged and crystallized insulin protein into granules that were structurally similar to those in normal Beta-TC-6 cells (Figure 4C). When we analyzed the number of insulin granules in Beta-TC-6 cells under transmission electron microscope, we observed nuclear pyknosis, deformation, and apoptotic bodies in Beta-TC-6 cells after treatment with EVs from M1 PRMs (Figure S5). These data suggested Beta-TC-6 cells underwent apoptosis after incubation with EVs derived from M1 PRMs. And then we detected apoptosis-related genes and apoptotic cells by western blotting and TUNEL analysis. We selected and analyzed Bax, Bcl-2, and cleaved caspase-3. Proapoptotic protein Bax acts as an apoptotic activator that induces opening of mitochondrial voltage-dependent anion channels to release cytochrome C and activate caspase-related proteins. Anti-apoptotic protein Bcl-2 restrains apoptosis by binding to Bax. Caspase-3, the main caspase in apoptosis, is activated by proteolytic cleavage and then induces apoptosis. Bcl-2, Bax, and cleaved caspase-3 protein in Beta-TC-6 cells were analyzed after incubation with various EVs. The expression levels of Bax and cleaved caspase-3 were negatively correlated with the data of insulin granules. When cells were incubated with EVs derived from M1 PRMs or normal PRMs combined with specific miRNAs, their protein levels were elevated dramatically. However, the opposite trend was observed in Beta-TC-6 cells incubated with EVs derived from normal PRMs, M2 PRMs, or M1 PRMs combined with specific miRNA inhibitors (Figure 4D) (Figure S6. Whole blot images for Figure 4D) TUNEL is a classical method to detect and analyze DNA damage. To confirm the western blot data, we analyzed TUNEL-positive cells by confocal microscopy. The results were consistent with western blot data. A high positive rate of TUNEL was found in Beta-TC-6 cells incubated with EVs derived from M1 PRMs, melatonin-treated M1 PRMs, or normal PRMs combined with specific miRNAs (Figure 4E). These data implied that EVs from M1 PRMs, which carried specific miRNAs, including miR-146a-5p, miR-24-3p, miR-25-3p, miR-21-5p, and miR-29a-3p, promoted β cell failure and then apoptosis through a mitochondrial apoptotic pathway.
Melatonin Prevents Activation of the NF-κB Pathway to Reduce Transcription of miRNAs in PRMs
The NF-κB pathway is a prototypical proinflammatory signaling pathway that activates transcription of numerous downstream genes with κB-binding sites, most of which are involved in the regulation of inflammation, immune responses, and cell survival.31,32 NF-κB is a dimer of members of the Rel family that consists of a group of five proteins. A heterodimer of NF-κB (p65) and NF-κB1 (p50) subunits, which was the first described NF-κB molecule, is inhibited by IκBα protein in unstimulated cells. p65 and p50 were detected in PRMs after M1 polarization by IF (Figure S7). p50 had almost entered the nucleus, while some p65 remained in the cytoplasm. IκBα is the most prominent IκB family member bound to NF-κB, which restricts it to the cytoplasm and inhibits its activity. Phosphorylation of IκBα by the IKK complex marks IκBα for degradation through an ubiquitin-dependent pathway in the proteasome, which liberates NF-κB to enter the nucleus, bind to DNA, and activate transcription.33 Melatonin has been reported as a proteasome inhibitor in many cell types.34,35 Therefore, we examined its effect on the levels of polyubiquitinated proteins in PRMs by ubiquitin immunoblot analysis. The results showed that, similar to 20S proteasome inhibitor MG132, melatonin treatment of PRMs for 24 h at 100 μM dramatically increased the levels of polyubiquitinated proteins in a dose-dependent manner (Figure 5A), stabilized IκBα protein in the cytoplasm, and reduced p50 and p65 levels in the nucleus. In contrast, degradative protein IκBα in the cytoplasm and higher levels of p50 in the nucleus were observed in M1 PRMs (Figure 5B) (Figure S8. Whole blot images for Figure 5A and B). To further examine whether melatonin blocked IκBα degradation and prevented entry of NF-κB to the nucleus, immunofluorescence was used to analyze the distribution of IκBα, proteasomes, and NF-κB (p50) at 12 h after treatment with 100 μM melatonin or the 20S proteasome inhibitor MG132. Immunofluorescence intensities in the cytoplasm and nuclei were quantified and analyzed by ImageJ software. IκBα was hardly observed in LPS-activated M1 PRMs, which was consistent with rapid proteasome degradation, but it was readily detectable in the cytoplasm in melatonin or MG132-treated M1 phenotype PRMs, most of which were colocalized with the proteasome in the cytoplasm. In M1 PRMs, the majority of the p50 protein was located in the nucleus. However, the opposite trend was observed in melatonin- and MG132-treated groups. p50 protein was significantly increased in the cytoplasm (Figure 5C). Analysis of immunofluorescence intensities revealed that the fraction in the cytoplasm was significantly higher in melatonin- and MG132-treated M1 PRMs than in M1 PRMs. Similarly, the percentage of the p50 signal intensity in the cytoplasm was also elevated (Figure 5D and E). These data implied that melatonin blocked proteasomal degradation of IκBα and consequently prevented the activation of the NF-κB pathway in PRMs.
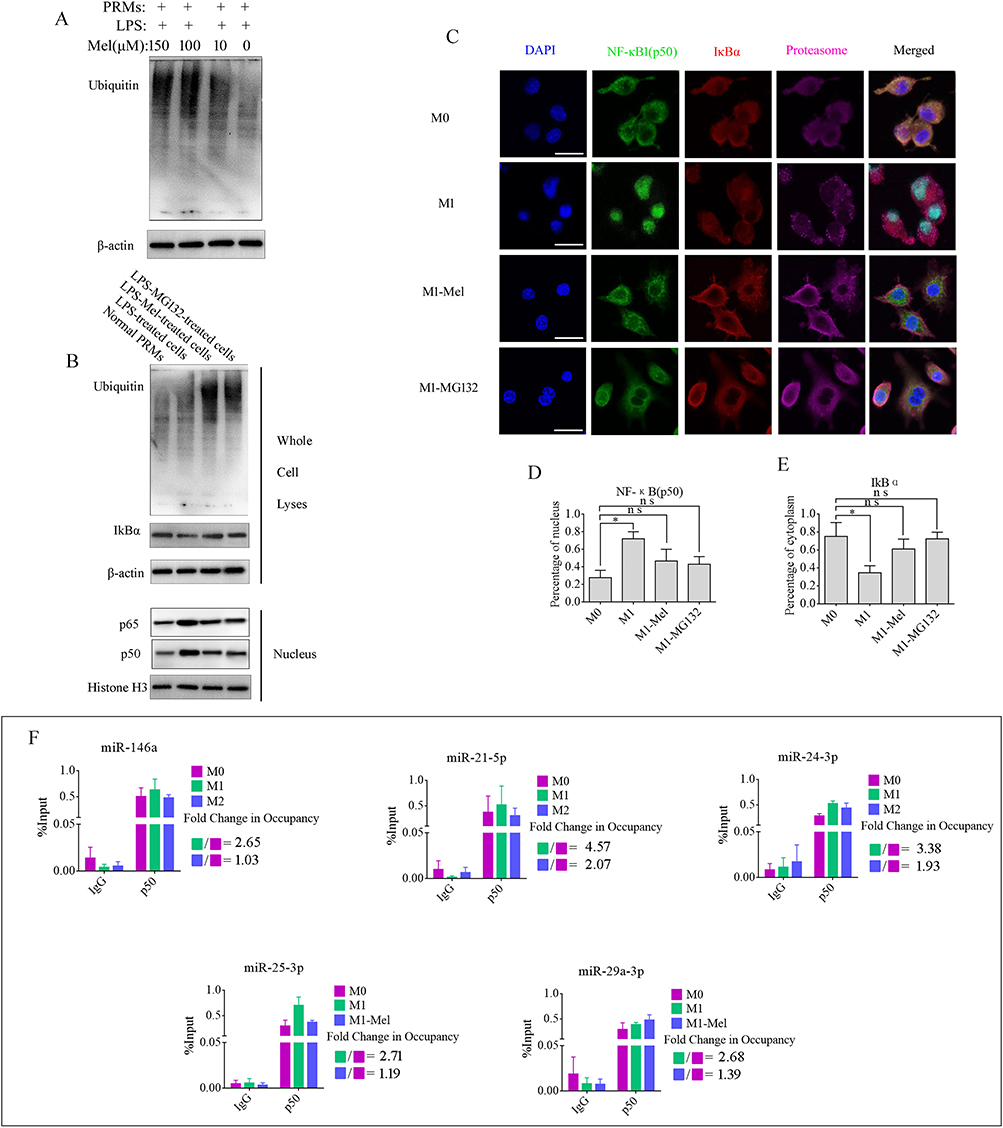 |
Figure 5 Melatonin inhibits ubiquitination of IκBα to prevent entry of NF-κB to the nucleus. (A) Western blot using an anti-ubiquitin antibody showing that melatonin inhibited ubiquitination in M1 phenotype PRMs in a dose-dependent manner. (B) Ubiquitination, accumulation, and expression of IkBα and entry of NF-κB (p50/p65) into the nucleus were confirmed by western blotting. The results demonstrated melatonin, similar to MG132, blocked proteasomal degradation of IκBα and consequently prevented activation of the NF-κB pathway in M1 phenotype PRMs. (C) Immunofluorescence analysis of accumulation and expression of IkBα, NF-κB (p50), and the proteasome in PRMs before and after various treatments. Scale bar=20 μm. (D and E) Ratio of fluorescence in the cytoplasm versus the nucleus was quantified for IκBα and NF-κB1 (p50). *P < 0.05. (F) Amounts of NF-κB1 (p50) enriched within the promoter region of specific miRNAs in variously treated PRMs were quantified by ChIP-coupled real-time PCR. The percentages of input were calculated in accordance with the threshold cycle values. Data are presented as the mean ± SEM of three independent experiments. |
EV contents, including RNAs and proteins, are packaged and transported into EVs in cells. Therefore, the levels of EV miRNAs are influenced and regulated by transcription factors within cells. The NF-κB pathway was activated by LPS and IFN-γ in M1 PRMs. However, melatonin modified activation of the NF-κB pathway through blocking proteasomal degradation of IκBα to prevent entry of p50 into the nucleus. Moreover, the levels of EV miRNAs from these cells were changed significantly. These data prompt us to examine whether p50 bound to the promoter sequence to activate transcription of these miRNA in PRMs. To test this hypothesis, online tools ALGGEN-PROMO (version 8.3)36 and JASPAR (version 7.0)37,38 were used to screen for potential p50-binding sites in the promoter regions of these miRNAs. Interestingly, we found many putative p50-binding motifs within the promoter regions of miR-146a-5p, miR-24-3p, miR-25-3p, miR-21-5p and miR-29a-3p. A schematic diagram of p50-binding sites in promoter regions of miRNAs is shown in Figure S9. To investigate the interactions between these miRNA promoters and p50, PCR primers spanning the p50-binding sites were used to detect the presence of p50 binding within these sites by ChIP-qPCR. Non-specific IgG was used as a negative control and the input sample (whole lysate prior to ChIP) was used as a positive control. The results revealed that the quantities of immunoprecipitated chromatin were dramatically elevated in M1 PRMs compared with normal PRMs, but effectively decreased in melatonin-treated in M1 PRMs. The fold changes in occupancy of these miRNAs under the various treatments are shown in Figure 5F. Taken together, we demonstrated that melatonin ameliorated the glycometabolism in AP mice by preventing M1 phenotype polarization of pancreatic resident macrophages to reduce the abundance of certain miRNAs in their EVs and avert proinflammatory EV-induced apoptosis of β cells. However, melatonin is a well-known free radical scavenger and antioxidant, which has an anti-apoptotic activity. Therefore, 1×10⁸ particles/mL AP-tissue EVs combined with various doses of melatonin were applied to Beta-tc-6 cells to analyze its anti-apoptotic activity. As shown in Figure S10, melatonin effectively reduced apoptosis, but not significantly improved insulin secretion with the increase in melatonin concentration. These results implied that melatonin not only prevented M1 phenotype polarization and converted macrophages to the M2 phenotype but also inhibited apoptosis of pancreatic β cells by removing free radicals as an antioxidant during AP progression.
Discussion
In a number of recent meta-analyses, diabetes mellitus is associated with an increased risk of acute pancreatitis of 37%–92% and a statistically significant 2.7-fold increase in diabetes mellitus risk after an AP episode at 5 years.39,40 There is also abnormal glucose metabolism in the animal model of acute pancreatitis; however, it has been no report describing the molecular mechanisms behind diabetes mellitus after acute pancreatitis. Almost all types of cells naturally secrete EVs, including macrophages,41 dendritic cells,42 mast cells,43 platelets,44 and T lymphocytes.45 M1 macrophages typically produce proinflammatory cytokines to induce β cell dysfunction and death,46 but no report has investigated the role of EVs in this process.
Therefore, we isolated naïve macrophages from the pancreas to polarize to M1 or M2 phenotypes with LPS and IFN-γ or IL-4, respectively, and analyzed changes in the profile of EV miRNAs. Some specific miRNAs, including miR-146a, miR-24-3p, miR-25-3p, miR-21-5p, and miR-29a-3p, which cause pancreatic β cell failure and apoptosis through a mitochondrial pathway, showed significantly changes after phenotypic conversion. Moreover, the miRNA levels in EVs of pancreatic tissue from normal and AP mice were similar to those in EVs of PRMs. Therefore, our current data revealed molecular mechanisms underlying the occurrence of pancreatitis-related diabetes mellitus.
Melatonin is a small neurohormone that has many important physiological functions, including anti-aging, oncostatic, antioxidant, and immunomodulatory functions. Previous reports have shown that melatonin ameliorates intraplaque inflammation by suppressing the differentiation of macrophages toward the proinflammatory M1 phenotype through regulating the AMPKα-STAT pathway in a circadian nuclear receptor retinoid acid receptor-related orphan receptor-α-dependent manner. The NF-κB pathway has been considered as a prototypical proinflammatory signaling pathway that participates in various inflammatory diseases. Melatonin reduces activation of the NF-κB pathway in several cell types and organs, such as T cells, macrophages, neurons, the liver, kidneys, lungs, and heart.47 A previous study demonstrated that melatonin blocks the NF-κB pathway through inhibition of the nuclear translocation and DNA-binding activity of p50 and suppresses STAT1 signaling in LPS-activated RAW 264.7 cells.48 However, there is no report on how to block nuclear translocation and suppress the DNA-binding activity of p50 in macrophages. Melatonin inhibits degradation of IκBα and blocks the translocation of p65/RelA into the nuclei.49 Our data revealed that melatonin blocked proteasomal degradation of IκBα to prevent entry of p50 to the nucleus. IκBα is the most prominent IκB family member bound to NF-κB, which restricts it to the cytoplasm and inhibits its activity. Phosphorylation of IκBα by the IKK complex marks IκBα for degradation through an ubiquitin-dependent pathway in the proteasome, which liberates NF-κB to enter the nucleus and activates the NF-κB pathway. Activation of the NF-κB pathway is involved in polarization of the macrophage M1 phenotype, which plays an important role in production of proinflammatory factors. However, no study has reported how inhibition of the NF-κB pathway influences the change in the macrophage phenotype. In our study, altered macrophage phenotypes were found after melatonin treatment, and other underlying molecular mechanisms need to be further explored in the future. Similar to 20S proteasome inhibitor MG132, melatonin inhibited the NF-κB pathway, and stabilized the proteasome to prevent degradation of IκBα through the ubiquitylation pathway to suppress transcription factors of the NF-κB pathway to the cytoplasm, which downregulated the expression levels of downstream genes. Therefore, melatonin relieved the symptoms of hyperglycemia in AP mice by preventing activation of the NF-κB pathway to inhibit transcription of specific miRNAs in macrophages and then reduce their transportation into EVs.
In conclusion, we examined the pathogenesis of abnormal glucose metabolism in AP mouse model. Our data revealed that macrophages were recruited, polarized to the M1 phenotype, infiltrated into islets, and secreted the inflammatory EVs containing specific miRNAs to induce β cells failure and apoptosis through a mitochondrial pathway. Similar to 20S proteasome inhibitor MG132, melatonin, prevented the degradation of IκBα through the ubiquitylation pathway to restrict p50 subunits to the cytoplasm in macrophages, inhibited activation of the NF-κB pathway to downregulate transcription of specific miRNAs, and reduced transport of these miRNAs into EVs.
Data Sharing Statement
The original data in the study are included in the article/Supplementary Material, and further inquiries can be directed to the corresponding author.
Author Contributions
All authors have made significant contributions to the reported work, including contributions to the conception, study design, data acquisition, analysis, interpretation, and execution or in all these aspects. They have been involved in drafting, revising, and critically reviewing the manuscript. All authors have provided their final approval for the version to be published; have reached an agreement on the journal to which the article has been submitted; and have committed to being accountable for all aspects of the work.
Funding
This research was supported by the National Natural Science Foundation of China (Grant No. 31972755), Shandong Provincial Natural Science Foundation, China (Grant No. ZR2020KH031), Project of Shandong Province Higher Educational Youth Innovation Science and Technology Program (2019KJK010), Research Fund for Academician Lin He New Medicine (JYHL2022ZD05).
Disclosure
The authors declare that they have no competing interests.
References
1. Norberg KJ, Nania S, Li X, et al.. RCAN1 is a marker of oxidative stress, induced in acute pancreatitis. Pancreatology. 2018;18(7):734–741. doi:10.1016/j.pan.2018.08.005
2. Pendharkar SA, Mathew J, Petrov MS. Age- and sex-specific prevalence of diabetes associated with diseases of the exocrine pancreas: a population-based study. Dig Liver Dis. 2017;49(5):540–544. doi:10.1016/j.dld.2016.12.010
3. Tu J, Zhang J, Ke L, et al.. Endocrine and exocrine pancreatic insufficiency after acute pancreatitis: long-term follow-up study. BMC Gastroenterol. 2017;17(1):114. doi:10.1186/s12876-017-0663-0
4. Wu J, Zhang L, Shi J, et al.. Macrophage phenotypic switch orchestrates the inflammation and repair/regeneration following acute pancreatitis injury. EBioMedicine. 2020;58:102920. doi:10.1016/j.ebiom.2020.102920
5. Van Gassen N, Staels W, Van Overmeire E, et al.. Concise Review: macrophages: versatile Gatekeepers During Pancreatic beta-Cell Development, Injury, and Regeneration. Stem Cells Transl Med. 2015;4(6):555–563. doi:10.5966/sctm.2014-0272
6. Guay C, Kruit JK, Rome S, et al.. Lymphocyte-Derived Exosomal MicroRNAs Promote Pancreatic beta Cell Death and May Contribute to Type 1 Diabetes Development. Cell Metab. 2019;29(2):348–61 e6. doi:10.1016/j.cmet.2018.09.011
7. Bai C, Li X, Gao Y, et al.. Melatonin improves reprogramming efficiency and proliferation of bovine-induced pluripotent stem cells. J Pineal Res. 2016;61(2):154–167. doi:10.1111/jpi.12334
8. Cordeiro Caillot AR, de Lacerda Bezerra I, Palhares L, Santana-Filho AP, Chavante SF, Sassaki GL. Structural characterization of blackberry wine polysaccharides and immunomodulatory effects on LPS-activated RAW 264.7 macrophages. Food Chem. 2018;257:143–149. doi:10.1016/j.foodchem.2018.02.122
9. Gao Y, Chen X, Fang L, et al.. Rhein exerts pro- and anti-inflammatory actions by targeting IKKbeta inhibition in LPS-activated macrophages. Free Radic Biol Med. 2014;72:104–112. doi:10.1016/j.freeradbiomed.2014.04.001
10. Ding S, Lin N, Sheng X, et al.. Melatonin stabilizes rupture-prone vulnerable plaques via regulating macrophage polarization in a nuclear circadian receptor RORalpha-dependent manner. J Pineal Res. 2019;67(2):e12581. doi:10.1111/jpi.12581
11. Sakaguchi Y, Inaba M, Kusafuka K, Okazaki K, Ikehara S. Establishment of animal models for three types of pancreatitis and analyses of regeneration mechanisms. Pancreas. 2006;33(4):371–381. doi:10.1097/01.mpa.0000236734.39241.99
12. Alonso-Herranz L, Porcuna J, Ricote M. Isolation and Purification of Tissue Resident Macrophages for the Analysis of Nuclear Receptor Activity. Methods Mol Biol. 2019;1951:59–73. doi:10.1007/978-1-4939-9130-3_5
13. Pagliuca FW, Millman JR, Gurtler M, et al. Generation of functional human pancreatic beta cells in vitro. Cell. 2014;159(2):428–439. doi:10.1016/j.cell.2014.09.040
14. Crescitelli R, Lasser C, Lotvall J. Isolation and characterization of extracellular vesicle subpopulations from tissues. Nat Protoc. 2021;16(3):1548–1580. doi:10.1038/s41596-020-00466-1
15. Li J, Liu K, Liu Y, et al. Exosomes mediate the cell-to-cell transmission of IFN-alpha-induced antiviral activity. Nat Immunol. 2013;14(8):793–803. doi:10.1038/ni.2647
16. Tusher VG, Tibshirani R, Chu G. Significance analysis of microarrays applied to the ionizing radiation response. Proc Natl Acad Sci USA. 2001;98(9):5116–5121. doi:10.1073/pnas.091062498
17. Varghese F, Bukhari AB, Malhotra R, De A. IHC Profiler: an open source plugin for the quantitative evaluation and automated scoring of immunohistochemistry images of human tissue samples. PloS one. 2014;9(5):e96801. doi:10.1371/journal.pone.0096801
18. Li ZL, Hu J, Li YL, et al. The effect of hyperoside on the functional recovery of the ischemic/reperfused isolated rat heart: potential involvement of the extracellular signal-regulated kinase 1/2 signaling pathway. Free Radic Biol Med. 2013;57:132–140. doi:10.1016/j.freeradbiomed.2012.12.023
19. Kluiver J, Slezak-Prochazka I, Smigielska-Czepiel K, Halsema N, Kroesen BJ, van den Berg A. Generation of miRNA sponge constructs. Methods. 2012;58(2):113–117. doi:10.1016/j.ymeth.2012.07.019
20. Taganov KD, Boldin MP, Chang KJ, Baltimore D. NF-kappaB-dependent induction of microRNA miR-146, an inhibitor targeted to signaling proteins of innate immune responses. Proc Natl Acad Sci USA. 2006;103(33):12481–12486. doi:10.1073/pnas.0605298103
21. Manna I, Iaccino E, Dattilo V, et al. Exosome-associated miRNA profile as a prognostic tool for therapy response monitoring in multiple sclerosis patients. FASEB J. 2018;32(8):4241–4246. doi:10.1096/fj.201701533R
22. Sun Z, Shi K, Yang S, et al. Effect of exosomal miRNA on cancer biology and clinical applications. Mol Cancer. 2018;17(1):147. doi:10.1186/s12943-018-0897-7
23. Roggli E, Britan A, Gattesco S, et al. Involvement of microRNAs in the cytotoxic effects exerted by proinflammatory cytokines on pancreatic beta-cells. Diabetes. 2010;59(4):978–986. doi:10.2337/db09-0881
24. Roggli E, Gattesco S, Caille D, et al. Changes in microRNA expression contribute to pancreatic beta-cell dysfunction in prediabetic NOD mice. Diabetes. 2012;61(7):1742–1751. doi:10.2337/db11-1086
25. Bravo-Egana V, Rosero S, Klein D, et al. Inflammation-Mediated Regulation of MicroRNA Expression in Transplanted Pancreatic Islets. J Transplant. 2012;2012:723614. doi:10.1155/2012/723614
26. Samandari N, Mirza AH, Nielsen LB, et al. Circulating microRNA levels predict residual beta cell function and glycaemic control in children with type 1 diabetes mellitus. Diabetologia. 2017;60(2):354–363. doi:10.1007/s00125-016-4156-4
27. Melkman-Zehavi T, Oren R, Kredo-Russo S, et al. miRNAs control insulin content in pancreatic beta-cells via downregulation of transcriptional repressors. EMBO J. 2011;30(5):835–845. doi:10.1038/emboj.2010.361
28. Pan L, Huang BJ, Ma XE, et al. MiR-25 protects cardiomyocytes against oxidative damage by targeting the mitochondrial calcium uniporter. Int J Mol Sci. 2015;16(3):5420–5433. doi:10.3390/ijms16035420
29. Deconinck JF, Potvliege PR, Gepts W. The ultrasturcture of the human pancreatic islets. I. The islets of adults. Diabetologia. 1971;7(4):266–282. doi:10.1007/BF01211879
30. Like AA, Orci L. Embryogenesis of the human pancreatic islets: a light and electron microscopic study. Diabetes. 1972;21(2 Suppl):511–534. doi:10.2337/diab.21.2.s511
31. Pahl HL. Activators and target genes of Rel/NF-kappaB transcription factors. Oncogene. 1999;18(49):6853–6866. doi:10.1038/sj.onc.1203239
32. Lawrence T. The nuclear factor NF-kappaB pathway in inflammation. Cold Spring Harb Perspect Biol. 2009;1(6):a001651. doi:10.1101/cshperspect.a001651
33. Yaron A, Hatzubai A, Davis M, et al. Identification of the receptor component of the IkappaBalpha-ubiquitin ligase. Nature. 1998;396(6711):590–594. doi:10.1038/25159
34. Vriend J, Reiter RJ. Melatonin as a proteasome inhibitor. Is there any clinical evidence?. Life Sci. 2014;115(1–2):8–14. doi:10.1016/j.lfs.2014.08.024
35. Min KJ, Jang JH, Kwon TK. Inhibitory effects of melatonin on the lipopolysaccharide-induced CC chemokine expression in BV2 murine microglial cells are mediated by suppression of Akt-induced NF-kappaB and STAT/GAS activity. J Pineal Res. 2012;52(3):296–304. doi:10.1111/j.1600-079X.2011.00943.x
36. Farre D, Roset R, Huerta M, et al. Identification of patterns in biological sequences at the ALGGEN server: PROMO and MALGEN. Nucleic Acids Res. 2003;31(13):3651–3653. doi:10.1093/nar/gkg605
37. Khan A, Fornes O, Stigliani A, et al. JASPAR 2018: update of the open-access database of transcription factor binding profiles and its web framework. Nucleic Acids Res. 2017. doi:10.1093/nar/gkx1126
38. Khan A, Fornes O, Stigliani A, et al. JASPAR 2018: update of the open-access database of transcription factor binding profiles and its web framework. Nucleic Acids Res. 2018;46(D1):D1284. doi:10.1093/nar/gkx1188
39. Xue Y, Sheng Y, Dai H, Cao H, Liu Z, Li Z. Risk of development of acute pancreatitis with pre-existing diabetes: a meta-analysis. Eur J Gastroenterol Hepatol. 2012;24(9):1092–1098. doi:10.1097/MEG.0b013e328355a487
40. Yang L, He Z, Tang X, Liu J. Type 2 diabetes mellitus and the risk of acute pancreatitis: a meta-analysis. Eur J Gastroenterol Hepatol. 2013;25(2):225–231. doi:10.1097/MEG.0b013e32835af154
41. Yuan D, Zhao Y, Banks WA, et al. Macrophage exosomes as natural nanocarriers for protein delivery to inflamed brain. Biomaterials. 2017;142:1–12. doi:10.1016/j.biomaterials.2017.07.011
42. Liu Q, Rojas-Canales DM, Divito SJ, et al. Donor dendritic cell-derived exosomes promote allograft-targeting immune response. J Clin Invest. 2016;126(8):2805–2820. doi:10.1172/JCI84577
43. Xiao H, Lasser C, Shelke GV, et al. Mast cell exosomes promote lung adenocarcinoma cell proliferation - role of KIT-stem cell factor signaling. Cell Commun Signaling. 2014;12:64. doi:10.1186/s12964-014-0064-8
44. Goetzl EJ, Goetzl L, Karliner JS, Tang N, Pulliam L. Human plasma platelet-derived exosomes: effects of aspirin. FASEB J. 2016;30(5):2058–2063. doi:10.1096/fj.201500150R
45. Wahlgren J, Karlson Tde L, Glader P, Telemo E, Valadi H. Activated human T cells secrete exosomes that participate in IL-2 mediated immune response signaling. PloS one. 2012;7(11):e49723.
46. Galli SJ, Borregaard N, Wynn TA. Phenotypic and functional plasticity of cells of innate immunity: macrophages, mast cells and neutrophils. Nat Immunol. 2011;12(11):1035–1044. doi:10.1038/ni.2109
47. Calvo JR, Gonzalez-Yanes C, Maldonado MD. The role of melatonin in the cells of the innate immunity: a review. J Pineal Res. 2013;55(2):103–120. doi:10.1111/jpi.12075
48. Choi EY, Jin JY, Lee JY, Choi JI, Choi IS, Kim SJ. Melatonin inhibits Prevotella intermedia lipopolysaccharide-induced production of nitric oxide and interleukin-6 in murine macrophages by suppressing NF-kappaB and STAT1 activity. J Pineal Res. 2011;50(2):197–206. doi:10.1111/j.1600-079X.2010.00829.x
49. Zhang S, Li W, Gao Q, Wei T. Effect of melatonin on the generation of nitric oxide in murine macrophages. Eur J Pharmacol. 2004;501(1–3):25–30. doi:10.1016/j.ejphar.2004.08.015
 © 2023 The Author(s). This work is published and licensed by Dove Medical Press Limited. The
full terms of this license are available at https://www.dovepress.com/terms
and incorporate the Creative Commons Attribution
- Non Commercial (unported, 3.0) License.
By accessing the work you hereby accept the Terms. Non-commercial uses of the work are permitted
without any further permission from Dove Medical Press Limited, provided the work is properly
attributed. For permission for commercial use of this work, please see paragraphs 4.2 and 5 of our Terms.
© 2023 The Author(s). This work is published and licensed by Dove Medical Press Limited. The
full terms of this license are available at https://www.dovepress.com/terms
and incorporate the Creative Commons Attribution
- Non Commercial (unported, 3.0) License.
By accessing the work you hereby accept the Terms. Non-commercial uses of the work are permitted
without any further permission from Dove Medical Press Limited, provided the work is properly
attributed. For permission for commercial use of this work, please see paragraphs 4.2 and 5 of our Terms.