Back to Journals » Clinical Epidemiology » Volume 12
External Validation of an Algorithm to Identify Patients with High Data-Completeness in Electronic Health Records for Comparative Effectiveness Research
Authors Lin KJ, Rosenthal GE, Murphy SN, Mandl KD ![]() , Jin Y
, Jin Y ![]() , Glynn RJ
, Glynn RJ ![]() , Schneeweiss S
, Schneeweiss S ![]()
Received 26 September 2019
Accepted for publication 6 December 2019
Published 4 February 2020 Volume 2020:12 Pages 133—141
DOI https://doi.org/10.2147/CLEP.S232540
Checked for plagiarism Yes
Review by Single anonymous peer review
Peer reviewer comments 2
Editor who approved publication: Professor Henrik Toft Sørensen
Kueiyu Joshua Lin,1,2 Gary E Rosenthal,3 Shawn N Murphy,4,5 Kenneth D Mandl,6 Yinzhu Jin,1 Robert J Glynn,1 Sebastian Schneeweiss1
1Division of Pharmacoepidemiology and Pharmacoeconomics, Department of Medicine, Brigham and Women’s Hospital, Harvard Medical School, Boston, MA, USA; 2Department of Medicine, Massachusetts General Hospital, Harvard Medical School, Boston, MA, USA; 3Department of Internal Medicine, Wake Forest School of Medicine, Winston-Salem, NC, USA; 4Department of Neurology, Massachusetts General Hospital, Harvard Medical School, Boston, MA, USA; 5Research Information Science and Computing, Partners Healthcare, Somerville, MA, USA; 6Computational Health Informatics Program, Boston Children’s Hospital, Harvard Medical School, Boston, MA, USA
Correspondence: Kueiyu Joshua Lin
Division of Pharmacoepidemiology and Pharmacoeconomics, Department of Medicine, Brigham and Women’s Hospital, Harvard Medical School, 1620 Tremont St. Suite 3030, Boston, MA 02120, USA
Tel +1 617 278-0930
Fax +1 617 232-8602
Email [email protected]
Objective: Electronic health records (EHR) data-discontinuity, i.e. receiving care outside of a particular EHR system, may cause misclassification of study variables. We aimed to validate an algorithm to identify patients with high EHR data-continuity to reduce such bias.
Materials and Methods: We analyzed data from two EHR systems linked with Medicare claims data from 2007 through 2014, one in Massachusetts (MA, n=80,588) and the other in North Carolina (NC, n=33,207). We quantified EHR data-continuity by Mean Proportion of Encounters Captured (MPEC) by the EHR system when compared to complete recording in claims data. The prediction model for MPEC was developed in MA and validated in NC. Stratified by predicted EHR data-continuity, we quantified misclassification of 40 key variables by Mean Standardized Differences (MSD) between the proportions of these variables based on EHR alone vs the linked claims-EHR data.
Results: The mean MPEC was 27% in the MA and 26% in the NC system. The predicted and observed EHR data-continuity was highly correlated (Spearman correlation=0.78 and 0.73, respectively). The misclassification (MSD) of 40 variables in patients of the predicted EHR data-continuity cohort was significantly smaller (44%, 95% CI: 40– 48%) than that in the remaining population.
Discussion: The comorbidity profiles were similar in patients with high vs low EHR data-continuity. Therefore, restricting an analysis to patients with high EHR data-continuity may reduce information bias while preserving the representativeness of the study cohort.
Conclusion: We have successfully validated an algorithm that can identify a high EHR data-continuity cohort representative of the source population.
Keywords: electronic medical records, data linkage, comparative effectiveness research, information bias, continuity, external validation
Introduction
Comparative effectiveness research based on health-care data generated from routine-care delivery, so-called “real-world data”, can provide timely and more generalizable evidence on the effects of prescription drugs and medical or surgical interventions.1 Among the real-world data sources, electronic health records (EHR) contain rich clinical information essential for many drug effectiveness studies (e.g., smoking status, body mass index, blood pressure levels, laboratory test results, etc.) that are not available in other routine-care databases, such as insurance claims data. There has been a remarkable growth in CER studies using EHR as the primary data source in the last decade.2,3 However, most EHR systems in the US, with the exception of highly integrated health plans, do not comprehensively capture medical encounters across all care settings and facilities, thus may miss a substantial amount of information that characterized the health state of its patient population.4
Lack of “EHR data-continuity” or “EHR data-discontinuity”, defined as “having medical information recorded outside the reach of an EHR system” can lead to a substantial amount of information bias. Based on data from two large metropolitan EHR systems in Massachusetts, we found that a single EHR system captures less than 30% of all the health-care information, which can translate into up to 17 fold greater misclassification of CER-relevant variables in those with record capture rate<10% vs ≥80%.5 While linkage to an additional data source that captures comprehensively the longitudinal encounters, such as insurance claims data, can remedy this information bias, such linkage is often not feasible. Therefore, we had previously developed a prediction model to identify patients with high EHR data-continuity with the predictors available in a typical EHR system. We demonstrated that restricting to patients with top 20% predicted EHR data-continuity can reduce the misclassification of key CER variables by fourfold. We also showed the patients with high EHR data-continuity had similar co-morbidity profiles when compared with the remaining population.
However, the external validity of the EHR data-continuity prediction model across different EHR systems is unknown. Given there are >600 EHR systems in use in the US with diverse database structures,6 it is essential to test the performance of this prediction algorithm in a different EHR system. The EHR data-continuity prediction model was developed in Massachusetts (MA), and we aimed to validate the performance of the algorithm in a provider system in North Carolina (NC) that uses a different EHR vendor.
Methods
Data Sources
We linked longitudinal claims data from fee-for-service Medicare parts A, B, and D databases to EHR data for two medical care networks, one each in MA and NC. The algorithm was developed in the MA system and the NC system was used as the validation set. The MA system consists of one tertiary hospital, two community hospitals, and 17 primary care centers; and the NC systems includes 1 tertiary hospital, 5 community hospitals, and >200 clinics. Both systems include medical facilities across the full spectrum of care continuum. Each EHR database contains information on patient demographics, medical diagnoses, procedures, medications, and various clinical data. The Medicare claims data contain information on demographics, enrollment start and end dates, dispensed medications and performed procedures, and medical diagnoses.7 The Institutional Review Board of the Partners HealthCare System approved the study protocol and patient privacy precautions.
Study Population
Among patients aged 65 and older with at least 180 days of continuous enrollment in Medicare (including inpatient, outpatient, and prescription coverage) from 2007/1/1 to 2014/12/31, we identified those with at least one EHR encounter during their active Medicare enrollment period. The date when these criteria were met was assigned as the cohort entry date after which we started the evaluation of their EHR data-completeness and classification of key variables. Those with private commercial insurance and Medicare as secondary payor were excluded to ensure we have comprehensive claims data for the study population.
Study Design
Whether an EHR system holds adequate data for a particular individual (so-called “EHR data-continuity status”) may change over time because patients may seek medical care in different provider systems over time. Therefore, we allowed the EHR data-continuity status to change every 365 days (Appendix Fig S1). The assumption was that most patients aged 65 and older would present for a regular follow-up with records in the claims data at least annually. A short assessment period may lead to unstable estimates of the capture rates and a long period would make the data-continuity status less flexible over time. We followed patients until the earliest of the following: 1) loss of Medicare coverage; 2) death; 3) 2014/12/31, the end of the study period.
Measurement of EHR Data-Continuity in an EHR System
To assess EHR data-continuity, we calculated the Mean Proportions of Encounters Captured (MPEC) by the EHR data:
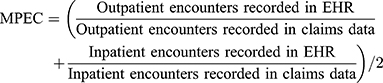
Patients generally have substantially more outpatient than inpatient visits. This definition purposefully gives more weight to inpatient than to outpatient visits. This is consistent with usual data considerations in CER where the recording of inpatient diagnosis is considered more complete and accurate than in outpatient settings.8 The incomplete terminal year during follow-up (with length less than 365 days) was not used to calculate MPEC to avoid unstable estimates.
External Validation
Using data from the MA system, we had previously published a prediction model for identifying patients with high EHR data-continuity (Appendix, Table S1).9 Based on the data in the NC system, we externally validated the performance of this model by 1) Discrimination against and correlation with the observed (measured) MPEC: We previously found that 60% was the minimum MPEC needed to achieve acceptable classification of the selected variables according to one possible cut-off suggested in the context of confounding adjustment.5,10 We computed the area under the receiver operating characteristic curve (AUC) using our model to predict observed MPEC ≥60%. We also evaluated how the predicted MPEC was correlated with the observed MPEC by Spearman rank correlation coefficient. The model coefficients were derived in the MA system, but the predicted EHR data-continuity was calculated based on the predictor information in the NC system. As a sensitivity analysis, we updated the coefficients based on the NC system to evaluate if the locally derived model would result in a better performance. 2) Misclassification of 40 key CER variables: We evaluated the misclassification of 40 selected CER variables commonly used as drug exposure (n=15), outcome (n=10), or confounders (n=15) in CER (Appendix, Table S2). The 10 outcome variables were based on previously validated algorithms.11–18 The diagnosis and procedure codes in the EHR were extracted from the billing system, which used the same coding system (i.e., International Statistical Classification of Diseases and Related Health Problems [ICD],) Current Procedural Terminology [CPT], and Healthcare Common Procedure Coding System [HCPCS] codes) as did the claims database. For each year following the cohort entry date, we evaluated the misclassification of these 40 variables, stratified by deciles of predicted MPEC.
Metrics of Misclassification
(a) Sensitivity of positive coding in EHR when compared to coding in the linked claims-EHR data:
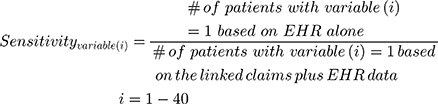
By design, because the gold standard was classification based on all available data, specificity was expected to be 100% for all variables, but if the study EHR system did not capture medical information recorded in other systems, sensitivity could be low; (b) Standardized difference comparing the classification based on only EHR vs that based on the linked claims-EHR data: Standardized difference is a measure of distance between two group means standardized by their standard deviations.19 Within levels of predicted MPEC, we computed mean sensitivity and mean standardized difference (MSD) for the 40 CER-relevant variables.
Evaluation of the Representativeness of the Cohort with High EHR Data-Continuity
Based on our prior findings,9 we defined patients in the top 20% of predicted MPEC as the “EHR data-continuity cohort”. We compared the proportions of all categories of combined comorbidity score (CCS), a widely used comorbidity scores in CER20 based on claims data in those within vs outside of the EHR data-continuity cohort to see if those with high predicted EHR data-continuity had similar comorbidity profiles when compared to the remaining population. We used claims data for the representativeness assessment, assuming similar completeness of claims data across different levels of EHR data-continuity. All the statistical analyses were conducted with SAS 9.4 (SAS Institute Inc., Cary, NC).
Results
Study Population and EHR Data-Continuity Pattern
Our study cohort consists of a total of 80,588 patients in the MA system (training set) and 33,207 patients in the NC system (validation set). Patients in the validation set have similar demographic and co-morbidity profiles when compared to those in the training set (mean age 73.7 vs 74.1 and mean combined co-morbidity score 2.3 vs 2.0, respectively. Appendix, Table S3). The mean follow-up time for the study cohort was 3.2 and 2.8 years for the training and validation sets, respectively. Figure 1 shows the proportion of encounters captured by electronic health record systems and by year after cohort-entry. The mean capture proportion was 27% in the training and 26% in the validation set for the first year, which remained consistently low (ranges from 21% to 26%) in all subsequent years across two EHR systems.
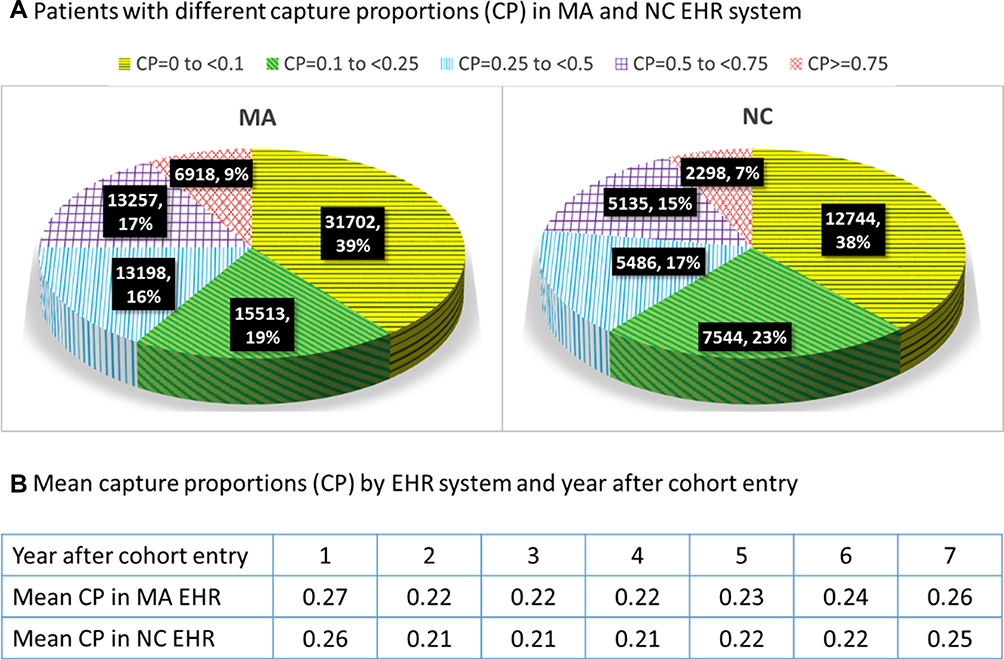 |
Figure 1 Proportion of encounters captured by electronic health record systems. |
Correlation Between Predicted vs Observed EHR Data-Continuity
The AUC for predicting the observed MPEC ≥ 60% was 0.86 in both the training and testing sets. The predicted MPEC was highly correlated with the observed MPEC both in the training and testing set (Spearman coefficient =0.78 and 0.73, respectively). The correlation between predicted and observed MPEC remained high in both sets in the subgroups defined by demographic and comorbidity factors (Appendix, Table S4). In the sensitivity analysis, when the predicted EHR data-continuity was calculated based on updated model coefficients developed using the NC data, the performance of the model was similar to the model based on MA data (the AUC for predicting observed MPEC ≥ 60% was 0.87 and the spearman coefficient in relation to the observed MPEC was 0.74).
Sensitivity of Coding 40 CER Variables by Predicted EHR Data-Continuity in the Validation Set
The mean sensitivity of EHR capturing the codes for 40 CER variables (Sensitivity_40_variables) when compared to the linked claims-EHR data in the EHR data-continuity cohort (patients with the top 20% predicted EHR data-continuity) was 0.60 (95% CI: 0.55–0.66), which was 3.57 (95% CI: 2.83–4.30) fold greater than the mean sensitivity for the remaining population (0.17, 95% CI: 0.14–0.20), based on data in the first year in the validation set. The performance in the validation set was appreciably worse than that in the training set but the overall trend was similar in both sets and in subsequent years (Table 1). The mean performance was consistently worse for the 15 medication use variables (Sensitivity_medications) than that for the 25 co-morbidity (Sensitivity_comorbid) variables. The reduced performance from the training to validation set was also more pronounced for the medication variables compared to co-morbidity variables (Figure 2). For example, for patients in the 10th decile of predicted EHR data-continuity, the Sensitivity_medications was 0.54 and Sensitivity_comorbid was 0.75 in the validation set, compared with Sensitivity_medications of 0.84 and Sensitivity_comorbid of 0.85 in the training set for the same stratum.
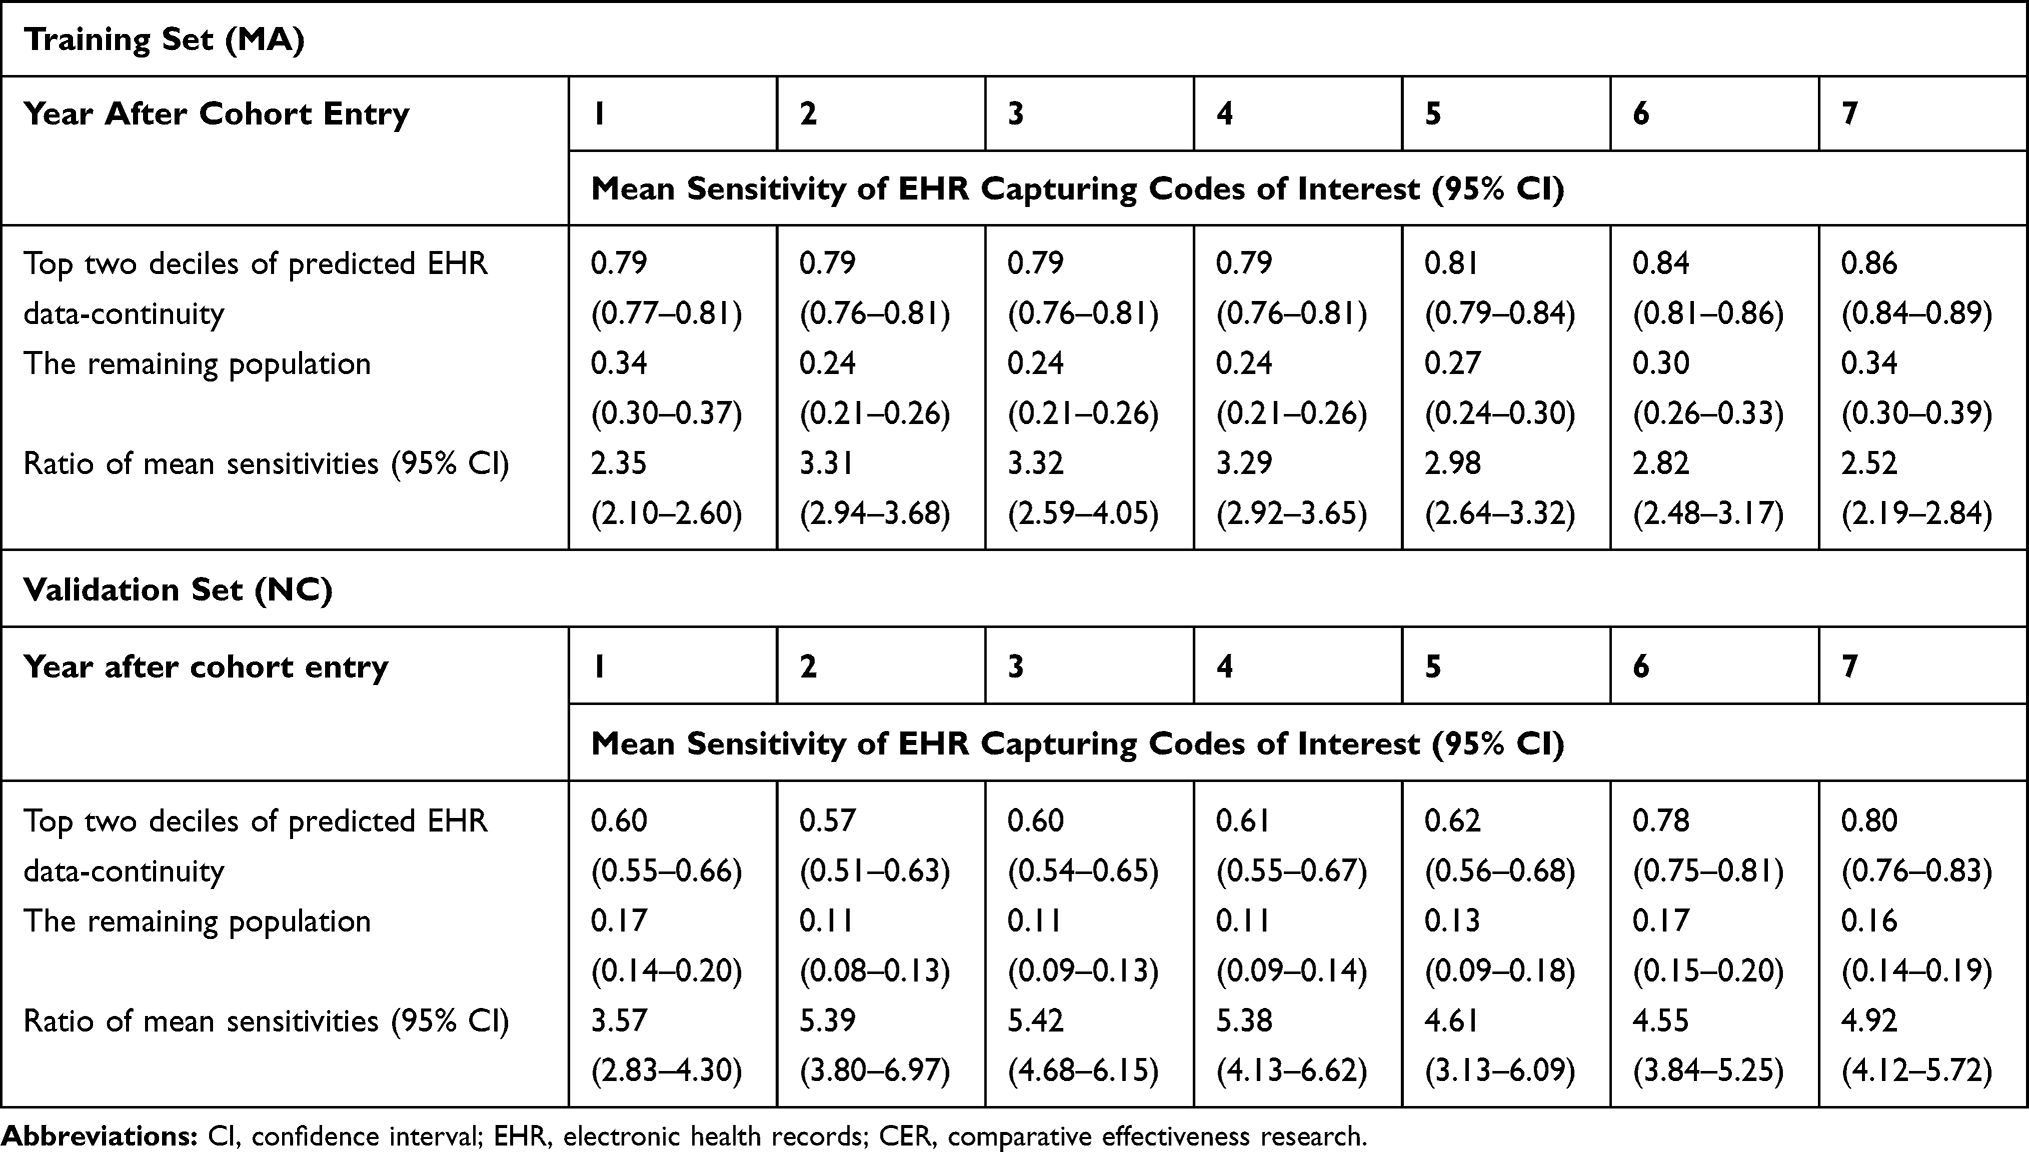 |
Table 1 Sensitivity of EHR Data Capturing 40 Selected CER Variables When Compared to Records in EHR Plus Claims Data |
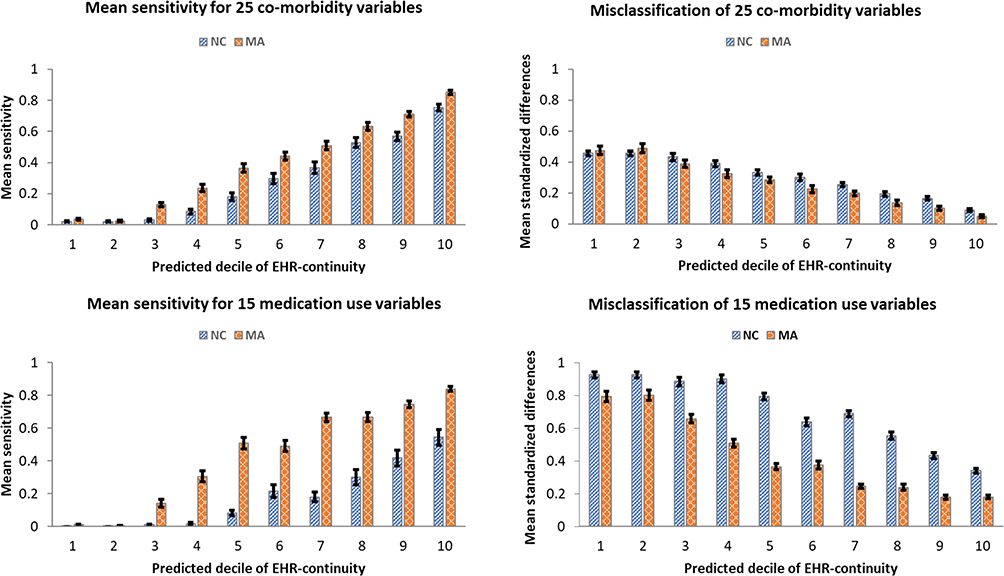 |
Figure 2 Sensitivity and misclassification by predicted EHR data-continuity in the training (MA) and validation (NC) EHR systems. Abbreviations: EHR, electronic health records; NC, North Carolina; MA, Massachusetts. |
Misclassification Quantified by Standardized Differences by Predicted EHR Data-Continuity in the Validation Set
The MSD between the proportions of the 40 selected variables (MSD_40_variables) based on EHR alone vs the linked claims-EHR data in the EHR data-continuity cohort was 0.22 (95% CI: 0.20–0.24), which was significantly smaller (44%, 95% CI: 40–48%) than the corresponding MSD_40_variables for the remaining population (50%, 95% CI: 49–52%), based on data in the first year in the validation set. The performance in the validation set was appreciably worse than that in the training set but the overall trend was similar in both sets and in subsequent years (Table 2). The performance was consistently worse for the 15 medication use variables (MSD_medications) than that for the 25 co-morbidity variables (MSD_comorbid). The reduced performance from the training to validation set was also more pronounced for the medication variables compared to co-morbidity variables (Figure 2). For example, for patients in the 10th decile of predicted EHR data-continuity, the MSD_medications was 0.34 and MSD_comorbid was 0.09 in the validation set, compared with MSD_medications of 0.12 and MSD_comorbid of 0.05 in the training set for the same stratum.
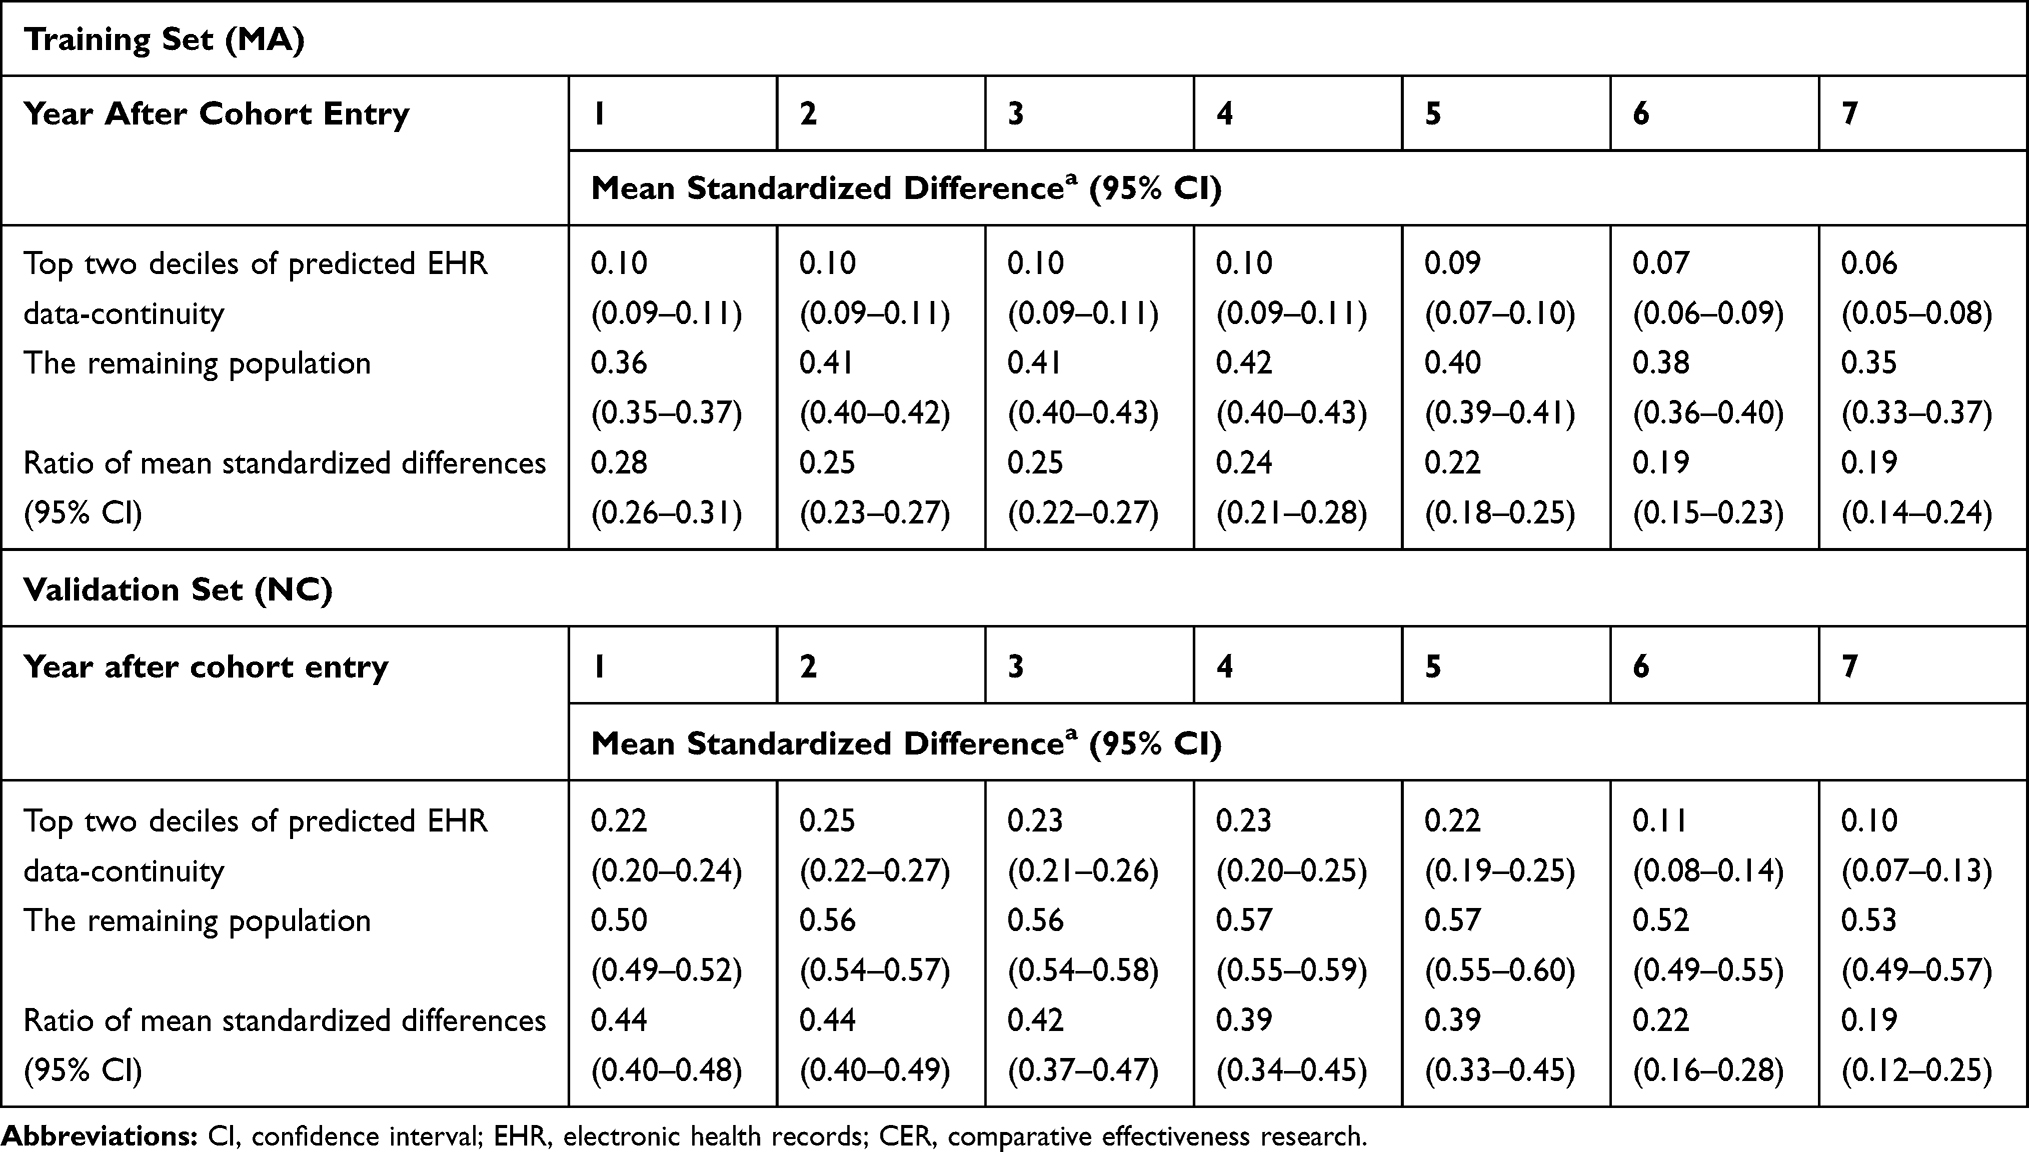 |
Table 2 Difference in Measuring 40 CER Variables in EHR vs EHR Plus Claims Data |
Representativeness of the EHR Data-Continuity Cohort
In the validation set, we observed small to modest differences between the distribution of CCS in the EHR data-continuity cohort vs that in the remaining population, with an MSD for all CCS categories of 0.05 (Figure 3). The corresponding MSD was 0.02 in the training set. In both sets, patients with higher EHR data-continuity cohort were slightly younger (mean age 72.8 vs 73.9 in patients with high vs low continuity in the validation set) and more likely to have diabetes and hypertension, less likely to have dementia (mean MSD for all 25 selected comorbidity variables=0.04 in the validation set; Appendix, Table S5). As a reference point to quantify such differences, a standardized difference of less than 0.1 for covariates across comparison groups is commonly used to indicate satisfactory balance of covariates in the context of confounding adjustment.10 Similar findings were found in all the years following the cohort entry (Table S6).
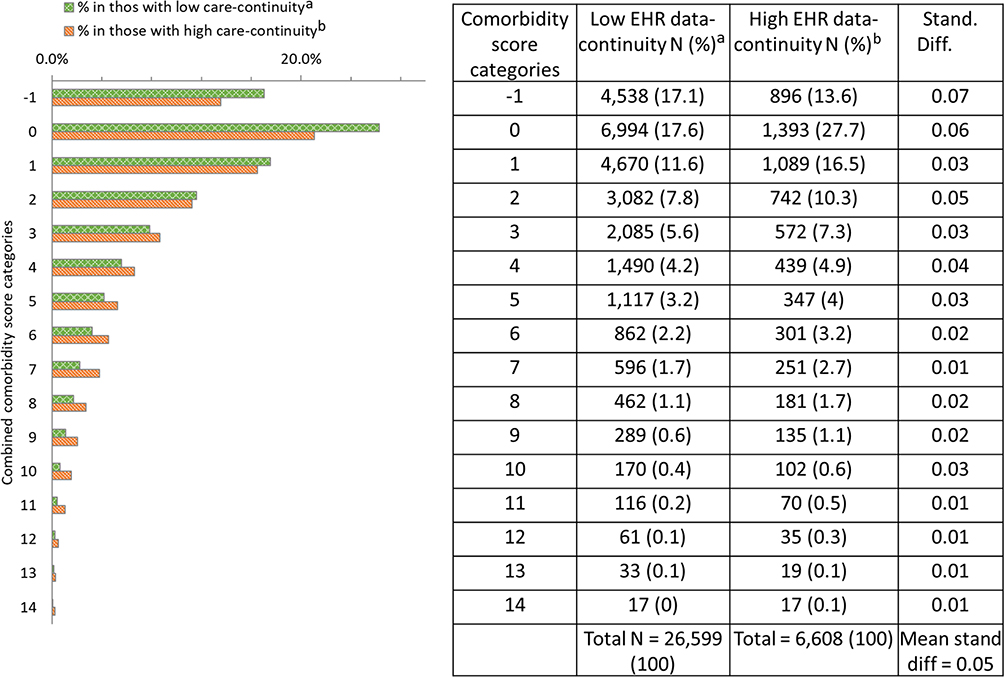 |
Figure 3 Representativeness: Comparison of combined comorbidity score in patients with high vs low predicted EHR data-continuity in the validation EHR system (NC). Notes: aPatients in the lower 8 deciles of predicted EHR data-continuity; bPatients in the top 2 deciles of predicted EHR data-continuity. Stand diff = Standardized difference. Combined comorbidity score ranges between −2 and 26 with a higher score associated with higher mortality; cell size<10 were not presented here. |
Discussion
We validated the performance of an algorithm to identify patients with high EHR data-completeness in the external validation EHR system. We found that the EHR includes 50% or more encounters for less than 30% of the patients in both the training and validation sets. The predicted EHR data-continuity was highly correlated with the observed EHR data-continuity in both sets. In the validation set, patients with top 20% predicted EHR data-continuity had substantially higher sensitivity and less misclassification in 40 CER-relevant variables, compared to the remaining population. The high EHR data-continuity population has similar co-morbidity profiles compared to patients with low EHR data-continuity.
Despite the geographical and systematic differences, we found very similar capture proportions of all the medical encounters by the study EHR in the MA vs NC systems. Judging by a high correlation between predicted and observed EHR data-continuity in both the training and validation sets, the predictability of factors of having high EHR data-completeness identified in the training system was generalizable to the validation system. This indicates that our algorithm can identify well patients with the study EHR capturing high proportions of medical encounters. However, whether it can be translated into the validity of study variables is also dependent on the documentation convention, coding practice, and data curation process for research database in each EHR system, which can potentially explain differences in performance of the variable misclassification within the same level of predicted EHR data-continuity.
In both training and validation sets, we found that the medication variables have more residual misclassification than co-morbidity variables that are based on diagnosis and/or procedure codes for the same level of predicted EHR data-continuity. The sources of medication information in EHR rely largely on prescribing (order entry) data with inconsistent supplemental data from medication reconciliation, electronic medication administration data, or some dispensing (mostly only inpatient dispensing). The composition of such sources can vary from system to system, which may explain the different degrees of misclassification of medication variables when a study is relying on only EHR data. For example, among these sources, electronic medication administration data were not available in the MA EHR research database and medication reconciliation information was not available in the NC EHR data. During the medication reconciliation process, patients can report medication prescribed in the other EHR system and thus reduce the information leakage due to care provided outside of the study EHR. Since our findings showed consistently more misclassification in the medication use variables, researchers may consider selectively linking the EHR with outpatient dispensing pharmacy or claims data if such access is available.
Despite attenuated performance in bias reduction in the validation set, our study provides clear evidence that the misclassification of the CER-relevant variables was substantially reduced in the EHR data-continuity cohort than in the remaining population. Therefore, including patients not in the EHR data-continuity cohort in a study will likely jeopardize study validity. Because large-scale linkage between EHR data and a secondary database is rarely done due to privacy concerns, researchers with access only to EHR can use our algorithm to identify an EHR data-continuity cohort to improve study validity. In addition, we demonstrated small to modest differences in the co-morbidity profiles in patients with high vs low EHR data-continuity in the validation set. These results thus suggest restricting a CER analysis to those with high EHR data-continuity likely confer a favorable benefit (reducing information bias) to risk (losing generalizability) ratio. It is important to note that the influence of this bias on comparative estimates (e.g. relative risks.) is research question specific. Further investigations including a range of research questions with vs without applying our approach are needed to evaluate the ultimate impact of EHR data-discontinuity on CER.
There are some limitations. First, our study cohort is limited to patients aged 65 or above. The older adults are the most critical population to investigate the impact of EHR data-continuity on study validity using EHR because they often need more complex care which may not be fulfilled in one system due to resource limitations. Moreover, US integrated health systems, in which the EHR data-completeness is considered sufficient, do not have representative elderly populations. Hence, the issues our approach sought to remedy are most relevant in the older adults. Nonetheless, our findings may not be generalizable to the younger populations. Second, our prediction model was only intended to rank patients based on predicted EHR data-continuity, not to predict the absolute values of EHR data-continuity metric (i.e., EHR encounter capture rates). The assumption was that people can be ranked based on the likelihood of receiving most care in the EHR system, which is plausible because active patients in an EHR often share some common features, such as receiving routine vaccines and screening tests, etc. In contrast, predicting the absolute values of EHR capture rates could be much more challenging and is not what this prediction model was designed to achieve. Next, both our training and validation sets are based on academic EHR systems that consist of medical facilities across the full range of care continuum, from outpatient clinics to tertiary care hospitals. Our findings may not be generalizable to other types of EHR systems lacking key components of care continuum. Also, limiting to patients with high EHR data-continuity will inevitably reduce study sizes and statistical power. Lastly, the ultimate impact of EHR data-discontinuity on CER is likely research question specific. Therefore, future investigations in a wide range of research questions with vs without applying our approach are needed to understand how such misclassification influenced different CER questions.
Conclusion
In an external validation of a prediction score to identify patients with high EHR data-continuity, we found that our algorithm to predict EHR data-continuity in the absence of claims linkage was highly correlated with the observed EHR data-continuity. Both the EHR systems in the training and validation sets capture only 21–27% of all the medical encounters when compared with insurance claims data. In the validation set, we found that the misclassification of the CER-relevant variables in patients in the EHR data-continuity cohort is much less than that in the remaining population while preserving representativeness. These findings support the strategy to restrict a CER study to patients with high EHR data-continuity, and likely generalizable to the majority of US health-care systems that are not integrated with a payor/insurer and thus EHR data-discontinuity is likely.
Disclosure
Dr Robert Glynn reports grants from Kowa, Novartis, Pfizer, and Astra Zeneca, outside the submitted work; Dr Sebastian Schneeweise reports personal fees from WHISCON, LLC, Aetion, Inc., outside the submitted work. The authors report no other conflicts of interest in this work.
References
1. Smith M, Stuckhardt I. Best Care at Lower Cost: The Path to Continuously Learning Health Care in America. National Academies Press; 2012.
2. Randhawa GS. Building electronic data infrastructure for comparative effectiveness research: accomplishments, lessons learned and future steps. J Comp Eff Res. 2014;3(6):567–572. doi:10.2217/cer.14.73
3. Corley DA, Feigelson HS, Lieu TA, McGlynn EA. Building data infrastructure to evaluate and improve quality: pCORnet. J Oncol Pract. 2015;11(3):204–206. doi:10.1200/JOP.2014.003194
4. Weber GM, Adams WG, Bernstam EV, et al. Biases introduced by filtering electronic health records for patients with “complete data”. J Am Med Inform Assoc. 2017;24(6):1134–1141. doi:10.1093/jamia/ocx071
5. Lin KJ, Glynn RJ, Singer DE, Murphy SN, Lii J, Schneeweiss S. Out-of-system care and recording of patient characteristics critical for comparative effectiveness research. Epidemiology. 2018;29(3):356–363. doi:10.1097/EDE.0000000000000794
6. Da Silva JA, Jacobs JW, Kirwan JR, et al. Safety of low dose glucocorticoid treatment in rheumatoid arthritis: published evidence and prospective trial data. Ann Rheum Dis. 2006;65(3):285–293. doi:10.1136/ard.2005.038638
7. Hennessy S. Use of health care databases in pharmacoepidemiology. Basic Clin Pharmacol Toxicol. 2006;98(3):311–313. doi:10.1111/j.1742-7843.2006.pto_368.x
8. Fang MC, Fan D, Sung SH, et al. Validity of using inpatient and outpatient administrative codes to identify acute venous thromboembolism: the CVRN VTE study. Med Care. 2016;55:e137–e143.
9. Lin KJ, Singer DE, Glynn RJ, Murphy SN, Lii J, Schneeweiss S. Identifying patients with high data completeness to improve validity of comparative effectiveness research in electronic health records data. Clin Pharmacol Ther. 2018;103(5):899–905. doi:10.1002/cpt.v103.5
10. Austin PC. Balance diagnostics for comparing the distribution of baseline covariates between treatment groups in propensity-score matched samples. Stat Med. 2009;28(25):3083–3107. doi:10.1002/sim.3697
11. Birman-Deych E, Waterman AD, Yan Y, Nilasena DS, Radford MJ, Gage BF. Accuracy of ICD-9-CM codes for identifying cardiovascular and stroke risk factors. Med Care. 2005;43(5):480–485. doi:10.1097/01.mlr.0000160417.39497.a9
12. Wahl PM, Rodgers K, Schneeweiss S, et al. Validation of claims-based diagnostic and procedure codes for cardiovascular and gastrointestinal serious adverse events in a commercially-insured population. Pharmacoepidemiol Drug Saf. 2010;19(6):596–603. doi:10.1002/pds.v19:6
13. Andrade SE, Harrold LR, Tjia J, et al. A systematic review of validated methods for identifying cerebrovascular accident or transient ischemic attack using administrative data. Pharmacoepidemiol Drug Saf. 2012;21(Suppl 1):100–128. doi:10.1002/pds.2312
14. Tamariz L, Harkins T, Nair V. A systematic review of validated methods for identifying venous thromboembolism using administrative and claims data. Pharmacoepidemiol Drug Saf. 2012;21(Suppl 1):154–162. doi:10.1002/pds.2341
15. Waikar SS, Wald R, Chertow GM, et al. Validity of international classification of diseases, ninth revision, clinical modification codes for acute renal failure. J Am Soc Nephrol. 2006;17(6):1688–1694. doi:10.1681/ASN.2006010073
16. Cushman M, Tsai AW, White RH, et al. Deep vein thrombosis and pulmonary embolism in two cohorts: the longitudinal investigation of thromboembolism etiology. Am J Med. 2004;117(1):19–25. doi:10.1016/j.amjmed.2004.01.018
17. Cunningham A, Stein CM, Chung CP, Daugherty JR, Smalley WE, Ray WA. An automated database case definition for serious bleeding related to oral anticoagulant use. Pharmacoepidemiol Drug Saf. 2011;20(6):560–566. doi:10.1002/pds.2109
18. Myers RP, Leung Y, Shaheen AA, Li B. Validation of ICD-9-CM/ICD-10 coding algorithms for the identification of patients with acetaminophen overdose and hepatotoxicity using administrative data. BMC Health Serv Res. 2007;7:159. doi:10.1186/1472-6963-7-159
19. Franklin JM, Rassen JA, Ackermann D, Bartels DB, Schneeweiss S. Metrics for covariate balance in cohort studies of causal effects. Stat Med. 2014;33(10):1685–1699. doi:10.1002/sim.6058
20. Gagne JJ, Glynn RJ, Avorn J, Levin R, Schneeweiss S. A combined comorbidity score predicted mortality in elderly patients better than existing scores. J Clin Epidemiol. 2011;64(7):749–759. doi:10.1016/j.jclinepi.2010.10.004
 © 2020 The Author(s). This work is published and licensed by Dove Medical Press Limited. The
full terms of this license are available at https://www.dovepress.com/terms
and incorporate the Creative Commons Attribution
- Non Commercial (unported, 3.0) License.
By accessing the work you hereby accept the Terms. Non-commercial uses of the work are permitted
without any further permission from Dove Medical Press Limited, provided the work is properly
attributed. For permission for commercial use of this work, please see paragraphs 4.2 and 5 of our Terms.
© 2020 The Author(s). This work is published and licensed by Dove Medical Press Limited. The
full terms of this license are available at https://www.dovepress.com/terms
and incorporate the Creative Commons Attribution
- Non Commercial (unported, 3.0) License.
By accessing the work you hereby accept the Terms. Non-commercial uses of the work are permitted
without any further permission from Dove Medical Press Limited, provided the work is properly
attributed. For permission for commercial use of this work, please see paragraphs 4.2 and 5 of our Terms.