Back to Journals » International Journal of General Medicine » Volume 14
Expression and Clinical Value of Eukaryotic Translation Elongation Factor 1A1 (EEF1A1) in Diffuse Large B Cell Lymphoma
Received 21 June 2021
Accepted for publication 29 July 2021
Published 27 October 2021 Volume 2021:14 Pages 7247—7258
DOI https://doi.org/10.2147/IJGM.S324645
Checked for plagiarism Yes
Review by Single anonymous peer review
Peer reviewer comments 2
Editor who approved publication: Dr Scott Fraser
Tiejun Gong,1 Yuerong Shuang2
1Institute of Hematology and Oncology, Harbin the First Hospital, Harbin, 150010, People’s Republic of China; 2Department of Lymphatic Hematology and Oncology, Jiangxi Cancer Hospital, Nanchang, 330029, People’s Republic of China
Correspondence: Yuerong Shuang
Department of Lymphatic Hematology and Oncology, Jiangxi Cancer Hospital, No. 519 Beijingdong Road, Nanchang, Jiangxi, 330029, People’s Republic of China
Tel +86-791-8831378
Email [email protected]
Background: The eukaryotic translation elongation factor 1A1 (EEF1A1) participates in protein translation and has been reported to be involved in tumor progression such as hepatocellular carcinoma. Diffuse large B-cell lymphoma (DLBCL) is the most common lymphoid malignancy in adults. In the present study, we aimed to detect the expression of EEF1A1 in DLBCL and to analyze its relationship with prognosis.
Methods: We reviewed medical records of DLBCL patients in our hospital and evaluated their expression level of EEF1A1 in tumor tissues using immunohistochemical (IHC) assay. The Chi-square method was used for correlation analysis. The Kaplan–Meier method with Log rank test was used for univariate analysis. Cox proportional hazards model was used for multivariate analysis. Cellular and mice models were introduced to validate its oncogenic role.
Results: EEF1A1 expression in tumor cells was higher in certain DLBCL cases. Patients with higher EEF1A1 expression were more likely to have advanced tumor stage and poorer 5-year overall survival (OS) rates. EEF1A1 expression in tumor cells was an independent risk predictor for OS (P < 0.05). Cellular assays demonstrated that EEF1A1-shRNA significantly inhibited lymphoma cell proliferation. The study of xenografts further verified the effect of EEF1A1-shRNA on suppressing tumor growth in vivo.
Conclusion: EEF1A1 positivity predicts short survival in DLBCL patients. For patients with higher EEF1A1 expression, more strategy such as anti-EEF1A1 antibody treatment should be developed.
Keywords: diffuse large B-cell lymphoma, prognosis, EEF1A1, proliferation
Introduction
Characterized by growing tumor mass in single or multiple lymph nodes as well as extranodal sites,1 diffuse large B‐cell lymphoma (DLBCL) is the most common type of non‐Hodgkin lymphoma (NHL), accounting for 30% of NHL cases worldwide.2 There are approximately 15,000 newly diagnosed DLBCL cases in the United States,3 and about 25,000 new cases in China each year.4 Although more than 80% of DLBCL patients may achieve a complete remission under immunochemotherapy, a significant minority (20% to 25%) of these patients will suffer with relapse.5 The increasing incidence and unsatisfied prognosis are attracting more and more attentions. Therefore, understanding the oncogenesis mechanism and progression regulators of DLBCL are urgently needed for prognosis prediction and therapy development.
Eukaryotic elongation factor-1 (EF1) contains four subunits, EF1α, EF1β, EF1γ, and EF1δ.6 Eukaryotic translation elongation factor 1 alpha 1 (EEF1A1) is a predominant isoform of the EEF1α complex, which participates in tRNA delivery by promoting the GTP-dependent binding of aminoacyl-tRNA to the A-site of ribosomes.7 EEF1A1 is ubiquitously expressed in many tissues due to its critical function in protein synthesis. Besides protein synthesis, EEF1A1 plays roles in cytoskeleton organization, cell apoptosis, stabilizing RNAs, etc.8 Ditzel et al identified EEF1A1 as an autoantibody in about 66% of the patients with Felty syndrome, an disorder characterized by autoimmune diseases such as rheumatoid arthritis and splenomegaly.9 Dysregulated EEF1A1 has been identified in many diseases. For example, hyperexpression of EEF1A1 was reported in spinal and bulbar muscular atrophy and amyotrophic lateral sclerosis.10 In contrast, a hypoexpression of EEF1A1 is observed during myocardial infarction and may be involved in cardiovascular disorders.11
Of note, the potential role of EEF1A1 in tumor progression has been reported in certain malignancies. For example, Grassi et al reported a higher mRNA level of EEF1A1 in hepatocellular carcinoma cell lines compared to normal liver cells.12 A similar conclusion was obtained based on the protein level of EEF1A1 in clinical resected liver cancer tissues.13 Consistently, EEF1A1 was highly expressed in clear cell renal cell carcinomas (RCC) and associated with poor clinical outcomes. Knockdown of EEF1A1 impaired the viability of RCC cells.14
In contrast, EEF1A1 seems to play tumor suppressing roles in colon cancer and breast cancer. High expression of EEF1A1 was reported to predict a favorable overall survival of colon adenocarcinoma patients.15 According to the data by Lin et al, EEF1A1 mRNA levels are reduced in clinical breast ductal carcinoma specimens. Underexpression of EEF1A1 mRNA predicts poor prognosis for estrogen receptor-positive cancer patients.16 However, another study by Li et al indicated overexpressing EEF1A1 can promote breast cancer cell proliferation and invasion.17
Here we investigated the expression profile and clinical significance of EEF1A1 in DLBCL for the first time. Accordingly, high EEF1A1 is closely correlated with unfavorable overall survival of DLBCL patients. The pro-oncogenic role of EEF1A1 in DLBCL was further validated by in vitro and in vivo assays.
Methods
Online Database
The transcription profiling of EEF1A1 gene expression in DLBCL and normal lymph nodes were performed using the Gene Expression Profiling Interactive Analysis (GEPIA) database (http://gepia.cancer-pku.cn/index.html). We compared the mRNA level, which was presented as transcripts per million (TPM), from The Cancer Genome Atlas (TCGA, https://www.cancer.gov/tcga) tumors vs TCGA normal + The Genotype-Tissue Expression (GTEx, https://gtexportal.org/) normal datasets.18 The prognostic value of EEF1A1-TPM was also extracted from GEPIA database and compared by Log rank test.
Patients and Clinical Specimens
A total of 138 DLBCL tissues were acquired from Harbin The First Hospital. The median age at the time of diagnosis was 61 years and median follow-up time was 47 months (range, 6–119 months). All tissue specimens were formalin-fixed and paraffin-embedded. All diagnoses were based on pathological test. The characteristics of enrolled patients are listed in Table 1. Among all cases, 56 were female and 82 were male. Eighty-nine cases exhibited B symptoms, while the other 49 cases without B symptoms. Seventy-two cases were staged as Ann Arbor Stage I–II, and 66 cases with stage III–IV. As for the Eastern Cooperative Oncology Group Performance Status (ECOG PS), 90 cases were scored as 0 or 1, while the other 48 cases with scores larger than 1. The serum lactate dehydrogenase (LDH) level at the time of diagnosis was also retrieved. Accordingly, 69 cases exhibited normal LDH level, while the other 69 cases with elevated LDH level. The number of extra nodal involvement (ENI) was less than 2 in 91 patients, and larger than or equal to 2 in 47 patients. Twenty-two cases showed tumors with 10 cm in diameter or larger (Bulky tumor), and the other 115 cases with smaller tumor size. International Prognostic Index (IPI) was less than 3 in 93 cases, while scored as 3–5 in the other 45 cases. Finally, we assessed the Cell-of-Origin (COO) subtyping and found that 61 cases showed germinal center B cell (GCB) subtype, while the other 77 cases showed non-GCB subtype.
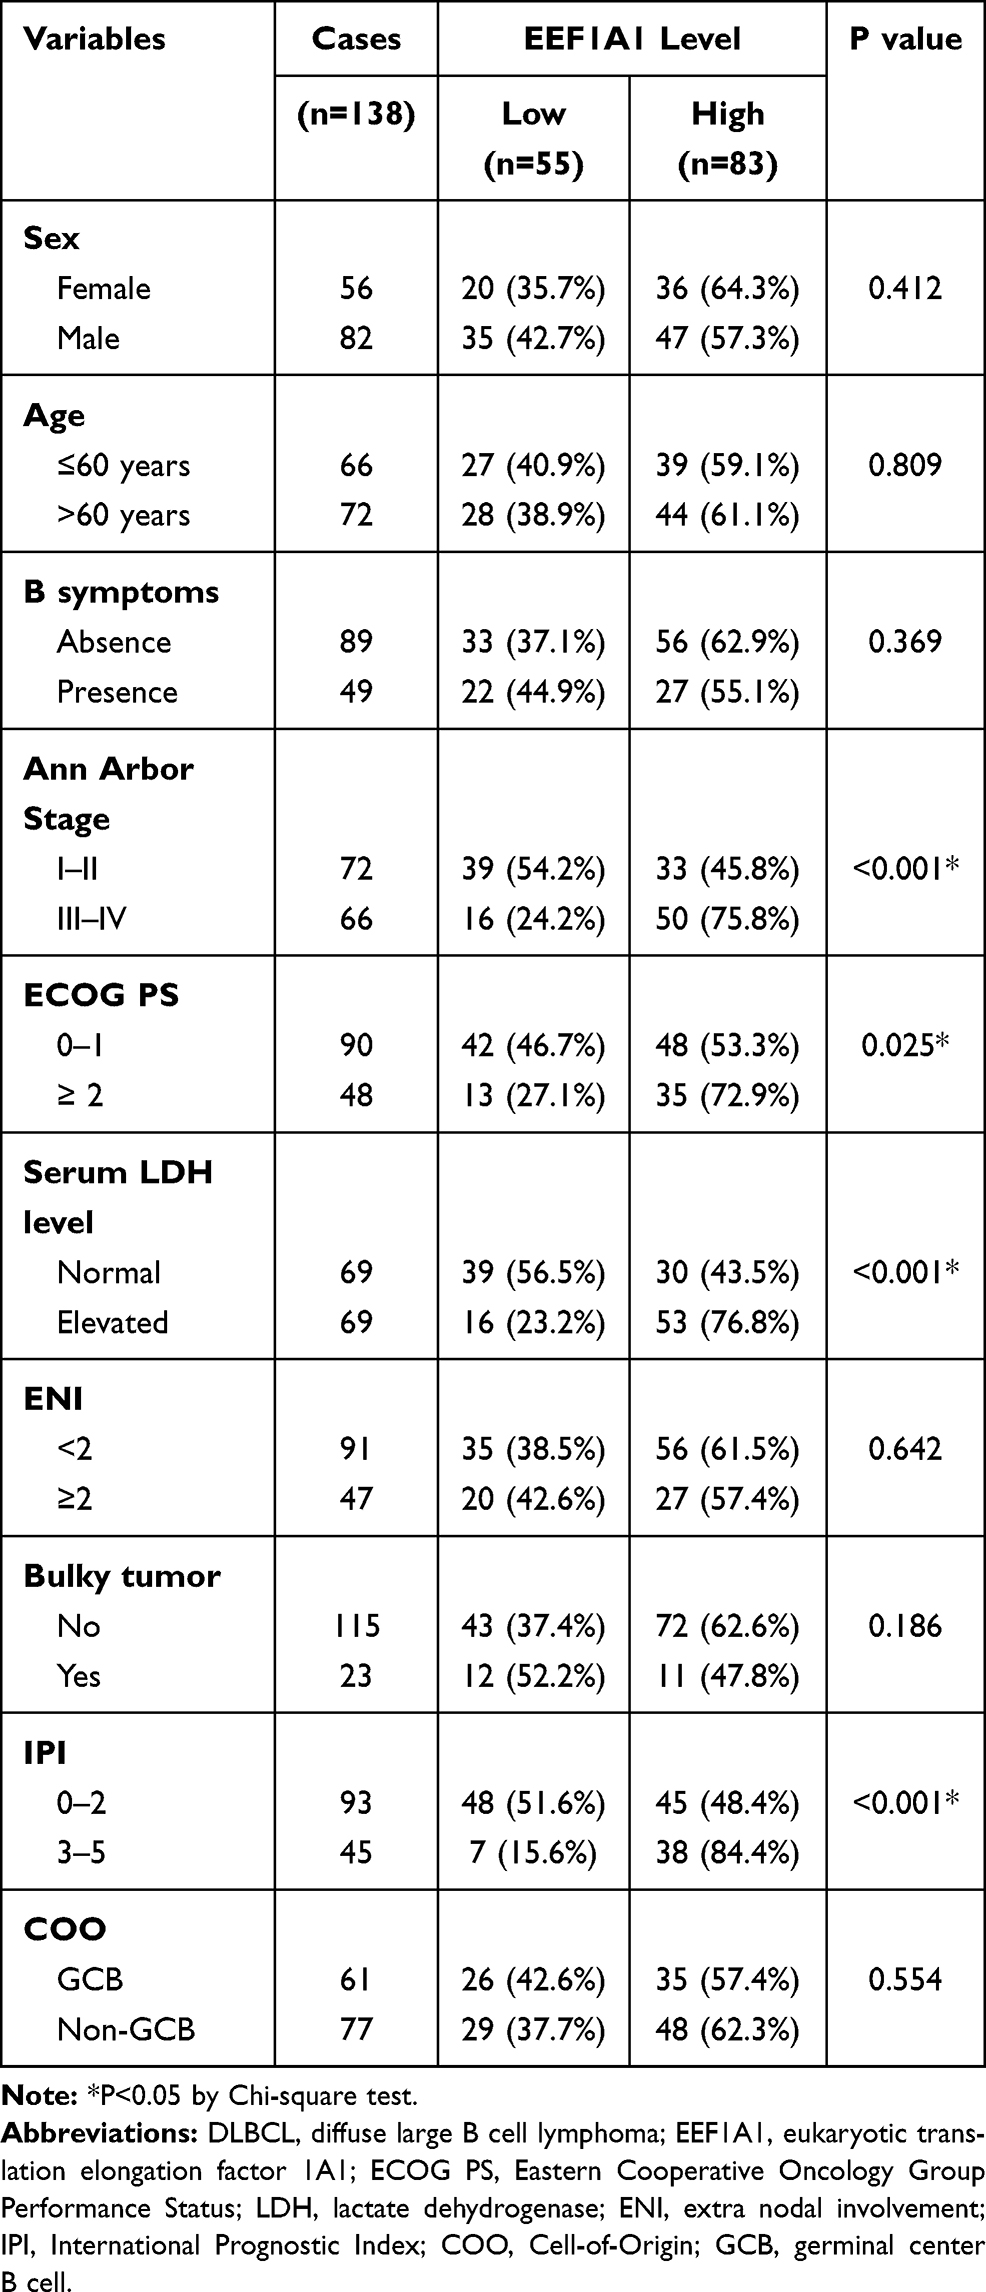 |
Table 1 Characteristics of DLBCL Patients and Their Correlations with EEF1A1 Level |
Immunohistochemistry (IHC)
IHC was conducted to explore the EEF1A protein expression level in clinical tissue samples. Briefly, the tissue sections were deparaffinized, rehydrated, and then incubated with 3% hydrogen peroxide (H2O2). Antigen retrieval was achieved by using ethylenediaminetetraacetic acid (EDTA) buffer. The tissue sections were blocked with 5% bovine serum (BSA) and then probed with anti-EEF1A1 (1:300, #sc-21758, Santa Cruz Biotechnology) at 4 °C overnight. Secondary antibody was then added and incubated. The immunoreactivity was finally detected by using the diaminobenzidine (DAB) staining reagents according to the manufacturer’s instructions.19
The IHC results were next scored regarding both staining intensity and the percentage of positive stained cells.20 Staining intensity score was given as negative staining: 1; weak staining: 2; moderate staining: 3; and strong staining: 4. Percentage of positive cells was scored as 0–25%: 1; 26–50%: 2; 51–75%: 3; and >75%: 4. The immunoreactivity score was obtained by multiplying the two scores above, ranging 0–16. Then, a receiver operating characteristic (ROC) curve was plotted to define a cut-off value for distinguishing low-EEF1A1 expression and high-EEF1A1 expression.
Cell Culture and Transfection
Human DLBCL cell lines (OCI-LY1, OCI-LY3, OCI-LY7, OCI-LY10) were acquired from the American Tissue Culture Collection (ATCC). All cells were routinely maintained in RPMI 1640 medium containing 10% fetal bovine serum (FBS). The cells were cultured in a 37 °C incubator with 5% carbon dioxide.
The shRNA targeting EEF1A1 was constructed in lentivirus vectors as described before.14 The coding region for EEF1A1 was inserted into puro-CMV vectors by Gene Pharma (Shanghai, China) for overexpressing EEF1A1. Lentivirus transduction was conducted according to the standard procedures.21 Briefly, 293T cells were firstly seeded into 10 cm dishes and cultured for 24 hours till 80% confluence. Then, 2 μg of lentivirus vector plasmids containing shRNAs were transfected into 293T cells using lipofectamine transfection reagent (Invitrogen, Carlsbad, CA) to generate lentivirus. Cell culture supernatants of 293T cells containing the lentivirus were collected at different time points (day 1, day 2) and pooled. Then, OCI-LY7 cells were transduced with appropriated amount of lentivirus collected above. Forty-eight hours post-transduction, cells were subjected to Western blot and functional assays.
Western Blotting (WB)
WB was used to test protein expression levels as previously described.22,23 Briefly, RIPA buffer was used to lyse cells and extract proteins (Thermo Fisher Scientific, USA) according to the manufacturer’s instructions. After quantifying the protein concentration and denaturing, same amount of protein samples was separated by SDS-PAGE (sodium dodecyl sulphate–polyacrylamide gel electrophoresis). The proteins were then transferred onto the PVDF (polyvinylidene fluoride) membrane, followed by incubation with primary antibody (1:1000 dilution) and goat anti-mouse secondary antibody (1:10,000 dilution). The protein level was finally visualized by testing the immunoreactivity of the PVDF membrane.
Cell Viability by CCK-8
The cell viability was detected by cell counting kit-8 (CCK-8) assay as we described previously.25 Briefly, stable transfected cells and control cells were seeded into a 96-well plate at a density of 2×10³ cells/well. After cultured at 37 °C with 5% CO2 for designated time points (8, 24, 48, 72, and 96 hours). CCK-8 reagent was then added to each well and incubated for another 2 hours. The absorbance was recorded at 490 nm on a plate reader.24 Each experiment was repeated three times.
Subcutaneous Tumor Growth in Nude Mice
Male BALB/c nude mice (4-weeks old, 15–18g) were purchased from Animal Center of Harbin The First Hospital. The mice were housed under constant temperature of 22–25°C and humidity of 55%, with standard diet and tap water. Stable transfected cells were subcutaneously injected into the nude mice (n=14, respectively). Tumor size was measured using vernier calipers every 5 days. After 4 weeks, the mice were sacrificed, and the tumors were separated and weighed.26
Statistics
Clinical correlation data was analyzed using Chi-square test. Cellular data were presented as mean ± standard deviation (SD). Data were analyzed using SPSS software and Image J software. Statistical significance was tested using Student’s t-test or one-way ANOVA test. P-value <0.05 was considered statistically significant.
Ethics
This study was conducted in accordance with the Declaration of Helsinki and approved by the Ethics Committee of Harbin The First Hospital. Written informed consents were obtained from all participants.
The animal study was approved and supervised by the Animal Center of Harbin The First Hospital and carried out in accordance with the UK Animals (Scientific Procedures) Act, 1986.
Results
The Transcriptional Level of EEF1A1 is Elevated in DLBCL and Correlated with Poor Prognosis
By extracting the transcriptional information of EEF1A1 in DLBCL and normal lymph nodes from the GEPIA online server, we found that EEF1A1 possessed more transcripts in DLBCL than that in normal lymph nodes (Figure 1A and B). We next generate the survival curve using Kaplan–Meier method to evaluate whether EEF1A1-mRNA level has any prognostic significance. As a result, higher EEF1A1 transcripts indicate poorer overall survival of DLBCL cases (Figure 1C), although the case number is limited.
 |
Figure 1 The transcriptional level of EEF1A1 is elevated in DLBCL and correlated with poor prognosis. (A and B) The transcriptional level of EEF1A1 was retrieved from GEPIA online database, showing significant enriched transcripts in DLBCLs than those in nontumorous normal lymph nodes. (C) The prognostic role of EEF1A1 transcripts on predicting DLBCL overall survival was evaluated by Kaplan–Meier method. |
Protein Expression of EEF1A1 in DLBCL and Its Correlation with Clinicopathological Characteristics
Considering the possibility of difference between mRNA and protein levels, we next set to explore the protein expression pattern of EEF1A1 in DLBCL tissues collected from our hospital (n=138). According to the IHC data, EEF1A1 exhibited predominant cytoplasm localization and slight nucleus staining. Importantly, diverse immunoreactivities among DLBCL tissues were observed (Figure 2A and B), highlighting the high heterogeneity of DLBCL. To better assess the correlations between EEF1A1 level and DLBCL progression, we defined a high-EEF1A group and a low-EEF1A group based on the IHC staining results using a ROC curve (Figure 2C). Therefore, 53 cases were subgrouped into the low-EEF1A1 group, while the other 83 cases as high-EEF1A1 expression.
 |
Figure 2 Protein expression level of EEF1A1 in DLBCL. Representative high (A) and low (B) protein immunostaining of EEF1A1 of DLBCL tissues. The ROC curve was plotted to determine a cut-off value to distinguish high- and low-EEF1A1 expression (C). * indicates P<0.05. |
As shown in Table 1, patients with more advanced tumor stages showed high EEF1A1 protein expression than those with earlier stages (P<0.001). Consistently, ECOG PS and IPI both exerted positive correlation with EEF1A1 expression (P=0.025 and P<0.001, respectively). In addition, the serum LDH level at the time of diagnosis, an important clinical predictor for DLBCL prognosis, tend to be elevated in patients with higher EEF1A1 expression (P<0.001). In contrast, no statistically significant correlation was observed between EEF1A1 with patients’ B symptoms, ENI, tumor size, nor cell origin (all P>0.05). The clinical associations imply that EEF1A1 may participate in DLBCL progression.
High EEF1A1 Protein Expression Serves as an Independent Prognostic Factor
The follow-up information of our enrolled cohort was next analyzed. By the end of follow-up, 65 cases dead. The five-year overall survival rate was 56.5% with a median survival time as 80 months (Figure 3A). Prognostic values of conventional clinicopathological characteristics as well as EEF1A1 protein level were next evaluated by Kaplan–Meier analyses (Table 2, Figure 3). Accordingly, the survival time of patients with stage III–IV was 51.6 ± 5.3 months, while was 88.3 ± 5.2 months for stage I–II patients (Figure 3B, P<0.001). Higher ECOG PS also exhibited unfavorable effect on patients’ survival. The 5-year overall survival rate of cases with ECOG PS ≥ 2 was only 22.1%, significantly lower than those with ECOG PS < 2 (70.5%; Figure 3C, P<0.001). Similarly, an elevated serum LDH level indicated a shorter overall survival time (57.6 ± 5.9 months) compared to patients with normal LDH level (84.6 ± 5.0 months, Figure 3D). Additionally, patients with extra nodal involvement (P=0.019) or non-GCB subtype (P=0.002) also exhibited poorer prognosis (Figure 3E and G). Consistent with previous studies, IPI index also showed prognostic significance on predicting patients’ survival (Figure 3F, P=0.001). Of note, the mean overall survival time of patients with high EEF1A1 protein expression was only 56.2 ± 5.2 months, leading to a 5-year overall survival rate as 43.1% (Figure 3H). In contrast, patients with lower EEF1A1 levels showed a significantly longer overall survival time (91.3 ± 5.3 months) and higher 5-year survival rate (74.7%). According to the data in our cohort, patients’ age, sex, B symptoms or tumor size exhibited no significant effect on DLBCL prognosis (Supplemental Figure S1).
 |
Table 2 Kaplan–Meier Overall Survival Analyses |
 |
Figure 3 Overall survival analyses of DLBCL patients. The overall survival curves were plotted by Kaplan–Meier method for the entire cohort (A), or based on tumor stage (B), ECOG PS (C), serum LDH level (D), ENI (E), IPI (F), COO (G), EEF1A1 expression level (H), respectively. *Indicates P<0.05 by Log rank test. |
All significant variables were then subjected into a Cox regression model to conduct the multivariate analysis except IPI score due to its involvement of other subparameters. The hazard ratio (HR) and 95% confidence interval (CI) are shown in Table 3. The advanced Ann Arbor Stage (HR=2.091, 95% CI 1.205–3.628, P=0.009), higher ECOG PS (HR=2.973, 95% CI 1.379–4.084, P=0.002), elevated serum LDH level (HR=2.008, 95% CI 1.183–3.410, P=0.010), and non-GCB subtype (HR=1.971, 95% CI 1.094–3.552, P=0.024) all independently contributed to unfavorable prognosis of DLBCL. Importantly, higher EEF1A1 was also identified as a novel independent risk factor for a poor prognosis of DLBCL patients (HR=2.091, 95% CI 1.205–3.628, P=0.009).
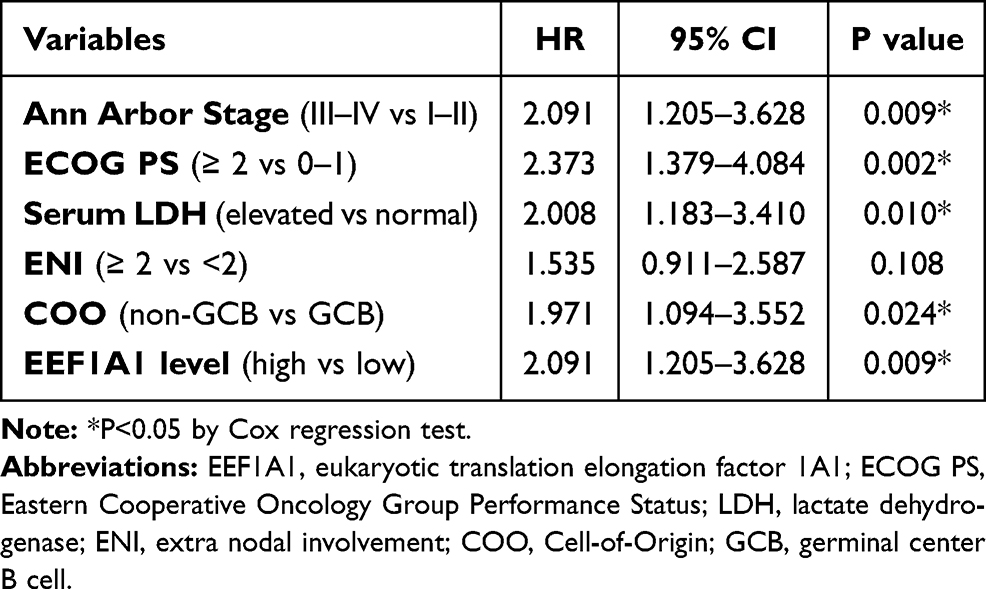 |
Table 3 Multivariate Analysis |
EEF1A1 Promotes DLBCL Growth Both in vitro and in vivo
Considering the clinical significance of EEF1A1 in DLBCL progression and prognostic prediction, we next tested its cellular role. Western blotting data demonstrated detectable but different endogenous expression levels of EEF1A1 in various DLBCL cell lines (Figure 4A). We therefore selected OCI-LY7 cell line for further experiments due to its moderate expression level. The OCI-LY7 cells stably expressed exogenous EEF1A1 or stably knocked down of EEF1A1 were established and tested by immunoblotting (Figure 4B). By assessing cell viability with CCK-8 assay, we found that overexpressing EEF1A1 significantly promoted cell proliferation, while silencing EEF1A1 exhibited an opposite effect (Figure 4C).
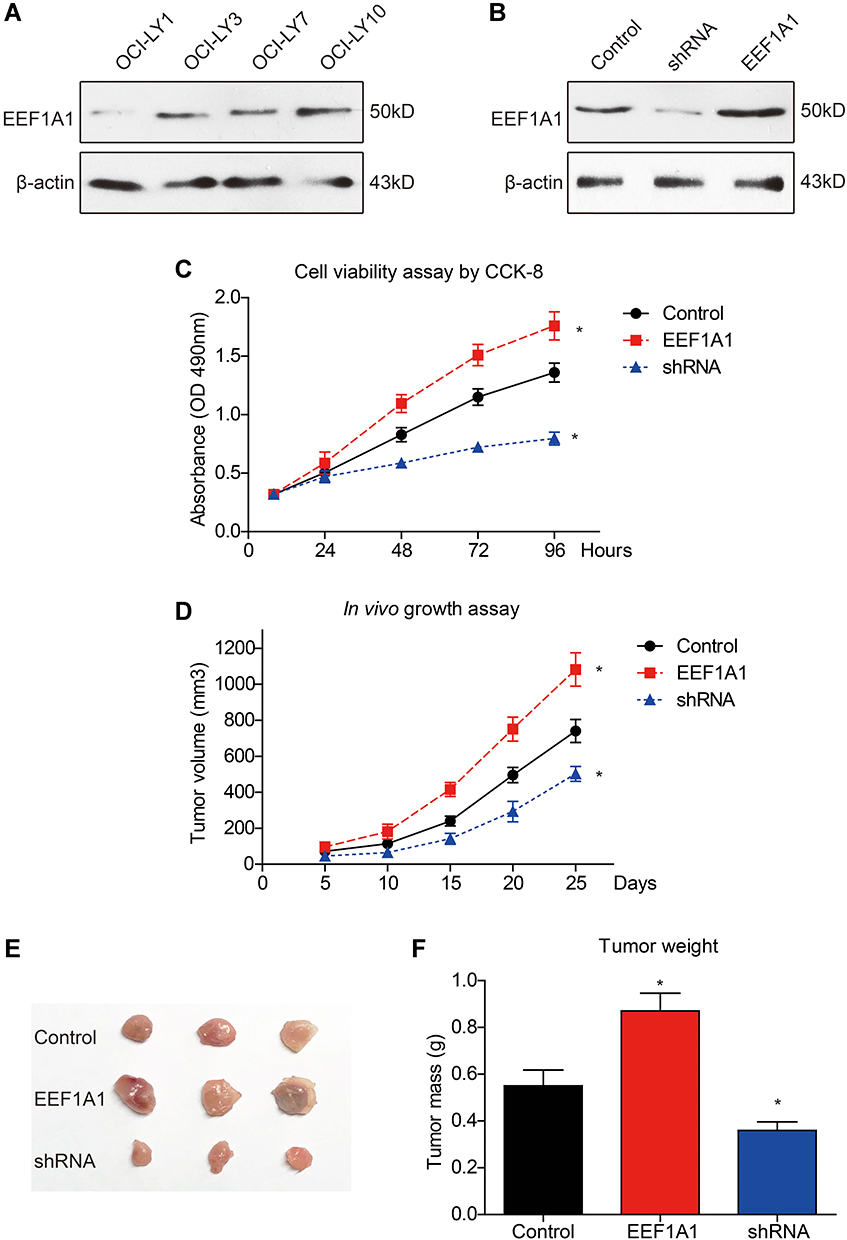 |
Figure 4 EEF1A1 promotes DLBCL growth both in vitro and in vivo. Western blotting was conducted to test the endogenous protein level of EEF1A1 in DLBCL cell lines (A). The lentivirus transduction efficiency was tested for the OCI-LY7 cells with shRNA-knockdown and EEF1A1 overexpression (B). Cell viability was tested by CCK-8 assay (C). The growth of subcutaneous implanted xenografts was monitored and plotted (D). The excised tumors were photographed (E) and weighted (F). *Indicates P<0.05 by one-way ANOVA test. |
Nude mice were then selected to establish a subcutaneous xenograft model as described in the Method section. By comparing the growth curves of implanted DLBCL, EEF1A1-overexpression group exhibited a most rapid growth speed, while the EEF1A1-shRNA group was the slowest (Figure 4D). Consistent with growth curve, isolated xenografts showed significant differences on both tumor size and tumor weight after resected at day 27 post implantation (Figure 4E and F). Taken together, our data revealed a positive role of EEF1A1 on facilitating DLBCL growth both in vitro and in vivo.
Discussion
Protein synthesis is critical for numerous physiological functions, which can be affected by many factors such as translational initiation, elongation, and termination. Disruption of protein translational steps will result in pathological disorders and diseases.27 As a translational elongation element, deregulation of EEF1A has been reported to be involved in oncogenesis, apoptosis, viral infections, et al.28 Interestingly, both the isoforms of EEF1A, namely the EEF1A1 and EEF1A2, regulate oncogenesis and tumor progression on various aspects.29,30 However, the role of EEF1A1 in different cancer types seems distinct.
Here, we firstly demonstrated the upregulated expression of EEF1A1 in DLBCL than in nontumorous lymph nodes on both mRNA and protein levels. Our data also indicated a positive correlation between EEF1A1 and DLBCL progressive characteristics, such as tumor stage and serum LDH level. Furthermore, EEF1A1 was validated as an independent prognostic predictor for DLBCL cases based on our retrospective cohort. Our data are consistent with the pro-oncogenic role of EEF1A1 in hepatocellular carcinoma (HCC) and renal cell carcinoma (RCC). As previously reported, EEF1A1 can promote HCC progression by enhancing cell proliferation without significantly affecting apoptosis,12,31 which is closely correlated with STAT1-cyclin D1-dependent cell cycle.32 Nevertheless, EEF1A1 can both promote proliferation and attenuate apoptosis in RCC by modulating activities of ERK and AKT.14 Similarly, eEF1A1 knockdown resulted in remarkable proliferation inhibition and apoptosis induction of human acute T lymphocytic leukemia cells, which may be mediated by the down-regulation of PI3K/Akt/NF-κB and PI3K/Akt/mTOR signaling pathways.33 EEF1A1 is also believed to regulate the cell apoptosis process in both tumor cells34 and nontumorous cells.35–37 Therefore, EEF1A1 is a multifaceted regulator during tumorigenesis and tumor progression.
Of note, the therapeutic value of EEF1A1 has been revealed in chronic lymphocytic leukemia,38 hepatocarcinoma,39 and breast cancer cells.40 Our results exhibited the significant effect of silencing EEF1A1 on attenuating DLBCL growth both in vitro and vivo, thus providing experimental evidence for its further investigation as a novel drug target in DLBCL treatment. Our study has several limitations. Firstly, all retrospectively enrolled cases were obtained from a single medical center and may result in regional bias. Secondly, it has been recently reported that EEF1A may exhibit dysregulated GTPase activity during tumorigenesis.41 However, here we only mapped the total protein expression pattern of EEF1A1 without testing its GTPase activity. More studies focusing on systematically illustrating its functional mechanisms will be necessary for translational medicine.
Conclusions
High EEF1A1 promotes DLBCL growth and is closely correlated with unfavorable overall survival of DLBCL patients.
Data Sharing Statement
The data regarding the current study are available on reasonable request.
Funding
There is no funding to report.
Disclosure
The authors report no conflicts of interest in this work.
References
1. Martelli M, Ferreri AJM, Agostinelli C, et al. Diffuse large B-cell lymphoma. Crit Rev Oncol Hematol. 2013;87(2):146–171. doi:10.1016/j.critrevonc.2012.12.009
2. Sant M, Allemani C, Tereanu C, et al. Incidence of hematologic malignancies in Europe by morphologic subtype: results of the HAEMACARE project. Blood. 2010;116(19):3724–3734. doi:10.1182/blood-2010-05-282632
3. Siegel R, Naishadham D, Jemal A. Cancer statistics, 2013. CA Cancer J Clin. 2013;63(1):11–30. doi:10.3322/caac.21166
4. Ma H, Luo X, Zhou P, et al. USP21 promotes cell proliferation by maintaining the EZH2 level in diffuse large B-cell lymphoma. J Clin Lab Anal. 2021;35(3):e23693.
5. Thompson CA, Ghesquieres H, Maurer MJ, et al. Utility of routine post-therapy surveillance imaging in diffuse large B-cell lymphoma. J Clin Oncol. 2014;32(31):3506. doi:10.1200/JCO.2014.55.7561
6. Sanders J, Brandsma M, Janssen GM, et al. Immunofluorescence studies of human fibroblasts demonstrate the presence of the complex of elongation factor-1 beta gamma delta in the endoplasmic reticulum. J Cell Sci. 1996;109(5):1113–1117. doi:10.1242/jcs.109.5.1113
7. Maruyama T, Nara K, Yoshikawa H, et al. Txk, a member of the non-receptor tyrosine kinase of the Tec family, forms a complex with poly(ADP-ribose) polymerase 1 and elongation factor 1alpha and regulates interferon-gamma gene transcription in Th1 cells. Clin Exp Immunol. 2007;147(1):164–175. doi:10.1111/j.1365-2249.2006.03249.x
8. Akintade DD, Chaudhuri B. Identification of proteins involved in transcription/translation (eEF 1A1) as an inhibitor of Bax induced apoptosis. Mol Biol Rep. 2020;47(9):6785–6792. doi:10.1007/s11033-020-05736-5
9. Ditzel HJ, Masaki Y, Nielsen H, et al. Cloning and expression of a novel human antibody-antigen pair associated with Felty’s syndrome. Proc Natl Acad Sci U S A. 2000;97(16):9234–9239. doi:10.1073/pnas.97.16.9234
10. Vera M, Pani B, Griffiths LA, et al. The translation elongation factor eEF1A1 couples transcription to translation during heat shock response. Elife. 2014;3:e03164. doi:10.7554/eLife.03164
11. Gu HJ, Gao CB, Gong JL, Li XJ, Bo SU, Li XN. Comparative proteomic analysis in left ventricular remodeling following myocardial infarction in rats. Biomed Environ Sci. 2012;25(1):117–123.
12. Grassi G, Scaggiante B, Farra R, et al. The expression levels of the translational factors eEF1A 1/2 correlate with cell growth but not apoptosis in hepatocellular carcinoma cell lines with different differentiation grade. Biochimie. 2007;89(12):1544–1552. doi:10.1016/j.biochi.2007.07.007
13. Chen S-L, Lu S-X, Liu L-L, et al. eEF1A1 overexpression enhances tumor progression and indicates poor prognosis in hepatocellular carcinoma. Transl Oncol. 2018;11(1):125–131. doi:10.1016/j.tranon.2017.11.001
14. Bao Y, Zhao TL, Zhang ZQ, et al. High eukaryotic translation elongation factor 1 alpha 1 expression promotes proliferation and predicts poor prognosis in clear cell renal cell carcinoma. Neoplasma. 2020;67(1):78–84. doi:10.4149/neo_2019_190224N158
15. Kim J, Kim J, Yoon N, et al. Expression of EEF1A1 is associated with prognosis of patients with colon adenocarcinoma. J Clin Med. 2019;8(11):1903. doi:10.3390/jcm8111903
16. Lin CY, Beattie A, Baradaran B, et al. Contradictory mRNA and protein misexpression of EEF1A1 in ductal breast carcinoma due to cell cycle regulation and cellular stress. Sci Rep. 2018;8(1):13904. doi:10.1038/s41598-018-32272-x
17. Li X, Chen N, Zhou L, et al. Genome-wide target interactome profiling reveals a novel EEF1A1 epigenetic pathway for oncogenic lncRNA MALAT1 in breast cancer. Am J Cancer Res. 2019;9(4):714–729.
18. Tang Z, Li C, Kang B, et al. GEPIA: a web server for cancer and normal gene expression profiling and interactive analyses. Nucleic Acids Res. 2017;45(W1):W98–w102. doi:10.1093/nar/gkx247
19. Xu J, Ji L, Ruan Y, et al. UBQLN1 mediates sorafenib resistance through regulating mitochondrial biogenesis and ROS homeostasis by targeting PGC1β in hepatocellular carcinoma. Signal transduction and targeted therapy. 2021;6(1):1–13. doi:10.1038/s41392-021-00594-4
20. Liu H, Xu Y, Zhang Q, et al. Prognostic significance of TBL1XR1 in predicting liver metastasis for early stage colorectal cancer. Surg Oncol. 2017;26(1):13–20. doi:10.1016/j.suronc.2016.12.003
21. Pfeifer A, Hofmann A. Lentiviral Transgenesis, in Gene Knockout Protocols. Springer; 2009:391–405.
22. Guo H, Zeng D, Zhang H, et al. Dual inhibition of PI3K signaling and histone deacetylation halts proliferation and induces lethality in mantle cell lymphoma. Oncogene. 2019;38(11):1802–1814. doi:10.1038/s41388-018-0550-3
23. Liu H, Gong Z, Li K, et al. SRPK1/2 and PP1α exert opposite functions by modulating SRSF1-guided MKNK2 alternative splicing in colon adenocarcinoma. J Exp Clin Cancer Res. 2021;40(1):1–16. doi:10.1186/s13046-021-01877-y
24. Zhao H, Liu X, Yu L, et al. Comprehensive landscape of epigenetic-dysregulated lncRNAs reveals a profound role of enhancers in carcinogenesis in BC subtypes. Molecular Therapy-Nucleic Acids. 2021;23:667–681. doi:10.1016/j.omtn.2020.12.024
25. Wang Z, Fang Z, Lu R, et al. MicroRNA-204 potentiates the sensitivity of acute myeloid leukemia cells to arsenic trioxide. Oncol Res. 2019;27(9):1035–1042. doi:10.3727/096504019X15528367532612
26. Chen T, Liu H, Liu Z, et al. FGF19 and FGFR4 promotes the progression of gallbladder carcinoma in an autocrine pathway dependent on GPBAR1-cAMP-EGR1 axis. Oncogene. 2021;40:1–13.
27. Taymans J-M, Nkiliza A, Chartier-Harlin M-C. Deregulation of protein translation control, a potential game-changing hypothesis for Parkinson’s disease pathogenesis. Trends Mol Med. 2015;21(8):466–472. doi:10.1016/j.molmed.2015.05.004
28. Abbas W, Kumar A, Herbein G. The eEF1A proteins: at the crossroads of oncogenesis, apoptosis. Front Oncol. 2015;5:75.
29. Lee M-H, Surh Y-J. eEF1A2 as a putative oncogene. Ann N Y Acad Sci. 2009;1171(1):87. doi:10.1111/j.1749-6632.2009.04909.x
30. Lin C-Y, Beattie A, Baradaran B, Dray E, Duijf PH. Contradictory mRNA and protein misexpression of EEF1A1 in ductal breast carcinoma due to cell cycle regulation and cellular stress. Sci Rep. 2018;8(1):1–12.
31. Liu X, Chen L, Ge J, et al. The ubiquitin-like protein FAT10 stabilizes eEF1A1 expression to promote tumor proliferation in a complex manner. Cancer Res. 2016;76(16):4897–4907. doi:10.1158/0008-5472.CAN-15-3118
32. Huang J, Zheng C, Shao J, et al. Overexpression of eEF1A1 regulates G1-phase progression to promote HCC proliferation through the STAT1-cyclin D1 pathway. Biochem Biophys Res Commun. 2017;494(3–4):542–549. doi:10.1016/j.bbrc.2017.10.116
33. Huang Y, Hu JD, Qi YL, et al. [Effect of knocking down eEF1A1 gene on proliferation and apoptosis in Jurkat cells and its mechanisms]. Zhongguo Shi Yan Xue Ye Xue Za Zhi. 2012;20(4):835–841. Chinese.
34. Blanch A, Robinson F, Watson IR, et al. Eukaryotic translation elongation factor 1-alpha 1 inhibits p53 and p73 dependent apoptosis and chemotherapy sensitivity. PLoS One. 2013;8(6):e66436. doi:10.1371/journal.pone.0066436
35. Borradaile NM, Buhman KK, Listenberger LL, et al. A critical role for eukaryotic elongation factor 1A-1 in lipotoxic cell death. Mol Biol Cell. 2006;17(2):770–778. doi:10.1091/mbc.e05-08-0742
36. Chen E, Proestou G, Bourbeau D, et al. Rapid up-regulation of peptide elongation factor EF-1alpha protein levels is an immediate early event during oxidative stress-induced apoptosis. Exp Cell Res. 2000;259(1):140–148. doi:10.1006/excr.2000.4952
37. Duttaroy A, Bourbeau D, Wang X-L, et al. Apoptosis rate can be accelerated or decelerated by overexpression or reduction of the level of elongation factor-1 alpha. Exp Cell Res. 1998;238(1):168–176. doi:10.1006/excr.1997.3819
38. Dapas B, Pozzato G, Zorzet S, et al. Effects of eEF1A1 targeting by aptamer/siRNA in chronic lymphocytic leukaemia cells. Int J Pharm. 2020;574:118895. doi:10.1016/j.ijpharm.2019.118895
39. Scaggiante B, Farra R, Dapas B, et al. Aptamer targeting of the elongation factor 1A impairs hepatocarcinoma cells viability and potentiates bortezomib and idarubicin effects. Int J Pharm. 2016;506(1–2):268–279. doi:10.1016/j.ijpharm.2016.04.031
40. Qi H, Ning L, Yu Z, et al. Proteomic identification of eEF1A1 as a molecular target of curcumol for suppressing metastasis of MDA-MB-231 cells. J Agric Food Chem. 2017;65(14):3074–3082. doi:10.1021/acs.jafc.7b00573
41. Liu S, Hausmann S, Carlson SM, et al. METTL13 methylation of eEF1A increases translational output to promote tumorigenesis. Cell. 2019;176(3):491–504.e21. doi:10.1016/j.cell.2018.11.038
 © 2021 The Author(s). This work is published and licensed by Dove Medical Press Limited. The
full terms of this license are available at https://www.dovepress.com/terms
and incorporate the Creative Commons Attribution
- Non Commercial (unported, 3.0) License.
By accessing the work you hereby accept the Terms. Non-commercial uses of the work are permitted
without any further permission from Dove Medical Press Limited, provided the work is properly
attributed. For permission for commercial use of this work, please see paragraphs 4.2 and 5 of our Terms.
© 2021 The Author(s). This work is published and licensed by Dove Medical Press Limited. The
full terms of this license are available at https://www.dovepress.com/terms
and incorporate the Creative Commons Attribution
- Non Commercial (unported, 3.0) License.
By accessing the work you hereby accept the Terms. Non-commercial uses of the work are permitted
without any further permission from Dove Medical Press Limited, provided the work is properly
attributed. For permission for commercial use of this work, please see paragraphs 4.2 and 5 of our Terms.