Back to Journals » Journal of Inflammation Research » Volume 17
Exploring the Occurrence Mechanism and Early-Warning Model of Phlebitis Induced by Aescinate Based on Metabolomics in Cerebral Infarction Patients
Authors Wang Z ![]() , Yin Y, Mu Y, Cui L, Song X, Zhuang J, Gao S, Tao X, Chen W
, Yin Y, Mu Y, Cui L, Song X, Zhuang J, Gao S, Tao X, Chen W ![]()
Received 18 September 2023
Accepted for publication 28 December 2023
Published 17 January 2024 Volume 2024:17 Pages 343—355
DOI https://doi.org/10.2147/JIR.S436846
Checked for plagiarism Yes
Review by Single anonymous peer review
Peer reviewer comments 2
Editor who approved publication: Professor Ning Quan
Zhipeng Wang,1,* You Yin,2,* Yuhui Mu,1,3,* Lili Cui,1 Xinhua Song,1 Jianhua Zhuang,2 Shouhong Gao,1 Xia Tao,1 Wansheng Chen1
1Department of Pharmacy, Second Affiliated Hospital of Naval Medical University (Shanghai Changzheng Hospital), Shanghai, 200003, People’s Republic of China; 2Department of Neurology, Second Affiliated Hospital of Naval Medical University (Shanghai Changzheng Hospital), Shanghai, 200003, People’s Republic of China; 3College of Traditional Chinese Medicine, Yunnan University of Traditional Chinese Medicine, Kunming, Yunnan, 650500, People’s Republic of China
*These authors contributed equally to this work
Correspondence: Jianhua Zhuang, Department of Neurology, Second Affiliated Hospital of Naval Medical University (Shanghai Changzheng Hospital), No. 415, Fengyang Road, Shanghai, 200003, People’s Republic of China, Email [email protected] Xia Tao, Department of Pharmacy, Second Affiliated Hospital of Naval Medical University (Shanghai Changzheng Hospital), No. 415, Fengyang Road, Shanghai, 200003, People’s Republic of China, Tel/Fax +86– 21– 81886191, Email [email protected]
Objective: This study aims to explore the mechanism underlying the induction of phlebitis by aescinate and create an early-warning model of phlebitis based on metabolomics.
Methods: Patients with cerebral infarction enrolled had been treated with aescinate. Plasma samples were collected either before administration of aescinate, upon the occurrence of phlebitis, or at the end of treatment. Non-targeted metabolomics and targeted amino acid metabolomics were carried out to analyze metabolic profiles and quantify the metabolites.
Results: Untargeted metabolomics revealed six differential metabolites in baseline samples versus post-treatment samples and four differential metabolites in baseline samples from patients with or without phlebitis. Pathways of these differential metabolites were mainly enriched in amino acid metabolism. Ten differential amino acids with a VIP value of > 1 were identified in the baseline samples, enabling us to distinguish between patients with or without phlebitis. A logistic regression model was constructed (AUC 0.825) for early warning of phlebitis of grade 2 or higher.
Conclusion: The occurrence of aescinate-induced phlebitis, which can be predicted early during onset, may be associated with perturbations of the endogenous metabolic profile, especially the metabolism of amino acids.
Keywords: aescinate, diagnostic model, mechanism, metabolomics, phlebitis
Graphical Abstract:

Introduction
Aescinate is a bioactive compound extracted from horse chestnut (Aesculus hippocastanum), a plant that is widely distributed throughout the world.1 Aescinate A and B are the main components of sodium aescinate formulations that have pharmacological efficacy benefits.2 It has anti-edema and anti-inflammatory properties and is useful for treating cerebral dysfunction and venous reflux diseases induced by edema, and it stimulates the secretion of prostaglandin 2 (PGE2) from the vascular wall,3,4 inhibits PGE1 release, and removes free radicals.5,6 Aescinate also promotes blood reflux.7–9 Clinically, aescinate is predominantly administered intravenously, with the main side effect being peripheral phlebitis. The medicine may interact with inflammatory cells and necrotic endothelial cells, resulting in phlebitis.10,11 Aescinate has a critical role in controlling edema after surgery, but more than 70% patients develop phlebitis to varying degrees at 3 to 5 days after drug administration.12
Some studies have reported that the concentration of aescinate, pH value, the carrier solution, time of infusion, osmolality, the type of peripheral intravenous catheter, and rate of infusion are critical factors inducing phlebitis,13,14 and improving these factors is beneficial to some extent.
We previously quantified aescinate A and B in human plasma, but the results revealed that the incidence and grading of phlebitis were not associated with the in vivo exposure of aescinate A and aescinate B.13 Therefore, we concluded that additional information must be gathered concerning the in vivo effectiveness of administering aescinate in the clinical setting. In this regard, we chose to utilize metabolomics for additional studies of aescinate, as this research tool constitutes a powerful method for studying changes in complex systems. Metabolomics can generate both qualitative and quantitative data for small-molecule metabolites, which allows comprehensive analysis of changes in metabolic pathways involving sugars, lipids, nucleic acids, amino acids,15 among others, in a specific biological system to explain the dynamics of the entire endogenous metabolome and ultimately reflect an organism’s overall functional state.16 Our previous results showed that the extent of in vivo exposure to aescinate A and B did not correlate with the occurrence or clinical grade of phlebitis and that alteration of the physical and/or chemical aspects of the formulation could not completely resolve the phlebitis induced by aescinate. Therefore, we applied metabolomics to explore early-warning biomarkers for phlebitis and explore its metabolic mechanisms induced by aescinate.
Materials and Methods
Patient Enrollment, Treatment and Sample Collection
Patients enrolled in this study were diagnosed with cerebral infarction and treated with sodium aescinate for injection at Shanghai Changzheng Hospital from November 2019 to July 2020. The experimental protocol was reviewed and approved by the Ethics Committee of Shanghai Changzheng Hospital. Each patient approved and signed the informed consent. The criteria for inclusion were: 1) diagnosis of cerebral infarction and treatment with sodium aescinate for injection; 2) no hemodynamic alterations or peripheral vascular disease; 3) not having been injected with any other medication in the same vein used for aescinate. Phlebitis was graded according to the INS Practice Standards for Infusion Therapy (2016).
Following admission to the study, all patients were grouped and injected intravenously with sodium aescinate formulation.13 For all patients, baseline blood samples were drawn before aescinate administration, and follow-up was performed daily after intravenous administration of sodium aescinate. If phlebitis developed, a sample of the patient’s peripheral venous blood was taken. For patients who did not develop phlebitis, blood samples were taken at the end of treatment.
UPLC-Coupled Quadrupole-Time-of-Flight (Q-TOF) Mass Spectrometry (MS) for Untargeted Metabolomics
The metabolomics assay utilized a UPLC system (ACQUITY UPLC I-Class) coupled to a quadrupole time-of-flight mass spectrometer (Xevo G2-XS). A Waters ACQUITY UPLC ®HSS T3 column (2.1 × 100 mm, 1.8 μm, Milford, MA, USA) was used for separation and quantification of endogenous metabolites. The two mobile phases were: water containing 0.1% formic acid (phase A), and methanol (phase B). The gradient elution program was as follows: 2% B for 0.25 min, then 2–98% B over 9.75 min, 98% B for 3 min, and phase B was then returned to 2% at 13.01 min, with re-equilibration at 2% B for 2 min. The total run time was thus 15 min. The flow rate was 0.4 mL/min, the injection volume was 5 μL, and the column temperature was maintained at 35°C. Each prepared sample was analyzed under both positive- and negative-ionization modes. The parameters for MS were as follows: electrospray ionization source, positive- and negative-ionization modes; capillary voltage, 3.0 kV (positive-ionization mode) and 2.5 kV (negative-ionization mode); cone hole voltage, 30 V; desolventizing gas, nitrogen; gas flow rate, 600 L/h, desolventizing temperature, 450°C; ion source temperature, 150°C; scan range, m/z 50–1200 Da; scan time, 0.35 s; collision gas, argon; scan mode, MSE continuum mode.
Sample Pretreatment for UPLC/Q-TOF-MS Analysis
A 0.8-mL aliquot of mixed extractant composed of chloroform and methanol (1:3, V:V) was added to 0.2 mL of plasma sample, and the resultant sample was mixed vigorously and stored overnight at –20°C. The next day, each mixture was subjected to centrifugation at 13,000 × g at 4°C for 10 min, and 100 μL supernatant was transferred to a 1.5-mL tube and evaporated to dryness in a SCANVAC Freeze Dryer (Labogene, Shanghai, China) at 1000 × g, 73 bar, and room temperature for 1 h. The residue was reconstituted with 0.2 mL methanol and vigorous mixing for 1 min, and the supernatant was collected after centrifugation again. To prepare the quality-control (QC) sample, a 10-μL aliquot was collected from every processed sample and mixed. The QC sample was utilized to normalize deviations of measurement.
UPLC/Q-TOF-MS Data Processing and Statistical Analysis
The raw UPLC/Q-TOF-MS data were imported into Progenesis® QI (Version 2.0) software for preprocessing, and the data were extracted between 0.25–13.01 min and normalized using all samples. The preprocessed datasets were transferred to EZinfor 3.0 or SIMCA 14.1 software for model construction and statistical analysis. The differential ions were selected based on a fold-change of >2, a variable importance in projection (VIP) value of >1, and false-discovery rate (FDR) of <0.05, and these ions were identified using Progenesis QI in the HMDB and METLIN database. Pathway enrichment was completed in Metaboanalyst 5.0. Metabolites of interest were identified based on comparisons with known standards.
Targeted Amino Acid Metabolomics Based on Liquid Chromatography (LC)-MS/MS Analysis
A targeted amino acid metabolomics method based on LC-MS/MS was developed and utilized for the simultaneous determination of 32 amino acids in plasma samples.17,18 Each plasma sample was pretreated using protein precipitation, and all analytes were separated by LC using an Agilent Zorbax SB-C18 column (150 mm × 3.0 mm, 5 μm) with a mobile phase comprising water containing 0.02% heptafluorobutyric acid plus 0.2% formic acid (phase A) and methanol (phase B). The total run time was optimized to 10 min, and all items were validated according to pharmacopeia. All the samples collected in this study were analyzed using this method after undergoing untargeted metabolomics analysis. Data processing and model construction were completed using SIMCA 14.1, GraphPad Prism 8, and SPSS 19.0.
Results
Clinical Characteristics of Patients
In total, 44 patients who presented with cerebral infarction (23 males, 21 females) were enrolled, and 88 plasma samples were collected at baseline and at the end of treatment or upon occurrence of phlebitis. The clinical characteristics of these patients are summarized in Table 1. There were only 6 patients who were not diagnosed with phlebitis after aescinate treatment; 26 patients had grade 1 phlebitis, 3 patients had grade 2 phlebitis, and 6 patients had grade 3 phlebitis.
 |
Table 1 Clinical Data of Patients Enrolled in Study |
Aescinate Alters the Metabolic Profile of Patients
The global metabolic alterations in patients treated with aescinate are presented as a principal component analysis (PCA) (Figure 1A), in which the metabolic profiles of the baseline samples and samples after treatment did not result in obvious clusters or isolated samples, whereas the QC samples were tightly clustered. We then constructed an orthogonal partial least squares–discriminant analysis (OPLS-DA) model (Figure 1B), which was verified with a permutation test carried out 200 times (Figure 1C, positive: R2 = 0.562, Q2 = –0.504; negative: R2 = 0.213, Q2 = –0.542) to further compare the metabolic profiles of different samples, and the samples clustered and were distinctly separated (positive: R2Y = 0.97, Q2 = 0.83; negative: R2Y = 0.72, Q2 = 0.46), which indicated that the administration of aescinate had changed the metabolic profiles of these patients.
 |
Figure 1 Comparisons of metabolic profiles between baseline plasma samples and plasma samples after aescinate administration, revealing significant alterations of the metabolic profile caused by aescinate. (A) PCA score plot of plasma samples at baseline and after aescinate treatment (positive). (B) OPLS-DA analysis of baseline plasma samples (Q) versus plasma samples after administration of aescinate (H), revealing clear differences in the metabolic profile. (C) A total of 200 permutation tests demonstrated the reliability of the OPLS-DA model. (D) S-plot analysis of baseline plasma samples versus plasma samples after aescinate administration to extract all reliable differential ions. (E) Loading plot analysis of baseline plasma samples versus plasma samples after aescinate administration to select the differential ions with VIP > 1. (F) Comparison of the ion intensity of differential metabolites in baseline plasma samples (Q) versus plasma samples after aescinate administration (H) (***P < 0.001, *P < 0.05). (G) Pathway enrichment analysis of differential metabolites (a: |
To further dissect the metabolic network and find the differential ions, we constructed an S-plot and identified many reliable and differential ions that contributed to the OPLS-DA model construction (Figure 1D). These ions were then extracted using a loading plot with fold-change > 2, FDR < 0.05 and VIP > 1 (Figure 1E). These ions, 17 ions from the model in negative ionization mode and 94 ions from the model in positive ionization mode, were further selected and subjected to identification using the HMDB and METLIN database. Finally, six annotated compounds,
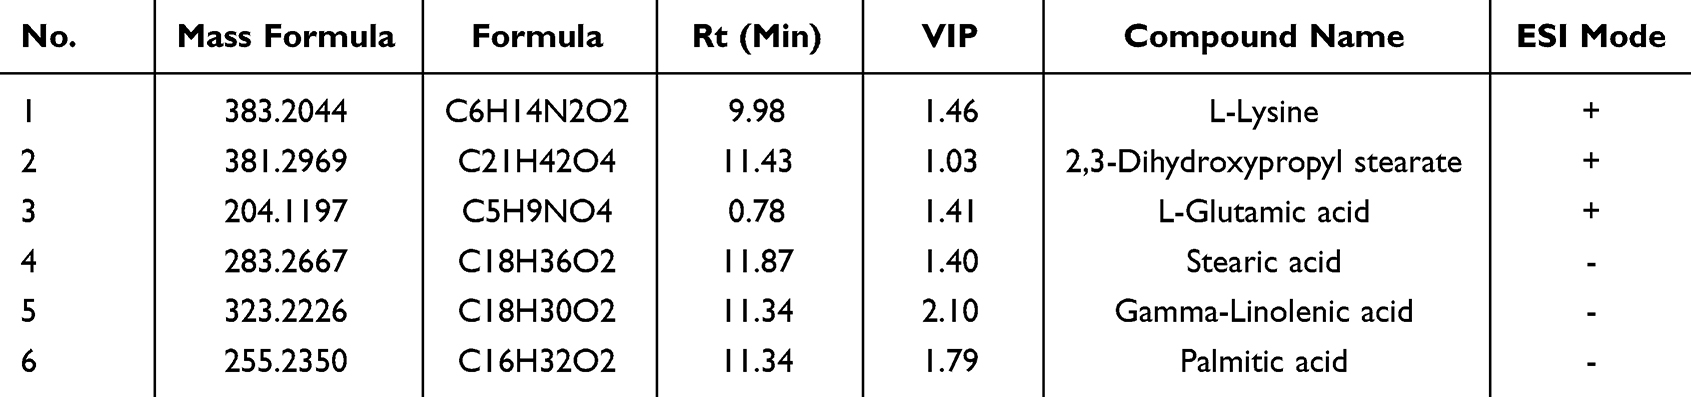 |
Table 2 Differential Endogenous Metabolites That Significant Altered by Aescinate |
An analysis of pathway enrichment was carried out for the six annotated compounds using Metaboanalyst.
The Occurrence of Phlebitis Was Associated with Aescinate-Induced Changes in the Metabolic Profile
To further analyze whether there is an association between changes in the metabolic profile and the occurrence of phlebitis, we next compared metabolic profiles between the patients with or without phlebitis in the samples collected after aescinate treatment. The resulting PCA model did not show any clusters between these two groups of patients (Figure 2A). A subsequent OPLS-DA analysis (Figure 2B) showed clear separation (positive: R2Y = 0.38, Q2 = 0.35; negative: R2Y = 0.37 and Q2 = 0.32). This model was verified with a permutation test carried out 200 times (Figure 2C; positive: R2 = 0.747, Q2 = –0.519; negative: R2 = 0.766, Q2 = –1.03). We again isolated the differential ions using S-plot and loading plot (Figure 2D and E), and identified 17 differential ions in negative ionization mode and 36 differential ions in positive ionization mode. These ions were further annotated according to their exact molecular size and fragmentors in the HMDB and METLIN database. Six compounds,
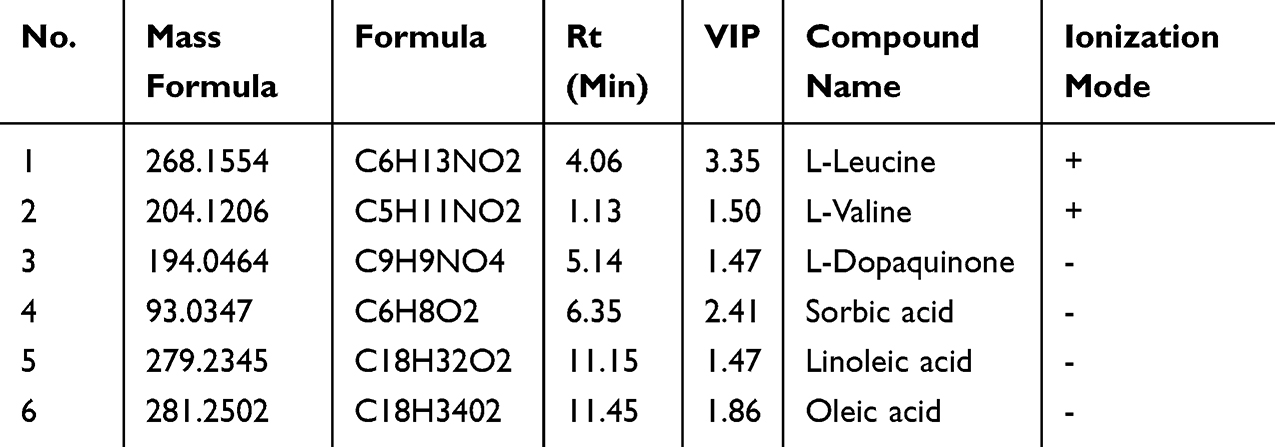 |
Table 3 Informative Summary of Endogenous Metabolites |
 |
Figure 2 Metabolic profile alterations after aescinate treatment are associated with phlebitis. (A) PCA model of samples collected after treatment with aescinate reveals that no clusters were related to the occurrence of phlebitis. (B) OPLS-DA model distinguishes between patients with or without phlebitis based on samples collected after treatment. (C) A total of 200 permutation tests demonstrated the reliability of the OPLS-DA model. (D) S-plot analysis of plasma samples from patients with or without phlebitis after administration of aescinate. (E) Loading plot shows the important ions with VIP > 1 in the model construction. (F) Comparisons of ion intensity of six compounds (**P < 0.01, *P < 0.05; F: phlebitis; WF: non-phlebitis). (G) Pathway enrichment of metabolites associated with phlebitis after administration of aescinate. a: Linoleic acid metabolism; b: aminoacyl-tRNA biosynthesis; c: unsaturated fatty acid biosynthesis; d: valine, leucine and isoleucine degradation; e: pantothenate and coenzyme A biosynthesis. |
Differences in Metabolic Profiles in Baseline Samples are Early Indicators of the Occurrence of Phlebitis
We further explored the metabolic profiles associated with baseline samples and their relationship with phlebitis using a similar analytical workflow. The PCA model constructed from baseline samples did not distinguish between patients with or without phlebitis (Figure 3A). We then constructed an OPLS-DA model (Figure 3B; positive: R2Y = 0.98, Q2 = 0.76; negative: R2Y = 0.55, Q2 = 0.23), which was verified with a permutation test carried out 200 times (Figure 3D; positive: R2 = 0.777, Q2 = –0.56; negative: R2 = 0.793, Q2 = –2.44). This model did differentiate between the patients who developed phlebitis after aescinate treatment and those who did not.
 |
Figure 3 Differential metabolites in baseline samples forewarn the occurrence of phlebitis. (A) PCA model shows the comprehensive metabolic profile of baseline samples. (B) Metabolic profile of baseline samples from patients with or without phlebitis, showing clear differences in the OPLS-DA model. (C) A total of 200 permutation tests were used to verify the OPLS-DA model. (D) S-plot of baseline plasma samples. (E) Loading analysis of baseline plasma samples from patients with phlebitis versus patients without phlebitis. (F) Comparisons of ion intensities of metabolites derived from the differential metabolic profile (***P < 0.001, **P < 0.01, *P < 0.05; F: phlebitis; WF: no phlebitis). (G) Pathway enrichment of differential metabolites focusing on the following: a: arginine and proline metabolism; b: unsaturated fatty acid biosynthesis; c: aminoacyl-tRNA biosynthesis. |
To find which compounds account for these differences in their metabolic profiles, we generated an S-plot (Figure 3C) and loading plot (Figure 3E), from which we selected 18 ions in negative ionization mode and 62 ions in positive ionization mode with VIP > 1, fold-change > 2 and FDR < 0.05. These ions were then identified according to their precise molecular weight and fragmentor structure, and four compounds,
 |
Table 4 Information Table of Endogenous Metabolites |
Construction of a Diagnostic Model to Predict Phlebitis Based on Targeted Amino Acid Metabolomics
To further explore the role of these changes in amino acid metabolism in the occurrence of aescinate-induced phlebitis, we carried out targeted amino acid metabolomics analysis on the baseline samples. A multivariate statistical analysis was carried out using SMICA 14.1. The baseline samples from patients with and without phlebitis were analyzed, and a PCA model (Figure 4A; R2X = 0.635 and Q2 = 0.315) was first developed to show the comprehensive profile. In the subsequent OPLS-DA model (Figure 4B; R2X = 0.512, R2Y = 0.735, Q2 = 0.312), verified with a permutation test carried out 200 times (Figure 4C), significant differences were displayed in a score plot, which confirmed the differences in amino acid metabolic profiles in the baseline samples. To determine which specific amino acids contributed to the model, an VIP values list (Figure 4D) were generated, and the relevant amino acids were identified, namely, Trp, Hia, Met, Sar, Ala, Kyn, Cit, Phe, Thr, Tyr and Val. However, only Asp, Cit, Pro and Arg showed significant differences between patients with or without phlebitis, and these four amino acids are involved in aminoacyl-tRNA biosynthesis; arginine biosynthesis and phenylalanine, tyrosine and tryptophan biosynthesis (Figure 4E and F, P < 0.05, Wilcoxon test or Student’s t-test). These results suggest that there are differences in amino acid profiles in baseline samples from cerebral infarction patients that may predict phlebitis after aescinate treatment.
 |
Figure 4 Multivariate statistical analysis of baseline plasma samples to screen differential amino acids for phlebitis. (A) PCA model of baseline plasma samples based on amino acid profiles from patients (F: phlebitis; WF: no phlebitis). (B) Three-dimensional view of the OPLS-DA plot of baseline plasma samples from patients with phlebitis versus patients without phlebitis (F: phlebitis; WF: non-phlebitis). (C) A total of 200 permutation tests demonstrated the reliability of the OPLS-DA model. (D) List of all amino acids contributing to model construction. (E) Metabolic pathway enrichment of differential metabolites; (a: aminoacyl-tRNA biosynthesis; b: arginine biosynthesis; c: phenylalanine, tyrosine and tryptophan biosynthesis.). (F) key amino acids in baseline plasma samples to distinguish the patients with phlebitis from those without phlebitis (**P < 0.01, *P < 0.05). |
We then explored the possibility of constructing a diagnostic model for early warning of severe phlebitis based on the differential amino acid profiles. A phlebitis grade of 2 or higher was defined as severe phlebitis, and a phlebitis grade of 1 or 0 was designated as mild phlebitis or the absence of phlebitis, respectively. A multivariate statistical analysis was completed, and the amino acids with fold-change > 2, FDR < 0.05 and VIP > 1 included Sar, Ala, Kyn, Trp, Hia, Met, Cit, Tyr, Phe, Thr and Val. We first analyzed individual amino acids with respect to diagnosing phlebitis, and the area under the receiver operator characteristic curve (AUC) varied from 0.381 to 0.765. Hia and Sar were best able to predict the likelihood of severe phlebitis (Table 5, Figure 5A). To enhance the diagnostic efficiency, we then constructed a logistic model based on all 11 amino acids. Variable enrollment and quit in the model were tested in different methods, and the backward and likelihood ratio were applied to construct the diagnostic model. Finally, only Hia and Sar were enrolled in the model. The formula of this diagnostic model was Y = –0.001 × Sar – 0.01 × Hia + 2.46, (AUC = 0.825, 95% CI: 0.696–0.955, P = 0.003), and the cutoff value was –2.03 when Youden’s index reached a maximum. The specificity and sensitivity of this model were 0.229 and 0.778, respectively (Figure 5B). This joint diagnostic model had better efficiency than that of any single amino acid for predicting severe phlebitis.
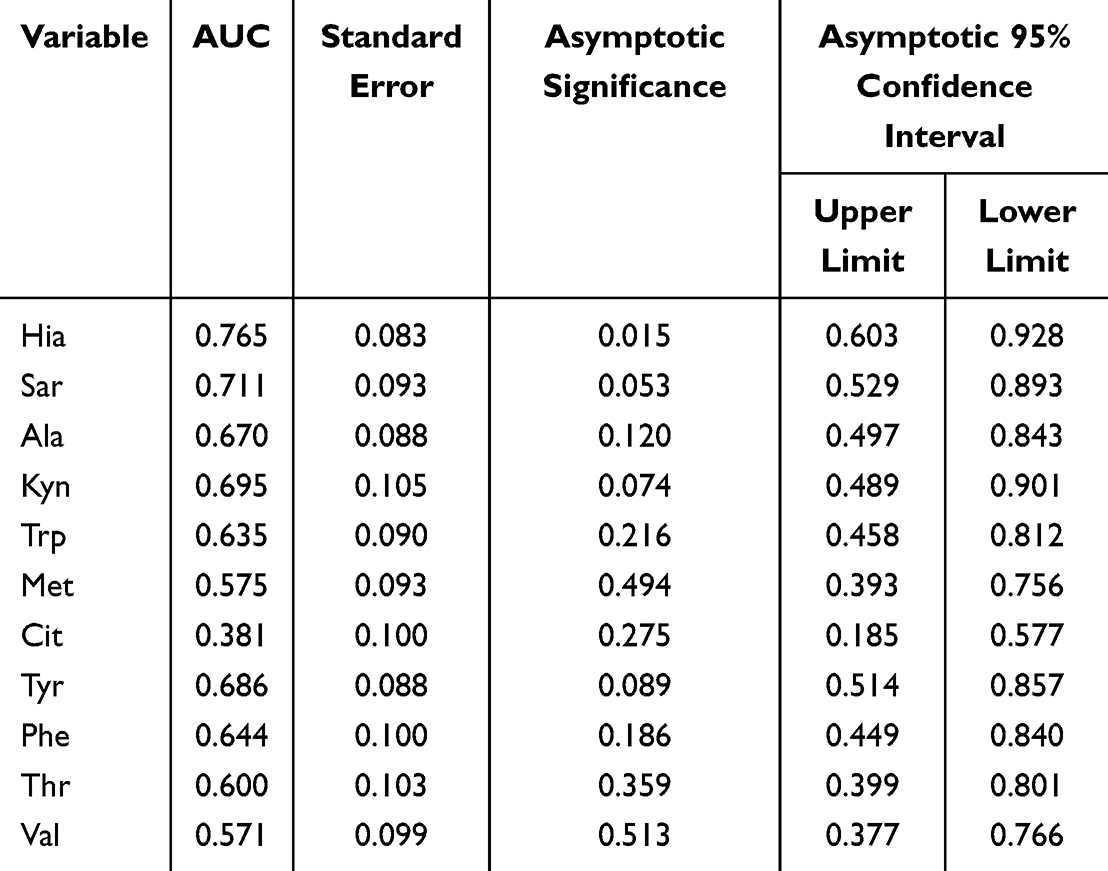 |
Table 5 Diagnostic Efficiency of Single Amino Acid for Severe Phlebitis |
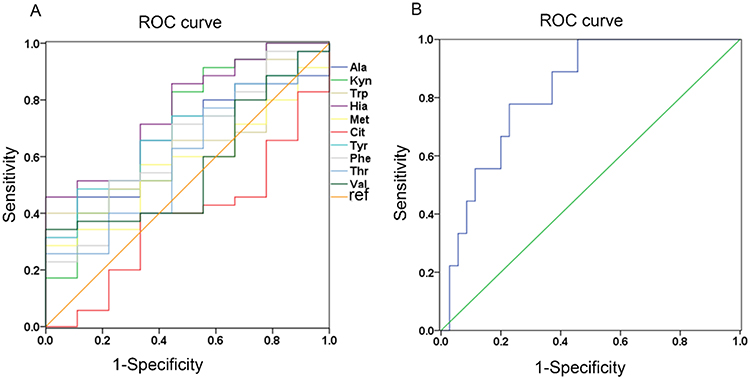 |
Figure 5 Diagnostic model for severe phlebitis (grade 2 or higher) based on targeted amino-acid profiling. (A) Efficiency of diagnosing phlebitis based on single amino acids. (B) Efficiency of diagnosing phlebitis based on the logistic regression model. Both Sar and Hia were included in the final model, and the AUC for early diagnosis of severe phlebitis was 0.825. Abbreviation: ROC, receiver operating curve. |
Discussion
Phlebitis is a common adverse reaction during the intravenous use of aescinate and other pharmaceutical treatments, and patients often suspend their treatment because of intolerance of the related pain, which thus delays the treatment of the original disease. The drug concentration, solution pH, solvents, time of administration, osmotic pressure and speed of delivery all have the potential to elicit intravascular and venous valve spasms in patients, resulting in local ischemia and hypoxic venous reactions.19 Phlebitis has been recorded20 after injection of moxifloxacin hydrochloride that was dissolved in a 5% dextrose solution as a solubilizer; the pH of a 5% dextrose solution ranges from 3.2 to 6.5, which can induce capillary and vein spasms, whereas the pH of a tolerable injectable solution ranges from 4 to 9; solutions with a lower pH are more likely to result in severe phlebitis.21 Oxaliplatin is a highly irritating chemotherapeutic drug when injected, and comparative observation of 38 patients who received oxaliplatin intravenously22 indicated that phlebitis occurred in 12 individuals, for a frequency of 31.6%. When these irritant drugs enter the vein, they usually irritate the vessel wall; dehydrate endothelial cells and create vascular hypoxia, edema and congestion, which ultimately result in vasospasms. Mannitol is an extremely permeable drug and is injected at a concentration of 20%, which is likely to cause vascular inflammation. Mannitol infusion raises blood osmotic pressure, dehydrates endothelial cells, and causes local platelet aggregation, which induces PGE1 and PGE2 expression; these PGEs can boost vascular permeability and increase leukocyte permeability, producing inflammation and vasoconstriction.23 Another reason for phlebitis is the inflammation that occurs in the vein at the site of catheter entry, which can be mechanical, chemical or infectious in origin; in such cases, appropriate equipment and choice of catheter position can help to prevent phlebitis to some extent.24
Abnormalities in the metabolism of lipids in patients are associated with a higher risk of cardiovascular disease, diabetes and hyperlipidemia; disorders of unsaturated fatty acid metabolism in patients are also closely associated with a greater inflammatory response.25 Changes in endogenous lipids were also observed in the patients treated with aescinate in this study, but these may be temporary as aescinate was not administered long term. Lysine, an important amino acid, is converted to acetyl coenzyme A during catabolism to participate in the tricarboxylic acid cycle,26 which also linked to the lipid metabolism through fatty acetyl coenzyme A. Patients who were administered with aescinate had lower levels of lysine, which may indicate a decline in the tricarboxylic acid cycle and reduced energy production.
Stearic acid and palmitic acid, two saturated fatty acids that were decreased in patients who received aescinate treatment, are involved in lipid metabolism, and stearic acid is one of the main components of long-chain saturated fatty acids, which play multiple roles in inflammation and the anti-inflammatory response and in oxidogenic and antioxidant pathways. Metabolic disorders that affect saturated fatty acids are thus likely to lead to an inflammatory response.27 Palmitic acid is the first fatty acid synthesized in long chain fatty acid anabolism. Palmitic acid can influence endothelial function and can change gene expression with respect to the vascular inflammatory response, leading to a significant increase in the level of apoptosis of vascular endothelial cells after 24 h of palmitic acid stimulation.28,29
Linoleic and oleic acid levels were higher in patients who did not develop phlebitis after receiving aescinate in our study. Linoleic acid and oleic acid are unsaturated fatty acids that exert anti-inflammatory effects through activation of AMPK and PPAR-γ, as well as inhibition of Toll-like receptors and NF-κB pathways. Linolenic acid, a fatty acid that was reduced after aescinate treatment, is also a vital fatty acid in human tissue biofilms, which is necessary for normal cell function and body resilience; it serves as the metabolic precursor for monoenolic PGEs, such as PGE1.30
The amount of Leu and Val in the blood of phlebitis patients dropped dramatically after aescinate treatment. This is consistent with a previous study that found that supplementation with Leu-rich protein for 13 weeks may attenuate the progression of chronic low-grade inflammatory features in elderly myasthenic patients with limited mobility.31 Leu stimulates mammalian rapamycin signaling pathway targets, promotes protein synthesis and enhances GFAT protein expression, thereby inhibiting nitric oxide synthesis in endothelial cells.32 Val supplemented in food can corrected liver diacylglycerols, gene expression of multiple metabolic processes, and show profound hepatoprotective effects on oxidative stress and inflammatory proteins in Ldlr-/-. Leiden mice.33 Pro, which was higher in patients who did not have phlebitis after aescinate treatment, is a cyclic non-essential amino acid that participates in the synthesis of glutamate and other amino acids, and it can lead to inhibition of antioxidant defense mechanisms that may be harmful to the vascular system.34 Alterations of these amino acids may correlate to greater inflammatory reaction.
The levels of Pro, Arg, Asp and Cit in the baseline samples derived from patients without phlebitis were significantly higher than those from the patients with phlebitis. Pro can inhibit protein association at fairly low osmolyte concentrations.35 Arg may have an impact on the metabolic processes of the immune system. Myeloid suppressor cells that produce high levels of arginase I were found to deplete plasma
In the diagnostic model based on Hia and Sar, the AUC was 0.825, and the sensitivity and specificity were 0.778 and 0.229, respectively, which was higher than that of any single amino acid. Sar can further regulate endothelial cell function associated with angiogenesis by regulating the PI3K/Akt/mTOR pathway.39 Hia, a protein-binding toxin and a biomarker for aging,40 can completely bind to albumin and may increase the exposure level of other drugs through competitive binding. Amino acids are not only components of proteins but also intermediate metabolites and signaling molecules in a variety of biosynthetic pathways. These functions of amino acids may explain the mechanism by which aescinate treatment leads to phlebitis.
This study does have some limitations. (1) The sample size is small, and most patients had mild phlebitis. (2) Levels of some of the differential compounds identified here, for example, amino acids and lipids, can be affected by diet. 3) Combined drug administration may affect human metabolism, which may have interfered with the study results. These have yet to be investigated. 4) The diagnostic model based on amino acids has not been externally validated by an independent cohort. In future studies, more patients from multiple medical centers should be enrolled to elucidate the association between phlebitis occurrence and aescinate treatment and to verify the diagnostic model.
Conclusion
In this study, untargeted metabolomics and targeted metabolomics were utilized to profile the metabolic alterations of cerebral infarction patients treated with aescinate, and the results confirmed that the alterations of amino acids metabolic profile were associated with the phlebitis induced by aescinate, which mainly enriched in  was constructed for early warning of severe phlebitis, which may optimize the clinical application of aescinate. The results of this study necessitate further studies with large sample size to verify.
CRediT Authorship Contribution Statement
All authors made significant contribution to the work reported, whether that is in the conception, study design, execution, acquisition of data, analysis and interpretation, or in all these areas; took part in drafting, revising or critically reviewing the article; gave final approval of the version to be published; have agreed on the journal to which the article has been submitted; and agree to be accountable for all aspects of the work.
Data Sharing Statement
The data generated in this study are available from the corresponding author on reasonable request.
Ethics Approval and Consent to Participate
The study protocol was approved by the ethics committee of Shanghai Changzheng Hospital and performed in accordance with the ethics standards for studies involving human subjects according to the Declaration of Helsinki and its amendments. All patients who took part in the study signed the informed consent form.
Funding
This work was supported by the National Natural Science Foundation of China (82274173, 82204819), Shanghai Municipal Health Commission (20214Y319), Shanghai Natural Science Foundation(22ZR147750), Innovative Clinical Research Project of Shanghai Changzheng Hospital (2020YLCYJ-Y02), and Science and Technology Innovation Action Plan of Shanghai Science and Technology Commission (23Y11906600).
Disclosure
The authors declare no conflicts.
References
1. Sirtori CR. Aescin: pharmacology, pharmacokinetics and therapeutic profile. Pharmacol Res. 2001;44(3):183–193. doi:10.1006/phrs.2001.0847
2. Yang YL, Liu XP, Zeng F, et al. Study on compatibility stability of sodium aescinate for injection with different solvents. J Traditional Chinese Med Pharm. 2018;24(22):62–64.
3. Wang YK, Han J, Xiong WJ, et al. Evaluation of in vivo antioxidant and immunity enhancing activities of sodium aescinate injection liquid. Molecules. 2012;17(9):10267–10275. doi:10.3390/molecules170910267
4. Zhou WX. Clinical effect of integrated traditional Chinese and Western medicine therapy in treatment of hypertensive cerebral hemorrhage. Knowl Cardiovasc Dis Prev Treat. 2012;18:22–24.
5. Song XH, Wang WH, Chen ST, et al. Application of high performance liquid-ion trap mass spectrometry in analyzing saponins in sodium aescinate. Zhongguo Zhong Yao Za Zhi. 2016;41(13):2449–2454.
6. Apers S, Naessens T, Pieters L, et al. Densitometric thin-layer chromatographic determination of aescin in a herbal medicinal product containing Aesculus and Vitis dry extracts. J Chromatogr A. 2006;1112(1–2):165–170. doi:10.1016/j.chroma.2005.10.069
7. Liu MJ. Clinical uses, adverse reactions and pharmacological researches about sodium aescinate injection. Lishizhen Medicine and Materia Medica Res. 2005;11:1158–1160.
8. Dong XH, Wang LP, Liu HP. The effect of sodium aescinate injection in treatment of deep venous thrombosis and both of the function of inflammation and endothelial cell. Chin J Thromb Haemost. 2018;24(04):580–583.
9. Bai HP. Observation and nursing of phlebitis caused by sodium aescinate for injection. Chin Remedies Clin. 2019;19(15):2697–2698.
10. Liu L, Wu X, Wu D, et al. A liquid chromatography-tandem mass spectrometry method for the simultaneous quantification of escin Ia and escin Ib in human plasma: application to a pharmacokinetic study after intravenous administration. Biomed Chromatogr. 2010;24(12):1309–1315. doi:10.1002/bmc.1441
11. Oragano CA, Patton D, Moore Z. Phlebitis in intravenous amiodarone administration: incidence and contributing factors. Crit Care Nurse. 2019;39(1):e1–e12. doi:10.4037/ccn2019381
12. Long LY, Liu WQ, Chen HZ. Experimental study on occurrence of phlebitis caused by infusion of aescinate with different concentrations and speeds. Chin Nurs Res. 2016;30(01):50–53.
13. Fei C, Han Y, Wang Z, et al. LC-MS/MS method for quantifying aescinate A and B and assessing their relationship with phlebitis. Anal Biochem. 2022;646:114636. doi:10.1016/j.ab.2022.114636
14. Zhu LL, Wang YH, Zhou Q. Progress in research on the mechanisms and interventions of phlebitis from the perspective of vascular endothelial cell and signaling pathway. J Inflamm Res. 2023;16:6469–6481.
15. Guijas C, Montenegro-Burke JR, Warth B, et al. Metabolomics activity screening for identifying metabolites that modulate phenotype. Nat Biotechnol. 2018;36(4):316–320.
16. Eid T. Harnessing metabolomics to advance epilepsy research. Epilepsy Curr. 2022;22(2):123–129.
17. Yang Y, Gao SH, Zhang F, et al. Simultaneous determination of 32 kinds of amino acids in plasma from colorectal cancer patients based on targeted ultra-high performance liquid chromatography-tandem mass spectrometry. Chin J Anal Chem. 2022;50(7):1083–1092. doi:10.19756/j.issn.0253-3820.211255
18. Yang Y, Wang Z, Li X, et al. Profiling the metabolic disorder and detection of colorectal cancer based on targeted amino acids metabolomics. J Transl Med. 2023;21(1):824.
19. Li J, Zhang YX, Lv QZ, et al. Pharmaceutical basis for making decision of intravenous administration. Chin J Ration Drug Use. 2019;16(05):194–198.
20. Xu XR. Analysis of the risk factors of drug-induced phlebitis caused by injection in our hospital. Strait Pharm J. 2019;31(12):225–226.
21. Liu S, Zhang Y, Dong SH, et al. Research progress on infusion phlebitis caused by low pH value of infusion. Chin Med Front Mag. 2009;4(22):
22. Zhao Y, Sun JH, Wei Y, et al. Observation on the effects of application of hydrocolloid dressing on the prevention of phlebitis caused by oxaliplatin. Chin J Colorectal Dis. 2018;7(02):196–197.
23. Ishibashi R, Tanaka I, Kotani M, et al. Roles of prostaglandin E receptors in mesangial cells under high-glucose conditions. Kidney Int. 1999;56(2):589–600. doi:10.1046/j.1523-1755.1999.00566.x
24. Higginson R, Parry A. Phlebitis: treatment, care and prevention. Nurs Times. 2011;107(36):18–21.
25. Qin NK. Biomarkers of Hyperuricemia Based on Untargeted and Targeted Metabolomics [D]. Bei jing University of Chinese Medicine; 2021.
26. Zhang XL, Jiang YG, Shen L, et al. Metabolomics study of aescin-induced phlebitis based on 1H-NMR. Pract Pharm Clin Remedies. 2020;23(02):143–146.
27. Jiang L, Dang WT, Zhou JG. Advances in the study of stearic acid in rheumatic diseases. Chinese J Rheumatol. 2021;25(11):762–765.
28. Man YH, Yang XL, Zhao Q, et al. Effect and mechanism of palmitic acid on gene expression related to vascular inflammatory response in EA.hy926 cells. Chin J Arterioscler. 2019;27(10):835–839.
29. Xu WH, Jin CZ, Wang XL, et al. Role of endoplasmic reticulum stress signaling pathway in high fat-induced cell apoptosis in vascular endothelial cells. Chin Pharmacol Bull. 2017;33(12):1668–1672.
30. Jia MX, Wang F. Advances in the biological function of γ-linolenic acid. Foreign Med J. 2008;01:44–47.
31. Liberman K, Njemini R, Luiking Y, et al. Thirteen weeks of supplementation of vitamin D and leucine-enriched whey protein nutritional supplement attenuates chronic low-grade inflammation in sarcopenic older adults: the PROVIDE study. Aging Clin Exp Res. 2019;31(6):845–854. doi:10.1007/s40520-019-01208-4
32. Yang Y, Wu Z, Meininger CJ, et al. L-Leucine and NO-mediated cardiovascular function. Amino Acids. 2015;47(3):435–447. doi:10.1007/s00726-014-1904-y
33. Siriwardhana N, Kalupahana NS, Cekanova M, et al. Modulation of adipose tissue inflammation by bioactive food compounds. J Nutr Biochem. 2013;24(4):613–623. doi:10.1016/j.jnutbio.2012.12.013
34. Obi AT, Stringer KA, Diaz JA, et al. 1D-¹H-nuclear magnetic resonance metabolomics reveals age-related changes in metabolites associated with experimental venous thrombosis. J Vasc Surg Venous Lymphat Disord. 2016;4(2):221–230. doi:10.1016/j.jvsv.2015.09.010
35. Eronina TB, Chebotareva NA, Bazhina SG, et al. Effect of proline on thermal inactivation, denaturation and aggregation of glycogen phosphorylase b from rabbit skeletal muscle. Biophys Chem. 2009;141(1):66–74. doi:10.1016/j.bpc.2008.12.007
36. Zea AH, Rodriguez PC, Atkins MB, et al. Arginase-producing myeloid suppressor cells in renal cell carcinoma patients: a mechanism of tumor evasion. Cancer Res. 2005;65(8):3044–3048. doi:10.1158/0008-5472.CAN-04-4505
37. Wijnands KA, Meesters DM, Van Barneveld KW, et al. Citrulline supplementation improves organ perfusion and arginine availability under conditions with enhanced arginase activity. Nutrients. 2015;7(7):5217–5238. doi:10.3390/nu7075217
38. Moinard C, Maccario J, Walrand S, et al. Arginine behaviour after arginine or citrulline administration in older subjects. Br J Nutr. 2016;115(3):399–404. doi:10.1017/S0007114515004638
39. Sudhakaran PR, Binu S, Soumya SJ. Effect of sarcosine on endothelial function relevant to angiogenesis. J Cancer Res Ther. 2014;10(3):603–610. doi:10.4103/0973-1482.137945
40. Ticinesi A, Guerra A, Nouvenne A, Meschi T, Maggi S. Disentangling the complexity of nutrition, frailty and gut microbial pathways during aging: a focus on hippuric acid. Nutrients. 2023;15(5):1138. PMID: 36904138; PMCID: PMC10005077. doi:10.3390/nu15051138
 © 2024 The Author(s). This work is published and licensed by Dove Medical Press Limited. The
full terms of this license are available at https://www.dovepress.com/terms
and incorporate the Creative Commons Attribution
- Non Commercial (unported, 3.0) License.
By accessing the work you hereby accept the Terms. Non-commercial uses of the work are permitted
without any further permission from Dove Medical Press Limited, provided the work is properly
attributed. For permission for commercial use of this work, please see paragraphs 4.2 and 5 of our Terms.
© 2024 The Author(s). This work is published and licensed by Dove Medical Press Limited. The
full terms of this license are available at https://www.dovepress.com/terms
and incorporate the Creative Commons Attribution
- Non Commercial (unported, 3.0) License.
By accessing the work you hereby accept the Terms. Non-commercial uses of the work are permitted
without any further permission from Dove Medical Press Limited, provided the work is properly
attributed. For permission for commercial use of this work, please see paragraphs 4.2 and 5 of our Terms.