Back to Journals » International Journal of General Medicine » Volume 17
Exploring the Molecular Mechanisms and Shared Gene Signatures Between Systemic Lupus Erythematosus and Bladder Urothelial Carcinoma
Authors Wang K , Wang S, Ding Y, Kou Z, Jiang B, Hou S
Received 22 November 2023
Accepted for publication 30 January 2024
Published 28 February 2024 Volume 2024:17 Pages 705—723
DOI https://doi.org/10.2147/IJGM.S448720
Checked for plagiarism Yes
Review by Single anonymous peer review
Peer reviewer comments 3
Editor who approved publication: Dr Scott Fraser
Kongjia Wang,1 Shufei Wang,2 Yixin Ding,3 Zengshun Kou,1 Bo Jiang,1 Sichuan Hou1
1Department of Urology, Qingdao Municipal Hospital, Qingdao University, Qingdao, People’s Republic of China; 2College of Clinical and Basic Medical Sciences, Shandong First Medical University & Shandong Academy of Medical Sciences, Jinan, People’s Republic of China; 3Department of Oncology, The Affiliated Hospital of Qingdao University, Qingdao, People’s Republic of China
Correspondence: Bo Jiang; Sichuan Hou, Email [email protected]; [email protected]
Background: Systemic lupus erythematosus (SLE) is a chronic autoimmune disease associated with increased susceptibility to cancer, including bladder urothelial carcinoma (BLCA). This study investigates the shared molecular mechanisms and gene signatures between SLE and BLCA, shedding light on potential biomarkers and therapeutic targets.
Methods: We compiled gene datasets related to SLE and BLCA from various databases and identified common genes. Differential gene expression analysis, protein-protein interaction networks, and hub gene identification were performed. We studied functional enrichment, immune infiltration, and transcription factor/miRNA regulation networks. We also explored gene-disease interactions and protein-chemical/drug networks. Hub gene expression levels and diagnostic values were validated in TCGA and GEO databases. Prognostic analysis was performed on the core gene MMP9 in the TCGA-BLCA database to study its prognostic value. Finally, the mRNA expression of MMP9 was verified in bladder cancer cell lines and BLCA patient blood. The diagnostic value of MMP9 for BLCA was verified by receiver operating characteristic(ROC) curve analysis of the expression of MMP9 in patients’ blood.
Results: We identified 524 common genes between SLE and BLCA, enriched in pathways related to apoptosis and cytokine regulation. Immune infiltration analysis for two diseases. Transcription factors and microRNAs were implicated in regulating these common genes. The gene-disease network linked hub genes with various diseases, emphasizing their roles in autoimmune disease and cancer. Protein-chemical/drug networks highlighted potential treatment options. Finally, our study found that MMP9 is a potential therapeutic target with diagnostic and prognostic value and Immune-related biomarkers in patients with BLCA and SLE.
Conclusion: Our study reveals shared molecular mechanisms, genetic signatures, and immune infiltrates between SLE and BLCA. MMP9 emerges as a potential diagnostic and prognostic biomarker in BLCA, warranting further investigation. These findings provide insights into the pathogenesis of SLE-associated BLCA and may guide future research and therapeutic strategies.
Keywords: systemic lupus erythematosus, bladder urothelial carcinoma, gene signatures, immune response, MMP9
Introduction
Systemic lupus erythematosus(SLE) is a chronic systemic autoimmune disease associated with high morbidity and mortality, ranging from 12 to 150 cases per 100,000 people.1,2 The clinical manifestations of SLE involve many organ systems, including skin, kidneys, bones and joints, etc. Symptoms include rash, arthritis, kidney loss, etc.3–5 It is characterized by the production of antibodies against self-antigens, resulting in the formation of immune complexes, causing multi-organ inflammation and chronic damage, and long-term chronic systemic organ damage endangers the patient’s life.6 However, infection, cancer, renal failure, cardiovascular disease, etc., have become the main factors of death in SLE patients.7–9
So far, various studies have confirmed that SLE patients have a higher risk of developing cancer in certain parts of the population than the general population.10–17 This indicates that certain high-risk factors in SLE patients lead to the occurrence and progression of certain malignant tumors, such as viral infections such as HPV and EBV, abnormal immune responses, or the application of immunosuppressants.18,19 This still seriously affects the survival of SLE patients and poses greater challenges to clinical treatment. Multiple studies have shown that SLE patients have an increased risk of bladder cancer, and the incidence of bladder cancer in SLE patients from China (SIR 19.96, 95% CI 8.02–41.12) is much higher than that in other parts of the world (SIR 3.6, 95% CI 1.4–9.7).17,20–23 This may be due to the long-term use of immunosuppressants, especially cyclophosphamide, in SLE patients. A large number of studies have proven that long-term use of cyclophosphamide can cause hemorrhagic cystitis and bladder damage and ultimately lead to bladder cancer.23,24
Bladder Urothelial Carcinoma (BLCA) is the third most common urological malignancy in the world, with high morbidity and mortality.25,26 Similar to many malignant tumors, the lifetime treatment costs of BLCA patients are high because BLCA is prone to frequent recurrences.27,28 After SLE patients develop bladder cancer, the overall prognosis is worse, and the survival period will be lower.29 Therefore, early diagnostic screening and effective treatment are crucial to identify the risk of BLCA in SLE patients. This study uses molecular biology technology and bioinformatics technology to explore the common pathways, immune infiltration, related molecules, drug prediction, etc., involved in the pathogenesis of SLE and BLCA and explore the role of core genes in diagnosis prognosis and other aspects. Our research provides molecular markers for early diagnosis and prediction of prognosis for patients with BLCA in SLE and provides therapeutic targets and theoretical basis for patient treatment.
Materials and Methods
Dataset Preparation
By searching the DisGeNET,30 comparative toxicogenomics database (CTD),31 and GeneCards databases,32 we identified genes related to BLCA and SLE. We selected supplementary datasets GSE50772 and GSE166716 from Gene Expression Omnibus (GEO) of the National Center for Biotechnology Information.33,34 In the TCGA-BLCA database, Cox regression and Kaplan-Meier methods were used to analyze the overall survival (OS) and disease-specific survival (DSS) of hub gene expression levels in BLCA patients. Predictive information from a Cell article.35
Identification of DEGs and Related Genes
Based on the scoring standards of the different databases, we collected the top 500 genes from the DisGeNET, CTD, and GeneCards databases when the number was greater than 500. Online GEO analysis tool GEO2R was used to analyze sample data for differential gene expression(DEGs).33 We utilized GEO2R to identify DEGs with |LogFC|>1 and p.adj<0.05 for GSE50772 and GSE166716. Subsequently, we integrated two gene sets related to BLCA and SLE and removed duplicate genes. Then, common related genes are obtained through the Venn diagram.
PPI Network Analysis and Hub Genes Screening
Identifying unknown protein functional modules from PPI networks is crucial for understanding protein function and interpreting key data in cell biology. PPI network analysis is a promising strategy that can provide a deeper and more comprehensive insight into the relationships between various diseases from the standpoint of protein interactions.36,37 The online analytical tool STRING was used to study protein interactions systematically and collect and integrate physical and regulatory interactions and functional relationships between proteins.38 We constructed a PPI network based on a score greater than 0.4. We analyzed and visualized the results using Cytoscape 3.9.1, an open-source project designed to integrate high-throughput data and molecular interaction networks into a unified framework.39 CytoHubba is an essential extension of Cytoscape for network topology analysis. The hub genes were selected by a plugin cytoHubba40 of Cytoscape, and then seven algorithms, Closeness, maximal clique centrality (MCC), Degree, maximum neighborhood component (MNC), Radiality, Stress, and edge percolated component (EPC) were used to confirm the final hub genes, which were visualized by Venn diagram. The online gene interaction prediction utility GeneMANIA41 was used to construct a co-expression network of identified hub genes.
GO and KEGG Pathway Enrichment Analyses
Genes related to BLCA and SLE, as well as hub genes, were enriched by GO and KEGG for functional analysis.42 Biological processes (BP), cellular elements (CC), and molecular functions (MF) were all included in the GO analysis. The top 10 GO and KEGG items with the lowest p-values were shown as bubble diagrams.
Immune Infiltration Analysis
Immune cells exhibit specific patterns of infiltration and residence. Studying the infiltration status can provide a better understanding of their role and mechanism in disease pathogenesis and can thus be applied to discovering new treatment strategies for many diseases.43 The CIBERSORT tool, based on the linear support vector regression, decomposes the expression matrix of subtypes of human immune cells for immune-immersion analysis.44 The proportion of immune cells in GSE50772 and GSE166716 were calculated, along with the relevance between immune cells and hub genes and each immune cell.
Identification of TFs and miRNAs
TFs are proteins that recognize special DNA sequences and are key cellular components forming complex regulatory systems to control gene expression.45 NetworkAnalyst conducts complex meta-analyses for gene expression and is suitable for data processing and analysis in PPI networks.46 The construction of TF–genes was based on the ENCODE ChIP-seq database, in which only peak intensity signals 500 and predicted regulatory potential scores 1 (using the BETA Minus algorithm) were utilized.47–49 In addition, we carried out topology analysis and construction of gene–miRNA networks based on miRTarBase v8.0.50
Analysis of Gene-Disease Interaction Network
DisGeNET integrates and standardizes disease-related genes and variant data, covering the whole spectrum of human diseases as well as normal and abnormal features.51 The gene–disease network was established to study diseases related to BLCA and SLE using the NetworkAnalyst platform.
Protein–Chemical and Protein–Drug Interaction Networks
Constructing protein–chemical and protein–drug networks are conducive to predicting the target information of drugs and chemicals relevant to SLE and BLCA. In the NetworkAnalyst platform, the corresponding compounds and drugs were identified and obtained using the CTD and DrugBank database.
Expression Levels and Diagnostic Value of Hub Genes in the Database
The Wilcoxon rank sum test was used to evaluate the differential expression of HUB genes in GSE50772, GSE166716, and TGCA-BLCA databases. Shapiro–Wilk normality analysis of the expression profile data of hub genes in these databases was followed by Wilcoxon signed rank analysis and Mann–Whitney U analysis. The diagnostic accuracy of hub genes was estimated using ROC curves. There is a certain accuracy when the AUC is between 0.7 and 0.9, and there is a high accuracy when the AUC is above 0.9. All the above analyses defined p< 0.05 to be statistically significant.
Clinical Statistical Analysis, Model Construction, and Evaluation of Prognosis
We compared hub genes with clinicopathological characteristics in the TCGA-BLCA database using the Wilcoxon signed rank sum test. Cox regression and Kaplan-Meier methods were used to analyze the overall survival (OS), disease-specific survival (DSS), and other clinical parameters of Hub gene expression levels in subgroup patients to study the effect of core gene expression on the prognosis of BLCA patients. Multivariate Cox analysis evaluated hub gene expression and clinical characteristics on survival. Median values established hub gene expression thresholds.
Using multivariate analysis and the Cox regression model, we created nomogram plots with independent prognostic indicators and predicted survival at 1-year, 3-year, and 5-year. Calibration analysis and calibration plots determined nomogram plot prediction accuracy.
Real-Time PCR
RT-PCR verified the mRNA expression levels of core genes in BLCA cell lines and blood of BLCA patients. With the approval of the Institutional Research Human or Animal Ethics Committee Qingdao Municipal Hospital, we collected 24 blood samples from normal individuals and 22 from patients with confirmed BLCA from Qingdao Municipal Hospital. J82 (human BLCA cells), 5637 (human BLCA cells), T24 (human BLCA cells), and SV-HUC-1 (immortalized human ureteral epithelial cells) cell lines were provided by the Cell Bank of the Chinese Academy of Sciences. The extraction of total RNA was performed on cultured cells and BLCA patient blood using the EasyPure RNA kit (ER10101; TransGen) in accordance with the procedure provided by the manufacturer. An ABI-Q3 quantitative PCR instrument (Thermo Fisher Scientific, Inc.) was used to conduct PCR. The expression level was determined using the method and adjusted against GAPDH mRNA. The primer sequences of MMP9: 5’-AGACCTGGGCAGATTCCAAAC-3’ for forward and 5’-CGGCAAGTCTTCCGAGTAGT-3’ for reverse; GAPDH: 5’-GCACCGTCAAGGCTGAGAAC-3’ is forward, 5’-TGGTGAAGACGCCAGTGGA-3’ is reverse.
Results
Identification of Shared Genes Between BLCA and SLE
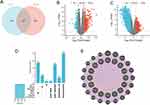
The research flow chart is shown in Figure 1. We got 524 genes related to both BLCA and SLE (Figure 2A). By searching the DisGeNET, CTD, and GeneCards databases, we identified genes associated with BLCA and SLE. We summarized the top 500 genes in each database according to the scoring criteria. Screening in GEO databases GSE166716 and GSE50772 resulted in 45,782 and 19,788 differential genes (|LogFC|>1 and p.adj<0.05) (Figure 2B and C). The genes obtained from the four databases of BLCA and SLE were then deduplicated and merged, and 2845 and 1546 genes related to them were obtained, respectively (Table 1).
 |
Table 1 Collection of BLCA and SLE-Related Genes |
PPI Network and Hub Gene Analyses
Import genes common to BLCA and SLE into STRING to create a PPI network containing 520 nodes and 16,886 edges with a PPI enrichment p-value < 1.0e-16. It was then uploaded to Cytoscape for comprehensive analysis to predict gene interactions and associated pathways. Central genes were screened through seven algorithms of the CytoHubba plugin: MCC, MNC, Degree, Closeness, Radiality, Stress, and EPC (Figure 2D) (Table 2). Each algorithm selects the top 30 genes and finally obtains the common genes of each algorithm as hub genes (16 in total: TP53, AKT1, TNF, ALB, IL6, IL1B, JUN, VEGFA, INS, CASP3, STAT3, FN1, MAPK3, IL10, MMP9, and CXCL8). The interaction between HUB genes is shown in Figure 2E.
 |
Table 2 Top 30 Hub Genes in Seven Algorithms |
GO and KEGG Pathway Enrichment Analyses
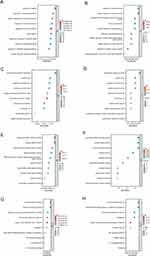
GO and KEGG pathway enrichment were performed on shared genes and Hub genes to examine their biological roles and signaling pathways. Figure 3 shows the top 10 terms with the lowest p-value in the BP, CC, MF, and KEGG pathways enriched by consensus genes and Hub genes. The Hub gene BP pathway mainly involves response to oxidative stress, cellular response to oxidative stress, etc (Figure 3A). The shared gene BP pathway mainly involves regulating the apoptotic signaling pathway, lipopolysaccharide response, and cell-cell adhesion regulation (Figure 3B). The Hub gene CC includes endoplasmic reticulum lumen, etc (Figure 3C). The shared gene CC includes the outside of the plasma membrane and some lumen, such as secretory granules, cytoplasmic vesicles, etc. (Figure 3D). The Hub gene MF includes growth factor activity, cytokine activity, etc (Figure 3E). The shared gene MF contains cytokine receptor binding, cytokine activity, etc. (Figure 3F). The Hub gene KEGG enrichment analysis pathways show that they are related to Lipid and atherosclerosis, Hepatitis B, Pertussis, etc (Figure 3G). Furthermore, The shared gene KEGG analysis showed that most pathways were related to immunity, cancer, and infection-related diseases (Figure 3H). All results are visualized using bubble charts, which indicates that shared genes and hub genes May be involved in immune-related functions and pathways, thereby affecting the progression of BLCA and SLE.
Immune Infiltration Analysis
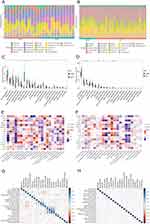
The CIBERSORT algorithm was used to analyze immune infiltration in BLCA and SLE patients. First, we analyzed the proportion of 22 types of immune cell infiltration in BLCA and SLE patients and controls (Figure 4A and B). In the immune cell infiltration of BLCA patients and normal people, T cells follicular helper, NK cells resting, and Dendritic cells activated cell infiltration increased, but T cells CD4 memory resting, Mast cells resting, T cells gamma delta, and Monocytes cell infiltration decreased (p<0.05, Figure 4C). Compared with normal people, SLE patients had increased cell infiltration of Monocytes, Neutrophils, Plasma cells, and Dendritic cells activated, while decreased cell infiltration of NK cells resting, T cells CD4 memory resting, T cells CD4 naive, and Mast cells resting (p<0.05, Figure 4D). The correlation between hub genes and various immune cells in BLCA shows that neutrophils cells are positively correlated with Mast cells activated, Macrophages M0, and Eosinophils cells, and Mast cells resting cells are positively correlated with T cells follicular helper, NK cells resting and Dendritic cells activated cells are negatively correlated (Figure 4E). Correlation analysis between various immune cells in SLE showed that mast cells’ resting cells and activated cells were negatively correlated (Figure 4F). The correlation between immune cells and hub genes in BLCA showed that B cell memory was negatively correlated with FN1, IL10, IL1B1TNF, MMP9, and MAPK3. Dendritic cells activated cells are negatively correlated with CXCL8, FN1, IL10, IL1B, IL6, TNF, STAT3, and MMP9. Macrophages M0 cells are positively correlated with CXCL8, IL1B, MMP9, and TNF. T cells CD4 memory activated cells were positively correlated with CXCL8, FN1, IL1B, IL6, MMP9, and TNF (Figure 4G). The correlation between various immune cells and hub genes in SLE shows that Mast cells resting cells are positively correlated with CXCL8, IL1B, IL6, JUN, MMP9, and TNF. Neutrophils cells are positively correlated with AKT1, CXCL8, IL1B, IL6, JUN, MAPK3, MMP9, STAT3, TNF and VEGFA. NK cells activated cells are positively correlated with CXCL8, IL1B, IL6, JUN, and TNF. Mast cells resting cells were negatively correlated with CXCL8, IL1B, IL6, JUN, MMP9, and TNF. T cells CD4 memory resting cells are negatively correlated with CXCL8, FN1, IL10, IL1B, INS, JUN, MAPK3, MMP9, and TNF. T cells CD4 naive cells are negatively correlated with FN1, IL10, IL1B, INS, JUN, MAPK3, MMP9, TNF., negatively correlated with VEGFA (Figure 4H).
Construction of Gene Regulatory Networks
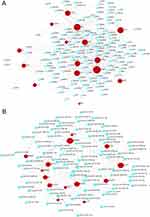
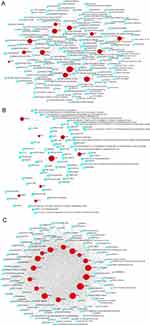
We utilized a network-based method to decipher the regulatory TFs and miRNAs to identify the major variations at the transcriptional level and further investigate the important protein regulatory molecules. The TF-gene network contains 248 nodes and 556 edges. These TFs includedK LF16, GATAD2A, MXD4, and ARID4B etc. (Figure 5A). The miRNA-gene network contains 459 nodes and 600 edges. The miRNAs binding to multiple hub genes were hsa-mir-106a-5p, hsa-mir-34a-5p, hsa-mir- 155-5p, hsa-mir-203a-3p, and hsa-let-7c-5p etc. (Figure 5B).
Gene–Disease Interaction Network
The development of technology and solutions for disease treatment begins with studying the links between diseases and genes; the interrelationships between different diseases usually require one or more similar genes. Based on DisGeNET, the results showed that the gene–disease network was linked to at least 13 hub genes. The following diseases had the strongest coordination with the hub genes studied: Prostatic Neoplasms, Stomach Neoplasms, Mammary Neoplasms, Acute kidney injury, Arthritis, Experimental, Neoplastic Cell Transformation Inflammation, and Psoriasis (Figure 6A). It is worth noting that most of these diseases are related to inflammation or immune response and tumors, which has implications for developing mechanisms and treatments of BLCA and SLE.
Protein-Chemical and Protein-Drug Interaction Networks
Constructing protein–chemical and protein–drug interaction networks contributes to exploring the biological functions of proteins in cells and researching potential drugs. The top ten drugs in the Protein-Drug Network include Minocycline, Arsenic trioxide, Ibudilast, Pseudoephedrine, Glucosamine, Dilmapimod, Talmapimod, VX-702, Andrographolide and CRx-139 (Figure 6B). Most drugs treat autoimmune diseases, inflammatory drugs, and chemotherapy drugs targeting tumors. The top ten chemicals were bisphenol A, Cadmium, Estradiol, Hydrogen Peroxide, resveratrol, Glucose, sodium arsenite, Quercetin, Tretinoin, and Zinc, demonstrating their tight association with BLCA and SLE (Figure 6C). The results suggest that these drugs can be used to treat BLCA and SLE patients.
Expression and Diagnostic Value of Hub Gene
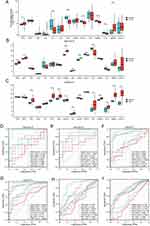
We found in the TCGA-BLCA database with a larger sample size that there were statistical differences in the expression of TP53, IL6, JUN, STAT3, MAPK3, IL10, and MMP9 (Figure 7A). In the BLCA database GSE166716, TP53, AKT1, VEGFA, INS, and CASP3 expressions were higher in BLCA patients than in normal controls (Figure 7B). In the SLE database GSE50772, the expressions of TNF, IL1B, JUN, VEGFA, INS, FN1, MAPK3, IL10, MMP9, and CXCL8 were higher in SLE patients than in normal controls (Figure 7C).
The ROC curve analyzed the diagnostic value of Hub genes. The BLCA database GSE166716 contains nine genes with AUC values >0.7 (Figure 7D and E). In the SLE database GSE50772, there were ten genes with AUC values > 0.7, indicating that these genes had a certain accuracy in predicting SLE and normal outcomes (Figure 7F and G). In order to further verify the diagnostic performance of hub genes, we verified in the TCGA-BLCA database and found six genes with AUC values >0.7 (Figure 7H and I).
MMP9 is a Prognostic Hub Gene
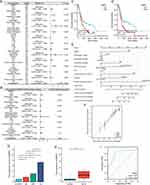
By analyzing the expression of hub genes and prognostic OS, we finally identified MMP9 as the core gene. We performed Univariate and multivariate Cox regression for common clinical-pathological factors. TNM stage, age, pathologic stage, lymphovascular invasion, subtype, primary therapy outcome, and MMP9 statistically differed (p<0.05, Figure 8A). Finally, The statistically significant results were chosen for further investigation, leading to the execution of a multivariate Cox regression analysis (Figure 8B). This analysis revealed that MMP9, lymphovascular invasion, and primary therapy outcome remained statistically significant (p<0.05) and that elevated MMP9 expression independently contributes to the risk of overall survival in patients with BLCA. In the TCGA-BLCA database, the expression of MMP9 was elevated in BLCA patients. Although it may be due to the low sample size, the expression difference of MMP9 in the GSE166716 database was not statistically significant. By K-M prognostic analysis of MMP9, the MMP9-high group exhibited a comparatively inferior OS rate (HR=1.43, P=0.017, Figure 8C). The survival findings of DSS (HR=1.61, P=0.010) show that tumor patients with high MMP9 expression were at risk (Figure 8D).
Based on the multivariate Cox regression analysis, we created a prognostic nomogram using TNM stage, age, pathologic stage, lymphovascular invasion, subtype, primary therapy outcome, and MMP9 to quantify the prognosis of BLCA patients with 0.716 (0.668–0.764) of C-index, indicating moderate accuracy (Figure 8E). After that, we produced the calibration graph in Figure 8F to test the model’s prediction accuracy. The deviation correction line is near the ideal curve (45°), and the projected value matches the actual value.
Finally, we selected three BLCA cell lines and one normal bladder urothelial cell line for preliminary verification by RT-PCR. The results showed that the expression of MMP9 was increased in the three BLCA cell lines (Figure 8G). Then, we measured the level of MMP9mRNA in the patients’ blood by PT-PCR, and we found that the expression of MMP9 in patients diagnosed with BLCA was significantly higher than that in normal blood (Figure 8H). Then, ROC analysis showed the AUC value of 0.812. This shows that MMP9 has a certain accuracy in predicting outcomes (Figure 8I).
Discussion
Systemic Lupus Erythematosus (SLE) is a prevalent autoimmune inflammatory connective tissue disease.52 It exhibits a high incidence rate and follows a chronic course. While it may not pose an immediate threat to the patient’s life, the susceptibility to infections, increased cancer risk, and the chronic damage inflicted on various organs during its progression can cause considerable suffering and pose a substantial threat to the patient’s overall well-being, resulting in a markedly elevated mortality rate.53,54 Many studies have proven that SLE is a high-risk factor for malignant tumors. Compared with the general population, SLE patients have a three-fold increased risk of malignant tumors. The use of immunosuppressants may be a major reason for the high incidence of malignant tumors in SLE patients.55,56
It has been established that both autoimmune diseases and cancer are linked to genetic alterations, suggesting a potential genetic correlation between the two. A meta-analysis of gene sets investigating the genetic interplay between SLE and lung cancer revealed a significant association of a KEGG pathway containing SLE-related genes with lung cancer.57 This discovery motivates us to delve deeper into the genetic underpinnings of the connection between SLE and cancer pathogenesis. We obtained SLE and BLCA disease-related genes from multiple databases and obtained common genes through intersection. Functional enrichment studies conducted on shared genes showed that these genes were significantly enriched in regulating apoptosis signaling pathways, lipopolysaccharide response, cell-cell adhesion, and cytokine activity. Studies have suggested that chronic myelogenous leukemia and SLE are related to disorders of apoptosis-related pathways.58 The characteristics of malignant tumors that invade the periphery are related to the initiation of the epithelial-to-mesenchymal transition program, in which the cell adhesion function is negatively regulated.59 Cytokines play an important role in the development of tumors and SLE. The tumor immune microenvironment is a complex microenvironment composed of cells and molecules such as tumor cells, immune cells, and various cytokines. It shapes the biological behavioral characteristics of tumor cells.60 The development of the SLE disease process reflects the body’s immune system functional changes. Research shows that the pathogenesis of SLE involves the interaction of IL-17 cytokines with various T and B cells.61 In addition, studies have proven that the expression of BAFF and APRIL is increased in patients with SLE and non-Hodgkin lymphoma, suggesting that the BAFF/APRIL axis may regulate immune dysfunction in SLE patients and is closely related to non-Hodgkin lymphoma.62–64 Therefore, we found that immune cell dysfunction is a potential common mechanism in the occurrence of SLE and BLCA diseases. Through immune infiltration analysis, we also confirmed that SLE and BLCA had significantly different immune cell infiltration than the control group.
Changes in immune cell function are inseparable from the regulation of genetic material. Epigenetic changes may be important factors driving the simultaneous development of autoimmune diseases and malignancies. As the first type of non-coding RNA discovered, miRNAs regulate gene expression at the post-transcriptional level and have been extensively and deeply explored in the research of autoimmune diseases and cancer. miRNAs can regulate the expression of key genes in cells and accelerate the damage of renal mesangial cells in lupus nephritis. In addition, miRNAs can also promote SLE disease progression by regulating the production of various cytokines (such as IL-10) and the activity of immune cells.65 MiRNAs can also regulate various immune cells in the tumor immune microenvironment through epigenetic modification, forming a suppressive anti-tumor immune microenvironment. Exploring these miRNAs can help develop targeted drugs to block different cancer-promoting genes.66 Our study examined the relationship network between genes and miRNAs through common hub genes and confirmed that they include hsa-mir-106a-5p, hsa-mir-34a-5p, hsa-mir- 155-5p, hsa-mir-203a- The potential effects of 3p, hsa-let-7c-5p and other miRNAs on SLE and BLCA. In addition, our study also found that transcription factors, including k LF16, GATAD2A, MXD4, and ARID4B, are closely related to the common hub genes of SLE and BLCA and have the potential to regulate expression. Traditional SLE treatment usually uses nonsteroidal anti-inflammatory drugs (NSAIDs), antimalarial drugs, glucocorticoids, or immunosuppressants. Because these drugs can cause many adverse reactions,67,68 our explorations will help develop new targeted drugs to solve the problems of traditional SLE drugs, such as high side effects and resistance to anti-cancer drugs.
By analyzing the expression of hub genes and prognostic OS, we finally identified MMP9 as the core gene. MMP9 belongs to the matrix metalloproteinases (MMPs) family and is involved in the degradation of extracellular matrix proteins, regulating inflammation-related analysis pathways, and regulating the activities of chemokines and cytokines. These pathways are closely related to cancer, inflammation, and body immunity.69–71 Our pathway enrichment analysis confirmed that key genes are involved in important pathways such as apoptosis, oxidative stress, and cytokine regulation. MMP9 is of interest in SLE. Studies have shown that abnormal methylation levels of the MMP9 promoter sequence were found in patients with lupus nephritis, and MMP9 expression was increased. The DNA methylation level of MMP9 is related to SLE disease activity indicators (such as anti-dsDNA antibody complement levels).72–76 At present, the clinical diagnosis of SLE mainly relies on serological markers, such as anti-smith (anti-sm) Antibodies, anti-double-stranded DNA (anti-dsDNA) antibodies, antinuclear antibodies (ANAs), etc., have the disadvantage of low sensitivity.77,78 The high risk of cancer in SLE and the insufficient sensitivity of clinical indicators urgently require more accurate methods. Biological markers that are high and suggestive of cancer risk. This suggests that MMP9 can be a biomarker for monitoring SLE’s renal damage and disease activity. Our study confirmed the high expression of MMP9 in BLCA through bulkRNA-seq data, BLCA cell lines, and clinical serum samples. TCGA-BLCA data analysis suggests that high MMP9 is associated with poor prognosis in BLCA patients. In summary, MMP9 has a potential diagnostic role in SLE and BLCA, and further experiments are needed to confirm its molecular mechanism in promoting pathogenesis.
In summary, our study is the first to explore the genetic characteristics of SLE and BLCA at the genetic level, and we found that these genes are significantly related to both diseases at the cellular function level. Exploring essential hub genes and core genes can help develop new biomarkers and potential diagnostic and therapeutic targets to reduce the increased risk of BLCA in SLE disease.
There are certain restrictions on this research. The databases used come from various countries worldwide, and we only conducted preliminary validation in Chinese patients, so there are potential ethnic differences. Although this study provides important preliminary findings, its sample size is relatively small, and future validation of these results in a broader patient population is needed. The mRNA level has only been verified in the blood of BLCA patients, which has certain limitations. In the future, mRNA and protein levels can be measured in the blood of BLCA and SLE patients. It is uncertain whether using a single biomarker would provide enough accuracy for prediction and diagnosis.
Conclusion
In conclusion, our investigation illuminates shared molecular mechanisms between Systemic Lupus Erythematosus (SLE) and Bladder Urothelial Carcinoma (BLCA), shedding light on potential diagnostic and therapeutic avenues. Sixteen hub genes are involved in the pathogenesis of SLE and BLCA. This study also highlights the importance of aspects related to immune infiltration between SLE and BLCA. Furthermore, enrichment analysis results and different interaction networks revealed common molecular mechanisms between SLE and BLCA. Further findings suggest that MMP9 is a promising diagnostic and prognostic biomarker in BLCA, providing potential insights into its molecular mechanisms and therapeutic implications.
Data Sharing Statement
The dataset presented in this study is available in the online repositories. The name and accession number of the repositories can be found in the article.
Ethics Approval
This study was performed in line with the principles of the Declaration of Helsinki. Approval was granted by the Institutional Research Human or Animal Ethics Committee Qingdao Municipal Hospital. The patients gave their oral and written informed consent.
Acknowledgments
All claims expressed in this article are solely those of the authors and do not necessarily represent those of their affiliated organizations or those of the publisher, the editors, and the reviewers. Any product that may be evaluated in this article or claim that may be made by its manufacturer is not guaranteed or endorsed by the publisher.
Author Contributions
All authors made a significant contribution to the work reported, whether that is in the conception, study design, execution, acquisition of data, analysis and interpretation, or in all these areas; took part in drafting, revising or critically reviewing the article; gave final approval of the version to be published; have agreed on the journal to which the article has been submitted; and agree to be accountable for all aspects of the work.
Disclosure
The authors declare no competing interest in this work.
References
1. Asmwp T, Bultink IEM. New developments in systemic lupus erythematosus. Rheumatology. 2021;60(Suppl 6):vi21–vi28. doi:10.1093/rheumatology/keab498
2. Durcan L, O’Dwyer T, Petri M. Management strategies and future directions for systemic lupus erythematosus in adults. Lancet. 2019;393(10188):2332–2343. doi:10.1016/S0140-6736(19)30237-5
3. Gayed M, Bernatsky S, Ramsey-Goldman R, Clarke A, Gordon C. Lupus and cancer. Lupus. 2009;18(6):479–485. doi:10.1177/0961203309102556
4. Lazar S, Kahlenberg JM. Systemic lupus erythematosus: new diagnostic and therapeutic approaches. Ann Rev Med. 2023;74(1):339–352. doi:10.1146/annurev-med-043021-032611
5. Tsokos GC. Systemic lupus erythematosus. New Engl J Med. 2011;365(22):2110–2121. doi:10.1056/NEJMra1100359
6. Tian J, Zhang D, Yao X, Huang Y, Lu Q. Global epidemiology of systemic lupus erythematosus: a comprehensive systematic analysis and modelling study. Ann Rheumatic Dis. 2023;82(3):351–356. doi:10.1136/ard-2022-223035
7. Maroz N, Segal MS. Lupus nephritis and end-stage kidney disease. Am J Med Sci. 2013;346(4):319–323. doi:10.1097/MAJ.0b013e31827f4ee3
8. Knight JS, Kaplan MJ. Cardiovascular disease in lupus: insights and updates. Curr Opinion Rheumatol. 2013;25(5):597–605. doi:10.1097/BOR.0b013e328363eba3
9. Choi MY, Flood K, Bernatsky S, Ramsey-Goldman R. Clarke AE: a review on SLE and malignancy. Best Pract Res. 2017;31(3):373–396. doi:10.1016/j.berh.2017.09.013
10. Wu Y, Hou Q. Systemic lupus erythematous increased lung cancer risk: evidence from a meta-analysis. J Cancer Res Ther. 2016;12(2):721–724. doi:10.4103/0973-1482.172115
11. Ni J, Qiu LJ, Hu LF, et al. Lung, liver, prostate, bladder malignancies risk in systemic lupus erythematosus: evidence from a meta-analysis. Lupus. 2014;23(3):284–292. doi:10.1177/0961203313520060
12. Mao S, Shen H, Zhang J. Systemic lupus erythematosus and malignancies risk. J Cancer Res Clin Oncol. 2016;142(1):253–262. doi:10.1007/s00432-015-2032-0
13. Huang HB, Jiang SC, Han J, Cheng QS, Dong CB, Pan CM. A systematic review of the epidemiological literature on the risk of urological cancers in systemic lupus erythematosus. J Cancer Res Clin Oncol. 2014;140(7):1067–1073. doi:10.1007/s00432-014-1604-8
14. Apor E, O’Brien J, Stephen M, Castillo JJ. Systemic lupus erythematosus is associated with increased incidence of hematologic malignancies: a meta-analysis of prospective cohort studies. Leukemia Res. 2014;38(9):1067–1071. doi:10.1016/j.leukres.2014.06.025
15. Bernatsky S, Ramsey-Goldman R, Foulkes WD, Gordon C, Clarke AE. Breast, ovarian, and endometrial malignancies in systemic lupus erythematosus: a meta-analysis. Br J Cancer. 2011;104(9):1478–1481. doi:10.1038/bjc.2011.115
16. Song L, Wang Y, Zhang J, Song N, Xu X, Lu Y. The risks of cancer development in systemic lupus erythematosus (SLE) patients: a systematic review and meta-analysis. Arthritis Res Therapy. 2018;20(1):270. doi:10.1186/s13075-018-1760-3
17. Clarke AE, Pooley N, Marjenberg Z, et al. Risk of malignancy in patients with systemic lupus erythematosus: systematic review and meta-analysis. Semin Arthritis Rheumatism. 2021;51(6):1230–1241. doi:10.1016/j.semarthrit.2021.09.009
18. Johnson DK, Reynolds KM, Poole BD, et al. Contribution of viral infection to risk for cancer in systemic lupus erythematosus and multiple sclerosis. PLoS One. 2021;16:1.
19. Bernatsky S, Kale M, Ramsey-Goldman R, Gordon C, Clarke AE. Systemic lupus and malignancies. Curr Opinion Rheumatol. 2012;24(2):177–181. doi:10.1097/BOR.0b013e32834ff258
20. Zhou Z, Liu H, Yang Y, et al. The five major autoimmune diseases increase the risk of cancer: epidemiological data from a large-scale cohort study in China. Cancer Commun. 2022;42(5):435–446. doi:10.1002/cac2.12283
21. Zhang M, Wang Y, Wang Y, Bai Y, Gu D. Association between systemic lupus erythematosus and cancer morbidity and mortality: findings from cohort studies. Front Oncol. 2022;12:860794. doi:10.3389/fonc.2022.860794
22. Mohammad NS, Nazli R, Zafar H, Fatima S. Effects of lipid based multiple micronutrients supplement on the birth outcome of underweight pre-eclamptic women: a randomized clinical trial. Pak J Med Sci. 2022;38(1):219–226. doi:10.12669/pjms.38.1.4396
23. Cao L, Tong H, Xu G, et al. Systemic lupus erythematous and malignancy risk: a meta-analysis. PLoS One. 2015;10:4.
24. Cheng X, Lai H, Luo W, et al. Single-cell analysis reveals urothelial cell heterogeneity and regenerative cues following cyclophosphamide-induced bladder injury. Cell Death Dis. 2021;12(5):446. doi:10.1038/s41419-021-03740-6
25. Sung H, Ferlay J, Siegel RL, et al. Global Cancer Statistics 2020: GLOBOCAN estimates of incidence and mortality worldwide for 36 cancers in 185 countries. Ca a Cancer J Clinicians. 2021;71(3):209–249. doi:10.3322/caac.21660
26. Martinez Rodriguez RH, Buisan Rueda O, Ibarz L. Bladder cancer: present and future. Med Clin. 2017;149(10):449–455. doi:10.1016/j.medcli.2017.06.009
27. Hurst CD, Alder O, Platt FM, et al. Genomic Subtypes of non-invasive bladder cancer with distinct metabolic profile and female gender bias in KDM6A mutation frequency. Cancer Cell. 2017;32(5):701–715.e707. doi:10.1016/j.ccell.2017.08.005
28. Smolensky D, Rathore K, Cekanova M. Molecular targets in urothelial cancer: detection, treatment, and animal models of bladder cancer. Drug Des Devel Ther. 2016;10:3305–3322. doi:10.2147/DDDT.S112113
29. Liu X, Ji J, Forsti A, Sundquist K, Sundquist J, Hemminki K. Autoimmune disease and subsequent urological cancer. J Urol. 2013;189(6):2262–2268. doi:10.1016/j.juro.2012.12.014
30. Piñero J, Saüch J, Sanz F, Furlong LI. The DisGeNET cytoscape app: exploring and visualizing disease genomics data. Comput Struct Biotechnol J. 2021;19:2960–2967. doi:10.1016/j.csbj.2021.05.015
31. Davis AP, Wiegers TC, Johnson RJ, Sciaky D, Wiegers J, Mattingly CJ. Comparative Toxicogenomics Database (CTD): update 2023. Nucleic Acids Res. 2023;51(D1):D1257–d1262. doi:10.1093/nar/gkac833
32. Stelzer G, Rosen N, Plaschkes I, et al. The genecards suite: from gene data mining to disease genome sequence analyses. Curr protoc bioinf. 2016;54(1):1.30.31–31.30.33. doi:10.1002/cpbi.5
33. Barrett T, Wilhite SE, Ledoux P, et al. NCBI GEO: archive for functional genomics data sets--update. Nucleic Acids Res. 2013;41(Database issue):D991–5. doi:10.1093/nar/gks1193
34. Davis S, Meltzer PS. GEOquery: a bridge between the Gene Expression Omnibus (GEO) and BioConductor. Bioinformatics. 2007;23(14):1846–1847. doi:10.1093/bioinformatics/btm254
35. Liu J, Lichtenberg T, Hoadley KA, et al. An Integrated TCGA pan-cancer clinical data resource to drive high-quality survival outcome analytics. Cell. 2018;173(2):400–416.e411. doi:10.1016/j.cell.2018.02.052
36. Li T, Wernersson R, Hansen RB, et al. A scored human protein-protein interaction network to catalyze genomic interpretation. Nature Methods. 2017;14(1):61–64. doi:10.1038/nmeth.4083
37. Chen H, Cai Y, Ji C, Selvaraj G, Wei D, Wu H. AdaPPI: identification of novel protein functional modules via adaptive graph convolution networks in a protein-protein interaction network. Briefings Bioinf. 2023;24:1.
38. Szklarczyk D, Kirsch R, Koutrouli M, et al. The STRING database in 2023: protein-protein association networks and functional enrichment analyses for any sequenced genome of interest. Nucleic Acids Res. 2023;51(D1):D638–d646.
39. Shannon P, Markiel A, Ozier O, et al. Cytoscape: a software environment for integrated models of biomolecular interaction networks. Genome Res. 2003;13(11):2498–2504. doi:10.1101/gr.1239303
40. Chin CH, Chen SH, Wu HH, Ho CW, Ko MT, Lin C-Y. Cytohubba: identifying hub objects and sub-networks from complex interactome. BMC Syst. Biol. 2014;8(Suppl 4):S11. doi:10.1186/1752-0509-8-S4-S11
41. Franz M, Rodriguez H, Lopes C, et al. GeneMANIA update 2018. Nucleic Acids Res. 2018;46(W1):W60–w64.
42. Subramanian A, Tamayo P, Mootha VK, et al. Gene set enrichment analysis: a knowledge-based approach for interpreting genome-wide expression profiles. Proc Natl Acad Sci U S A. 2005;102(43):15545–15550. doi:10.1073/pnas.0506580102
43. Makowski L, Chaib M, Rathmell JC. Immunometabolism: from basic mechanisms to translation. Immunol Rev. 2020;295(1):5–14. doi:10.1111/imr.12858
44. Newman AM, Liu CL, Green MR, et al. Robust enumeration of cell subsets from tissue expression profiles. Nature Methods. 2015;12(5):453–457. doi:10.1038/nmeth.3337
45. Lambert SA, Jolma A, Campitelli LF, et al. The human transcription factors. Cell. 2018;172(4):650–665.
46. Xia J, Gill EE, Hancock RE. NetworkAnalyst for statistical, visual and network-based meta-analysis of gene expression data. Nat Protocol. 2015;10(6):823–844. doi:10.1038/nprot.2015.052
47. de Souza N. The ENCODE project. Nature Methods. 2012;9(11):1046. doi:10.1038/nmeth.2238
48. Davis CA, Hitz BC, Sloan CA, et al. The Encyclopedia of DNA elements (ENCODE): data portal update. Nucleic Acids Res. 2018;46(D1):D794–d801. doi:10.1093/nar/gkx1081
49. ENCODE Project Consortium. An integrated encyclopedia of DNA elements in the human genome. Nature. 2012;489(7414):57–74. doi:10.1038/nature11247
50. Huang HY, Lin YC, Cui S, et al. miRTarBase update 2022: an informative resource for experimentally validated miRNA-target interactions. Nucleic Acids Res. 2022;50(D1):D222–d230. doi:10.1093/nar/gkab1079
51. Piñero J, Ramírez-Anguita JM, Saüch-Pitarch J, et al. The DisGeNET knowledge platform for disease genomics: 2019 update. Nucleic Acids Res. 2020;48(D1):D845–d855. doi:10.1093/nar/gkz1021
52. Dörner T, Furie R. Novel paradigms in systemic lupus erythematosus. Lancet. 2019;393(10188):2344–2358. doi:10.1016/S0140-6736(19)30546-X
53. Kiriakidou M, Ching CL. Systemic Lupus Erythematosus. Ann Internal Med. 2020;172(11):ITC81–ITC96. doi:10.7326/AITC202006020
54. Ocampo-Piraquive V, Nieto-Aristizábal I, Cañas CA, Tobón GJ. Mortality in systemic lupus erythematosus: causes, predictors and interventions. Exp Rev Clin Immunol. 2018;14(12):1043–1053. doi:10.1080/1744666X.2018.1538789
55. Bae EH, Lim SY, Han KD, et al. Systemic lupus erythematosus is a risk factor for cancer: a nationwide population-based study in Korea. Lupus. 2019;28(3):317–323. doi:10.1177/0961203319826672
56. Björnådal L, Löfström B, Yin L, Lundberg IE, Ekbom A. Increased cancer incidence in a Swedish cohort of patients with systemic lupus erythematosus. Scand J Rheumatol. 2002;31(2):66–71. doi:10.1080/03009740252937568
57. Rosenberger A, Sohns M, Friedrichs S, et al. Gene-set meta-analysis of lung cancer identifies pathway related to systemic lupus erythematosus. PLoS One. 2017;12(3):e0173339. doi:10.1371/journal.pone.0173339
58. Souza OF, de Oliveira VC, Rodrigues GJF, Costa LVS, Corado F, Popi AF. Age-related accumulation of B-1 cell progenitors in mice reflects changes in miR15a/16-1 expression and radioresistance capacity. Exp Hematol Oncol. 2023;12(1):24. doi:10.1186/s40164-023-00390-6
59. Hanahan D, Weinberg RA. Hallmarks of cancer: the next generation. Cell. 2011;144(5):646–674. doi:10.1016/j.cell.2011.02.013
60. Liao K, Zhang X, Liu J, et al. The role of platelets in the regulation of tumor growth and metastasis: the mechanisms and targeted therapy. MedComm. 2023;4(5):e350. doi:10.1002/mco2.350
61. Qu Y, Li D, Liu W, Shi D. Molecular consideration relevant to the mechanism of the comorbidity between psoriasis and systemic lupus erythematosus (Review). Exp Ther Med. 2023;26(4):482. doi:10.3892/etm.2023.12181
62. Zhang J, Roschke V, Baker KP, et al. Cutting edge: a role for B lymphocyte stimulator in systemic lupus erythematosus. J Iimmunol. 2001;166(1):6–10. doi:10.4049/jimmunol.166.1.6
63. Koyama T, Tsukamoto H, Miyagi Y, et al. Raised serum April levels in patients with systemic lupus erythematosus. Ann Rheumatic Dis. 2005;64(7):1065–1067. doi:10.1136/ard.2004.022491
64. Vincent FB, Morand EF, Schneider P, Mackay F. The BAFF/April system in SLE pathogenesis. Nat Rev Rheumatol. 2014;10(6):365–373. doi:10.1038/nrrheum.2014.33
65. Tu Y, Guo R, Li J, et al. MiRNA regulation of MIF in SLE and attenuation of murine lupus nephritis with miR-654. Front Immunol. 2019;10:2229. doi:10.3389/fimmu.2019.02229
66. Ferrer G, Álvarez-Errico D, Esteller M. Biological and molecular factors predicting response to adoptive cell therapies in cancer. J Natl Cancer Inst. 2022;114(7):930–939.
67. Tanaka Y. State-of-The-art treatment of systemic lupus erythematosus. Int J Rheuma Dis. 2020;23(4):465–471. doi:10.1111/1756-185X.13817
68. Mathias LM, Stohl W. Systemic lupus erythematosus (SLE): emerging therapeutic targets. Expert Opinion Ther Tar. 2020;24(12):1283–1302. doi:10.1080/14728222.2020.1832464
69. Attallah AM, El-Far M, Abdel Malak CA, et al. A simple diagnostic index comprising epithelial membrane antigen and fibronectin for hepatocellular carcinoma. Ann Hepatol. 2015;14(6):869–880. doi:10.5604/16652681.1171774
70. Agbim U, Asrani SK. Non-invasive assessment of liver fibrosis and prognosis: an update on serum and elastography markers. Expert Rev Gastroenterol Hepatol. 2019;13(4):361–374. doi:10.1080/17474124.2019.1579641
71. Manicone AM, McGuire JK. Matrix metalloproteinases as modulators of inflammation. Semin Cell Dev Biol. 2008;19(1):34–41. doi:10.1016/j.semcdb.2007.07.003
72. Cantarelli C, Leventhal J, Cravedi P. Complement in lupus: biomarker, therapeutic target, or a little bit of both? Kidney Int Rep. 2021;6(8):2031–2032. doi:10.1016/j.ekir.2021.06.016
73. Macedo AC, Isaac L. Systemic lupus erythematosus and deficiencies of early components of the complement classical pathway. Front Immunol. 2016;7:55. doi:10.3389/fimmu.2016.00055
74. Wang X, Xia Y. Anti-double stranded DNA antibodies: origin, pathogenicity, and targeted therapies. Front Immunol. 2019;10:1667. doi:10.3389/fimmu.2019.01667
75. Ertugrul G, Keles D, Oktay G, Aktan S. Matrix metalloproteinase-2 and −9 activity levels increase in cutaneous lupus erythematosus lesions and correlate with disease severity. Archives of Dermatological Res. 2018;310(2):173–179. doi:10.1007/s00403-018-1811-2
76. Mawrin C, Brunn A, Röcken C, Schröder JM. Peripheral neuropathy in systemic lupus erythematosus: pathomorphological features and distribution pattern of matrix metalloproteinases. Acta Neuropathol. 2003;105(4):365–372. doi:10.1007/s00401-002-0653-2
77. Yu C, Gershwin ME, Chang C. Diagnostic criteria for systemic lupus erythematosus: a critical review. J Autoimmun. 2014;48–49:10–13. doi:10.1016/j.jaut.2014.01.004
78. Petri M, Orbai AM, Alarcón GS, et al. Derivation and validation of the Systemic Lupus International Collaborating Clinics classification criteria for systemic lupus erythematosus. Arthritis Rheum. 2012;64(8):2677–2686. doi:10.1002/art.34473
 © 2024 The Author(s). This work is published and licensed by Dove Medical Press Limited. The full terms of this license are available at https://www.dovepress.com/terms.php and incorporate the Creative Commons Attribution - Non Commercial (unported, v3.0) License.
By accessing the work you hereby accept the Terms. Non-commercial uses of the work are permitted without any further permission from Dove Medical Press Limited, provided the work is properly attributed. For permission for commercial use of this work, please see paragraphs 4.2 and 5 of our Terms.


