Back to Journals » Nature and Science of Sleep » Volume 18

Exploring the Effects of Blue Light on Circadian Rhythm in SD Rat
Authors Meng J ![]() , Wang Y, Cao Q, Li M, Zhang Q, Zhang M, Wang Y, Liu Y, Tang L
, Wang Y, Cao Q, Li M, Zhang Q, Zhang M, Wang Y, Liu Y, Tang L
Received 18 July 2025
Accepted for publication 23 December 2025
Published 8 January 2026 Volume 2026:18 553626
DOI https://doi.org/10.2147/NSS.S553626
Checked for plagiarism Yes
Review by Single anonymous peer review
Peer reviewer comments 2
Editor who approved publication: Prof. Dr. Ahmed BaHammam
Jia Meng,1 Yuying Wang,1 Qinglong Cao,1 Mengfan Li,1 Qibin Zhang,1 Mingchao Zhang,2 Yadi Wang,3 Yang Liu,1 Lin Tang4
1Department of Public Health, Jinzhou Medical University, Jinzhou, Liaoning, People’s Republic of China; 2Department of Orthopedics, The First Affiliated Hospital of Jinzhou Medical University, Jinzhou, Liaoning, People’s Republic of China; 3Department of Precision Medicine, The Third Affiliated Hospital of Jinzhou Medical University, Jinzhou, Liaoning, People’s Republic of China; 4Biomarker Technologies Corporation, Beijing, People’s Republic of China
Correspondence: Jia Meng, Department of Public Health, Jinzhou Medical University, No. 40, Section 3, Songpo Road, Linghe District, Jinzhou, Liaoning, 121001, People’s Republic of China, Email [email protected]
Purpose: The hypothalamic suprachiasmatic nucleus (SCN) is the master clock of the circadian rhythms, coordinating the entire circadian system of the body, including the secretion of melatonin.
Methods: In this study, we aimed to clarify the transcriptome profile influenced by blue light in Sprague Dawley (SD) rats. Rats in the experimental group were exposed to blue light with wavelengths of 450nm and 465nm for 3 and 6 hours respectively during nighttime. After a 6-week intervention of blue light exposure, the retinal tissue was used for histological analysis, the blood were investigated using ELISA, and hypothalamus samples were collected for the full-length RNA-seq. Differentially expressed genes were validated by reverse transcription-quantitative RT-qPCR and Western blot. The relationships between the expression levels of clock genes and the concentrations of melatonin and AA-NAT were evaluated via correlation analysis.
Results: Our findings demonstrated the retinal cytoarchitecture of SD rats exposed to blue light was damaged, melatonin and AA-NAT in the blood of SD rats exposed to blue light was disordered. Differentially expressed genes were identified, and KEGG analysis revealed that TGF-beta signaling pathway may be related to exposure to blue light. Despite the limitations imposed by the sample size and difference parameters, RT-qPCR analysis was employed to validate the accuracy and reliability of the results, and it was found that they were indeed both accurate and reliable.
Conclusion: The findings of this study provide a novel insight into the potential mechanisms underlying the impact of blue light exposure and may offer a novel approach to the treatment of photopathogenesis by modulating circadian rhythms.
Keywords: circadian rhythm, blue light, full-length RNA-seq, differentially expressed gene
Introduction
Circadian rhythms represent a fundamental aspect of a human being’s ability to adapt to the environment. The SCN is the principal circadian pacemaker of the mammalian brain and plays a pivotal role in the generation and regulation of biological rhythms.1 Further damage studies on the hypothalamus find that the SCN at the anterior end of the hypothalamus is a key element in initiating the rat biological clock.2 When the SCN is artificially damaged, the endocrine rhythm and behavioral rhythm of rats are lost, which supports the hypothesis that the SCN may be the pacemaker of the biological clock of rats.
Light pollution is thought to be linked to serious health problems, mainly through disrupted circadian rhythms and melatonin secretion.3 When the rats were exposed to constant light, the loss of spontaneous movement, melatonin secretion, corticosterone rhythm, and decreased function of the SCN cells were observed.4 Light can cause the endogenous oscillator in the SCN to phase-shift, thereby synchronising it with the environmental day-night cycle.5 Among the most potent temporal cues for circadian photoentrainment is light, particularly short-wavelength blue light.6 Blue light is characterized by short wavelengths, high energy, and superior penetration in visible light. Retina, the imaging screen of the eyes, is located in the back wall of the eye and can incur severe damage when exposed to specific wavelengths or intensities of light.7 When light strikes the retina, it is known to stimulate melanopsin-based intrinsically photosensitive retinal ganglion cells (ipRGCs), which are uniquely sensitive to wavelengths in the blue range of the light spectrum.8–10 These ipRGCs project extensively to the SCN, via the retinohypothalamic tract (RHT), and in turn, the SCN suppresses melatonin production by the pineal gland.11,12 Blue light exposure with a wavelength of approximately 460nm may be projected directly to the hypothalamus via a separate system of retinal ganglion cells, reliably influencing the 24-hour biological clock.13,14 Irradiation at the same intensity with short-wavelength (450 nm) light is more likely to induce retinal damage than irradiation with long-wavelength (650 nm) light.15 Melanopsin is activated by blue wavelength (465~480 nm) and insensitive to red or green light; meanwhile, the concentrations of melatonin and its synthesizing enzyme AANAT are both lower.16 Prolonged exposure to blue light also affects melatonin secretion in the pineal gland, disrupts the circadian rhythm, and then impacts cognitive ability, mood, and other physiological and behavioral effects.17–20 However, the adverse biological effect of blue light radiation on the human body is wavelength-dependent.
Light plays a pivotal role in the phase shifting of circadian rhythms by influencing the expression of clock genes through the duration, intensity, timing, and spectrum.21–23 Studies have demonstrated that the expression of the pineal gland NAT and Per gene in rats, under beta-adrenergic control from SCN is influenced by light exposure.24 In mammals, circadian rhythms are regulated by a complex network of genes and the entire genome. The core of this regulatory network comprises the transcription factors CLOCK and BMAL1, which govern the transcription of the Nr1d1 gene.25,26 In humans, mutations in the circadian clock genes have been linked to circadian rhythm sleep disorders. Among the genes associated with chronotypes are well-known clock genes, such as PER1, CRY1, and BMAL1.27 The Per2 mutation was the first genetic cause of familial advanced sleep phase syndrome (FASPS) to be identified, providing direct evidence that PER2 plays an essential role in the human circadian clock.28 A mounting body of evidence about circadian rhythms in mammals underscores the indisputable link between circadian rhythms and human health.
Extended exposure to light has been demonstrated to disrupt circadian rhythms in humans.29 We hypothesized that blue light instigates alterations in the transcriptome. To this end, a series of experiments were conducted, utilizing different wavelengths of blue light and varying exposure durations, to explore the effects of blue light on the transcriptome. In this study, we dynamically examined the concentration of MT and AA-NAT, histopathology of the retina, and employed full-length transcriptome sequencing to investigate how blue light influences circadian rhythms in SD rats, providing insights into the potential mechanisms underlying the effects of light. Subsequent analyses encompassed DEGs and KEGG pathway enrichment analysis.
Materials and Methods
Animals and Experimental Design
Sprague-Dawley male rats (6 weeks) were maintained under white light (wavelength 400 ~ 760 nm), at a room temperature of 24 °C, a humidity level of 50%, and under a light cycle of LD 12 h / 12 h. The light intensity was set at 100lux, with the lighting initiated at 08:30 am. SD rats are permitted to consume standardised granular food and tap water. Starting from the 14th day, rats were randomly divided into 5 groups as follows: No blue light exposure group (C, n=3), 450 nm blue light exposure group for 3 hours (S3, n=3), 450 nm blue light exposure group for 6 hours (S6, n=3), 465 nm blue light exposure group for 3 hours (L3, n=3) and 465 nm blue light exposure group for 6 hours (L6, n=3). Subsequently, the subjects began receiving either 3 or 6 hours of blue light exposure every night at 8:30 pm for 6 weeks. Meanwhile, the control group was not exposed to blue light and were fed according to standard procedures. The research was approved by the Experimental animal Ethics Committee of Jinzhou Medical University (No. 2020121101) and strictly adhered to ARRIVE guidelines.
The selection of lighting conditions, including intensity and duration, was based on the design of a rat model of circadian rhythm disturbance. The selection of blue light at a wavelength around 460 nm was based on the premise that such exposure may be projected directly to the hypothalamus via a distinct system of retinal ganglion cells, thereby exerting a reliable influence on the 24-hour biological clock.13,14 The 446 ~ 477 nm wavelength region is identified as the most potent in terms of its ability to regulate melatonin secretion via circadian input.30,31
Following a 6-week treatment period, SD rats were euthanized at night (ZT12 ~ ZT14, 20:30–22:30pm) by anesthetized with 10% chloral hydrate, followed by decapitation and collection of hypothalamus and eyeball tissues. The hypothalamus tissue was then meticulously dissected from each rat’s brain and stored in 2 mL RNA later at a temperature of −80 °C in a refrigerated storage facility. The eyeball was immediately removed and immersed in formaldehyde-acetic acid-saline (FAS), it was then paraffin-embedded for wax sectioning. Blood samples were collected one day (ZT0, ZT4, ZT8, ZT12, ZT16 and ZT20) before the rats were euthanized and collected in BD vacutainer EDTA tubes, and plasma was separated by centrifugation at 2000 × g for 20 min, aliquoted, and stored at −80 °C. Schematic overview of treatments (Figure 1A).
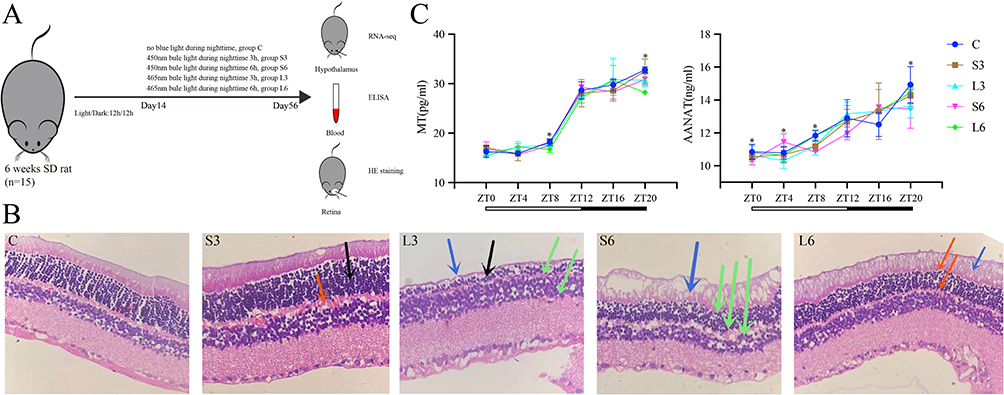 |
Figure 1 Schematic overview of treatments (A). Retinal sections were subjected to H&E staining (HE × 200, (B)), the presence of thinning in the outer nuclear layer (black arrows) and outer plexiform layer (red arrows), unclear boundaries (green arrows), and impaired pigment epithelium (blue arrows). The distribution of MT and AA-NAT concentration of different groups over time (C), the y-axis indicated the concentration of different groups and the x-axis indicated different time points, the processing of the data was conducted utilising GraphPad Prism 9.0, and the results are hereby presented as the mean ± SD, *P < 0.05. |
ELISA Procedure
Rat Melatonin and AA-NAT ELISA kits were purchased from Enzyme-linked (https://www.mlbio.cn/). All tests were performed according to the manufacturer’s guidance. The signal was detected using a microplate reader within 30 minutes after the reaction. All data were presented as mean ± standard deviation, and all experiments were performed three times. The melatonin and AA-NAT concentrations were analyzed using Kruskal–Wallis. P-values ≤ 0.05 were considered to be significant.
Hematoxylin and Eosin (H&E) Staining
The retinal tissue was immersed in FAS overnight and then dehydrated. Following this, the tissue was embedded in paraffin blocks and sliced into 4 μm sections. The sections were then placed on the glass slides and stained with hematoxylin and eosin (H&E) for histological analysis. The observation was conducted under a 200 × optical microscope.
RNA Extraction, Library Construction, and Sequencing
Total RNA was isolated from the hypothalamus tissues of rats using TRIzol reagent (Takara, Kyoto, Japan). Moreover, 1 μg total RNA was prepared for cDNA libraries using the cDNA-PCR Sequencing Kit (SQK-PCS109, Oxford Nanopore Technologies). Finally, the cDNA libraries were subjected to FLO-MIN109 flow cells and analyzed on a PromethION platform at Biomarker Technology Company (Beijing, China).
DEGs Analysis
The clean reads were mapped to the reference transcriptome sequence (Rnor_6.0_release95). Expression levels were estimated by CPM (counts per million). Differential expression analysis of two groups was performed using the edgeR (3.32.1). Genes with a p-value < 0.05 and fold change ≥ 1.5 were considered as DEGs. Perform a Spearman correlation analysis separately for the gene expression levels and the concentrations of MT and AA-NAT using the R package (3.6.3).
Enrichment Analysis by KEGG
The KEGG database (http://www.genome.jp/kegg/) was commonly used in RNA-seq bioinformatics analysis. We used KOBAS software to detect the statistical enrichment of DEGs in KEGG pathways. In KEGG pathway enrichment analysis, those KEGG pathways with q values less than 0.05 and rich factor greater than 1 were considered significantly enriched. The greater the rich factor, the higher the degree of enrichment. The KEGG gene set enrichment analysis (GSEA) was performed using clusterProfiler (4.4.4).
Western Blotting
The total protein was extracted using RIPA buffer (Thermo Fisher, USA), and the concentration was determined with a BCA protein quantification kit (Keygen, China). Then, the proteins were separated using SDS-PAGE and transferred to a PVDF membrane (Merck, Germany). The membrane was subjected to a washing step with TBST for a duration of five minutes, followed by an incubation period at ambient temperature with a 5% skim milk solution for a period of two hours, then incubated overnight at 4 °C with primary antibodies. After TBST washing for 8 minutes, the secondary antibody was added and incubated at 37 °C for 1 h. The membrane was subjected to a rinse with PBST, after which the bands were exposed and analysed using an ECL Plus assay kit (Beyotime, China). The analysis of data was conducted utilising the ImageJ software (v1.54), with GAPDH serving as the internal reference standard.
Quantitative Real-Time PCR Validation
The remaining RNA after transcriptome was used for RT-PCR, and cDNA was prepared using HiScript 1st Strand cDNA Synthesis Kit for qPCR (Vazyme, Nanjing, China) according to the manufacturer’s instructions. The expression of the screened genes was determined using SYBR Green, with 10 uL reaction components containing 2 uL cDNA, 5 uL 2 × SYBR Green Mix, 0.5 uL forward primer, 0.5 uL reverse primer and ddH2O added to a total volume of 10 uL. The reaction program consisted of 40 cycles at 95 °C for 5 min, followed by incubation at 95 °C for 10s and 60 °C for 25s. The primer sequence is synthesized according to the mRNA sequence obtained from the NCBI database (Table 1). The 2−ΔΔCt method was used for data quantification. All statistical analyses were performed using Prism 9.0 (GraphPad Software Inc., San Diego, CA, USA).
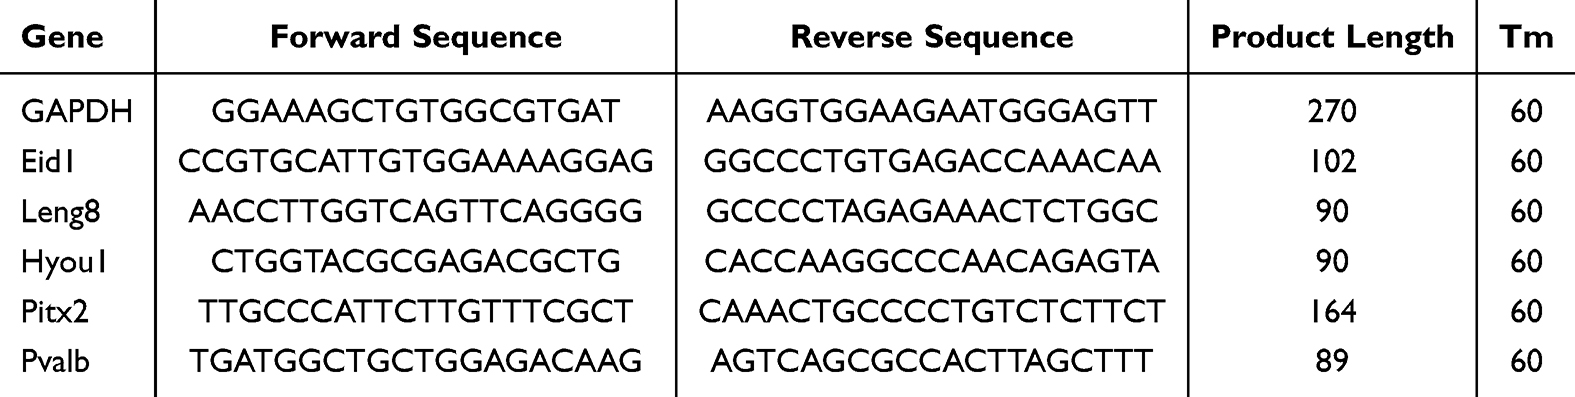 |
Table 1 Primer Sequences of the Selected DEGs |
Results
Effects of Different Wavelength and Time Blue Light in SD Rats
The research design is shown in Figure 1A. To investigate the effects of blue light on circadian rhythm in SD rats, an initial assessment of retinal damage in rats was conducted. The results of HE staining for retinal sections are presented in Figure 1B. In the control group, the retinal cytoarchitecture appeared intact with neatly arranged layers (Figure 1B). In the S3 group, the outer nuclear layer of the retina exhibited uneven thickness, the outer plexiform layer displayed a loose configuration, and the boundary was indistinct (Figure 1B). In the S6 group, the thickness of each retinal layer was reduced, and the boundary was indistinct, with damage to the photoreceptor layer and the pigment epithelium (Figure 1B). In the L3 group, the outer nuclear layer cells were atrophied and thinned, the structural boundaries of each layer were indistinct, and the photoreceptor layer and pigment epithelium were no longer discernible (Figure 1B). The L6 group exhibited edema in the pigment epithelium, accompanied by thinning the outer plexiform layer and the photoreceptor layer (Figure 1B).
Furthermore, the effects of different wavelengths of blue light on melatonin (MT) and AA-NAT (a key enzyme in melatonin synthesis) in the blood of SD rats were investigated using ELISA (Figure 1C). The distribution of MT and AA-NAT concentration demonstrated variability over time, exhibiting differences between the treatment groups and the control group (Figure 1C and Tables S1, S2).
DEGs Differed Between Groups
In order to comprehend the manner in which blue light affects the circadian rhythm of SD rats, we conducted a comprehensive analysis of the transcriptome across various groups. Bioinformatics and statistical approaches were used to analyze the full-length RNA-Seq data. After quality filtering, each sample retained an average of 4.12 million high-quality clean reads, with an average sequence length of 850 bp. A total of 92.28% of the reads were successfully mapped to the rat reference genome. This involved comparisons between different groups (L3 vs C, L6 vs C, S3 vs C, S6 vs C, L6 vs L3, S6 vs S3, L3 vs S3, and L6 vs S6), which resulted in the identification of a substantial number of DEGs. These findings illustrate distinct hypothalamus transcriptome profiles between the control groups and the groups exposed to 465nm and 450nm blue light (Figure 2A). Subsequent analysis involved the investigation of gene expression patterns through the implementation of a clustering approach on RNA-seq data. Heatmaps of DEGs revealed that the L and S groups differed significantly from the C group in terms of gene expression patterns. Furthermore, the transcriptome profile of the L groups appeared to be more analogous to that of the S groups in comparison to the C group (Figure 2B). Finally, we analyzed the differences of several clock genes between the groups exposed to 465nm and 450nm blue light and the control group (Figure 2C and Table S3). Per1, Arntl, Rasd1, Npy2r and Csnk2a1 showed significant differences in the blue light exposure groups. As shown in Table 2, the correlation analysis of the six clock genes (Per1, Arntl, Rasd1, Npy2r, Csnk2a1 and Cry1) indicated that there was only a partially significant correlation between MT and AA-NAT concentration (Tables S4 and S5).
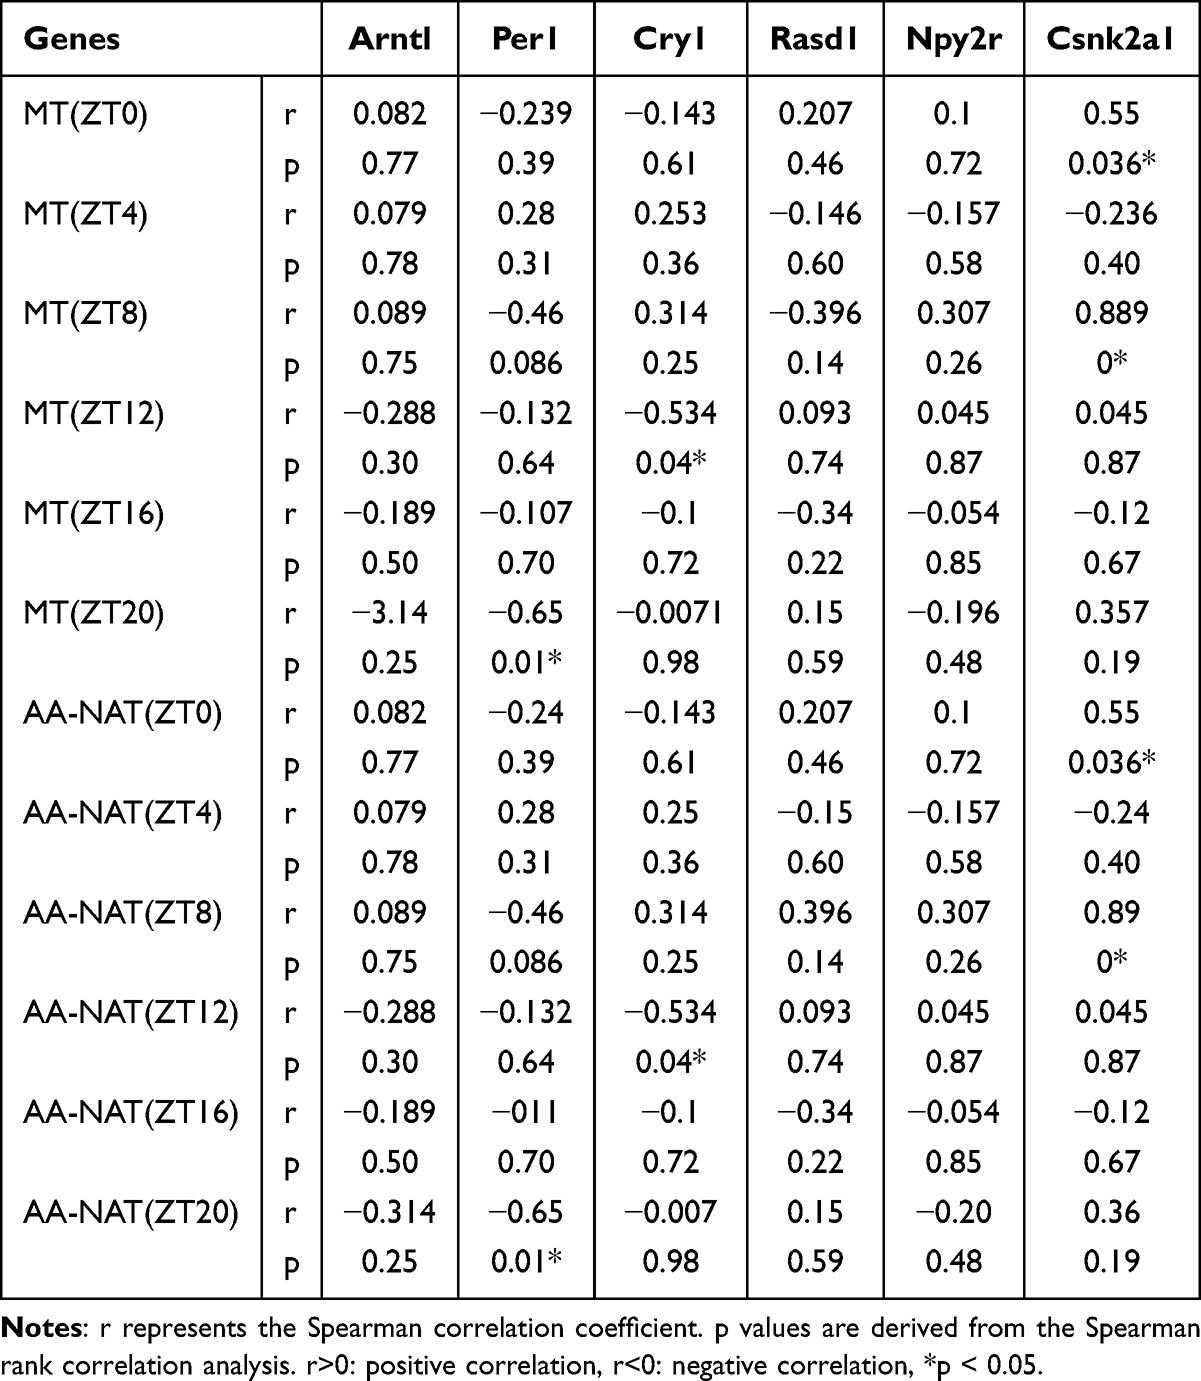 |
Table 2 Correlation Analysis of Clock mRNAs with MT and AA-NAT Concentrations |
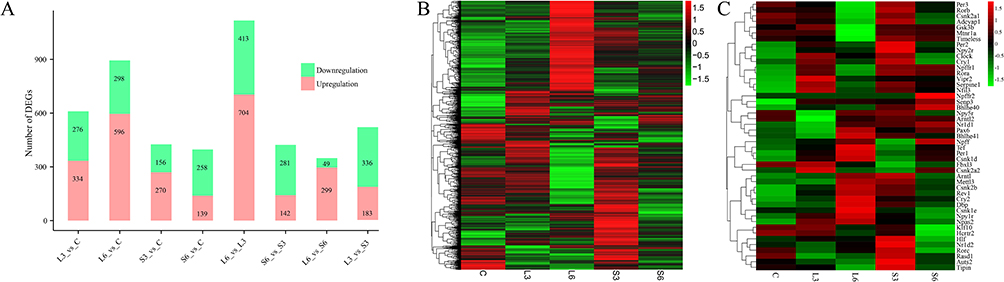 |
Figure 2 Statistics of DEGs (A) Heatmap of DEGs (B) and clock genes (C). In the heatmaps, red represents the upregulated genes, green represents the downregulated genes. |
KEGG Pathway Enrichment Analysis
To gain further insight, we conducted a KEGG pathway enrichment analysis and visualized the top 20 pathways with the lowest q values in a bubble chart (Figures 3 and 4). The DEGs in the L3 group compared to the C group were primarily enriched in HIF-1 signaling pathway (p=0.000065 and q=0.0158, Figure 3A). In contrast, DEGs in the L6 group exhibited enrichment in Circadian entrainment (p=0.000051 and q=0.014, Figure 3B). In addition, the results indicated that DEGs were predominantly enriched in the Amyotrophic lateral sclerosis in the S3 group compared to the C group (p=0.0003 and q=0.067, Figure 3C). In the S6 group, DEGs were predominantly enriched in the PI3K-Akt signaling pathway (p=0.001 and q=0.33, Figure 3D).
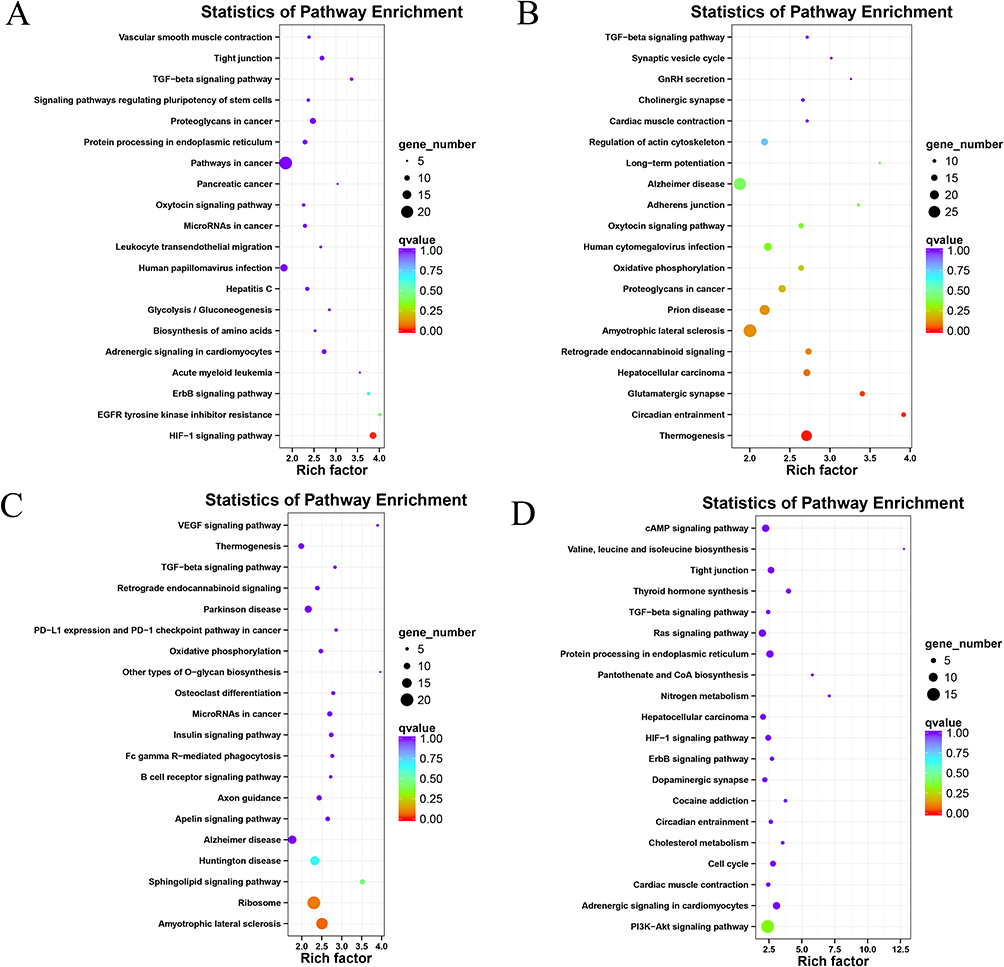 |
Figure 3 KEGG pathway enrichment analysis for different genes in L3 vs C (A), L6 vs C (B), S3 vs C (C), S6 vs C (D) comparisons. The y-axis indicates the name of the KEGG pathway. The dot size means gene count. The dot color indicates the q value. The dot color indicates the q value. |
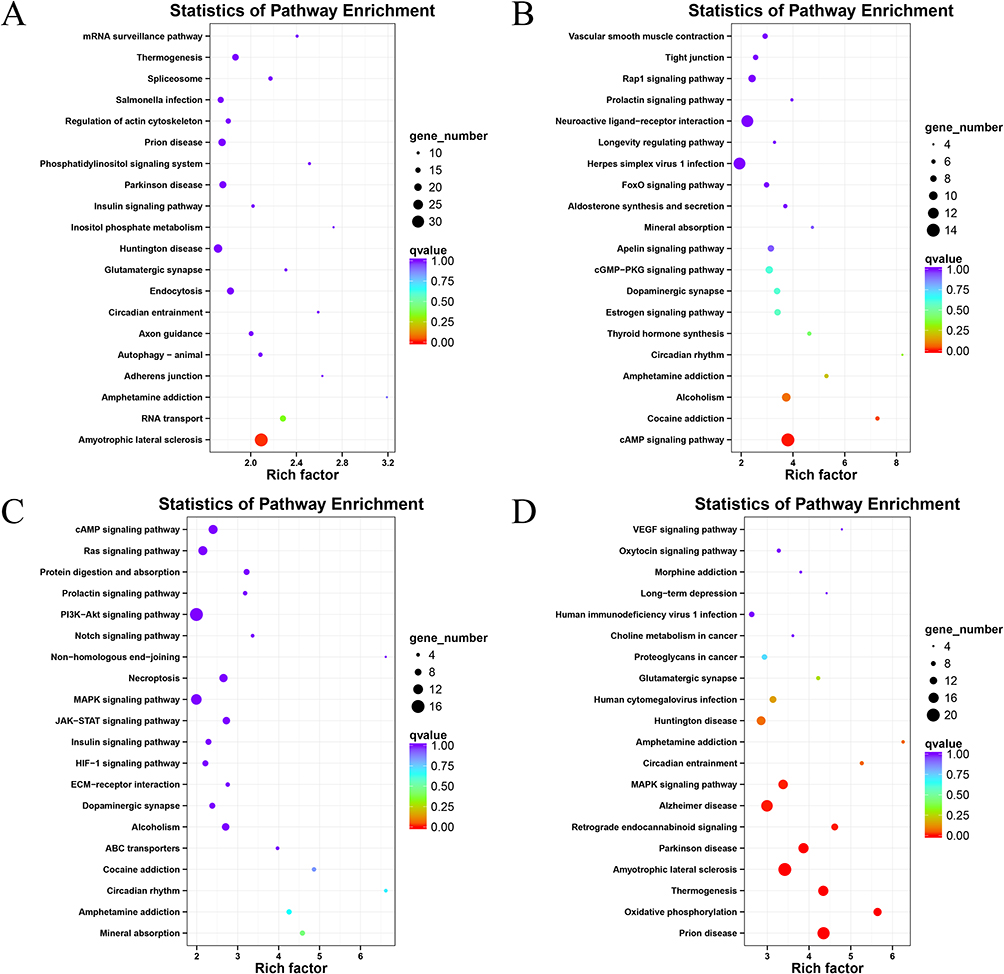 |
Figure 4 KEGG pathway enrichment analysis for different genes in L6 vs L3 (A), S6 vs S3 (B), L3 vs S3 (C), L6 vs S6 (D) comparisons. The y-axis indicates the name of the KEGG pathway. The dot size means gene count. The dot color indicates the q value. |
Notably, we found that the DEGs of all four treatment groups were enriched in the TGF-beta signaling pathway in comparison with the control group. Despite the lack of statistical significance in the enrichment of the TGF-beta signaling pathway across all blue light exposure groups, this pathway may be associated with the effects of blue light exposure on SD rats.
Furthermore, an analysis of functional enrichment was conducted between groups exposed to blue light of the same wavelength for varying durations and between groups exposed to different wavelengths for the same duration. KEGG analysis further demonstrated that DEGs were enriched in Amyotrophic lateral sclerosis in the L6 group compared to the L3 group (p=0.000059 and q=0.015, Figure 4A). The DEGs in the S6 group compared to the S3 group were enriched in cAMP signaling pathway (p=0.000018 and q=0.0042, Figure 4B). The DEGs in the L3 group compared to the S3 group were enriched in Circadian rhythm (p=0.003 and q=0.69, Figure 4C). The DEGs in the L6 group compared to the S6 group were enriched in MAPK signaling pathway (p=0.000035 and q=0.007, Figure 4D).
Gene set enrichment analysis (GSEA) results showed that the JAK-STAT signaling pathway was significantly inhibited (ES=−1.713, FDR=0.039) and the MAPK signaling pathway was significantly enriched (ES=1.623, FDR=0.03) (Figure 5A), implying that blue light may be involved in JAK-STAT and MAPK signaling pathway. Following that, we examined JAK1, STAT3, MAPK, P38 and ERK1/2 expression pattern in all groups. Western blotting results indicated that protein expression levels of JAK1 and STAT3 were significantly decreased, and MAPK, P38 and ERK1/2 were significantly increased in blue light exposure groups (Figure 5B).
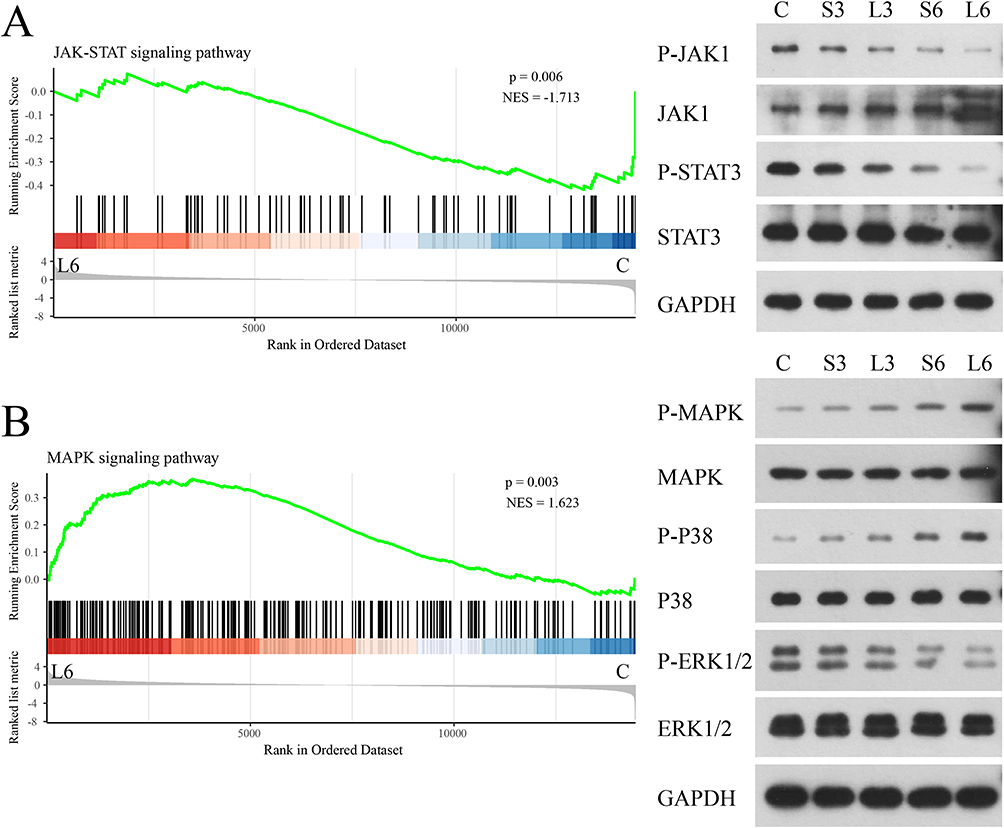 |
Figure 5 GSEA results showed JAK-STAT and MAPK signaling pathways associated with circadian rhythm (A and B). The protein expression levels of JAK1, STAT3, MAPK, P38 and ERK1/2 were tested using the Western blot method (A and B). |
Identification and Function of Common DEGs
Venn diagrams unveiled overlaps in DEGs between groups, highlighting the genes influenced by both 465nm and 450nm blue light treatment in SD rats (Figure 6). Expression of ten genes was upregulated and forty-two genes was downregulated in the L and S groups compared to the C group (Figure 6A). Additionally, KEGG pathway analysis revealed that TGF-beta signaling pathway (p=0.024 and q=1) were significantly enrichment (Figure 6B).
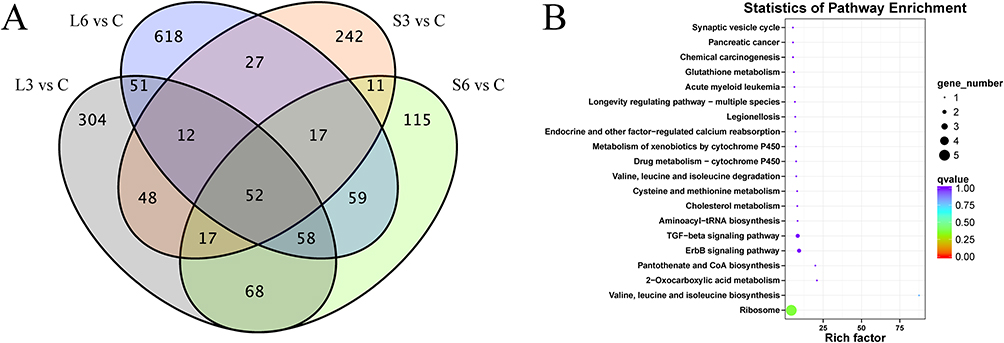 |
Figure 6 Venn diagrams showing upregulated and downregulated genes in the L and S groups compared to the C group (A), KEGG pathway enrichment analysis for the Common DEGs (B). |
RT-qPCR Validation
To confirm RNA sequencing results, five DEGs (Eid1, Leng8, Hyou1, Pitx2, and Pvalb) were selected for validation using RT-qPCR. The expression levels of these DEGs in the treatment groups compared with the control group were consistent with RNA sequencing data, indicating our findings were accurate (Figure 7).
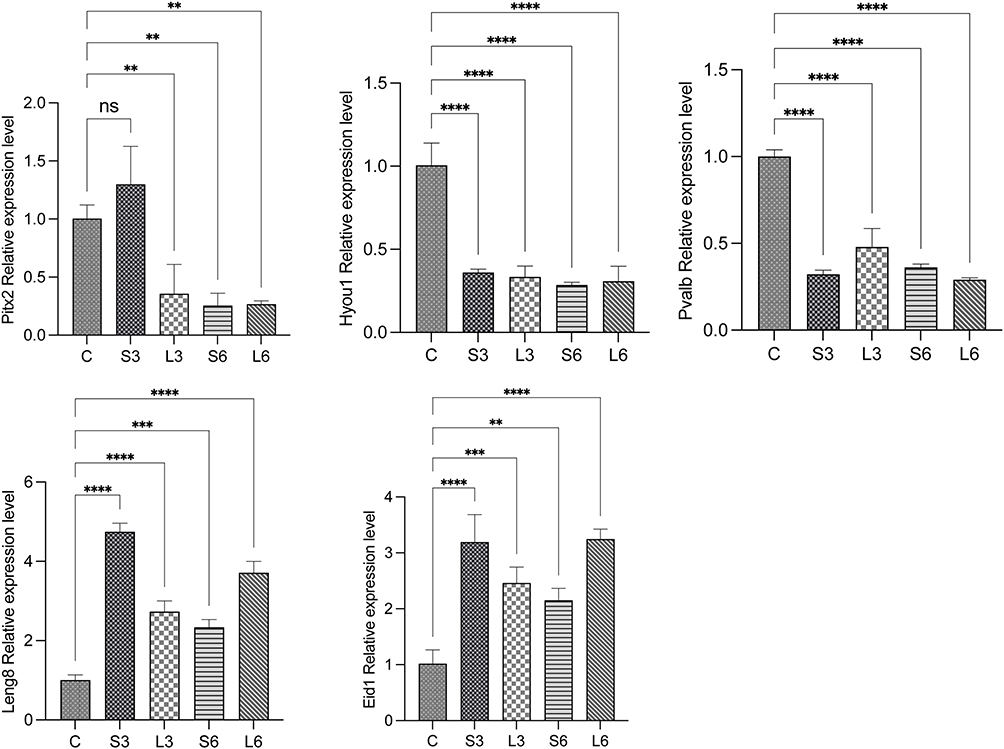 |
Figure 7 qRT-PCR validation of five DEGs. The relative expression levels of genes in five groups (ns, P>0.05; **, P < 0.01; ***, P < 0.001; ****, P < 0.0001). |
Discussion
Understanding how circadian clock genes work together can provide valuable insights into their relationship with specific behaviors, particularly the sleep-wake cycle. Blue light, recognized for its potent effect on synchronizing the human circadian rhythm, can have far-reaching consequences. Exposure to low levels of blue light or bright light prior to bedtime can have a detrimental effect on the circadian rhythm, with potentially adverse consequences for overall health. Recent studies have demonstrated that light can significantly affect the circadian rhythm.3,32–35 In the present study, we investigated the effects of blue light on hypothalamus transcriptome levels in SD rats, with a particular focus on its impact on circadian rhythm.
Circadian rhythms are influenced by external factors, with light being the predominant factor in this regard.36 Light is processed through the retina and through the retinohypothalamic tract to the synchronization of rhythmic in the SCN, which constitutes the master clock of the organism.36 The absorption of blue light by the retina instigates the initiation of the photooxidation mechanism, leading to the formation of a substantial oxidation reaction. This, in turn, results in the disruption of the body’s normal REDOX dynamic equilibrium, consequently activating the cell apoptosis mechanism, resulting in cell death and damage. The results demonstrated that the retinal cytoarchitecture of the control group was preserved with the layered structure. However, the retinal cytoarchitecture was damaged in the groups exposed to 465nm and 450nm blue light.
It is evident that exposure to light exerts a significant influence on a multitude of physiological processes, including circadian rhythms, sleep/wake patterns, seasonal timing, and reproduction.25,37 Furthermore, exposure to light at night is another powerful stimulus that changes the internal clock phase and disrupts the endogenous rhythm of the day-night cycle.26 In all mammal studies, whether exhibiting nocturnal or diurnal activity, melatonin is synthesized in the pineal gland during the dark phase of light/darkness and rapidly delivered to the body through the bloodstream.38 The daily rhythm of melatonin is thought to be the circadian medium used by the endogenous venous SCN clock to transmit circadian information to the melatonin target structure.38 Exogenous light stimulation has been demonstrated to play a significant role in regulating the secretion and expression of melatonin in biological rhythm.39 At night, the SCN signals the pineal gland via sympathetic neurons to release norepinephrine, which in turn stimulates the transcription of the arylalkylamine n-acetyltransferase (AA-NAT) gene.40–42 This change in the activity of AA-NAT is responsible for the variation in melatonin levels, and ultimately for the circadian rhythm.43 In our study, we observed that the distribution of MT and AA-NAT concentrations over time exhibited distinct patterns between the treatment groups and the control group. The findings indicated that blue light may have an impact on the circadian rhythm, and it was particularly involved in the synthesis of melatonin.
Oxford Nanopore Technologies (ONT) sequencing stands as a unique third-generation sequencing technology that is based on electrical signals to identify base sequences.44 The full-length transcriptome, in its entirety and without interruption, can be utilised to directly obtain high-quality full-length sequences of transcripts from 5′ to 3′, based on a third-generation sequencing platform.45 The hypothalamic samples utilised for RNA sequencing were obtained exclusively during the time period spanning from ZT12 to ZT14. The expression of clock-related genes is subject to diurnal variation. The peak phases of the majority of rhythmic brain regions in mice are concentrated during the subjective dark night period (CT20 ~ 22), which corresponds precisely to the end of the mouse’s active period.46 A comparative transcriptome analysis was conducted between the control group and the treatment groups. This analysis revealed that 334 DEGs in the L3 group were up-regulated, while 276 DEGs were down-regulated. In the L6 group, 596 DEGs were up-regulated, with 298 DEGs being down-regulated. The S3 group exhibited 270 up-regulated DEGs and 156 down-regulated DEGs. Finally, the S6 group showed 139 up-regulated DEGs and 258 down-regulated DEGs. The application of Venn diagrams revealed 52 genes that are most probably associated with circadian rhythm. Furthermore, we analysed the differences in transcriptomes between the various treatment groups. In the L6 group, 704 DEGs were up-regulated and 413 DEGs were down-regulated compared to the L3 group. In the S6 group, 142 DEGs were up-regulated and 281 DEGs were down-regulated compared to the S3 group. In the L6 group, 299 DEGs were up-regulated and 49 DEGs were down-regulated compared to the S6 group. In the L3 group, 183 DEGs were up-regulated and 336 DEGs were down-regulated compared to the S3 group. Despite the identification of a substantial number of differentially expressed genes among the various groups, the limited number of samples within each group, and the relaxed criteria for determining differences, both factors would have a detrimental effect on the accuracy of the results. Consequently, the expression of these genes was verified by RT-qPCR, yielding results that were consistent with the findings of the transcriptome sequencing analysis. The resulting data can provide necessary tissue-specific insights for the hypothalamus transcriptome, including the number, the expression level, and the distribution of DEGs. The application of this method facilitates the examination of target genes’ expression within the context of circadian rhythm, thereby contributing to the advancement of research in the field of genetics. Furthermore, it can be used to select candidate genes that are more functionally related to circadian rhythm.
The findings suggest that sleep restriction exerts a detrimental effect on the circadian rhythm of clock gene expression in the hypothalamus.47 The hypothalamus express several rhythmic genes, such as ARNTL and BMAL1, which exhibit circadian fluctuations in the hypothalamus.48 Furthermore, the hypothalamus transcriptome profiles of SD rats exposed to blue light were notably different from those of control SD rats, with significant differences at varying wavelengths and exposure times. The transcription of mammalian clock genes within the cell-autonomous core of the circadian oscillator is a highly regulated process.49 Mechanisms of posttranscriptional regulation are increasingly recognized as crucial in circadian rhythm regulation.50,51 In mammals, the Clock and Bmal1 genes represent positive elements in the molecular feedback loop,52,53 while cycle genes (Per1, Per2, Per3) and cryptochrome genes (Cry1 and Cry2) are negative elements of the circadian feedback loop.54,55 Rasd1 has been shown to regulate circadian rhythms through photic and non-photic inputs.56 Additionally, the potential of circadian rhythm genes as biomarkers for response to chemotherapy and immunotherapy in specific cancers has been identified.57 The secretion of melatonin by the pineal gland is regulated by the SCN of the hypothalamus via a series of positive and negative feedback loops, resulting in the expression of various core clock genes.58 In our study, we identified significant differences in the expression levels of Arntl, Per1, Rasd1, Npy2r and Csnk2a1 between the treatment and control groups, and there was a partial significant correlation between these expression levels and MT and AA-NAT concentrations. However, it was important to note that this result may be influenced by two factors: the limited sample size and the lack of strictness applied to the parameters. Since pineal melatonin is synthesised and released into the bloodstream under the control of the endogenous clock in the SCN, a significant change in the circadian rhythm of melatonin is caused by a disrupted clock gene circadian rhythm.59
It has been reported that the activation of the cAMP/ PKA/CREB signaling pathway enhances the transcription of Aa-nat, an enzyme involved in melatonin synthesis.40,60–65 The circadian clock gene Bmal1 transcriptionally targets PAI-1 to suppress TGF-beta functions by inhibiting plasmin production, and pharmacological inhibition of the TGF-beta signaling largely ablated the circadian disruption-triggered cancer metastasis. In our study, KEGG pathway enrichment analysis revealed that the DEGs of the treatment groups were significantly enriched in the cAMP signaling pathway and TGF-beta signaling pathway compared to the control group. The impact of night shift work on the temporal coordination between the human circadian transcriptome and its environment has been demonstrated to be associated with alterations in natural killer cell-mediated immune responses and the Jun/AP1 and STAT pathways.66 Disruptions to the JAK/STAT pathway can also affect behavioural rhythms, and the clock appears to regulate JAK/STAT signalling, with central clock neurons projecting to cells that express Udp in Drosophila.67 The effects of light on the circadian clock, including behavioral phase shifts and induction of gene transcription, have been shown to rely on the MAPK signaling pathway.68,69 Research conducted utilising diverse model systems has demonstrated that the MAPK pathway regulates both input to and output from the clock.70–74 The MAPK pathway has also been demonstrated to modulate the core clock transcriptional loop.75 The MAPK pathway dependent gene expression in the SCN may be partly the consequence of CRE-dependent transcription being stimulated.69 To further explore the potential molecular mechanisms and pathways of circadian rhythm regulation, gene set enrichment analysis was performed. The results of the GSEA revealed significant inhibition of the JAK-STAT signaling pathway in the treatment groups, while the MAPK signaling pathway was found to be significantly enriched. In conclusion, GSEA further demonstrated in the present study that the disruption of gene expression patterns related to the circadian rhythm was a potential underlying mechanism. This Chrono disruption has been demonstrated to be a causative factor for a range of physical impairments, including, but not limited to, increased risk of gastrointestinal disorders, metabolic syndrome, diabetes, heart disease, and cancer.76
The retinohypothalamic tract is a distinct neural pathway that mediates light-regulated circadian rhythms and projects from the retina to the SCN.77 Another neural pathway extends from the SCN to the pineal gland.78 This pathway facilitates the perception of light and dark cycles through the mammalian eye, entraining the SCN neural activity and, consequently, regulating the rhythmic secretion of melatonin from the pineal gland.31 In the present study, it was observed that exposure to blue light resulted in retinal structural damage to SD rats. The blue light was hypothesised to transmitted through the retina to the SCN, where it was believed to regulate the transcription of the SCN. The hypothesis is that it may regulate the secretion of melatonin in the pineal gland through the TGF-beta signalling pathway, MAPK signaling pathway, and JAK/STAT signaling pathway, amongst other potential mechanisms.
While the research results offer valuable insights into the transcriptional profiles of SD rats exposed to blue light, there are certain limitations that should be noted. Firstly, the utilisation of male SD rats in this study was predicated on their heightened sensitivity to blue light, a factor which could result in deviations in the research results. Secondly, the small sample size and loose difference parameters may lead to false positives. Future studies should also expand the cohort size and combine with more stringent quality control parameters to obtain more accurate results. Thirdly, despite undertaking independent studies of retinal damage, alterations in melatonin and AA-NAT concentrations, and the transcriptional profile of hypothalamic tissues caused by blue light, we were incapable of establishing a robust link between these factors in order to provide a comprehensive explanation of the consequences of blue light exposure in SD rats. Fourthly, due to the lack of evidence for other functional circadian rhythm disorders such as those related to physical activities or body temperature rhythms, it needs to be particularly considered and addressed in further research. Finally, the collection time of the hypothalamic samples used for RNA sequencing was not continuous, and the evidence for the possible mechanisms affecting the circadian rhythm was insufficient. In subsequent studies, we will supplement multiple and consecutive time points for research.
Conclusions
In conclusion, our study demonstrated a profile of the transcriptome affected by blue light on circadian rhythm in SD rats. Blue light damaged the retinal cytoarchitecture and disrupted melatonin and AA-NAT levels in blood of SD rats. By using a Full-length transcriptome, we observed 52 differentially expressed mRNAs (10 upregulated, 42 downregulated) in all group to blue light exposure, and the TGF-beta signaling pathway is an important candidate pathway in this process. Future research should explore the pathophysiological consequences of these changes and their potential as therapeutic targets for circadian rhythm-related diseases.
Data Sharing Statement
All data are available from the corresponding author upon reasonable request.
Acknowledgments
The authors thank Biomarker Technologies Corporation for providing experimental technique.
Author Contributions
All the authors reviewed and agreed on all versions of the article before submission, during revision, the final version accepted for publication, and any significant changes introduced at the proofing stage. All the authors agree to take responsibility and be accountable for the contents of the article.
Conceptualization, Jia Meng; Project administration, Jia Meng; Methodology, Yuying Wang, Qinglong Cao, Mengfan Li, Qibin Zhang and Yang Liu; Data curation, Yuying Wang; Validation, Qinglong Cao and Qibin Zhang; Resources, Yadi Wang and Mingchao Zhang; Formal Analysis, Mingchao Zhang, Yang Liu and Lin Tang; Writing- original draft, Jia Meng, Yuying Wang, Qinglong Cao, Mengfan Li, Qibin Zhang, Mingchao Zhang and Yang Liu; Writing review and editing, Yadi Wang and Lin Tang; Funding Acquisition, Jia Meng and Mingchao Zhang.
Funding
This research was funded by the horizontal topic research of Jinzhou Medical University (NO: 2022001) and the Basic Scientific Research Project of Education Department of Liaoning Province (NO: jytms20231738 and NO: LJKMZ20221233).
Disclosure
All authors do not have any financial or non-financial relationships or conflicts of interest to disclose.
References
1. Buijs RM, Kalsbeek A. Hypothalamic integration of central and peripheral clocks. Nat Rev Neurosci. 2001;2(7):521–15. doi:10.1038/35081582
2. Moore RY, Eichler VB. Loss of a circadian adrenal corticosterone rhythm following suprachiasmatic lesions in the rat. Brain Res. 1972;42(1):201–206. doi:10.1016/0006-8993(72)90054-6
3. Tahkamo L, Partonen T, Pesonen AK. Systematic review of light exposure impact on human circadian rhythm. Chronobiol Int. 2019;36(2):151–170. doi:10.1080/07420528.2018.1527773
4. Tapia-Osorio A, Salgado-Delgado R, Angeles-Castellanos M, Escobar C. Disruption of circadian rhythms due to chronic constant light leads to depressive and anxiety-like behaviors in the rat. Behav Brain Res. 2013;252:1–9. doi:10.1016/j.bbr.2013.05.028
5. Berson DM, Dunn FA, Takao M. Phototransduction by retinal ganglion cells that set the circadian clock. Science. 2002;295(5557):1070–1073. doi:10.1126/science.1067262
6. Yan SS, Wang W. The effect of lens aging and cataract surgery on circadian rhythm. Int J Ophthalmol. 2016;9(7):1066–1074. doi:10.18240/ijo.2016.07.21
7. Song W, Zhu R, Gao W, Xing C, Yang L. Blue light induces RPE cell necroptosis, which can be inhibited by minocycline. Front Med. 2022;9:831463. doi:10.3389/fmed.2022.831463
8. Panda S, Nayak SK, Campo B, Walker JR, Hogenesch JB, Jegla T. Illumination of the melanopsin signaling pathway. Science. 2005;307(5709):600–604. doi:10.1126/science.1105121
9. Provencio I, Rodriguez IR, Jiang G, Hayes WP, Moreira EF, Rollag MD. A novel human opsin in the inner retina. J Neurosci. 2000;20(2):600–605. doi:10.1523/JNEUROSCI.20-02-00600.2000
10. Qiu X, Kumbalasiri T, Carlson SM, et al. Induction of photosensitivity by heterologous expression of melanopsin. Nature. 2005;433(7027):745–749. doi:10.1038/nature03345
11. Hattar S, Liao HW, Takao M, Berson DM, Yau KW. Melanopsin-containing retinal ganglion cells: architecture, projections, and intrinsic photosensitivity. Science. 2002;295(5557):1065–1070. doi:10.1126/science.1069609
12. Panda S, Sato TK, Castrucci AM, et al. Melanopsin (Opn4) requirement for normal light-induced circadian phase shifting. Science. 2002;298(5601):2213–2216. doi:10.1126/science.1076848
13. Phelps J. Dark therapy for bipolar disorder using amber lenses for blue light blockade. Med Hypotheses. 2008;70(2):224–229. doi:10.1016/j.mehy.2007.05.026
14. Zimmerman ME, Kim MB, Hale C, Westwood AJ, Brickman AM, Shechter A. Neuropsychological function response to nocturnal blue light blockage in individuals with symptoms of insomnia: a pilot randomized controlled study. J Int Neuropsychol Soc. 2019;25(7):668–677. doi:10.1017/S1355617719000055
15. Zhang CX, Fan B, Chi J, et al. Differences between long- and short-wavelength light-induced retinal damage and the role of PARP-1 in retinal injury induced by blue light. Exp Eye Res. 2024;244:109946. doi:10.1016/j.exer.2024.109946
16. Alkozi HA, Wang X, Perez de Lara MJ, Pintor J. Presence of melanopsin in human crystalline lens epithelial cells and its role in melatonin synthesis. Exp Eye Res. 2017;154:168–176. doi:10.1016/j.exer.2016.11.019
17. Dong K, Goyarts EC, Pelle E, Trivero J, Pernodet N. Blue light disrupts the circadian rhythm and create damage in skin cells. Int J Cosmet Sci. 2019;41(6):558–562. doi:10.1111/ics.12572
18. Gentry NW, Ashbrook LH, Fu YH, Ptacek LJ. Human circadian variations. J Clin Invest. 2021;131(16):e148282. doi:10.1172/JCI148282
19. Higuchi S, Lin Y, Qiu J, et al. Is the use of high correlated color temperature light at night related to delay of sleep timing in university students? A cross-country study in Japan and China. J Physiol Anthropol. 2021;40(1):7. doi:10.1186/s40101-021-00257-x
20. Ishizawa M, Uchiumi T, Takahata M, Yamaki M, Sato T. Effects of pre-bedtime blue-light exposure on ratio of deep sleep in healthy young men. Sleep Med. 2021;84:303–307. doi:10.1016/j.sleep.2021.05.046
21. Albrecht U, Sun ZS, Eichele G, Lee CC. A differential response of two putative mammalian circadian regulators, mper1 and mper2, to light. Cell. 1997;91(7):1055–1064. doi:10.1016/s0092-8674(00)80495-x
22. McMahon DG, Iuvone PM, Tosini G. Circadian organization of the mammalian retina: from gene regulation to physiology and diseases. Prog Retin Eye Res. 2014;39:58–76. doi:10.1016/j.preteyeres.2013.12.001
23. Schwartz WJ, Tavakoli-Nezhad M, Lambert CM, Weaver DR, de la Iglesia HO. Distinct patterns of Period gene expression in the suprachiasmatic nucleus underlie circadian clock photoentrainment by advances or delays. Proc Natl Acad Sci U S A. 2011;108(41):17219–17224. doi:10.1073/pnas.1107848108
24. Fukuhara C, Dirden JC, Tosini G. Circadian expression of period 1, period 2, and arylalkylamine N-acetyltransferase mRNA in the rat pineal gland under different light conditions. Neurosci Lett. 2000;286(3):167–170. doi:10.1016/s0304-3940(00)01129-0
25. Cajochen C, Krauchi K, Wirz-Justice A. Role of melatonin in the regulation of human circadian rhythms and sleep. J Neuroendocrinol. 2003;15(4):432–437. doi:10.1046/j.1365-2826.2003.00989.x
26. Kandalepas PC, Mitchell JW, Gillette MU. Melatonin signal transduction pathways require E-box-mediated transcription of Per1 and Per2 to reset the SCN clock at Dusk. PLoS One. 2016;11(6):e0157824. doi:10.1371/journal.pone.0157824
27. Jones SE, Lane JM, Wood AR, et al. Genome-wide association analyses of chronotype in 697,828 individuals provides insights into circadian rhythms. Nat Commun. 2019;10(1):343. doi:10.1038/s41467-018-08259-7
28. Xu Y, Toh KL, Jones CR, Shin JY, Fu YH, Ptacek LJ. Modeling of a human circadian mutation yields insights into clock regulation by PER2. Cell. 2007;128(1):59–70. doi:10.1016/j.cell.2006.11.043
29. Moon HY, Jeong IC. The effect of voluntary exercise on light cycle stress-induced metabolic resistance. Phys Act Nutr. 2023;27(3):1–9. doi:10.20463/pan.2023.0022
30. Brainard GC, Hanifin JP, Warfield B, et al. Short-wavelength enrichment of polychromatic light enhances human melatonin suppression potency. J Pineal Res. 2015;58(3):352–361. doi:10.1111/jpi.12221
31. Brainard GC, Hanifin JP, Greeson JM, et al. Action spectrum for melatonin regulation in humans: evidence for a novel circadian photoreceptor. J Neurosci. 2001;21(16):6405–6412. doi:10.1523/JNEUROSCI.21-16-06405.2001
32. Bedrosian TA, Fonken LK, Nelson RJ. Endocrine effects of circadian disruption. Annu Rev Physiol. 2016;78:109–131. doi:10.1146/annurev-physiol-021115-105102
33. Fonken LK, Aubrecht TG, Melendez-Fernandez OH, Weil ZM, Nelson RJ. Dim light at night disrupts molecular circadian rhythms and increases body weight. J Biol Rhythms. 2013;28(4):262–271. doi:10.1177/0748730413493862
34. Fonken LK, Nelson RJ. The effects of light at night on circadian clocks and metabolism. Endocr Rev. 2014;35(4):648–670. doi:10.1210/er.2013-1051
35. Masis-Vargas A, Ritsema W, Mendoza J, Kalsbeek A. Metabolic effects of light at night are time- and wavelength-dependent in rats. Obesity. 2020;28(Suppl 1):S114–S125. doi:10.1002/oby.22874
36. Scheiermann C, Kunisaki Y, Frenette PS. Circadian control of the immune system. Nat Rev Immunol. 2013;13(3):190–198. doi:10.1038/nri3386
37. Srinivasan V, Spence WD, Pandi-Perumal SR, Zakharia R, Bhatnagar KP, Brzezinski A. Melatonin and human reproduction: shedding light on the darkness hormone. Gynecol Endocrinol. 2009;25(12):779–785. doi:10.3109/09513590903159649
38. Simonneaux V, Ribelayga C. Generation of the melatonin endocrine message in mammals: a review of the complex regulation of melatonin synthesis by norepinephrine, peptides, and other pineal transmitters. Pharmacol Rev. 2003;55(2):325–395. doi:10.1124/pr.55.2.2
39. Jastrow H, Racke J. Analysis of synaptic bodies in the Sprague-Dawley rat pineal gland under extreme photoperiods. Micron. 2007;38(3):237–251. doi:10.1016/j.micron.2006.06.013
40. Baler R, Covington S, Klein DC. The rat arylalkylamine N-acetyltransferase gene promoter. cAMP activation via a cAMP-responsive element-CCAAT complex. J Biol Chem. 1997;272(11):6979–6985. doi:10.1074/jbc.272.11.6979
41. Fukuhara C, Tosini G. Analysis of daily and circadian gene expression in the rat pineal gland. Neurosci Res. 2008;60(2):192–198. doi:10.1016/j.neures.2007.10.011
42. Maronde E, Wicht H, Tasken K, et al. CREB phosphorylation and melatonin biosynthesis in the rat pineal gland: involvement of cyclic AMP dependent protein kinase type II. J Pineal Res. 1999;27(3):170–182. doi:10.1111/j.1600-079x.1999.tb00613.x
43. Klein DC, Coon SL, Roseboom PH, et al. The melatonin rhythm-generating enzyme: molecular regulation of serotonin N-acetyltransferase in the pineal gland. Recent Prog Horm Res. 1997;52:
44. Lu H, Giordano F, Ning Z. Oxford nanopore MinION sequencing and genome assembly. Genomics Proteomics Bioinf. 2016;14(5):265–279. doi:10.1016/j.gpb.2016.05.004
45. Grabherr MG, Haas BJ, Yassour M, et al. Full-length transcriptome assembly from RNA-Seq data without a reference genome. Nat Biotechnol. 2011;29(7):644–652. doi:10.1038/nbt.1883
46. Yamashita K, Kinoshita FL, Yoshida SY, et al. A whole-brain single-cell atlas of circadian neural activity in mice. Science. 2025:eaea3381. doi:10.1126/science.aea3381
47. Li W, Wang Z, Cao J, Dong Y, Chen Y. Role of sleep restriction in daily rhythms of expression of hypothalamic core clock genes in mice. Curr Issues Mol Biol. 2022;44(2):609–625. doi:10.3390/cimb44020042
48. Haddad M, Khazali H, Janahmadi M, Ghanbarian H. The differential effects of blocking retinal orexin receptors on the expression of retinal c-fos and hypothalamic Vip, PACAP, Bmal1, and c-fos in male wistar rats. Exp Eye Res. 2024;244:109943. doi:10.1016/j.exer.2024.109943
49. Patke A, Young MW, Axelrod S. Molecular mechanisms and physiological importance of circadian rhythms. Nat Rev Mol Cell Biol. 2020;21(2):67–84. doi:10.1038/s41580-019-0179-2
50. Kojima S, Shingle DL, Green CB. Post-transcriptional control of circadian rhythms. J Cell Sci. 2011;124(Pt 3):311–320. doi:10.1242/jcs.065771
51. Pagan C, Goubran-Botros H, Delorme R, et al. Disruption of melatonin synthesis is associated with impaired 14-3-3 and miR-451 levels in patients with autism spectrum disorders. Sci Rep. 2017;7(1):2096. doi:10.1038/s41598-017-02152-x
52. Bunger MK, Wilsbacher LD, Moran SM, et al. Mop3 is an essential component of the master circadian pacemaker in mammals. Cell. 2000;103(7):1009–1017. doi:10.1016/s0092-8674(00)00205-1
53. Gekakis N, Staknis D, Nguyen HB, et al. Role of the CLOCK protein in the mammalian circadian mechanism. Science. 1998;280(5369):1564–1569. doi:10.1126/science.280.5369.1564
54. Emery P, Reppert SM. A rhythmic Ror. Neuron. 2004;43(4):443–446. doi:10.1016/j.neuron.2004.08.009
55. Lowrey PL, Takahashi JS. Mammalian circadian biology: elucidating genome-wide levels of temporal organization. Annu Rev Genomics Hum Genet. 2004;5:407–441. doi:10.1146/annurev.genom.5.061903.175925
56. Cheng HY, Obrietan K, Cain SW, et al. Dexras1 potentiates photic and suppresses nonphotic responses of the circadian clock. Neuron. 2004;43(5):715–728. doi:10.1016/j.neuron.2004.08.021
57. Liu Y, Guo S, Sun Y, et al. CRS: a circadian rhythm score model for predicting prognosis and treatment response in cancer patients. J Transl Med. 2023;21(1):185. doi:10.1186/s12967-023-04013-w
58. Govindarajulu M, Patel MY, Wilder DM, Long JB, Arun P. Blast exposure dysregulates nighttime melatonin synthesis and signaling in the pineal gland: a potential mechanism of blast-induced sleep disruptions. Brain Sci. 2022;12(10):1340. doi:10.3390/brainsci12101340
59. Challet E. Minireview: entrainment of the suprachiasmatic clockwork in diurnal and nocturnal mammals. Endocrinology. 2007;148(12):5648–5655. doi:10.1210/en.2007-0804
60. Chik CL, Mackova M, Price D, Ho AK. Adrenergic regulation and diurnal rhythm of p38 mitogen-activated protein kinase phosphorylation in the rat pineal gland. Endocrinology. 2004;145(11):5194–5201. doi:10.1210/en.2004-0864
61. Ferreira ZS, Markus RP. Characterisation of P2Y(1)-like receptor in cultured rat pineal glands. Eur J Pharmacol. 2001;415(2–3):151–156. doi:10.1016/s0014-2999(01)00823-8
62. Garcia RA, Afeche SC, Scialfa JH, et al. Insulin modulates norepinephrine-mediated melatonin synthesis in cultured rat pineal gland. Life Sci. 2008;82(1–2):108–114. doi:10.1016/j.lfs.2007.10.016
63. Karolczak M, Korf HW, Stehle JH. The rhythm and blues of gene expression in the rodent pineal gland. Endocrine. 2005;27(2):89–100. doi:10.1385/ENDO:27:2:089
64. Maronde E, Pfeffer M, Olcese J, et al. Transcription factors in neuroendocrine regulation: rhythmic changes in pCREB and ICER levels frame melatonin synthesis. J Neurosci. 1999;19(9):3326–3336. doi:10.1523/JNEUROSCI.19-09-03326.1999
65. Ribelayga C, Gauer F, Calgari C, Pevet P, Simonneaux V. Photoneural regulation of rat pineal hydroxyindole-O-methyltransferase (HIOMT) messenger ribonucleic acid expression: an analysis of its complex relationship with HIOMT activity. Endocrinology. 1999;140(3):1375–1384. doi:10.1210/endo.140.3.6552
66. Kervezee L, Cuesta M, Cermakian N, Boivin DB. Simulated night shift work induces circadian misalignment of the human peripheral blood mononuclear cell transcriptome. Proc Natl Acad Sci U S A. 2018;115(21):5540–5545. doi:10.1073/pnas.1720719115
67. Luo W, Sehgal A. Regulation of circadian behavioral output via a MicroRNA-JAK/STAT circuit. Cell. 2012;148(4):765–779. doi:10.1016/j.cell.2011.12.024
68. Coogan AN, Piggins HD. Circadian and photic regulation of phosphorylation of ERK1/2 and Elk-1 in the suprachiasmatic nuclei of the Syrian hamster. J Neurosci. 2003;23(7):3085–3093. doi:10.1523/JNEUROSCI.23-07-03085.2003
69. Dziema H, Oatis B, Butcher GQ, Yates R, Hoyt KR, Obrietan K. The ERK/MAP kinase pathway couples light to immediate-early gene expression in the suprachiasmatic nucleus. Eur J Neurosci. 2003;17(8):1617–1627. doi:10.1046/j.1460-9568.2003.02592.x
70. Sanada K, Hayashi Y, Harada Y, Okano T, Fukada Y. Role of circadian activation of mitogen-activated protein kinase in chick pineal clock oscillation. J Neurosci. 2000;20(3):986–991. doi:10.1523/JNEUROSCI.20-03-00986.2000
71. Hayashi Y, Sanada K, Fukada Y. Circadian and photic regulation of MAP kinase by Ras- and protein phosphatase-dependent pathways in the chick pineal gland. FEBS Lett. 2001;491(1–2):71–75. doi:10.1016/s0014-5793(01)02153-6
72. Ko GY, Ko ML, Dryer SE. Circadian regulation of cGMP-gated cationic channels of chick retinal cones. Erk MAP Kinase and Ca2+/calmodulin-dependent protein kinase II. Neuron. 2001;29(1):255–266. doi:10.1016/s0896-6273(01)00195-7
73. Williams JA, Su HS, Bernards A, Field J, Sehgal A. A circadian output in Drosophila mediated by neurofibromatosis-1 and Ras/MAPK. Science. 2001;293(5538):2251–2256. doi:10.1126/science.1063097
74. Butcher GQ, Doner J, Dziema H, Collamore M, Burgoon PW, Obrietan K. The p42/44 mitogen-activated protein kinase pathway couples photic input to circadian clock entrainment. J Biol Chem. 2002;277(33):29519–29525. doi:10.1074/jbc.M203301200
75. Sanada K, Okano T, Fukada Y. Mitogen-activated protein kinase phosphorylates and negatively regulates basic helix-loop-helix-PAS transcription factor BMAL1. J Biol Chem. 2002;277(1):267–271. doi:10.1074/jbc.M107850200
76. Van Cauter E, Holmback U, Knutson K, et al. Impact of sleep and sleep loss on neuroendocrine and metabolic function. Horm Res. 2007;67(Suppl 1):2–9. doi:10.1159/000097543
77. Moore RY. Organization and function of a central nervous system circadian oscillator: the suprachiasmatic hypothalamic nucleus. Fed Proc. 1983;42(11):2783–2789.
78. Morin LP. The circadian visual system. Brain Res Brain Res Rev. 1994;19(1):102–127. doi:10.1016/0165-0173(94)90005-1
 © 2026 The Author(s). This work is published and licensed by Dove Medical Press Limited. The
full terms of this license are available at https://www.dovepress.com/terms
and incorporate the Creative Commons Attribution
- Non Commercial (unported, 4.0) License.
By accessing the work you hereby accept the Terms. Non-commercial uses of the work are permitted
without any further permission from Dove Medical Press Limited, provided the work is properly
attributed. For permission for commercial use of this work, please see paragraphs 4.2 and 5 of our Terms.
© 2026 The Author(s). This work is published and licensed by Dove Medical Press Limited. The
full terms of this license are available at https://www.dovepress.com/terms
and incorporate the Creative Commons Attribution
- Non Commercial (unported, 4.0) License.
By accessing the work you hereby accept the Terms. Non-commercial uses of the work are permitted
without any further permission from Dove Medical Press Limited, provided the work is properly
attributed. For permission for commercial use of this work, please see paragraphs 4.2 and 5 of our Terms.