Back to Journals » Diabetes, Metabolic Syndrome and Obesity » Volume 16
Exploring the Correlation Between the Systemic Immune Inflammation Index (SII), Systemic Inflammatory Response Index (SIRI), and Type 2 Diabetic Retinopathy
Authors Wang S, Pan X ![]() , Jia B
, Jia B ![]() , Chen S
, Chen S
Received 29 August 2023
Accepted for publication 18 November 2023
Published 24 November 2023 Volume 2023:16 Pages 3827—3836
DOI https://doi.org/10.2147/DMSO.S437580
Checked for plagiarism Yes
Review by Single anonymous peer review
Peer reviewer comments 2
Editor who approved publication: Prof. Dr. Antonio Brunetti
Shuqi Wang,1,2 Xiaoyu Pan,1,2 Boying Jia,1,2 Shuchun Chen1,2
1Department of Internal Medicine, Hebei Medical University, Shijiazhuang, People’s Republic of China; 2Department of Endocrinology, Hebei General Hospital, Shijiazhuang, People’s Republic of China
Correspondence: Shuchun Chen, Department of Endocrinology, Hebei General Hospital, 348 Heping West Road, Shijiazhuang, Hebei, 050051, People’s Republic of China, Tel/Fax +86 311 85988406, Email [email protected]
Purpose: Systemic immune inflammation index (SII), systemic inflammatory response index (SIRI) are new inflammation indicators calculated after integrating multiple indicators in blood routine. This study aims to investigate the correlation between the SII, SIRI and type 2 diabetic retinopathy (T2DR) and the diagnostic significance of these indices in T2DR.
Patients and Methods: A retrospective analysis involved 500 patients diagnosed with type 2 diabetes (T2DM), categorized into two groups based on fundus examination results: the non-diabetic retinopathy group (NDR, n=256) and the diabetic retinopathy group (DR, n=244). We calculated SII and SIRI, and analyzed their associations with T2DR.
Results: The DR group exhibited significantly higher SII and SIRI values compared to the NDR group (P< 0.001). Mantel-Haenszel’s chi-square trend analysis revealed a notable linear trend (P< 0.001) between SII, SIRI, and DR. SII and SIRI exhibited moderate positive correlations with DR, (r=0.354, P< 0.001; r=0.469, P< 0.001), respectively. Binary logistic regression analysis identified SII and SIRI as independent risk factors for DR. Restrictive cubic spline analysis demonstrated a significant linear relationship between SII and DR (P total trend < 0.001, P nonlinear = 0.0657). Stratification by gender indicated that SII is more sensitive to the onset of DR in men. A significant nonlinear relationship was observed between SIRI and DR (P total trend < 0.001, P nonlinear = 0.0025), with no gender-related differences in SIRI’s association with DR. ROC curve analysis demonstrated that the combined use of SII and SIRI achieved the highest diagnostic accuracy for DR, with an AUC of 0.782, 74.6% sensitivity, and 69.9% specificity.
Conclusion: Our findings suggested that SII and SIRI as independent risk factors for DR. The high accuracy of SII combined with SIRI in diagnosing DR underscores their potential as early biological indicators for DR diagnosis.
Keywords: systemic immune inflammation index, system inflammatory response index, type 2 diabetic retinopathy, Inflammation
Graphical Abstract:

Introduction
Diabetic retinopathy (DR) is a microvascular complication of diabetes, which can lead to vision impairment and, in severe cases, blindness. Consequently, DR not only significantly affects patients’ quality of life but also imposes substantial psychological and economic pressure.1,2 On fundus examination, early signs of DR include damage to retinal vascular endothelium, and the formation of microaneurysm, followed by bleeding and exudation. As the condition progresses, it can lead to capillary occlusion, neovascular formation, fiber hyperplasia, and ultimately, retinal detachment. DR is categorized into non-proliferative and proliferative stages based on the severity of retinal lesions observed during the ophthalmoscope. Although advances in medical technology have improved the early screening and management of DR, some underserved areas, especially in rural areas with limited medical resources and low fundus examination rates, still face challenges in achieving timely diagnosis and treatment.2 Therefore, the identification of additional biological indicators is important for the early diagnosis and prevention of DR.
Research has demonstrated that chronic low-grade inflammation is a core process of the development of diabetes and metabolic syndrome. Inflammatory responses can induce insulin resistance, which in turn contributes to the onset and progression of type 2 diabetes complications.3 As emerging inflammatory markers, the Systemic Immune Inflammation Index (SII) and Systemic Inflammatory Response Index (SIRI) integrate various subgroups in white blood cells, which not only reflect the balance between inflammation and immune response but also be calculated using simple formulas.4 Recent studies linked SII to conditions such as cancer, cardiovascular disease, hepatic steatosis, and diabetic nephropathy.5–8 However, SIRI remains relatively underexplored, and the relationship between SII, SIRI, and DR remains unclear. Consequently, this study aims to investigate the potential role of SII and SIRI in DR.
Materials and Methods
Ethical Declaration: This study was conducted in strict adherence to the Helsinki Declaration of Principles and received approval from the Ethics Committee of Hebei General Hospital. At the same time, patients are informed of the purpose of this study and signed informed consent forms.
Experimental design: This study employed a cross-sectional design, utilizing clinical data obtained from January 2021 to June 2023 at Hebei General Hospital. The study population comprised 500 patients diagnosed with Type 2 diabetes. Inclusion criteria: 1) Individuals aged 18 to 80 years; 2) Diagnosed with Type 2 diabetes diagnosed according to the 1999 World Health Organization Diagnostic Standards for Diabetes Patients. Exclusion criteria: 1) Individuals with acute diabetes complications or experiencing acute stress states; 2) patients with non-healing diabetic foot ulcers; 3) Individuals with severe cardiac, liver, or renal insufficiency; 4) patients diagnosed with cancer, recent infections, immune system disorders, or blood system diseases; 5) and individuals with conditions such as Hyperthyroid eye disease or glaucoma, which hindered cooperation during fundoscopic examinations. All patients underwent a fundus examination and were subsequently categorized into two groups based on the DR classification standards established by the International Society of Ophthalmology in 2002: the non-diabetic retinopathy group (NDR, n=256) and the diabetic retinopathy group (DR, n=244).
Data collection and laboratory analysis: Detailed demographic data were collected, including age, gender, diabetes course, history of smoking, history of drinking, systolic blood pressure (SBP), diastolic blood pressure (DBP), height, and weight. Laboratory tests included neutrophils (NE), lymphocytes (LYM), monocytes (MO), platelets (PLT), glycated hemoglobin (HbA1c), fasting blood glucose (FBG), fasting insulin (Flns), aspartate transaminase (AST), alanine transaminase (ALT), albumin (ALB), blood creatinine (Cr), blood uric acid (UA), blood urea nitrogen (BUN), glomerular filtration rate (eGFR), total cholesterol (TC), triglycerides (TG), high-density lipoprotein cholesterol (HDL-C), and low-density lipoprotein cholesterol (LDL- C).Body mass index (BMI) was determined by dividing weight by the square of height, and the insulin resistance index (HOMA-IR) was calculated by multiplying fasting blood glucose by fasting insulin and dividing by 22.5. SII and SIRI are the latest inflammatory markers, calculated by indicators in the blood routine. Their calculation methods were as followed: the SII was calculated by multiplying the platelet count by the neutrophil count and dividing by the lymphocyte count, while the SIRI was calculated by multiplying the neutrophil count by the monocyte count and dividing by the lymphocyte count.
Statistical analysis: Statistical analysis of the collected data was performed using SPSS 21.0 software, while graphical representations were generated using GraphPad Prism 8.0.2 and R version 4.3.1 software. Measurement data that conformed to a normal distribution were expressed as mean ± standard deviation, with group comparisons performed using two independent samples t-tests. Non-normally distributed measurement data were expressed as the median and quantile spacing [M(P25%, P75%)], with group comparisons performed using the Mann–Whitney U-test. Chi-square trend testing via Mantel-Haenszel analysis was employed for trend analysis. Binary logistic regression analysis was used to identify independent risk factors for DR in T2DM patients. The analysis of nonlinear relationships between the risk of DR in T2DM patients and SII and SIRI was conducted using restrictive cubic spline analysis. The diagnostic value of SII and SIRI for DR in T2DM patients was determined through Receiver Operating Characteristic (ROC) curve analysis, including the calculation of the area under the curve (AUC). Statistical significance was established at P<0.05 for all analyses.
Results
Comparison of General Data and Laboratory-Related Indicators Between the Two Groups
Among all T2DM patients, Patients with DR exhibited significantly higher SII and SIRI levels compared to NDR patients (P<0.001). The incidence of DR was higher among male patients compared to the NDR group (P=0.025). DR patients had a significantly longer duration of diabetes compared to NDR patients (P<0.001). Several laboratory indicators were elevated in the DR group, including SBP, NE, MO, HOMA-IR, and Cr levels. Additionally, eGFR was reduced in the DR group (P<0.05). However, there were no significant differences between the DR and NDR groups in terms of age, smoking history, drinking history, DBP, BMI, LYM, PLT, HbA1c, ALT, AST, ALB, UA, BUN, TC, TG, HDL-C, or LDL-C (Table 1).
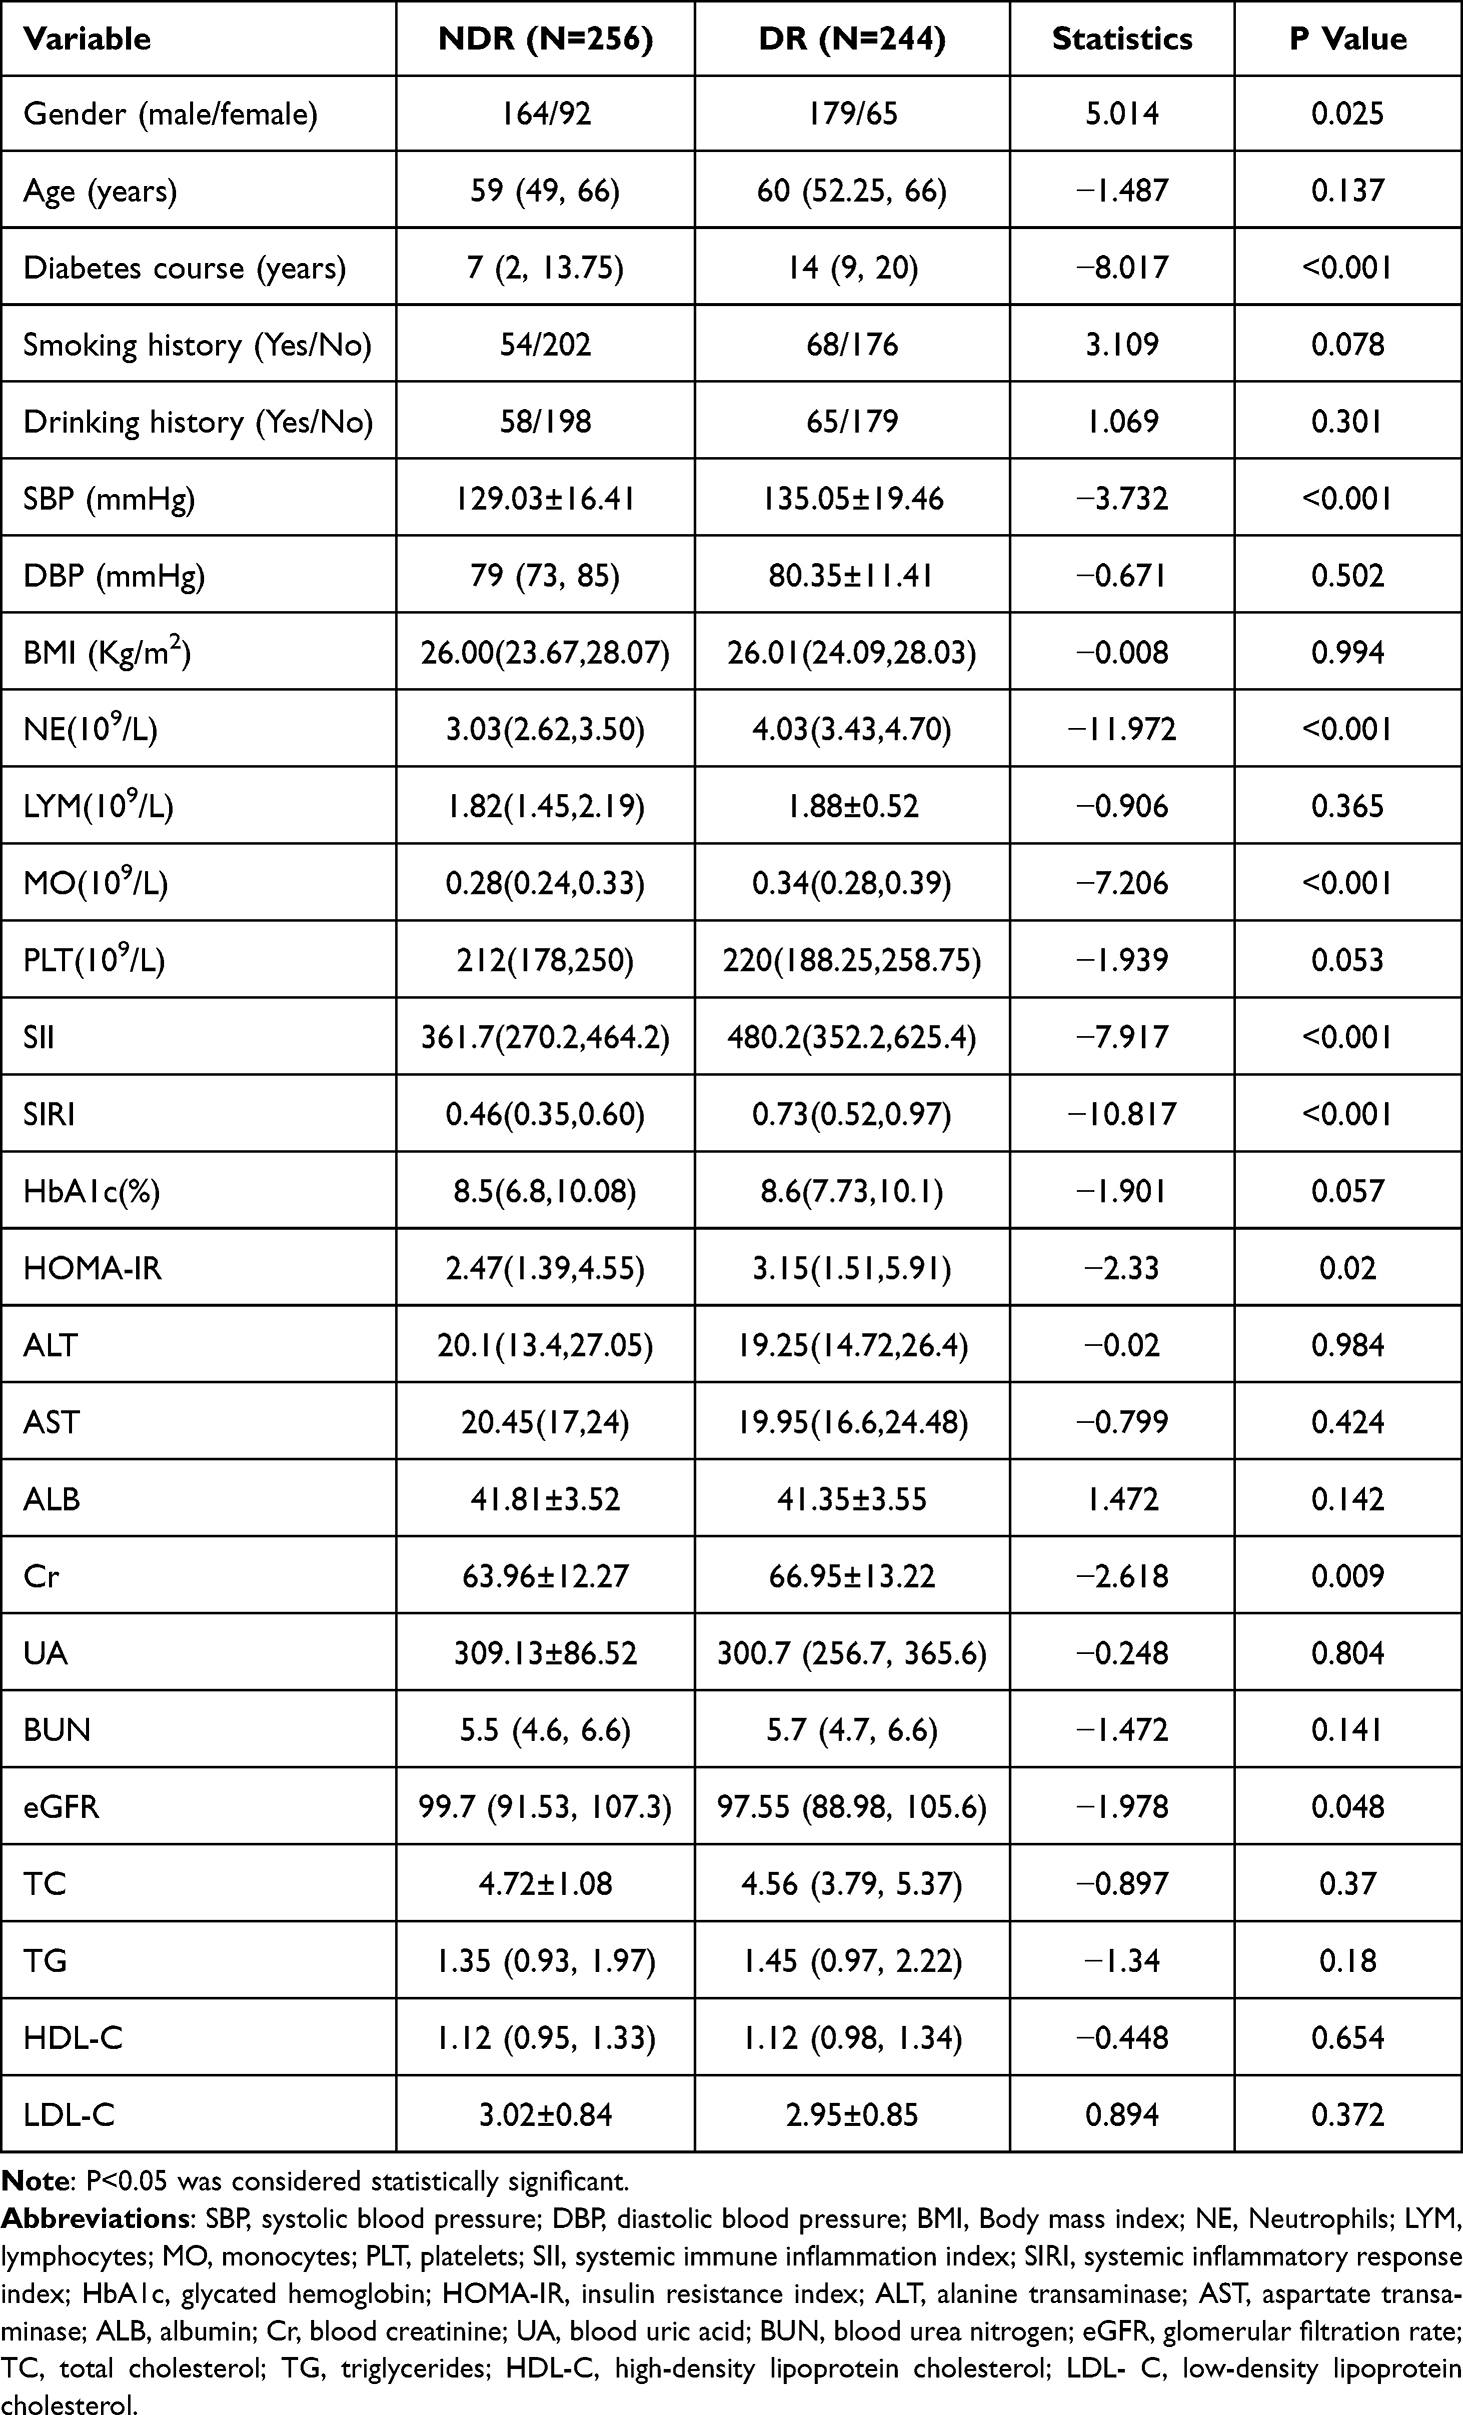 |
Table 1 Comparison of General Data and Laboratory-Related Indicators Between the Two Groups |
Trend Test of Interquartile Intervals and DR in SII and SIRI
We categorized patients into four groups based on quartile intervals of the SII quartile spacing level (A-D) to convert SII into ordered multi-classification variables. Specifically, Group A (SII<309.6599), group B (309.6599<SII<415.1037), group C (415.1037<SII<539. 7453), Group D (SII>539.7453), and each group comprised 125 patients. We performed a Mantel-Haenszel chi-square trend test on the four patient groups. Upon grouping, a linear trend was evident between SII and the occurrence of DR (P<0.001). Furthermore, a moderate positive correlation was observed between SII and DR (r=0.354, P<0.001). The incidence of DR demonstrated an escalating pattern with increasing SII quartile levels with rates of 26.4%, 41.6%, 51.2%, and 76.0% in Groups A, B, C, and D, respectively (Table 2).
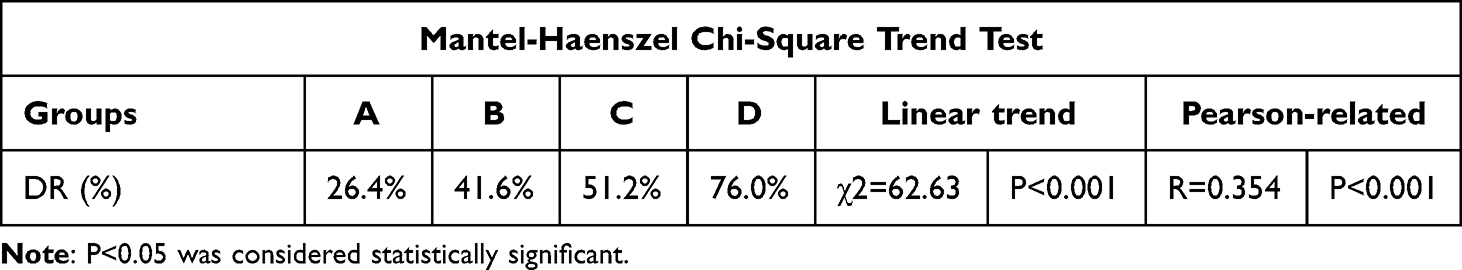 |
Table 2 SII Quartile Spacing and DR Trend Test |
Similarly, patients were categorized into four groups based on quartile intervals of the SIRI (Groups A-D) to convert SIRI into ordered multi-category variables: Group A (SIRI<0.3171), group B (0.3171<SIRI<0.4129), group C (0.4129<SIRI<0.5663), and group D (SIRI>0.7867). Each group consisted of 125 patients. A Mantel-Haenszel chi-square trend test was performed on these four patient groups. Upon grouping, we observed a linear trend between SIRI and the occurrence of DR (P<0.001). Furthermore, a moderate positive correlation was identified between SIRI and DR (r=0.469, P<0.001). The incidence of DR exhibited an increasing pattern with elevated SIRI quartile levels, with rates of 20%, 36.8%, 54.4%, and 84% in Groups A, B, C, and D, respectively (Table 3).
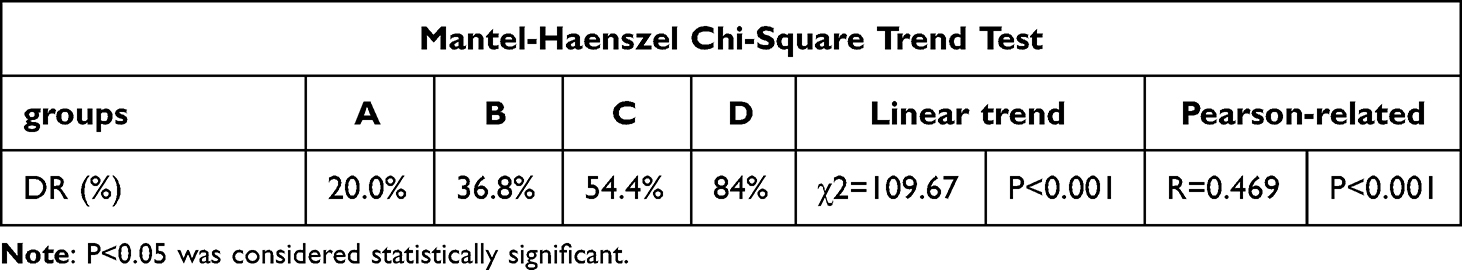 |
Table 3 SIRI Quartile Spacing and DR Trend Test |
Multi-Factor Regression Analysis of DR in T2DM Patients
To assess the factors influencing DR in T2DM patients, we conducted a binary logistic regression analysis, with DR as the dependent variable. Initially, we filtered the independent variables, retaining those with a candidate variables significance level of P<0.15. The following variables were included in the regression equation: gender, age, diabetes course, smoking history, SBP, HbA1c, HOMA-IR, ALB, Cr, BUN, eGFR, SII and SIRI. The HL test indicated a good fit of the regression model (χ2=15.411, P=0.052). The regression analysis revealed that SII, SIRI, age, diabetes course, SBP and HOMA-IR are independent risk factors for DR. For each additional unit of SII, the probability of DR in T2DM patients increased by 0.002 times, while for each additional unit of SIRI, the probability of DR increased significantly by 24.954 times (Table 4).
 |
Table 4 Binary Logistic Regression Analysis of DR in T2DM Patients |
Nonlinear Relationship Analysis of SII, SIRI, and DR Risk in T2DM Patients
After adjusting for gender, age, diabetes course, SBP and HOMA-IR as confounding factors, we assessed the relationship between SII, SIRI, and DR in T2DM patients. For SII, a significant linear relationship with the incidence of DR was observed (P total trend <0.001, P nonlinear = 0.0657). DR incidence significantly increased when SII > 416, and it increased linearly with higher SII values (Figure 1). Gender stratification revealed that SII is more sensitive to DR onset in men (Figure 2).
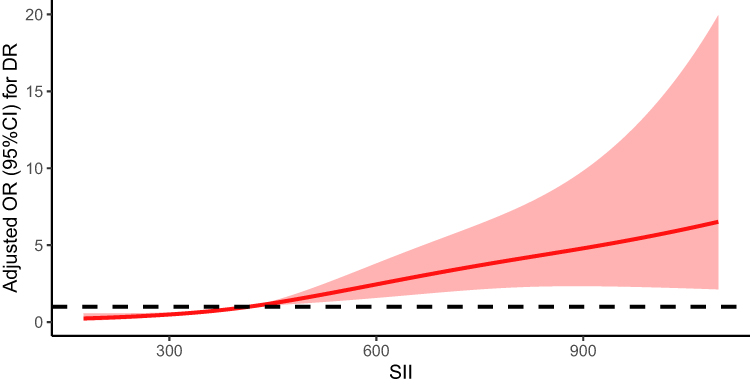 |
Figure 1 Non-linear relationship between SII and DR. Restrictive cubic spline is used to compare the relationship between DR and SII. |
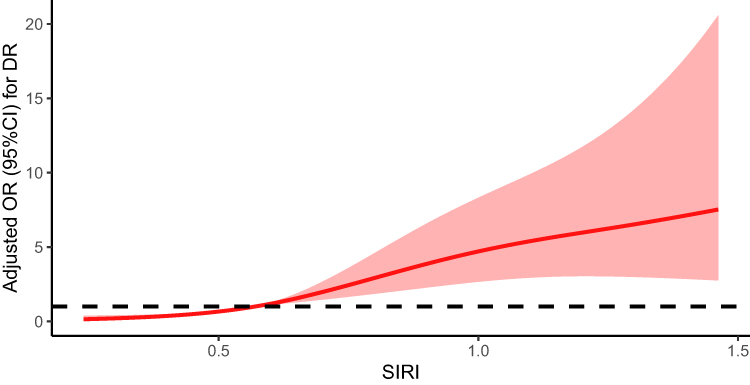 |
Figure 2 Non-linear relationship between SIRI and DR. Restrictive cubic spline is used to compare the relationship between DR and SIRI. |
Similarly, for SIRI, a significant nonlinear relationship with DR was observed (P total trend <0.001, P nonlinear = 0.0025). DR incidence significantly increased when SIRI > 0.567, and it increased nonlinearly with higher SIRI values (Figure 3). Interestingly, gender stratification showed no significant difference in the relationship between SIRI and DR (Figure 4).
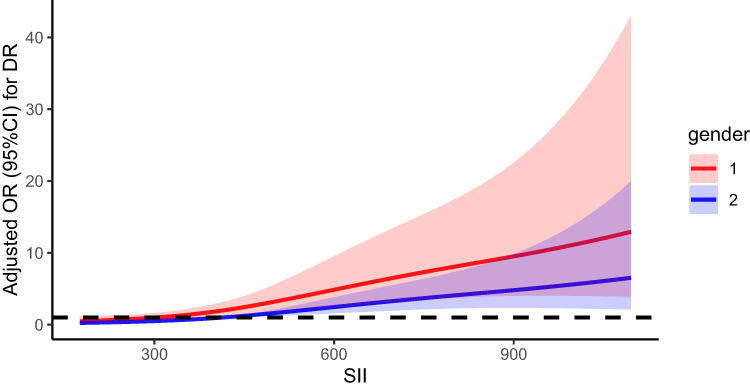 |
Figure 3 Through gender stratification, compare the different gender distributions of the relationship between DR and SII. Note: 1 for male, and 2 for female. |
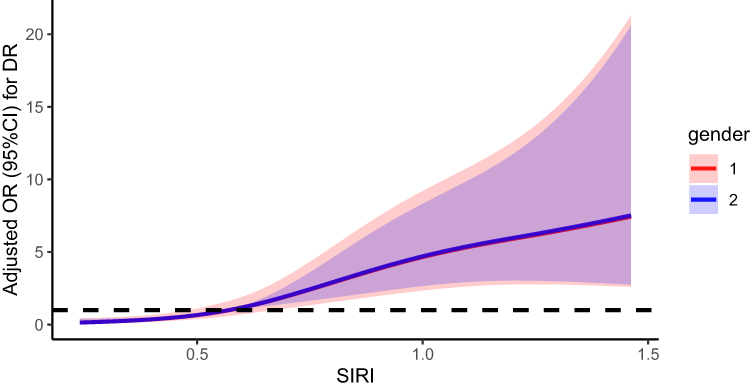 |
Figure 4 Through gender stratification, compare the different gender distributions of the relationship between DR and SIRI. Note: 1 for male, and 2 for female. |
ROC Curve Analysis of the Diagnostic Value of SII and SIRI for DR
The ROC curve analysis revealed that SII combined with SIRI exhibited the highest accuracy in evaluating DR, with an AUC of 0.782, a sensitivity of 74.6%, and a specificity of 69.9%. These values were superior to other factors evaluated, including AUC SIRI (0.780), diabetes course (0.707), SII (0.705), SBP (0.593), HOMA-IR (0.560), and Age (0.538). (Table 5, Figure 5).
 |
Table 5 ROC Curve Analysis of SII, SIRI, SII Combined with SIRI, Age, Diabetes Course, SBP, and HOMA-IR |
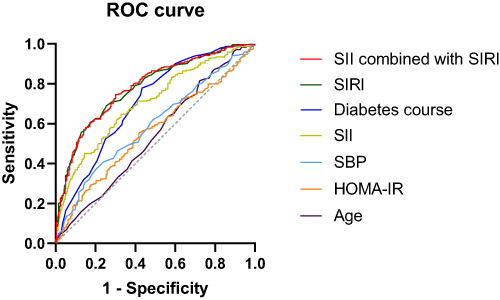 |
Figure 5 ROC Curve Analysis of SII, SIRI, SII combined with SIRI, age, diabetes course, SBP, and HOMA-IR. |
Discussion
The incidence and prevalence of DR, a chronic complication of diabetes, have been steadily increasing.1 Macular edema and proliferative retinopathy represent the primary pathological changes that adversely affect patients’ vision.9 In cases where significant macular edema or proliferative diabetic retinopathy is present in DR patients, prompt laser photocoagulation therapy is warranted. While this treatment can help preserve a patient’s current vision, it’s crucial to remember that vision deterioration, once it occurs, is irreversible.10 Recent data from the Global Disease Burden Research Vision Loss Expert Group underscores the alarming rise in vision impairment and blindness caused by DR over the past three decades.11 To prevent blindness in diabetes patients, early DR screening and intervention are of paramount importance.
DR is known to have a protracted development process before symptoms appear. Although the exact pathogenesis remains elusive, various studies have established connections between DR incidence and insulin resistance, oxidative stress, intestinal flora disorders, and chronic low-grade inflammation.12–15 Among these factors, chronic low-grade inflammation is central to the pathogenesis of DR and is a major contributor to insulin resistance and the metabolic syndrome.3,15–19 Portillo, etc. studied animal models with blocked inflammatory pathways, revealing a reduction in retinal leukoplakia incidence in diabetic mice. This suggests that inhibiting inflammatory reactions may slow the occurrence of DR.18 Hannah and others also detected increased levels of inflammatory proteins in DR patients using proteomic methods, indicating the important role of retinal inflammation in DR progression.19
Chronic low-grade inflammation manifests as a persistent, non-specificity, low-grade inflammatory state, marked by changes in various inflammatory cells and factors during an inflammatory response. Leukocyte exudation is the most important feature of this inflammatory reaction. Neutrophils, the primary subgroup of white blood cells, are the first to be recruited to an inflammatory site when inflammation occurs. Research, such as that conducted by Giovenzana et al highlights significantly elevated neutrophil levels in type 2 diabetes patients compared to healthy subjects.20 Neutrophils can regulate immunity through a variety of mechanisms. In recent years, extra neutrophil traps (NETs) have emerged as a new immune defense mechanism and an important regulator of diabetes and its complications.21 Under chronic inflammation stimulation, neutrophils become hyperactivated, leading to NET aggregation, which can cause vascular obstruction, and tissue damage, and exacerbate inflammation. Studies by Rachel and others have further substantiated the link between elevated NET levels and diabetes, diabetic nephropathy. This confirms the role of neutrophils in diabetes onset and its complications.21 Activation of monocyte-macrophages is an important sign of chronic inflammation. These activated cells secrete various inflammatory factors such as IL-1, IL-6, TNF-α, and MCP-1, which inhibit the insulin signal transduction pathway, activate intracellular signals promoting insulin resistance and T2DM, and contribute to the occurrence and progression of T2DM.22,23 Our study aligns with this body of research, as we observed significantly higher levels of neutrophils and monocyte in the DR group compared to the NDR group, supporting the association between increased neutrophil and monocyte counts and DR incidence, which is also consistent with the study by Grossmann et al17 Platelets play an important role in hemostasis and thrombosis, and have recently been recognized for their role in white blood cell recruitment and host immune defense regulation.24 Bioactive mediators expressed by activated platelets can promote platelet binding to other leukocyte subsets and upregulate leukocyte pro-inflammatory function.25 In summary, the increase in the neutrophils, monocytes, and platelets counts indicates immune system activation, indicating the presence of inflammation. Lymphocytes, on the other hand, play a vital role in immune defense and surveillance through both cellular and humoral immunity. Decreased lymphocyte counts reflect a decline in immune function. Camilla and others indicated that the lymphocyte-monocyte balance can better reflect a patient’s circulating immunity, the decline in lymphocytes, along with an increase in monocytes, often indicates a poorer tumor prognosis.26 Zhang’s 10-year prospective cohort study, demonstrated that neuroinflammation can mediate multisystem atrophy (MSA), and the neutrophil to lymphocyte ratio (NLR) serves as an independent risk factor, with higher NLR increasing MSA-related mortality.27
In recent years, SII and SIRI have emerged as new inflammatory markers. Research has revealed that SII and SIRI encompass platelets and various inflammatory cells found within white blood cells, including a variety of immune regulatory pathways in the body. When compared to individual white blood cells and platelets, these indices are less influenced by the body’s physiological and pathological states, enabling them to provide a more stable reflection of the body’s overall inflammatory condition.4,28 Moreover, the calculation methods for SII and SIRI are simple, cost-effective, relying solely on common blood routine parameters. Notably, SII and SIRI do not require active patient participation, making them particularly valuable for assessing diabetic patients with limited mobility or cognitive disorders. Existing research has demonstrated a close relationship between SII, SIRI and diabetes. SII can be employed in the prediction and evaluation of conditions such as diabetic nephropathy and depression.8,29 And SIRI has been independently associated with the risk of diabetic CVDs.30 However, the association between SII, SIRI, and DR has not been reported. Our study revealed that SII and SIRI levels in the DR group were higher than those in the NDR group. AS SII and SIRI levels increased, the incidence of DR in patients with type 2 diabetes showed positive correlation. Furthermore, our findings established that SII and SIRI are independent risk factors for assessing the incidence of DR in T2DM patients. ROC curve analysis demonstrated that both SII and SIRI displayed high diagnostic accuracy for DR among T2DM patients. Notably, when combined, SII and SIRI yielded the highest diagnostic accuracy for DR (with an AUC of 0.782). These results suggest that SII and SIRI hold significant diagnostic value for identifying DR in T2DM patients, potentially serving as valuable biological indicators of early DR screening.
There are still some limitations in this study. Firstly, due to its retrospective nature, the study cannot establish causal relationships between DR and SII or SIRI. Secondly, variables such as eating habits, medication, and exercise patterns among patients may not have been comprehensively considered. Finally, our study results are limited to a specific local population, with a relatively small sample size, limiting the broader applicability to most patients. Consequently, further correlation studies involving larger-scale clinical trials are necessary to confirm the relationships between SII, SIRI, and DR patients.
Conclusion
Our research presents a pioneering exploration into the close association between SII, SIRI, and the occurrence of DR in T2DM patients. SII and SIRI emerge as independent risk factors for DR, with increased levels of SII and SIRI potentially serving as valuable indicators of DR in T2DM patients.
Disclosure
The authors report no conflicts of interest in this work.
References
1. Ockrim Z, Yorston D. Managing diabetic retinopathy. BMJ. 2010;341(1):c5400. PMID: 20974661. doi:10.1136/bmj.c5400
2. Lin KY, Hsih WH, Lin YB, Wen CY, Chang TJ. Update in the epidemiology, risk factors, screening, and treatment of diabetic retinopathy. J Diabetes Investig. 2021;12(8):1322–1325. PMID: 33316144; PMCID: PMC8354492. doi:10.1111/jdi.13480
3. Olefsky JM, Glass CK. Macrophages, inflammation, and insulin resistance. Annu Rev Physiol. 2010;72(1):219–246. PMID: 20148674. doi:10.1146/annurev-physiol-021909-135846
4. Dziedzic EA, Gąsior JS, Tuzimek A, et al. Investigation of the associations of novel inflammatory biomarkers-systemic inflammatory index (SII) and systemic inflammatory response index (SIRI)-with the severity of coronary artery disease and acute coronary syndrome occurrence. Int J Mol Sci. 2022;23(17):9553. PMID: 36076952; PMCID: PMC9455822. doi:10.3390/ijms23179553
5. Li J, Cao D, Huang Y, et al. The prognostic and clinicopathological significance of systemic immune-inflammation index in bladder cancer. Front Immunol. 2022;13:865643. PMID: 35572533; PMCID: PMC9097688. doi:10.3389/fimmu.2022.865643
6. Li J, He D, Yu J, et al. Dynamic status of sii and siri alters the risk of cardiovascular diseases: evidence from kailuan cohort study. J Inflamm Res. 2022;15:5945–5957. PMID: 36274831; PMCID: PMC9584782. doi:10.2147/JIR.S378309
7. Xie R, Xiao M, Li L, et al. Association between SII and hepatic steatosis and liver fibrosis: a population-based study. Front Immunol. 2022;13:925690. PMID: 36189280; PMCID: PMC9520084. doi:10.3389/fimmu.2022.925690
8. Guo W, Song Y, Sun Y, et al. Systemic immune-inflammation index is associated with diabetic kidney disease in type 2 diabetes mellitus patients: evidence from NHANES 2011–2018. Front Endocrinol (Lausanne). 2022;13:1071465. PMID: 36561561; PMCID: PMC9763451. doi:10.3389/fendo.2022.1071465
9. Antonetti DA, Silva PS, Stitt AW. Current understanding of the molecular and cellular pathology of diabetic retinopathy. Nat Rev Endocrinol. 2021;17(4):195–206. PMID: 33469209; PMCID: PMC9053333. doi:10.1038/s41574-020-00451-4
10. Kollias AN, Ulbig MW. Diabetic retinopathy: early diagnosis and effective treatment. Dtsch Arztebl Int. 2010;107(5):75–83. PMID: 20186318; PMCID: PMC2828250. doi:10.3238/arztebl.2010.0075
11. Flaxman SR, Bourne RRA, Resnikoff S, et al. Vision Loss Expert Group of the Global Burden of Disease Study. Global causes of blindness and distance vision impairment 1990–2020: a systematic review and meta-analysis. Lancet Glob Health. 2017;5(12):e1221–e1234. PMID: 29032195. doi:10.1016/S2214-109X(17)30393-5
12. Petersen MC, Shulman GI. Mechanisms of insulin action and insulin resistance. Physiol Rev. 2018;98(4):2133–2223. PMID: 30067154; PMCID: PMC6170977. doi:10.1152/physrev.00063.2017
13. Kang Q, Yang C. Oxidative stress and diabetic retinopathy: molecular mechanisms, pathogenetic role and therapeutic implications. Redox Biol. 2020;37:101799. PMID: 33248932; PMCID: PMC7767789. doi:10.1016/j.redox.2020.101799
14. Wu H, Tremaroli V, Schmidt C, et al. The gut microbiota in prediabetes and diabetes: a population-based cross-sectional study. Cell Metab. 2020;32(3):379–390.e3. PMID: 32652044. doi:10.1016/j.cmet.2020.06.011
15. Ramos H, Hernández C, Simó R, Simó-Servat O. Inflammation: the link between neural and vascular impairment in the diabetic retina and therapeutic implications. Int J Mol Sci. 2023;24(10):8796. PMID: 37240138; PMCID: PMC10218195. doi:10.3390/ijms24108796
16. Forrester JV, Kuffova L, Delibegovic M. The role of inflammation in diabetic retinopathy. Front Immunol. 2020;11:583687. PMID: 33240272; PMCID: PMC7677305. doi:10.3389/fimmu.2020.583687
17. Grossmann V, Schmitt VH, Zeller T, et al. Profile of the immune and inflammatory response in individuals with prediabetes and type 2 diabetes. Diabetes Care. 2015;38(7):1356–1364. PMID: 25877811. doi:10.2337/dc14-3008
18. Portillo JC, Yu JS, Vos S, et al. Disruption of retinal inflammation and the development of diabetic retinopathy in mice by a CD40-derived peptide or mutation of CD40 in müller cells. Diabetologia. 2022;65(12):2157–2171. PMID: 35920844; PMCID: PMC9630214. doi:10.1007/s00125-022-05775-6
19. Youngblood H, Robinson R, Sharma A, Sharma S. Proteomic biomarkers of retinal inflammation in diabetic retinopathy. Int J Mol Sci. 2019;20(19):4755. PMID: 31557880; PMCID: PMC6801709. doi:10.3390/ijms20194755
20. Giovenzana A, Carnovale D, Phillips B, Petrelli A, Giannoukakis N. Neutrophils and their role in the aetiopathogenesis of type 1 and type 2 diabetes. Diabetes Metab Res Rev. 2022;38(1):e3483. PMID: 34245096. doi:10.1002/dmrr.3483
21. Njeim R, Azar WS, Fares AH, Azar ST, Kfoury Kassouf H, Eid AA. NETosis contributes to the pathogenesis of diabetes and its complications. J Mol Endocrinol. 2020;65(4):R65–R76. PMID: 33048064. doi:10.1530/JME-20-0128
22. Shoelson SE, Lee J, Goldfine AB. Inflammation and insulin resistance. J Clin Invest. 2006;116(7):1793–1801. PMID: 16823477; PMCID: PMC1483173. doi:10.1172/JCI29069
23. Imai Y, Dobrian AD, Weaver JR, et al. Interaction between cytokines and inflammatory cells in islet dysfunction, insulin resistance and vascular disease. Diabetes Obes Metab. 2013;3(S3):117–129. PMID: 24003928; PMCID: PMC3777698. doi:10.1111/dom.12161
24. Rossaint J, Margraf A, Zarbock A. Role of platelets in leukocyte recruitment and resolution of inflammation. Front Immunol. 2018;9:2712. PMID: 30515177; PMCID: PMC6255980. doi:10.3389/fimmu.2018.02712
25. Semple JW, Italiano JE Jr, Freedman J. Platelets and the immune continuum. Nat Rev Immunol. 2011;11(4):264–274. PMID: 21436837. doi:10.1038/nri2956
26. Lisanti C, Basile D, Garattini SK, et al. The SAFFO Study: sex-related prognostic role and cut-off definition of monocyte-to-lymphocyte ratio (mlr) in metastatic colorectal cancer. Cancers (Basel). 2022;15(1):175. PMID: 36612170; PMCID: PMC9818397. doi:10.3390/cancers15010175
27. Zhang L, Cao B, Hou Y, et al. High neutrophil-to-lymphocyte ratio predicts short survival in multiple system atrophy. NPJ Parkinsons Dis. 2022;8(1):11. PMID: 35058467; PMCID: PMC8776861. doi:10.1038/s41531-021-00267-7
28. Li X, Gu L, Chen Y, et al. Systemic immune-inflammation index is a promising non-invasive biomarker for predicting the survival of urinary system cancers: a systematic review and meta-analysis. Ann Med. 2021;53(1):1827–1838. PMID: 34647517; PMCID: PMC8519535. doi:10.1080/07853890.2021.1991591
29. Wang J, Zhou D, Dai Z, Li X. Association between systemic immune-inflammation index and diabetic depression. Clin Interv Aging. 2021;16:97–105. PMID: 33469277; PMCID: PMC7810592. doi:10.2147/CIA.S285000
30. Lin K, Lan Y, Wang A, Yan Y, Ge J. The association between a novel inflammatory biomarker, systemic inflammatory response index and the risk of diabetic cardiovascular complications. Nutr, Metab Cardiovasc Dis. 2023;33(7):1389–1397. PMID: 37156671. doi:10.1016/j.numecd.2023.03.013
 © 2023 The Author(s). This work is published and licensed by Dove Medical Press Limited. The
full terms of this license are available at https://www.dovepress.com/terms
and incorporate the Creative Commons Attribution
- Non Commercial (unported, 3.0) License.
By accessing the work you hereby accept the Terms. Non-commercial uses of the work are permitted
without any further permission from Dove Medical Press Limited, provided the work is properly
attributed. For permission for commercial use of this work, please see paragraphs 4.2 and 5 of our Terms.
© 2023 The Author(s). This work is published and licensed by Dove Medical Press Limited. The
full terms of this license are available at https://www.dovepress.com/terms
and incorporate the Creative Commons Attribution
- Non Commercial (unported, 3.0) License.
By accessing the work you hereby accept the Terms. Non-commercial uses of the work are permitted
without any further permission from Dove Medical Press Limited, provided the work is properly
attributed. For permission for commercial use of this work, please see paragraphs 4.2 and 5 of our Terms.
Recommended articles
The Ratio of Fibrinogen to Albumin is Related to the Occurrence of Retinopathy in Type 2 Diabetic Patients
Chen X, Zhao J, You Y, Li Z, Chen S
Diabetes, Metabolic Syndrome and Obesity 2023, 16:1859-1867
Published Date: 23 June 2023
Comparison of Clinical Profiles, Demographics, and Surgical Outcomes of 25-Gauge Vitrectomy for Proliferative Diabetic Retinopathy in Young Adults with Type 1 or Type 2 Diabetes
Zhang M, Zhang J, Xu G, Ruan L, Huang X
Diabetes, Metabolic Syndrome and Obesity 2023, 16:1967-1975
Published Date: 29 June 2023
Correlation Between Glycolipid Metabolism Levels and Diabetic Retinopathy in Patients with Type 2 Diabetes Mellitus
Wang S, Pan X, Zhang M, Chen S
Diabetes, Metabolic Syndrome and Obesity 2024, 17:1-9
Published Date: 3 January 2024
Construction of a Nomogram-Based Prediction Model for the Risk of Diabetic Kidney Disease in T2DM
Wang X, Liu X, Zhao J, Chen M, Wang L
Diabetes, Metabolic Syndrome and Obesity 2024, 17:215-225
Published Date: 12 January 2024
Targeting Senescence, Oxidative Stress, and Inflammation: Quercetin-Based Strategies for Ocular Diseases in Older Adults
Medoro A, Davinelli S, Scuderi L, Scuderi G, Scapagnini G, Fragiotta S
Clinical Interventions in Aging 2025, 20:791-813
Published Date: 7 June 2025