Back to Journals » Journal of Inflammation Research » Volume 19
Exploring the Association of Interleukin 13 Polymorphism (rs20541) and Serum Lipocalin 2 with Risk and Disability in Multiple Sclerosis
Authors Kamel FZ ![]() , El Shahawy AA
, El Shahawy AA ![]() , Abdelaziz EA, Mohamed EA, El Shahawy AA, Hassaneen AM
, Abdelaziz EA, Mohamed EA, El Shahawy AA, Hassaneen AM ![]() , Khater AZ, Mokhtar GA, Boghdady WAH
, Khater AZ, Mokhtar GA, Boghdady WAH
Received 11 November 2025
Accepted for publication 13 February 2026
Published 3 March 2026 Volume 2026:19 578371
DOI https://doi.org/10.2147/JIR.S578371
Checked for plagiarism Yes
Review by Single anonymous peer review
Peer reviewer comments 3
Editor who approved publication: Prof. Dr. Dharmappa Krishnappa
Fatma Z Kamel,1 Alia A El Shahawy,1 Eman Ahmed Abdelaziz,2 Eman Atef Mohamed,3 Aya A El Shahawy,4 Ahmad M Hassaneen,4 Asmaa Z Khater,5 Ghada A Mokhtar,1 Wesam Abdelmoniem Hafez Boghdady1
1Department of Medical Microbiology and Immunology, Faculty of Medicine, Zagazig University, Zagazig, Sharkia Governorate, Egypt; 2Department of Medical Biochemistry, Faculty of Medicine, Zagazig University, Zagazig, Sharkia Governorate, Egypt; 3Department of Neurology, Faculty of Medicine, Zagazig University, Zagazig, Sharkia Governorate, Egypt; 4Department of Clinical Pathology, Faculty of Medicine, Zagazig University, Zagazig, Egypt; 5Department of Radiodiagnosis at Ahmed Maher Teaching Hospital, Government of Teaching Hospitals and Institutes, Cairo, Egypt
Correspondence: Alia A El Shahawy, Microbiology & Immunology, Faculty of Medicine, Zagazig University, Zagazig, Sharkia Governorate, Egypt, Email [email protected] Fatma Z Kamel, Microbiology & Immunology, Faculty of Medicine, Zagazig University, Zagazig, Sharkia Governorate, Egypt, Email [email protected]
Background: Serum lipocalin 2 (LCN2) and human interleukin 13 (IL-13) polymorphism are important biomarkers in neurodegeneration, neuroinflammation and the development of multiple sclerosis (MS). This study aimed to evaluate IL-13 polymorphism and serum LCN2 in MS patients and assess their role as predictors of risk and disability in MS.
Methodology: This case–control study included 48 patients and 48 controls. Blood samples were obtained to measure LCN2 and to find the IL-13 (rs20541) gene polymorphism by restriction fragment length polymorphism. Individuals with the GG genotype, which is wild normal, produced two fluorescent bands at 210 and 26 bp. Three fluorescent bands were seen at 178, 32 and 26 bp in individuals with the homozygous mutant type AA genotype. Individuals with heterozygous mutant type GA gave four fluorescent bands at 210 bp, 178 bp, 32 bp and 26 bp.
Results: The IL-13 (rs20541) polymorphism revealed a statistically significant difference between the MS group and the healthy control group. The AG genotype raises the risk of MS by 9 times, whereas the risk of MS is approximately 3.58 times higher with the A allele. There was no statistically significant difference between the severity of disability in MS regarding IL-13 (rs20541) polymorphism. Also, there was a significant direct correlation between LCN2 and Expanded Disability Status Scale. The best cutoff values of LCN2 for diagnosis and detecting disability in MS were ≥ 5.4 ng/mL, with an area under the curve is 0.90 with sensitivity 85.7% and specificity 82.4%.
Conclusion: The research makes a substantial contribution to the literature on the perceived significance of value of IL-13 polymorphism to the risk of MS, while LCN2 is linked to both risk and disability of MS.
Keywords: autoimmune diseases, multiple sclerosis, IL-13, polymorphism, lipocalin 2
Introduction
Multiple sclerosis is a chronic autoimmune disease of myelin antigens that is linked to proinflammatory cytokine activity, causing neurotoxicity through a variety of pathways.1 Relapsing remitting, primary progressive, secondary progressive and progressive relapsing are the four main types into which MS is divided according to its progression. Approximately 85% of all MS patients have relapsing remitting MS, making it the most prevalent type. Although the exact cause of multiple sclerosis is unknown, it is thought to be multifactorial.2
Multiple sclerosis is the most common chronic neurological diseases among young adults and affects an estimated 2.8 million individuals. It primarily affects women with an age of onset of 30 years. The social and economic costs associated with MS, including long-term healthcare needs and loss of productivity, reinforce the need for biomarker profiling for early detection and intervention.2,3
Magnetic Resonance Imaging (MRI) is a biomarker prototype with high sensitivity and specificity for MS diagnosis and inflammatory activity monitoring, while oligoclonal bands are a well-established disease diagnostic tool. However, their ability to assess silent disease progression is restricted. Standard MRI gives global signals such as lesion volume and brain atrophy but lacks the ability to show data at the molecular level.4
In MS, brain damage is induced by an imbalance between anti-inflammatory cytokines released by Th2 cells and proinflammatory cytokines released by Th17 and Th1 cells.1 MS is assumed to be caused by an ongoing acute inflammatory reaction that occurs as a result of blood–brain barrier dysfunction. The blood–brain barrier is broken due to endothelial cell rupture caused by an elevated level of leukocyte adhesion molecules, which allows for amplification of leukocyte transmigration. These are primarily composed of Th1 and Th17 cells, which are responsible for generating myelinotoxic cytokines that cause demyelination.5 Interleukin 13 is one of the pleiotropic cytokines that may exhibit anti-inflammatory effects which is mostly generated by Th2 cells.1
In demyelinating lesions, brain-infiltrating T cells produce a lot of IL-13. T cell-derived IL-13 production in the central nervous system has a pathogenic role in multiple sclerosis. Since IL-13 is crucial in regulating synaptic function and neuronal integrity in MS patients, therapies that target IL-13 production and release may benefit these patients in both immunomodulatory and neuroprotective ways. However, research has shown contradictory results about the significance of IL-13 in MS. A pathogenic role for T-cell-derived IL-13 production in the central nervous system in multiple sclerosis is suggested by certain findings.6
Lipocalin 2 (LCN2) is encoded by the LCN2 gene. LCN2 is an acute-phase protein expressed in astrocytes in the central nervous system, and when released, it increases inflammation and may have additional effects on iron homeostasis.7 LCN2 leads to damage in a variety of neurodegenerative diseases and illnesses and can act as an inflammatory stimulus to initiate inflammatory responses, including the production of chemokines and cytokines.8 Elevated LCN2 levels in MS patients seem to play a myelination-dependent role in neurodegeneration.9
Previous research suggests that LCN2 might influence astrocyte reactivity, alter the blood–brain barrier, trigger death of neurons and cause inflammation, potentially contributing to neurodegeneration. LCN2 also modulates endothelial cell permeability and inflammatory reactions, which affects the blood–brain barrier’s integrity and function. It also suppresses oligodendrocyte proliferation and differentiation while decreasing myelin sheath development.10 In MS models in mice, total ablation of LCN2 ameliorates experimental autoimmune encephalomyelitis-related symptoms, indicating that LCN2 expression in spinal cord and peripheral immune organs contributes to experimental autoimmune encephalomyelitis formation.9
Certain HLA alleles, including HLA-DRB1*15:01, HLA-DRB50*101, HLA-DR2+, HLA-DQ6, DQB1 0602 and DQA 0102, are associated with immunological modulation and significantly raise the risk of developing multiple sclerosis. Additionally, non-HLA genetic variants that contribute to MS susceptibility have been found in other genetic studies. These variants include IL-2RA (rs2104286), CD40 (rs1883832 T), IL-7R (rs6897932), CD58 (rs2300747) and IL-4, IL-6, IL-7, IL-13 and IL-22.5,11
The IL-13 gene is found on the long arm of chromosome 5q31–33 encoding Th2 cytokines.12 Immunological diseases have been correlated with a number of single-nucleotide polymorphisms in the coding and noncoding regions of the IL-13 gene. Chronic inflammatory autoimmune diseases have been linked to some SNPs, such as rs20541 G in the IL-13 gene.1 The coding SNP rs20541 in exon 4 causes a nonconservative guanine to adenine transfer at nucleotide +2044, leading to replacement of Arg 130 with Gln in α-helix D. This is a critical region amino acid for interactions between IL-13 and its receptors, so it can affect IL-13-mediated signalling, resulting in raised biological activity and affinity between IL-13 and its receptor, and may lead to inhibition of immune responses.1
There is currently insufficient research examining the association between serum LCN2 and IL-13 polymorphism in MS, but an interesting oncological study has found that LCN2-mediated iron transport is an alternative way to acquire iron, especially during inflammation. Since macrophages are key players in iron homeostasis, iron sequestration will be the first response to foreign cell recognition. Alternatively, activated macrophages (M2), which are called anti-inflammatory macrophages, are activated by IL-4, IL-13 and Th2 cells. Thus, IL-13 and LCN2 may correlate with each other by affection to macrophage.13 We assumed that there is a correlation between LCN2 and IL-13 polymorphism by their paradoxical effects on macrophage, as rs20541-driven cytokine activity affects immune cells that participate in IL-13 signaling networks with macrophages and T cells within the CSF,14 while LCN2 enhances the M1 phenotype of microglia, which is a chemokine inducer in the central nervous system.15 Our study aimed to investigate this important issue by assessing the IL-13 polymorphism and serum LCN2 levels in MS patients and determining their potential roles as biomarkers for risk and disability of MS. We hypothesize that IL-13 rs20541 polymorphism increases MS susceptibility and that elevated serum LCN2 levels correlate with disease risk and disability.
Patients and Methods
Sample Size
With 48 cases and 48 controls, the sample size is 96 because the mean difference in lipocalin 2 between the cases and the control was 107.8±18.8 and 118.6±18.8, respectively. The OpenEpi tool was used to calculate the samples, which had a 95% confidence interval and an 80% test power.1,7
Sample Selection
Sample participants were collected as systematic random sample. All MS patients in 1 year is 180 patients in MS centre at the department of Neurology, Faculty of Medicine, Zagazig University Hospitals. So, the K constant for randomization  equals 3.75 (every 4 MS patients, 1 patient included in this study).
Study Participants
This observational single-blind case–control study was conducted from February 2024 to October 2024 at the departments of Neurology, Medical Microbiology and immunology, and Medical Biochemistry at Faculty of Medicine, Zagazig University Hospitals. This study was reported in accordance with the RECORD guidelines for observational studies.” Multiple sclerosis patients diagnosed by neurologists based on clinical and preclinical findings according to McDonald’s criteria 2017 were incorporated into our study.16 The healthy controls are matched with MS cases as regards age, sex, ethnicity and residence in Sharkia government. However, patients with systemic immunological disorders such as rheumatoid arthritis, ankylosing spondylitis and systemic lupus erythematous, allergic diseases and conjunctivitis, chronic hepatitis and malignancy were excluded from our study. There were 48 patients and 48 controls in this study. The medical history of patients includes clinical manifestations, complete general and neurological examination, Brain and Cervical MRI, CSF analysis for oligoclonal bands and IgG index for the diagnosis of multiple sclerosis.16
The work was conducted in accordance with the Declaration of Helsinki, the World Medical Association’s code of ethics for experiments involving human subjects. The study protocol was approved by Zagazig University’s Faculty of Medicine’s Institutional Review Board Committee (approval No. 134/27-2-2024). Both MS patients and healthy controls provided written consent. All possible comparisons between the research groups were taken into account. The blood samples were taken before the MS patients took direct modifier therapies (DMTs) and during the patients completed the requirement to take the DMT from National Health Assurance. Both plain and EDTA tubes were used to collect blood samples. The plain tube’s whole blood samples were centrifuged at 1409 xg for 15 minutes (mins) to take the serum apart, which was then stored at −20°C for the measurement of lipocalin 2, and the EDTA tube’s whole blood samples were kept at −20°C for the polymorphism of the IL-13.
Expanded Disability Status Scale
Expanded Disability Status Scale tracked changes in disability over time and assessed the degree to which individuals were impacted by MS. On a scale of 0 to 10, 0 represented a normal neurological examination, 2 minimal disability, 3 moderate disability, 4 and above significant disability and 10 the patient’s death.17
MRI Brain
MRI brain showed multiple T2 lesions in at least one of three brain regions (periventricular, cortical/juxtacortical or infratentorial region) Figure 1A and B.18
 |
Figure 1 MRI brain showing few deep periventricular foci of bright T2/flair signals with no perifocal brain edema or mass effect. (A) Axial T2 sequences (B) flair sequences. |
MRI Cervical
MRI of the cervical spine showed cervical cord multiple eccentric intramedullary patchy areas of bright T2 signals with no cord expansion Figure 2A and B.19
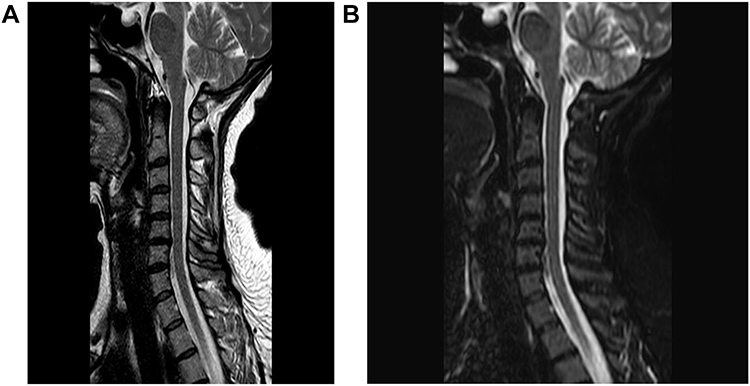 |
Figure 2 MRI cervical spine showing no evidence of cervical cord demyelinating plaques. (A) Sagittal T2 sequences (B) STIR sequences. |
Serum Lipocalin 2 Measurement
Sandwich ELISA was used to detect Lipocalin 2 utilizing (didevelop, China, Cat. no. DL-NGAL-Hu). The microtiter plate in this kit has been pre-coated with an antibody specific to lipocalin 2. Following that, standards or undiluted serum samples (stored at −20°C) are prepared using a biotin-conjugated antibody specific to lipocalin 2 and placed into the appropriate microtiter plate wells. Following the addition of Avidin conjugated to Horseradish Peroxidase to each microplate well, the plates are incubated. After the TMB substrate solution was added, only the wells containing lipocalin 2, biotin-conjugated antibody and enzyme-conjugated Avidin displayed a colour shift. A sulphuric acid solution was added to stop the enzyme-substrate reaction, and spectrophotometry was used to detect the colour change at 450 nm ± 10 nm. By comparing them to the specified standards, concentrations were determined using the following standard concentrations (10, 5, 2.5, 1.25, 0.625, 0.312, 0.156 ng/mL). Serum lipocalin 2 levels were reported as ng/mL, with a detection range limit ranging from 0.156 to 10 ng/mL and Coefficients of Variability <10% for intra-assay and <12% inter-assay.7
IL-13 (rs20541) Gene Polymorphism
Genomic DNA extraction
Genomic DNA was extracted using a genomic DNA extraction kit (GeneJET, Thermo Scientific, USA, Cat. no. K078). The purity of the isolated genomic DNA was assessed using the Nanodrop 2000 (Thermofischer Scientific, Wilmington, DE, USA) at 260 nm absorbance with a ratio of (1.7–1.8) for A260 /A280. At −20°C, the genomic DNA was kept.
Amplification of DNA by PCR
The restriction fragment length polymorphism (RFLP) method was used to analyse the IL-13 (rs20541) gene polymorphism. PCR amplification primers for rs20541 IL-13 genes were used from a published reference.20
Forward primer: (5′-CTTCCGTGAGGACTGAATGAGACGGTC −3′).
Reverse primer: (5′-GCAAATAATGATGCTTTCGAAGTTTCAGTGGA-3′).
Primers were created with a 236 bp expected product size. These primers were supplied by (Invitrogen, thermo fisher scientific, analysis, USA). The investigated IL-13 (rs20541) SNP gene polymorphism variant was tested in duplicate. For each reaction, the following materials were added to each tube: master mix 10 μL, 1 μL of each primer, 5 μL of template DNA and sterile distilled water 3 μL to a total volume of 20 μL. The thermal cycler was set to perform the first denaturation step for 5 minutes at 95°C, followed by 30-second (sec) denaturation cycles for 35 cycles at 95°C and 45 cycles of annealing at 60°C. Extension at 72°C for 45 seconds, and then another extension at 72°C for 5 minutes.
Gel electrophoresis detection of the amplified products
The rs20541 IL-13 gene gives fluorescent bands at 236 bp.
RFLP for IL-13 rs20541
The restriction enzyme used was NlaIV (isolated from Niasseria lactamica) supplemented with NE Buffer (10X) (New England BioLabs, UK). Three fluorescent bands were seen at 178, 32 and 26 bp in patients with the homozygous mutant type AA genotype. Individuals with the GG genotype, which is wild normal, produced two fluorescent bands at 210 and 26 bp. Patients with heterozygous mutant type GA gave four fluorescent bands at 210 bp, 178 bp, 32 bp and 26 bp.
Statistical Analysis
The genotype distribution was calculated using Hardy-Weinberg equilibrium. The quantitative variables’ normality was investigated. ANOVA and independent sample t-tests were used for parametric data and the Mann–Whitney for nonparametric data for comparing quantitative variables. To examine the genotype/allele frequencies, the chi-square (χ2) test was used. In cases where χ2 or Fisher’s exact test was significant, odds ratios (ORs) and 95% CIs were calculated. The correlation between the number of attack MRI cervical plaques, CSF oligoclonal band and serum lipocalin 2 levels in patients with multiple sclerosis was analyzed by Spearman correlation. P values were considered statistically significant if they were less than 0.05. The results were calculated using the Statistical Package of Social Sciences program (version 22, Chicago, USA).
Results
Baseline Characteristics of Research Groups
We included 48 patients with multiple sclerosis in our study: 28 females (58.3%) and 20 males (41.7%). The mean age of all patients was 30.4±2.4 years, and the mean age of all controls was 30.2±2.6 years. There was no significant difference in age or gender between the groups in our study as shown in Table 1. There was a high statistically significant difference between MS patients and controls as regards Lipocalin 2 ng/mL, P = 0.0001, as shown in Table 1.
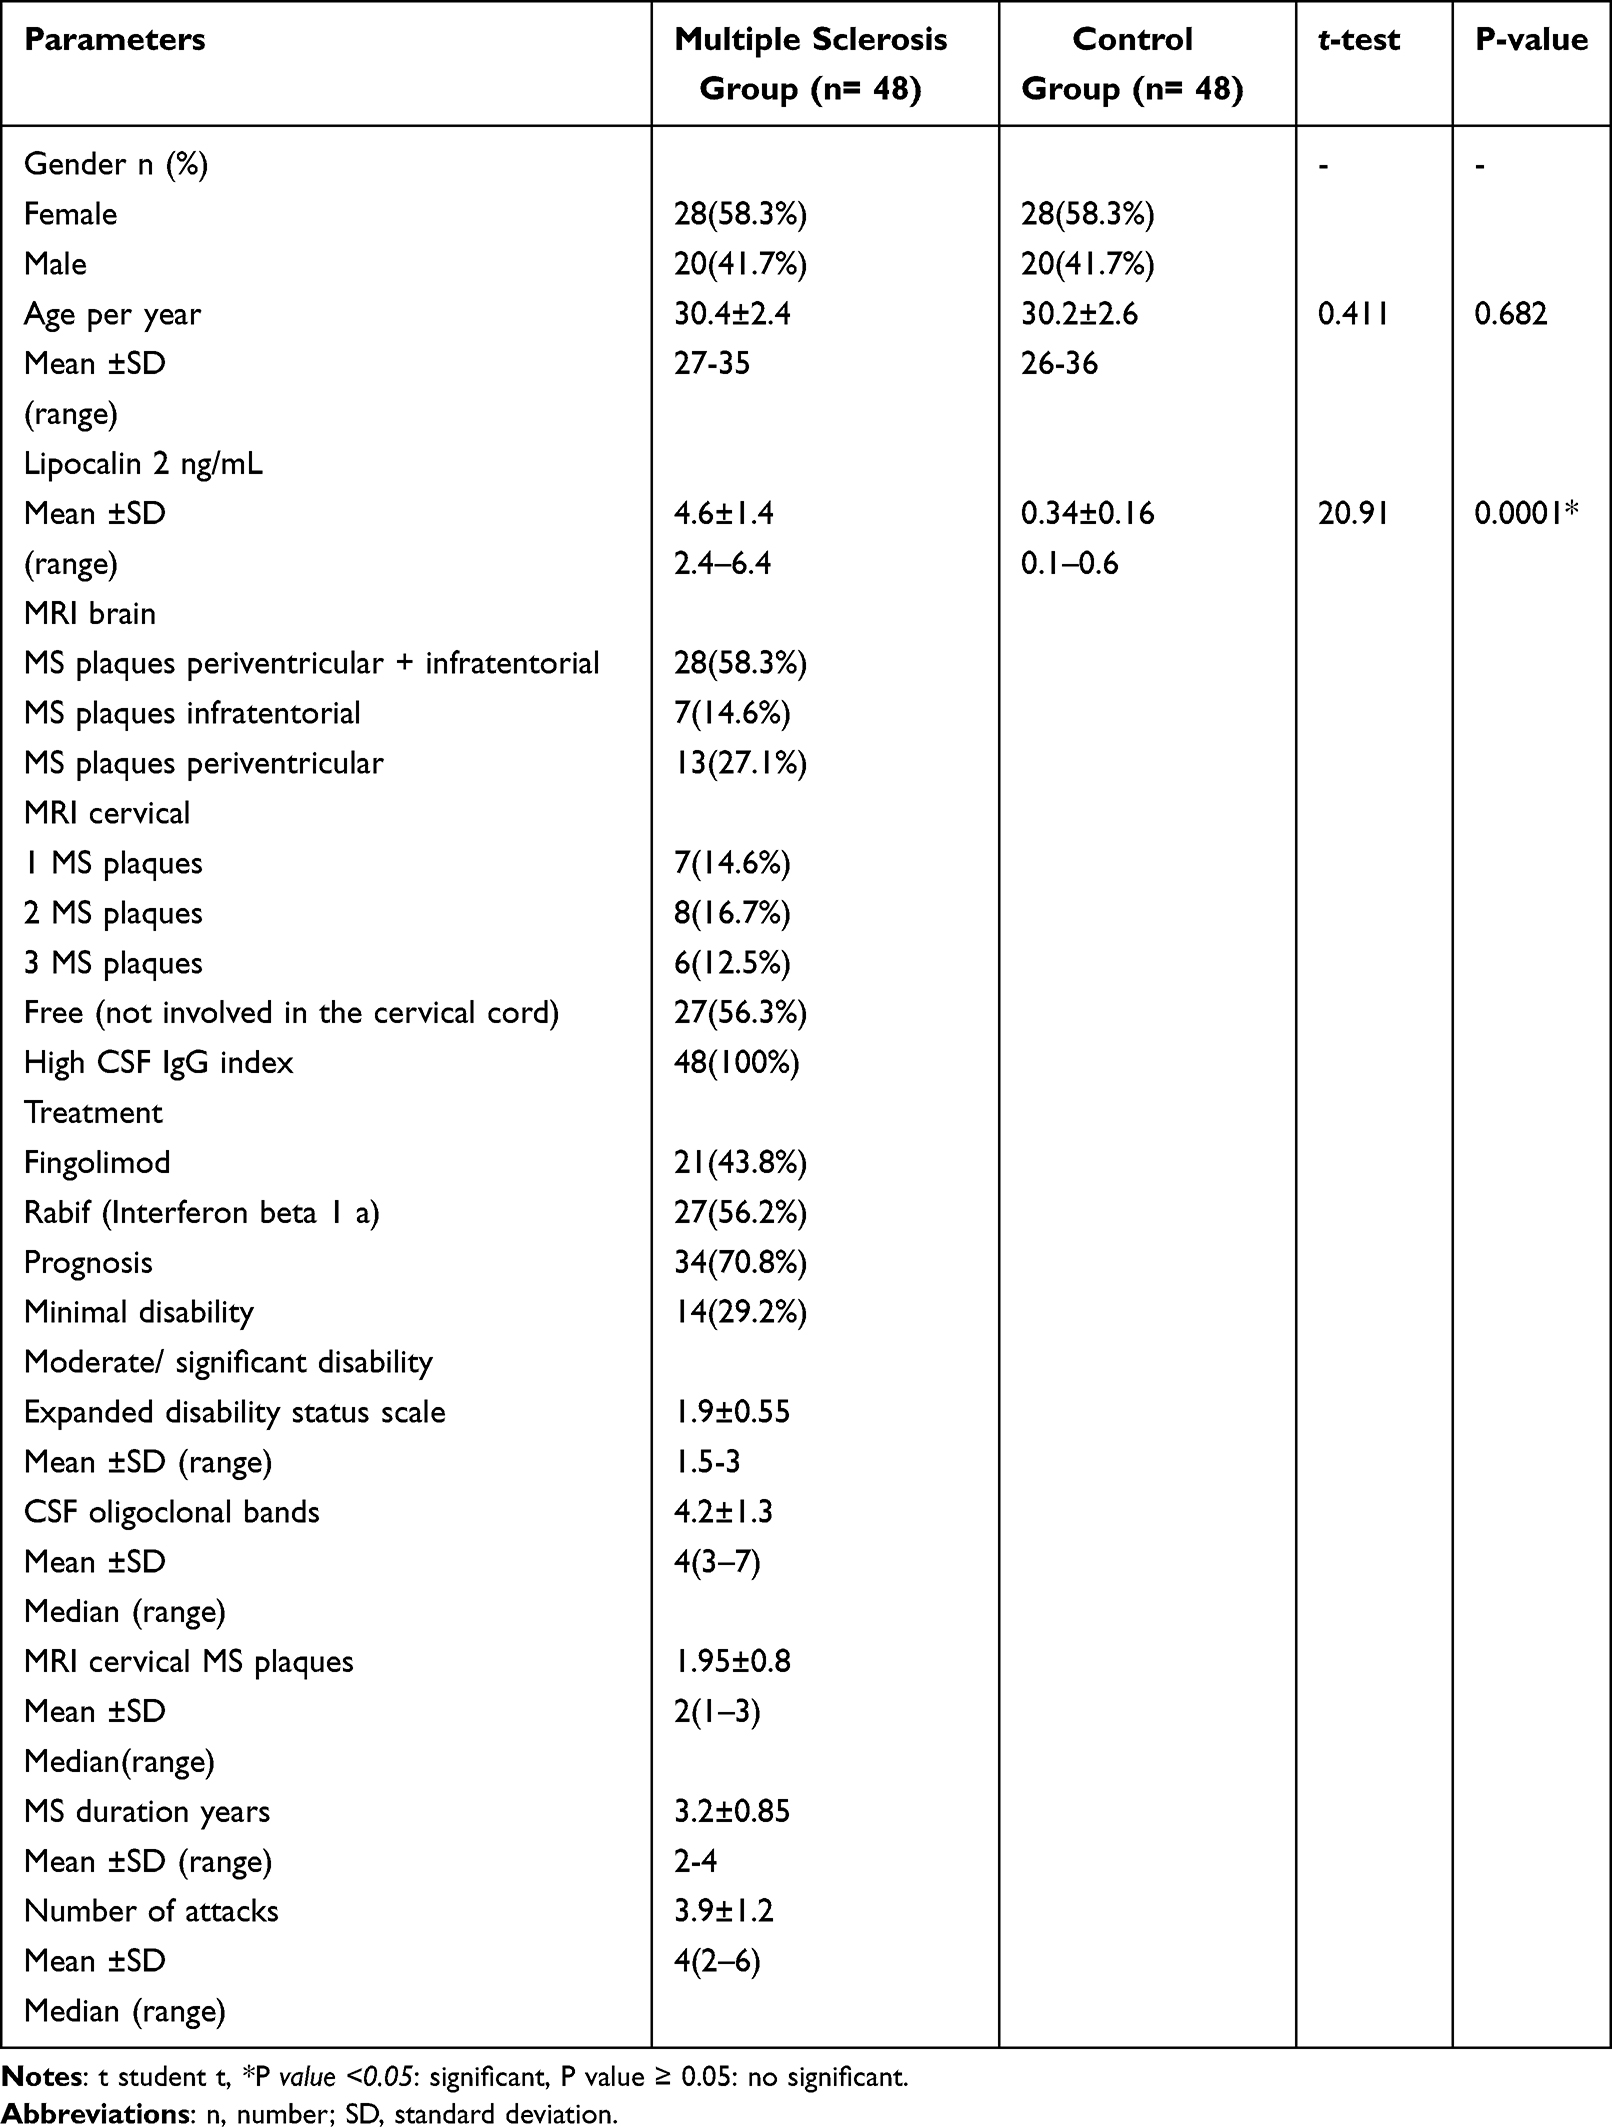 |
Table 1 Basic Characters of Multiple Sclerosis Patients and Healthy Controls |
According to MRI brain results among MS patients, there were 13% MS plaques periventricular while infratentorial and combined were 7% and 28%, respectively, as shown in Table 1. Regarding MRI cervical, there were 27% of patients with no lesions in cervical cord, while 7%, 8% and 6% had 1 MS plaque in cervical cord, 2 MS plaques and 3 MS plaques, respectively, as shown in Table 1, Figures 1 and 2. As regards the treatment of patients, 21 (43.8%) were treated with fingolimod, while 27 (56.2%) were treated with interferon beta 1a as shown in Table 1.
IL-13 Polymorphism Among the Studied Groups
Hardy-Weinberg equilibrium was seen in the genotypic frequencies of the IL-13 (rs20541) gene in both cases (χ2 = 0.039; P = 0.84) and controls (χ2 = 2.47; P = 0.11). There was a statistically significant difference between the studied groups as regards IL-13 (rs20541) polymorphism with those who have the GA genotype being 9 times at risk for multiple sclerosis, and the risk of MS is approximately 3.58 times higher with the A allele, P = 0.0001 as shown in Table 2. Considering the expanded disability status scale of multiple sclerosis, the percentage of AA, GA and GG for IL13 gene polymorphism was distributed as follows: 42.9, 57.1, 0% in moderate/significant disability MS patients and 29.4, 47.1, 23.5% in mild disability MS patients with no significant difference, P >0.05 as shown in Table 3 and Figure 3.
 |
Table 2 Distribution of IL-13 rs20541 Genotypes in Multiple Sclerosis Patients and Healthy Controls |
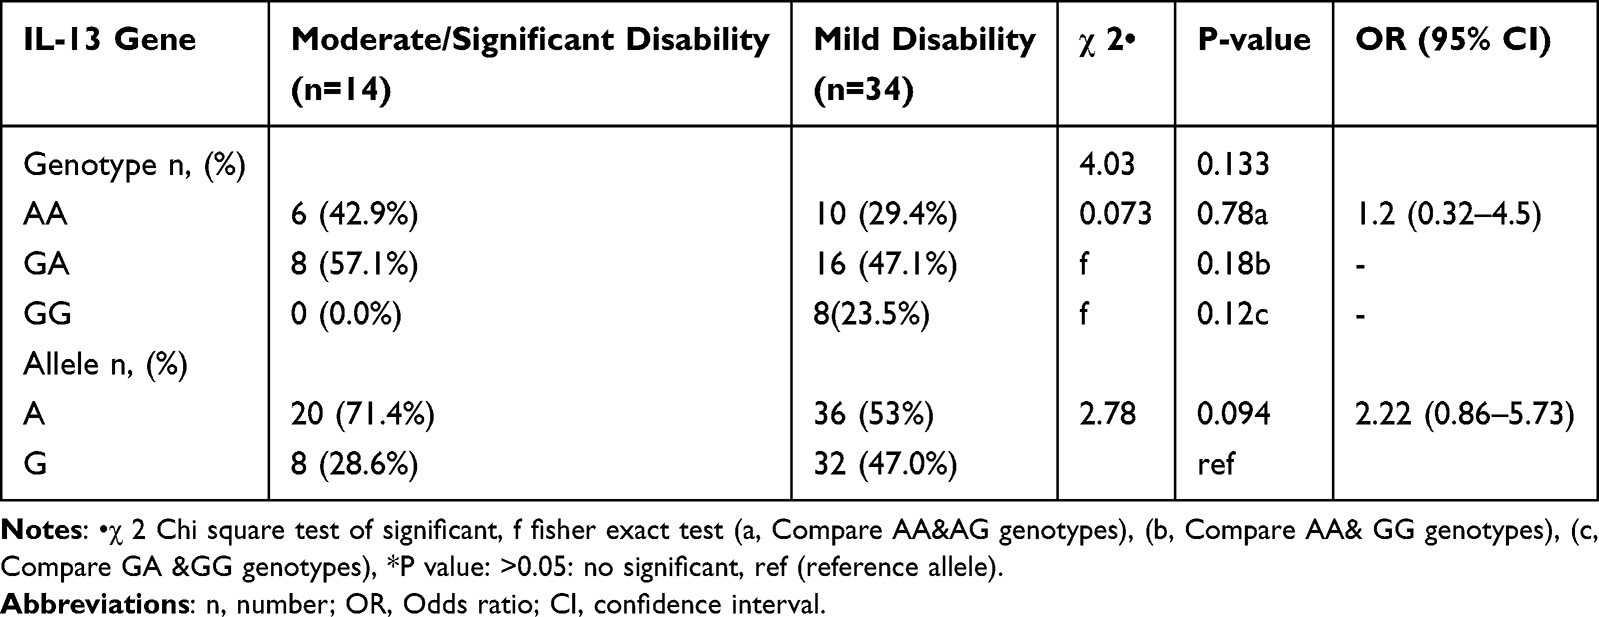 |
Table 3 Distribution of IL-13 Gene Polymorphisms by Disability in Multiple Sclerosis Patients |
 |
Figure 3 Detection of IL-13 rs20541gene restriction fragment length polymorphism (RFLP). Lane 7: 50 bp DNA ladder (Willowfort, USA), The sizes of bands 26 bp and 32 bp are invisible. The thermal cycler was set to perform the first denaturation step for 5 minutes at 95°C, followed by 30-second (sec) denaturation cycles for 35 cycles at 95°C, and 45 cycles of annealing at 60°C. Extension at 72°C for 45 seconds, then another extension at 72°C for 5 minutes. Lane 1, 2, 3, 9, 16: Four band (26 bp, 32bp, 178bp, 210bp) reflect heterozygous type (GA), Lane 4, 5, 8, 13, 14: Three bands (26bp, 32 bp and 178bp) reflect homozygous mutant type (AA), Lane 6, 10, 11, 12, 15: two bands (26bp and 210bp) reflect wild type (GG). |
According to disability in MS, there was a statistically significant difference between patients treated with fingolimod and those who had cervical plaque in moderate-to-severe multiple sclerosis patients compared to mild multiple sclerosis patients, p <0.05. Also, there was a statistically significant difference as regards expanded disability status scale, oligoclonal bands, number of attacks, lipocalin 2 ng/mL value in moderate-to-severe multiple sclerosis patients compared to mild multiple sclerosis patients, p <0.05 as shown in Table 4. There was a significant and direct correlation between the number of attacks, expanded disability status scale and lipocalin as shown in Table 5.
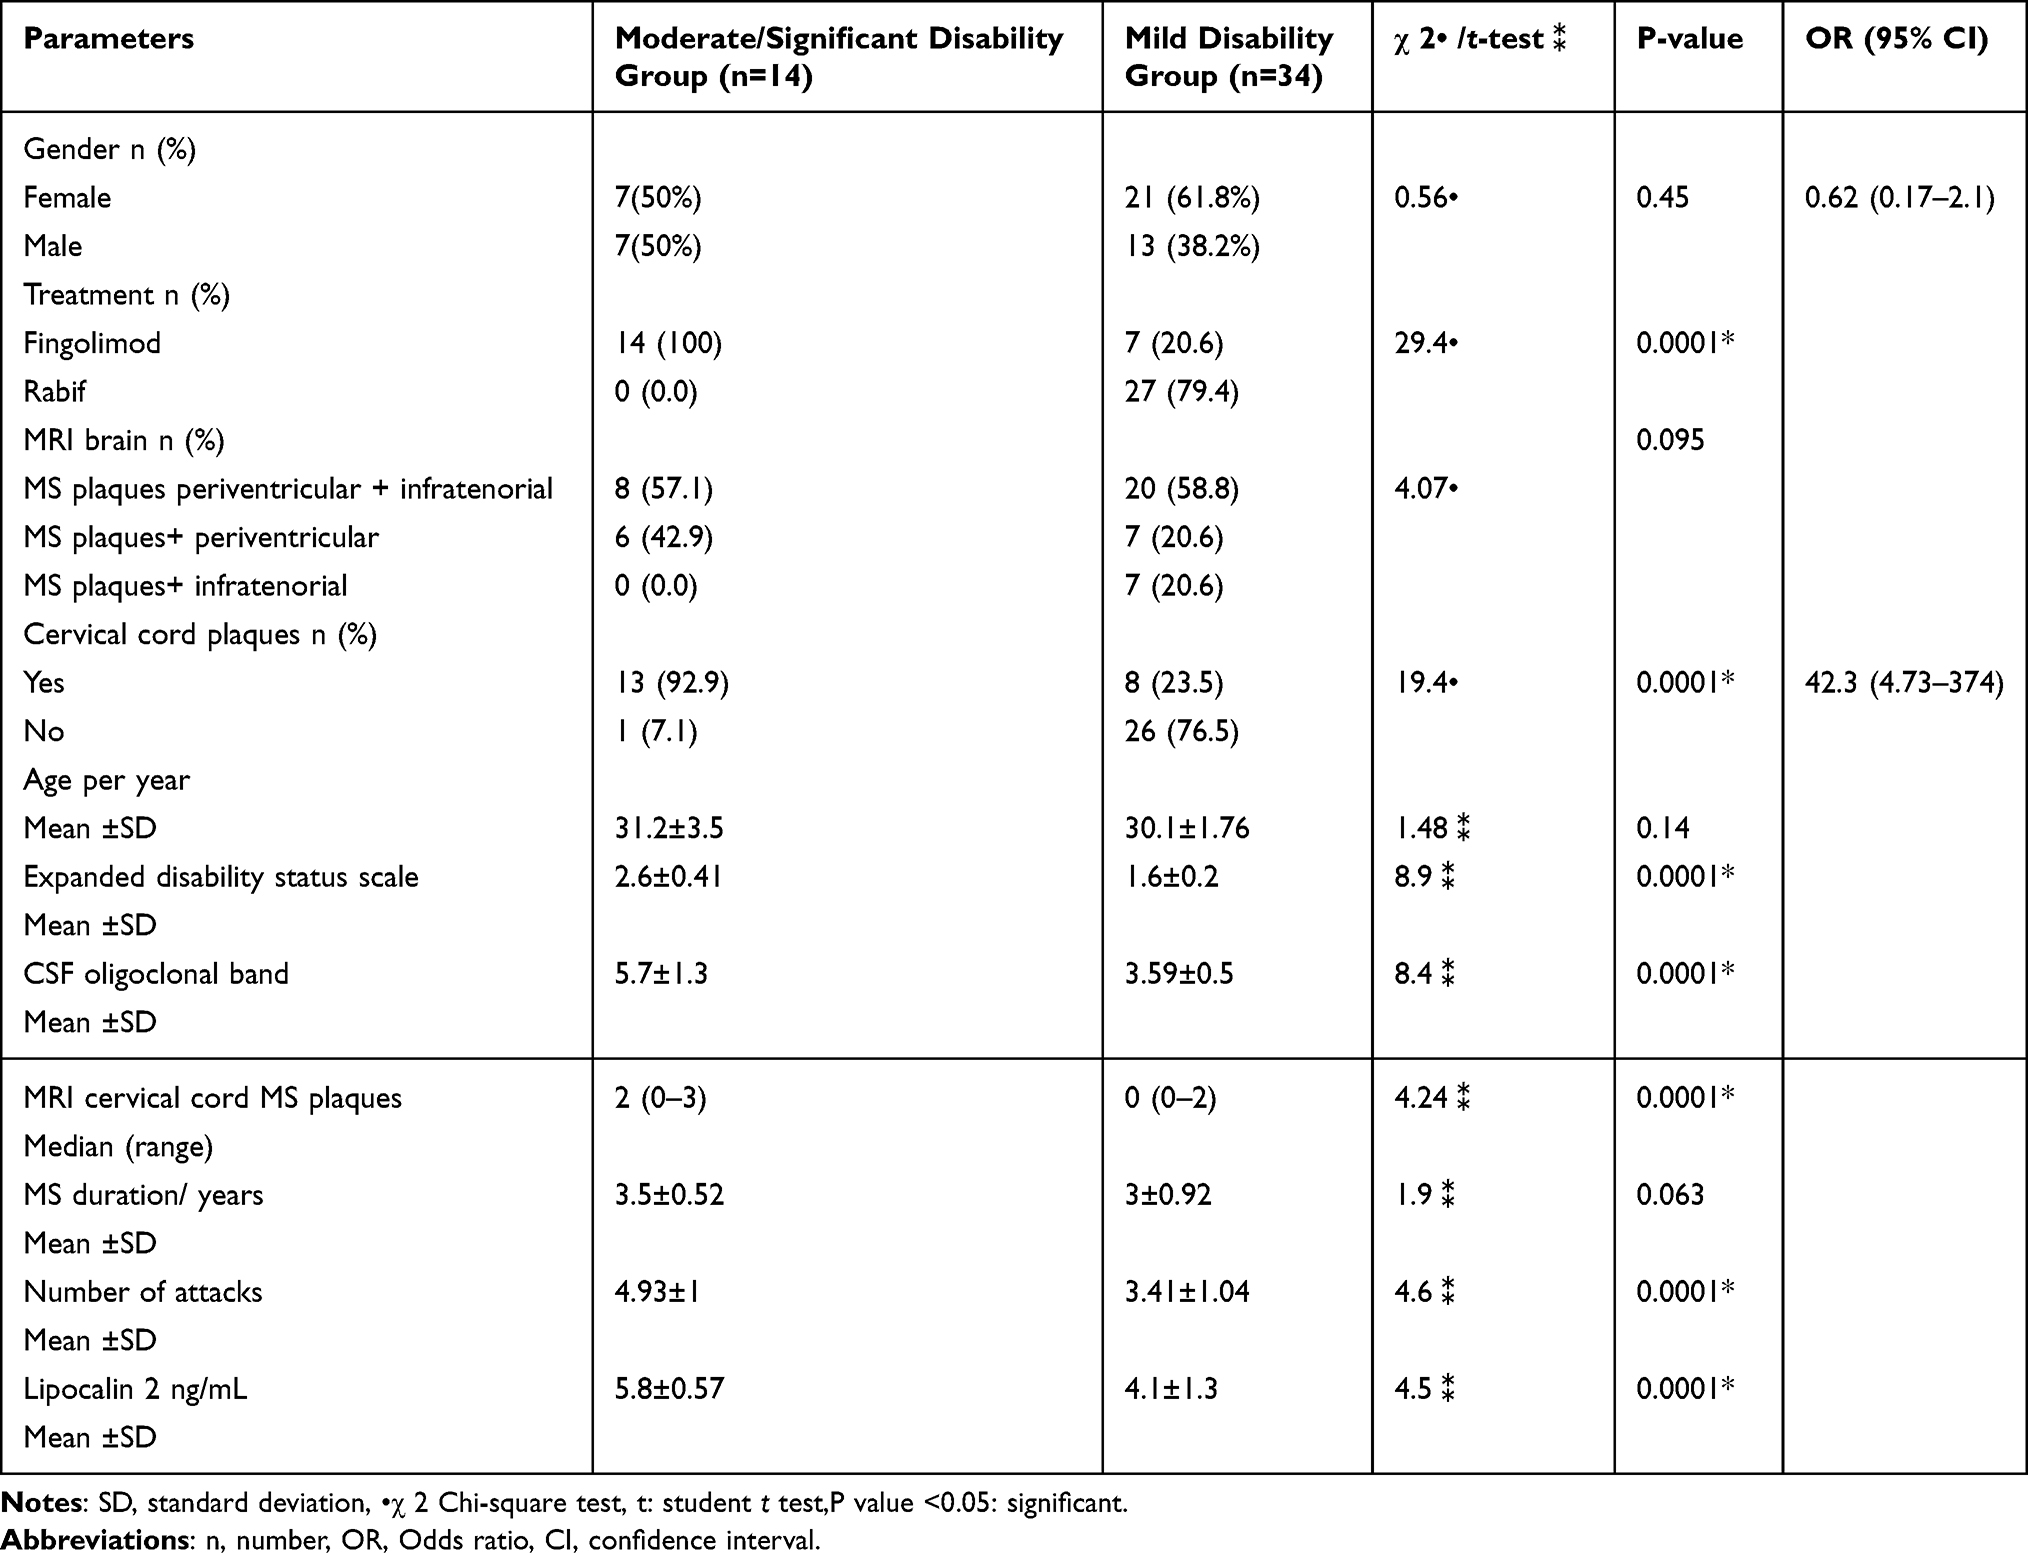 |
Table 4 Comparison Between Mild, Moderate, and Significant Disability in Multiple Sclerosis Patients |
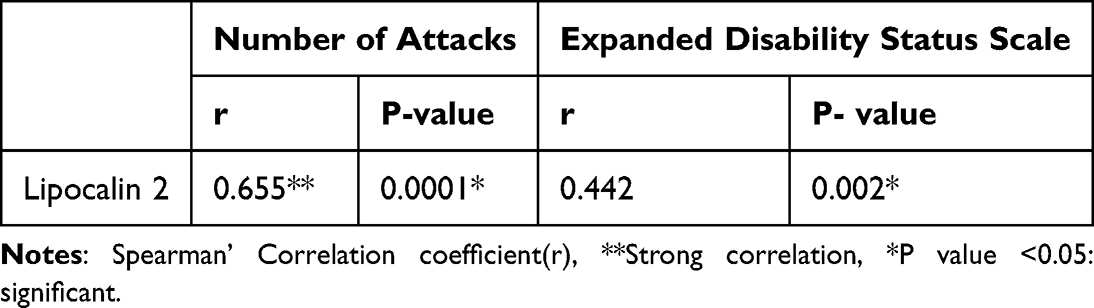 |
Table 5 Correlation Between Number of Attacks, Expanded Disability Status Scale, and Lipocalin 2 in Multiple Sclerosis (N= 48) |
Receiver operating characteristic curve was performed to evaluate lipocalin 2 as a biomarker for diagnosis and detecting disability of MS patients. The ROC curve for lipocalin 2 showed that the level of lipocalin 2 at a cut-off of ≥5.4 ng/mL and the area under the curve is 0.90 (p-value 0.002) with sensitivity 85.7% and specificity 82.4% as shown in Figure 4. This means that lipocalin 2 is a good biomarker for diagnosis and detecting the disability of MS in the studied patients.
 |
Figure 4 Receiver operator characteristic curve (ROC) of lipocalin 2 Pg/mL in multiple sclerosis patients. The level of lipocalin 2 at a cut-off value of ≥ 5.4 ng/mL and the area under the curve is 0.90 (p-value 0.002) with sensitivity 85.7% and specificity 82.4% with confidence interval 0.8–1. |
Univariate logistic regression shows significant predictors of disability of MS were EDSS ≥ 2, number of attacks and lipocalin 2 ≥ 5.4 ng/mL, while multivariate logistic regression confirmed both EDSS ≥ 2 and LCN2 ≥5.4 ng/mL as prognostic variables for MS disability as shown in Table 6.
 |
Table 6 Logistic Regression for Predictors of Disability in Multiple Sclerosis Patients |
Discussion
Multiple sclerosis is an autoimmune demyelinating disease with autonomic symptoms, motor dysfunction and psych behavioral disturbances.21 An estimated 2.8 million people worldwide suffer from multiple sclerosis, which is still an incurable disease. Since it typically occurs in young adulthood, it makes the condition responsible for lowering the quality of life not only for those affected but also for society as a whole.22 Although the prevalence of MS has risen globally since 2013, there are still disparities in prevalence estimates.23 Over the past three decades, prevalence rates have dramatically increased in a number of low- to middle-income countries, including Saudi Arabia, Taiwan, Egypt and Algeria.24
Although biomarkers for multiple sclerosis have been proposed, they are frequently investigated separately, and it can be difficult to compare studies that have used disparate clinical outcomes. Because the biology of multiple sclerosis is so complex, a combination of markers may yield better predictions than any marker in isolation.25 Several research studied single-nucleotide polymorphisms in genes encoding IL-10, IL-4, IL-1 and tumour necrosis factor-α as genetic markers of MS susceptibility.26
Because there are no trustworthy biomarkers in clinical practice, it is challenging to predict the shift from relapsing remitting MS to secondary progressive MS. Finding early risk factors for the development of secondary progressive multiple sclerosis is essential because it allows for the timely initiation of efficient treatment plans meant to slow the disease’s progression.27
IL-13 effectively modulates synaptic function and neuronal integrity in multiple sclerosis patients. This implies that therapies that increase IL-13 production and release may benefit these patients both immunomodulatory and neuroprotectivity. The coding and noncoding regions of the IL-13 gene have a number of single-nucleotide polymorphisms linked to immunological disorders. It is yet unknown whether the IL-13 gene polymorphism rs20541 and MS are related.1,28
LCN2 regulates the expression of genes that are activated by interferon. In humans, LCN2 is typically expressed throughout a variety of tissues.29 LCN2 is elevated in the progressive form of MS and is a biomarker for MS and a potentially significant molecule for central nervous system autoimmunity.30 It has been demonstrated that LCN2 stimulates peripheral immunological infiltration and astrocyte-mediated microglia activation. LCN2 may contribute to the development of MS lesions, but its precise involvement is yet unclear.31 The study aimed to evaluate the IL-13 polymorphism and serum lipocalin in multiple sclerosis patients and assess their role as biomarkers for risk and disability of multiple sclerosis.
There is a correlation between lipocalin 2 and IL-13 polymorphism by their paradoxical effects on macrophage, as rs20541-driven cytokine activity affects infiltrating immune cells that engage IL-13 signaling networks with macrophages and T cells within the CSF,14 while lipocalin 2 potentiates the M1 phenotype of microglia, which is a chemokine inducer in the central nervous system.15
The present study involved 48 multiple sclerosis patients. A total of 28 females (58.3%) and 20 males (41.7%), the mean age in all patients was 30.4±2.4 years and 48 controls with 28 females (58.3%) and 20 males (41.7%) and the mean age in all controls was 30.2±2.6 with no significant difference between the studied groups regarding gender and age (P = 0.682). Our results regarding age agree with Wandall-Holm et al who showed that multiple sclerosis is a disease of young adults.32 According to sex distribution, our study showed higher prevalence among female patients. Those are consistent with Westerlind et al who showed higher MS prevalence in females than males.33 Also, Walton et al demonstrated that females are twice more likely to have MS than males.23
Concerning the MRI brain, our results showed that 27.1% of patients had supratentorial plaques, while infratentorial and combined plaques were 14.6% and 50.3%, respectively, among MS patients. This agrees with Filippi et al who found that periventricular plaques are more common than infratentorial.34 Regarding MRI cervical, our results showed that 56.3% of patients did not have cervical lesions, while 14.6%, 16.7% and 12.5% had 1 cervical plaque, 2 cervical plaques and 3 cervical plaques, respectively. This is consistent with Kaunzner and Gauthier who found that presence of an asymptomatic spinal cord lesion in patients developed MS in the future.19
Regarding risk of multiple sclerosis, there was a highly statistically significant difference in LCN2 levels between MS patients and controls, P = 0.0001. This is in agreement with Al Nimer et al who stated that LCN2 production is predominantly higher in MS.30 Also, Gasterich et al found that LCN2 is expressed in MS lesions.31 Besides, there was a significant difference in LCN2 levels between mild, moderate and severe disability of multiple sclerosis, which is consistent with Al Nimer et al and Das Neves et al showed that LCN2 production is predominantly increased in progressive MS.30,35
According to IL-13 polymorphism as regard risk of multiple sclerosis, in this study, there was a statistically significant difference between the studied groups as regards IL-13 (rs20541) polymorphism with those who have GA genotype are 9 times at risk for multiple sclerosis, and the risk of MS is approximately 3.58 times higher with the A allele, P = 0.0001 that is agreed with Grunwald et al who showed that AG genotypes and Allele A were found to be much more prevalent in the MS.1 However, our results disagreed with Mirahmadi et al, who demonstrated that no significant correlation was found between genotypes and allele frequency in patients and healthy individuals (P > 0.05). This may be due to different populations and genetic differences.36
According to IL-13 polymorphism as regards disability, the percentage of AA, GA and GG for IL13 gene polymorphism was distributed as follows: 42.9, 57.1, 0% in moderate/significant disability MS patients and 29.4, 47.1, 23.5% in mild disability MS patients with no significant difference as regards expanded disability status scale. This is consistent with Grunwald et al who showed that there was no statistically significant difference in clinical data, such as age of onset or expanded disability status scale score in MS patients.1
Our results showed that there was a significant and direct relation between number of attacks, EDSS and lipocalin 2. This is in agreement with Kalinin et al who showed that the number of years after diagnosis was positively correlated with serum LCN2 levels.7 Also, Guzel et al showed that there was a statistically significant difference between the groups with regard to age, duration of the disease (p <0.05).37
The current study measured serum LCN2 as a biomarker for detecting disease disability in MS patients by ROC curve analysis and found that the level of lipocalin 2 at a cut-off value of ≥5.4 ng/mL and the area under the curve is 0.90 (p-value 0.002) with sensitivity 85.7% and specificity 82.4%. This means that LCN2 is a very good biomarker for diagnosis and detecting the disability of MS in the studied patients. This agrees with Kalinin et al who stated that LCN2 production is predominantly increased in MS.7 Also, Gasterich et al found that LCN2 is expressed in MS lesions.31 Our study showed that EDSS ≥ 2 and LCN2 ≥5.4 ng/mL as prognostic variables for MS disability that is consistent with Al Nimer et al who stated that LCN2 production is predominantly increased in MS.30 Also, Kalinin et al and Gasterich et al found that LCN2 is expressed in MS patients.7,31
This study has certain limitations that may be resolved in future investigations, which include a relatively small sample size, lack of follow-up of MS patients by measurement of LCN2 at single time point and lack of prior published studies exploring the same topic, so we recommend further research on a large scale.
Conclusion
IL13 polymorphism (rs20541) is a risk-associated biomarker, while LCN2 is a biomarker linked to both risk and disability that may have important clinical implications in MS. These biomarkers could aid in early risk assessment and in identifying patients at higher risk of developing irreversible disability forms of multiple sclerosis.
Abbreviations
DMTs, Direct modifier therapies; HLA, Human Leukocyte Antigen; IL, Interleukin; M2, Macrophage 2; Lipocalin 2, LCN2; MRI, Magnetic Resonance Imaging; MS, Multiple sclerosis; RFLP, Restriction fragment length polymorphism; OR, Odd ratios; AUC, Area under the curve; ROC, Receiver operator characteristic curve; T helper, Th.
Data Sharing Statement
The datasets used and/or analyzed during the current study are available from both corresponding authors on reasonable request.
Ethics Approval
This study was conducted in accordance with the principles outlined in the Declaration of Helsinki. The Zagazig University Ethics Committee gave its approval (approval No. 134/27-2-2024).
Consent to Participate
Every single individual participant in the study gave his/her informed consent.
Acknowledgments
We are very grateful to Doctor Mariem Ali Soliman and the medical staff from the Medical Scientific Research Centre at Zagazig University’s Faculty of Medicine for their assistance.
Author Contributions
Fatma Z Kamel: Conceptualization, Investigation, Methodology, Formal Analysis, Resources, Validation, Visualization, Writing–original draft, Writing review and editing. Alia A El Shahawy: Investigation, Methodology, Resources, Visualization, Writing–original draft, Writing review and editing. Eman Ahmed Abdelaziz: Methodology, Investigation, Resources, Visualization, Writing– original draft, Writing review and editing. Eman Atef Mohamed: Formal Analysis, Investigation, Methodology, Resources, Validation, Visualization, Writing original draft, Writing–review and editing. Aya A El Shahawy: Data curation, Investigation, Methodology, Resources, Validation, Visualization, Writing– review and editing. Ahmad M. Hassaneen: Data curation, Investigation, Methodology, Resources, Validation, Visualization, Writing–review and editing. Asmaa Z Khater: Conceptualization, Formal Analysis, Investigation, Methodology, Resources, Visualization, Writing– original draft, Writing– review and editing. Ghada A. Mokhtar: Formal Analysis, Investigation, Methodology, Resources, Visualization, Writing–original draft, Writing–review and editing. Wesam Abdelmoniem Hafez Boghdady: Conceptualization, Formal Analysis, Investigation, Methodology, Resources, Visualization, Writing–original draft, Writing–review and editing. All authors gave final approval of the version to be published; have agreed on the journal to which the article has been submitted and agree to be accountable for all aspects of the work.
Funding
No funding was received for conducting this study.
Disclosure
No conflict of interest.
References
1. Grunwald C, Adamska-Patruno E, Wawrusiewicz-Kurylonek N, et al. Multiple sclerosis susceptibility may be associated with the coding rs20541 (R130Q) IL-13 gene polymorphism in the polish population. Sci Rep. 2023;13(1):22083. doi:10.1038/s41598-023-49615-y.
2. Hill J, Harrison J, Palmer K. Risk factors for relapse in relapsing remitting multiple sclerosis. Br J Neurosci Nurs. 2021;17(Sup1):S34–14. doi:10.12968/bjnn.2021.17.Sup1.S34.
3. Portaccio E, Magyari M, Havrdova EK, et al. Multiple sclerosis: emerging epidemiological trends and redefining the clinical course. Lancet Regional Health Euro. 2024;44:100977. doi:10.1016/j.lanepe.2024.100977
4. Ben-Shalom I, Karni A, Kolb H. The role of molecular imaging as a marker of remyelination and repair in multiple sclerosis. Int J Mole Sci. 2021;23(1):474. doi:10.3390/ijms23010474
5. Grunwald C, Krętowska-Grunwald A, Adamska-Patruno E, Kochanowicz J, Kułakowska A, Chorąży M. The role of selected interleukins in the development and progression of multiple sclerosis—a systematic review Int J Mol Sci. 2024;25(5):2589. doi:10.3390/ijms25052589
6. Asaf S, Maqsood F, Jalil J, et al. Lipocalin 2—not only a biomarker: a study of current literature and systematic findings of ongoing clinical trials. Immunol Res. 2023;71(3):287–313. doi:10.1007/s12026-022-09352-2.
7. Kalinin S, Boullerne AI, Feinstein DL. Serum levels of lipocalin-2 are elevated at early times in African American relapsing remitting multiple sclerosis patients. J Neuroimmunol. 2022;364:577810. doi:10.1016/j.jneuroim.2022.577810
8. Ghezzi L, Cantoni C, Cignarella F, et al. T cells producing GM-CSF and IL-13 are enriched in the cerebrospinal fluid of relapsing MS patients. Mult Scler. 2020;26(10):1172–1186. doi:10.1177/1352458519852092
9. Sciarretta F, Ceci V, Tiberi M, et al. Lipocalin-2 promotes adipose–macrophage interactions to shape peripheral and central inflammatory responses in experimental autoimmune encephalomyelitis. Mol Metabol. 2023;76(101783):101783. doi:10.1016/j.molmet.2023.101783
10. Tan Q, Zhang C, Rao X, et al. The interaction of lipocalin-2 and astrocytes in neuroinflammation: mechanisms and therapeutic application. Front Immunol. 2024;15:1358719. doi:10.3389/fimmu.2024.1358719
11. Khan Z, Mehan S, Maurya PK, et al. The polygenic nature of multiple sclerosis: genetic variants, immunological modulation, and environmental connections. Endocr Metab Immune Disord Drug Targets. 2025;25(7):527–559. doi:10.2174/0118715303325979241206115417
12. Iwaszko M, Biały S, Bogunia-Kubik K. Significance of interleukin (IL)-4 and IL-13 in inflammatory arthritis. Cells. 2021;10(11):3000. doi:10.3390/cells10113000
13. Živalj M, Van Ginderachter JA, Stijlemans B. Lipocalin-2: a nurturer of tumor progression and a novel candidate for targeted cancer therapy. Cancers. 2023;15(21):5159. doi:10.3390/cancers15215159.
14. Letchumanan G, Say Y-H. Association of IL −13 gene polymorphism (rs20541) with chronic inflammatory diseases: a systematic review and meta-analysis. Int J Immunogene. 2025;52(6):313–334. doi:10.1111/iji.70018
15. Shen H, Wang Z, Huang A, Zhu D, Sun P, Duan Y. Lipocalin 2 is a regulator during macrophage polarization induced by soluble worm antigens. Front Cell Infect Microbiol. 2021;11:747135. doi:10.3389/fcimb.2021.747135
16. Thompson AJ, Baranzini SE, Geurts J, Hemmer B, Ciccarelli O. Multiple sclerosis. Lancet. 2018;391(10130):1622–1636. doi:10.1016/S0140-6736(18)30481-1.
17. Kister I, Kantarci OH. Multiple sclerosis severity score: concept and applications. Mult Scler. 2020;26(5):548–553. doi:10.1177/1352458519880125.
18. Yamout B, Al-Jumah M, Sahraian MA, et al. Consensus recommendations for diagnosis and treatment of multiple sclerosis: 2023 revision of the menactrims guidelines. Mult Scler Relat Disord. 2024;83:105435. doi:10.1016/j.msard.2024.105435
19. Kaunzner UW, Gauthier SA. MRI in the assessment and monitoring of multiple sclerosis: an update on best practice. Ther Adv Neurol Disord. 2017;10(6):247–261. doi:10.1177/1756285617708911.
20. Alvarez-Rodriguez L, Lopez-Hoyos M, Carrasco-Marin E, et al. Analysis of the rs20541 (R130Q) polymorphism in the IL-13 gene in patients with elderly-associated chronic inflammatory diseases. Reumatol Clin. 2012;8(6):321–327. doi:10.1016/j.reuma.2012.04.006
21. Török N, Tanaka M, Vécsei L. Searching for peripheral biomarkers in neurodegenerative diseases: the tryptophan-kynurenine metabolic pathway. Int J Mol Sci. 2020;21(24):9338. doi:10.3390/ijms21249338.
22. Polyák H, Galla Z, Nánási N, et al. The tryptophan-kynurenine metabolic system is suppressed in cuprizone-induced model of demyelination simulating progressive multiple sclerosis. Biomedicines. 2023;11(3):945. doi:10.3390/biomedicines11030945.
23. Walton C, King R, Rechtman L, et al. Rising prevalence of multiple sclerosis worldwide: insights from the Atlas of MS, third edition. Mult Scler. 2020;26(14):1816–1821. doi:10.1177/1352458520970841.
24. Khan G, Hashim MJ. Epidemiology of multiple sclerosis: global, regional, national and sub-national-level estimates and future projections. J Epidemiol Glob Health. 2025;15(1). doi:10.1007/s44197-025-00353-6
25. Kodosaki E, Watkins WJ, Loveless S, et al. Combination protein biomarkers predict multiple sclerosis diagnosis and outcomes. J Neuroinflammation. 2024;21(1):52. doi:10.1186/s12974-024-03036-4.
26. Nikolopoulos GK, Masgala A, Tsiara C, et al. Cytokine gene polymorphisms in multiple sclerosis: a meta-analysis of 45 studies including 7379 cases and 8131 controls. Eur J Neurol. 2011;18(7):944–951. doi:10.1111/j.1468-1331.2011.03355.x
27. Zhou Q, Xie Z, He L, et al. Multi-omics profiling reveals peripheral blood biomarkers of multiple sclerosis: implications for diagnosis and stratification. Front Pharmacol. 2024;15:1458046. doi:10.3389/fphar.2024.1458046
28. Seals MR, Moran MM, Leavenworth JD, Leavenworth JW. Contribution of dysregulated B-cells and IgE antibody responses to multiple sclerosis. Front Immunol. 2022;13:900117. doi:10.3389/fimmu.2022.900117
29. Krizanac M, Mass Sanchez PB, Weiskirchen R, Schröder SK. Overview of the expression patterns and roles of Lipocalin 2 in the reproductive system. Front Endocrinol. 2024;15:1365602. doi:10.3389/fendo.2024.1365602
30. Al Nimer F, Elliott C, Bergman J, et al. Lipocalin-2 is increased in progressive multiple sclerosis and inhibits remyelination. Neurol Neuroimmunol Neuroinflamm. 2016;3(1):e191. doi:10.1212/NXI.0000000000000191.
31. Gasterich N, Bohn A, Sesterhenn A, et al. Lipocalin 2 attenuates oligodendrocyte loss and immune cell infiltration in mouse models for multiple sclerosis. Glia. 2022;70(11):2188–2206. doi:10.1002/glia.24245.
32. Wandall-Holm MF, Andersen MA, Buron MD, Magyari M. Aging with multiple sclerosis: age-related factors and socioeconomic risks. Front Neurol. 2022;13(13):818652. doi:10.3389/fneur.2022.818652.
33. Westerlind H, Boström I, Stawiarz L, Landtblom A-M, Almqvist C, Hillert J. New data identify an increasing sex ratio of multiple sclerosis in Sweden. Mult Scler. 2014;20(12):1578–1583. doi:10.1177/1352458514530021.
34. Filippi M, Rocca MA, Ciccarelli O, et al. MAGNIMS Study Group. MRI criteria for the diagnosis of multiple sclerosis: MAGNIMS consensus guidelines. Lancet Neurol. 2016;15(3):292–303. doi:10.1016/S1474-4422(15)00393-2
35. Das Neves SP, Serre-Miranda C, Sousa JC, et al. Lipocalin-2 does not influence EAE clinical score but it increases inflammation in central nervous system. J neuroimmunol. 2022;368:577872. doi:10.1016/j.jneuroim.2022.577872
36. Mirahmadi M, Naeimipour S, Amirlatifi R, Shahbazi M. Association study of G+2044A (R130Q) polymorphism in IL-13 gene with risk of developing multiple sclerosis in Iranian population. Gene Rep. 2019;15:100392. doi:10.1016/j.genrep.2019.100392
37. Guzel I, Mungan S, Oztekin ZN, Ak F. Is there an association between the expanded disability status scale and inflammatory markers in multiple sclerosis? J Chin Med Assoc. 2016;79(2):54–57. doi:10.1016/j.jcma.2015.08.010.
 © 2026 The Author(s). This work is published and licensed by Dove Medical Press Limited. The
full terms of this license are available at https://www.dovepress.com/terms
and incorporate the Creative Commons Attribution
- Non Commercial (unported, 4.0) License.
By accessing the work you hereby accept the Terms. Non-commercial uses of the work are permitted
without any further permission from Dove Medical Press Limited, provided the work is properly
attributed. For permission for commercial use of this work, please see paragraphs 4.2 and 5 of our Terms.
© 2026 The Author(s). This work is published and licensed by Dove Medical Press Limited. The
full terms of this license are available at https://www.dovepress.com/terms
and incorporate the Creative Commons Attribution
- Non Commercial (unported, 4.0) License.
By accessing the work you hereby accept the Terms. Non-commercial uses of the work are permitted
without any further permission from Dove Medical Press Limited, provided the work is properly
attributed. For permission for commercial use of this work, please see paragraphs 4.2 and 5 of our Terms.
Recommended articles
Current Perspectives: Evidence to Date on BTK Inhibitors in the Management of Multiple Sclerosis
Carnero Contentti E, Correale J
Drug Design, Development and Therapy 2022, 16:3473-3490
Published Date: 6 October 2022
Targeting Bruton’s Tyrosine Kinase (BTK) in Autoimmunity: Achievements, Opportunities and Challenges
Torke S, Dybowski S, Weber MS
Drug Design, Development and Therapy 2026, 20:568214
Published Date: 14 July 2026