Back to Journals » Journal of Multidisciplinary Healthcare » Volume 14
Exploring Spatial Variations and Determinants of Dietary Diversity Among Children in Ethiopia: Spatial and Multilevel Analysis Using EDHS (2011–2016)
Authors Seboka BT ![]() , Hailegebreal S
, Hailegebreal S ![]() , Yehualashet DE
, Yehualashet DE ![]() , Gilano G
, Gilano G ![]() , Kabthymer RH, Ewune HA
, Kabthymer RH, Ewune HA ![]() , Demeke AD, Amede ES, Tesfa GA
, Demeke AD, Amede ES, Tesfa GA ![]()
Received 11 July 2021
Accepted for publication 3 September 2021
Published 21 September 2021 Volume 2021:14 Pages 2633—2650
DOI https://doi.org/10.2147/JMDH.S327456
Checked for plagiarism Yes
Review by Single anonymous peer review
Peer reviewer comments 2
Editor who approved publication: Dr Scott Fraser
Binyam Tariku Seboka,1 Samuel Hailegebreal,2 Delelegn Emwodew Yehualashet,1 Girma Gilano,2 Robel Hussen Kabthymer,1 Helen Ali Ewune,1 Abel Desalegn Demeke,3 Endris Seid Amede,4 Getanew Aschalew Tesfa1
1School of Public Health, Dilla University, Dilla, Ethiopia; 2Department of Health Informatics, Arba Minch University, Arba Minch, Ethiopia; 3Department of Nursing, Dilla University, Dilla, Ethiopia; 4Department of Psychiatry, Dilla University, Dilla, Ethiopia
Correspondence: Binyam Tariku Seboka
School of Public Health, Dilla University, P.O Box: 419, Dilla, Ethiopia
Tel +251 920612180
Fax +251 46-331-2568
Email [email protected]
Introduction: Dietary diversity has a significant impact on children’s nutritional health. For developing and implementing interventions, it is critical to understand the regional distribution of dietary diversity and underlying factors. However, the application of spatial techniques in dietary studies has not been well documented. The study’s goal was to look into the regional variances and factors that influence children’s dietary diversity. Further, we have discussed the spatial correlation of dietary diversity with nutritional status.
Methods: Data from the National Demographic and Health Survey were used during analyses. This work evaluated the overall dietary diversity of children aged 6– 23 months based on the 2017 WHO and UNICEF classification of minimum dietary diversity (MDD). The Local Anselin Moran’s I was estimated to look into the regional variation of dietary diversity and hotspot and cold spot areas. Further, multivariate multilevel logistic regression was used for factor analyses.
Results: Overall, only 13.3% (95% CI: 10.2– 14.7%) of children in 2011 and 24% (95% CI: 15.5– 26.5%) in 2016 achieved MDD. We identified statistically significant clusters of high inadequate dietary diversity (hotspots) in the districts of northern Ethiopia, notably in the Amhara, Tigray, and Afar regions, and clusters of low inadequate dietary diversity (cold spots) in the country’s central and western regions. In both studies, the frequency of dietary diversity was significantly higher among older children, those who had media exposure, and mothers and fathers who had received formal education.
Conclusion: According to our findings, the MDD of children in Ethiopia, as measured by WHO dietary assessment, slightly increased from 2011 to 2016. The dietary diversity of children was distributed non-randomly in different districts across regions of Ethiopia. Localized intervention and preventative methods to improve dietary patterns and culture can be developed using existing socio-demographic factors and districts with a larger distribution of inadequate dietary diversity.
Keywords: dietary diversity, DD, minimum dietary diversity, MDD, under-five children, spatial, multilevel, Ethiopia
Introduction
Dietary Diversity (DD) emerges as a predictor of children’s micronutrient intake and nutritional status.1 Dietary diversity is a simple metric that is widely used as a proxy for dietary quality, micronutrient sufficiency, and food availability.1,2 DD refers to the consumption of foods from major nutritionally significant types of food while maintaining a balance between plant and animal source meals, according to the World Health Organization (WHO).3–5 Moreover, Minimum Dietary Diversity (MDD) is the consumption of five or more food groups from the eight recommended food groups, namely breast milk, grains, roots, and tubers, legumes, and nuts, dairy products (infant formula, milk, yogurt, cheese), flesh foods (meat, fish, poultry, and liver/organ meats), eggs, vitamin-A rich fruits and vegetables, other fruits and vegetables, for higher dietary quality and to meet daily energy and nutrient requirements.3,5,6
Following exclusive breastfeeding, the introduction of adequate supplementary food around the age of 6 months is critical for an infant’s optimal growth and development.4 DD is the potential determinant of a child’s linear growth and it has a predisposing correlation with a child’s body fat composition.4,7 Poor diets, on the other hand, are a major contributor to the rising occurrence of anthropometric failures in children.8,9 Consumption of a varied diet has been linked to a reduction in childhood malnutrition.7 Undernutrition manifests in the forms of wasting, stunting, underweight, and micronutrient deficiencies.10,11 Lack of food access, low food utilization, and large seasonal fluctuations in food security are the main causes of child wasting and stunting.9,12,13
Globally, the severity of food insecurity and micronutrient deficiencies are high across several countries in South Asia and Sub-Saharan Africa.14 Among Sub-Saharan countries, the MDD is low, 23% in Rwanda,15 16% in Burundi, 2% in Zimbabwe, and 46% in Tanzania.16 In Ethiopia, there is an improvement in the proportion of children who meet the MDD, 6.3% in 2005 to 13.5% in 2016;17 however, the levels remain unacceptably low. Previous research has revealed factors connected to children’s DD such as mother’s age, maternal educational level,12,18 marital status, maternal occupation,19 ANC visit, residence, region, child’s gender, birthing sequence, childbirth interval, child’s age,18 number of under-5 children,19 currently breastfeeding, paternal educational status, household wealth status,12,20 family size, desire for pregnancy, media exposure, antenatal and postnatal care.17,21
Many public health measures have been carried out across Ethiopia to improve the culture of DD and the nutritional status of children. However, the MDD for children in Ethiopia remains low at.20 This is considered to be not uniformly distributed and varies across time in the country. The country, on the other hand, does not have a system in place to identify places where there is a lack of nutritional diversity. Furthermore, most studies that examined the DD of children aged 6–23 months are based on the older classification of MDD based on seven food groups. Further, Ethiopia has been attacked by drought for many periods, which in turn increases food insecurity and may worsen malnutrition.
This research aimed to look at the spatial patterns and trends of dietary diversity and its predictors in Ethiopia based on data obtained from two previous national Demographic and Health Surveys (DHS). As a result, these findings are critical for those who make decisions and those who work with them to design policies and respond accordingly based on geographic evidence.
Methods
Study Design
The extent of spatial patterns of dietary diversity and associated factors among Ethiopian children aged 6–23 months was determined using a population-based repeated cross-sectional study. Which is based on an existing data set of two consecutive EDHSs surveys conducted in 201122 and 2016.23 The Demographic Health Survey (DHS) is a multi-round cross-country survey that assesses population health with a focus on maternal health and child health, as well as population health indicators of global health significance. Data collection was done in partnership with the Central Statistical Agency (CSA) and the Ministry of Health of Ethiopia.
For both surveys, the DHS used a multistage sampling method, with clusters being chosen first and households being picked second. With clusters, EAs (enumeration areas) sample households were chosen, and cluster selection was stratified by place of residence (rural/urban) and districts. The full EDHS report included a detailed sampling technique.22,23 Location data (latitude and longitude coordinates) were also taken from selected EAs.
Study Setting
Ethiopia is a country located in the horn of Africa. Its geographical coordinates are 9.145° N latitude and 40.4897° East longitude.24
The total land area is estimated to be 1,126,829km2. As a landlocked country, It is bordered by Djibouti, Eritrea, Kenya, Somalia, South Sudan, Sudan, and Somaliland (Somalia).25 Agriculture is the predominant economic activity accounting for over 83.9% of its GDP, this agricultural activities are mainly dependent on rainfall.26 Each of the country’s nine administrative regions and two administrative cities is organized into zones, districts, towns, and kebeles (the smallest administrative units).
Study Tool and Measurement
Dependent Variables
The dietary diversity indicator utilized in the analysis was constructed using data from the DHS survey’s 24-hour recall of food groups.22,23 According to WHO and UNICEF guidelines the DD score for children 6–23 months of age, defined as the proportion of children aged 6–23 months who consumed foods from at least five of the eight food groups within a 24-h period.5 1-grains, roots and tubers, 2-legumes and nuts, 3-dairy products, 4-meat, fish, poultry, and liver/organ meats, 5-eggs, 6-vitamin A-rich fruits and vegetables, 7-other fruits and vegetables, and 8-breast milk are the eight food groups. In this study, the MDD score of the children was divided into two categories. Those children between 6 and 23 months who consumed at least five food categories in the last 24 h before an interview are considered to have met the MDD requirements, their MDD score categorized as having adequate minimum dietary diversity. Furthermore, children aged between 6 and 23 months who consumed less than five food categories in the last 24 h before an interview were considered to have not met the MDD requirements, their MDD score categorized as having inadequate minimum dietary diversity.
Independent Variables
The design and development of the conceptual framework for the study were guided by the literature review for factors that are associated with children’s DD.3,7–9,12,13,15,17–21 These cover factors related to child, maternal, household, and community characteristics that impact children’s diet. The main exposure variables were wealth, household food insecurity access, mother’s marital status, family size, maternal age, maternal education, maternal occupation, child sex, child age in a month, paternal education, paternal occupation, and child’s place of birth order.
Data Management and Analysis
To restore the survey’s representativeness and account for sampling design when computing standard errors to provide valid statistical estimates, the data were weighted using sampling weight, primary sampling unit, and strata before any statistical analysis. STATA version 14.1 was used to create descriptive and summary statistics for non-spatial analysis. A spatial map was also produced for visual presentation of DD at the regional and district level using ArcGIS version 10.8 and Sat Scan version 9.6. The district demarcation shapefile for Ethiopia was obtained from the CSA database.
Spatial Autocorrelation Analysis
The global spatial autocorrelation (Global Moran’s I) statistic measure was used to assess whether MDD among children was dispersed, clustered, or randomly distributed in the study area. It was used to detect the spatial autocorrelation of DD: calculated Moran’s I values close to −1 indicate inadequate dietary among children are dispersed, whereas I close to +1 indicate inadequate dietary clustered and inadequate dietary among children is distributed randomly if I value zero. A statistically significant Moran’s I (p < 0.05) leads to rejection of the null hypothesis and indicates the presence of spatial autocorrelation.
Hot Spot Analysis
By generating Gi* statistics for each area, hot spot analyses were generated to determine how spatial autocorrelation varies over the research areas. The statistical significance of clustering is determined by the Z-score, and the significance is determined by the p-value. If the z-score is between −1.96 and +1.96, the p-value would be larger than 0.05, then the null hypothesis cannot be rejected; the pattern displayed is most likely be the result of random spatial processes. If the z-score is outside the range, the observed spatial pattern is likely too unique to be due to chance, and the p-value will be significant. A high Gi* statistical output indicates a “hotspot,” while a low Gi* indicates a “cold spot.”.
Spatial Interpolation of Minimum Dietary Diversity Among Children
To anticipate the unsampled from sampled values, the spatial interpolation approach was used. For predicting and producing smooth surfaces of childhood DD, the kriging interpolation approach was utilized.27 As a result, in this study, ordinary kriging was employed to evaluate the burden of inadequate dietary diversity among children.
Cluster Analysis
Spatial analysis tools SaTScan and ArcGIS were used to perform final confirmatory spatial studies. The SaTScan identifies areas geographically where significant higher aggregate rates. Its results show hotspot areas in circular windows, showing that distributions inside the windows are higher than predicted when compared to the distributions outside of the cluster windows.28 Hot spot areas with a high cluster of inadequate dietary diversity and Coldspot areas with low-level clusters were identified in ArcGIS.
Multilevel Logistic Regression
At the individual and community levels, multivariable multilevel logistic regression was performed to investigate factors associated with DD. In the analysis, four models were used. The first model, which does not include any explanatory factors, assesses the degree of the cluster variation on DD. The second model contains only individual-level variables, the third model contains only community-level variables, and the fourth model contains both individual-level and community-level variables. A P-value of <0.05 was used to define statistical significance. Adjusted Odds Ratios (AOR) with their corresponding 95% confidence intervals (CIs) were calculated to identify the independent predictors of DD.
To evaluate the variation between clusters, the intra-cluster correlation coefficient (ICC), Median Odds Ratio (MOR), and proportional change in variance (PCV) statistics were calculated. MOR is a measure of unexplained cluster heterogeneity, while ICC was employed to explain cluster variation. PCV measures the total variation attributed by individual-level factors and community-level factors in the multilevel model as compared to the null model PCV.29
Ethical Considerations
We requested DHS Program for permission to obtain and utilize the data from http://www.dhsprogram.com for this study, and they agreed. Data obtained from the DHS is de-identified data before sharing with the public, thus participants identifiers are removed and institutional ethical review was waived, ensuring the regulations for the protection of human subjects. In infield surveys, GIS coordinates are only collected for the EA as a whole, and not for individual households, and the measured coordinates are randomly displaced within a large geographic area.
Results
Dietary Diversity Among Children
From the 2011 and 2016 EDHS, a total of 2936 and 2906 children aged 6–23 months were enrolled in the study. The result of the univariate analysis showed a higher number of participants were from rural residents 86.3% and 87.7% in both surveys. In 2011, the mean age of the responding women at the of their first delivery was much lower than in 2016. Furthermore, women’s education levels were much lower in 2011 than they were in 2016. Regarding their partners, 48.6% and 43.7% were illiterate in 2011 and 2016, respectively (Table 1).
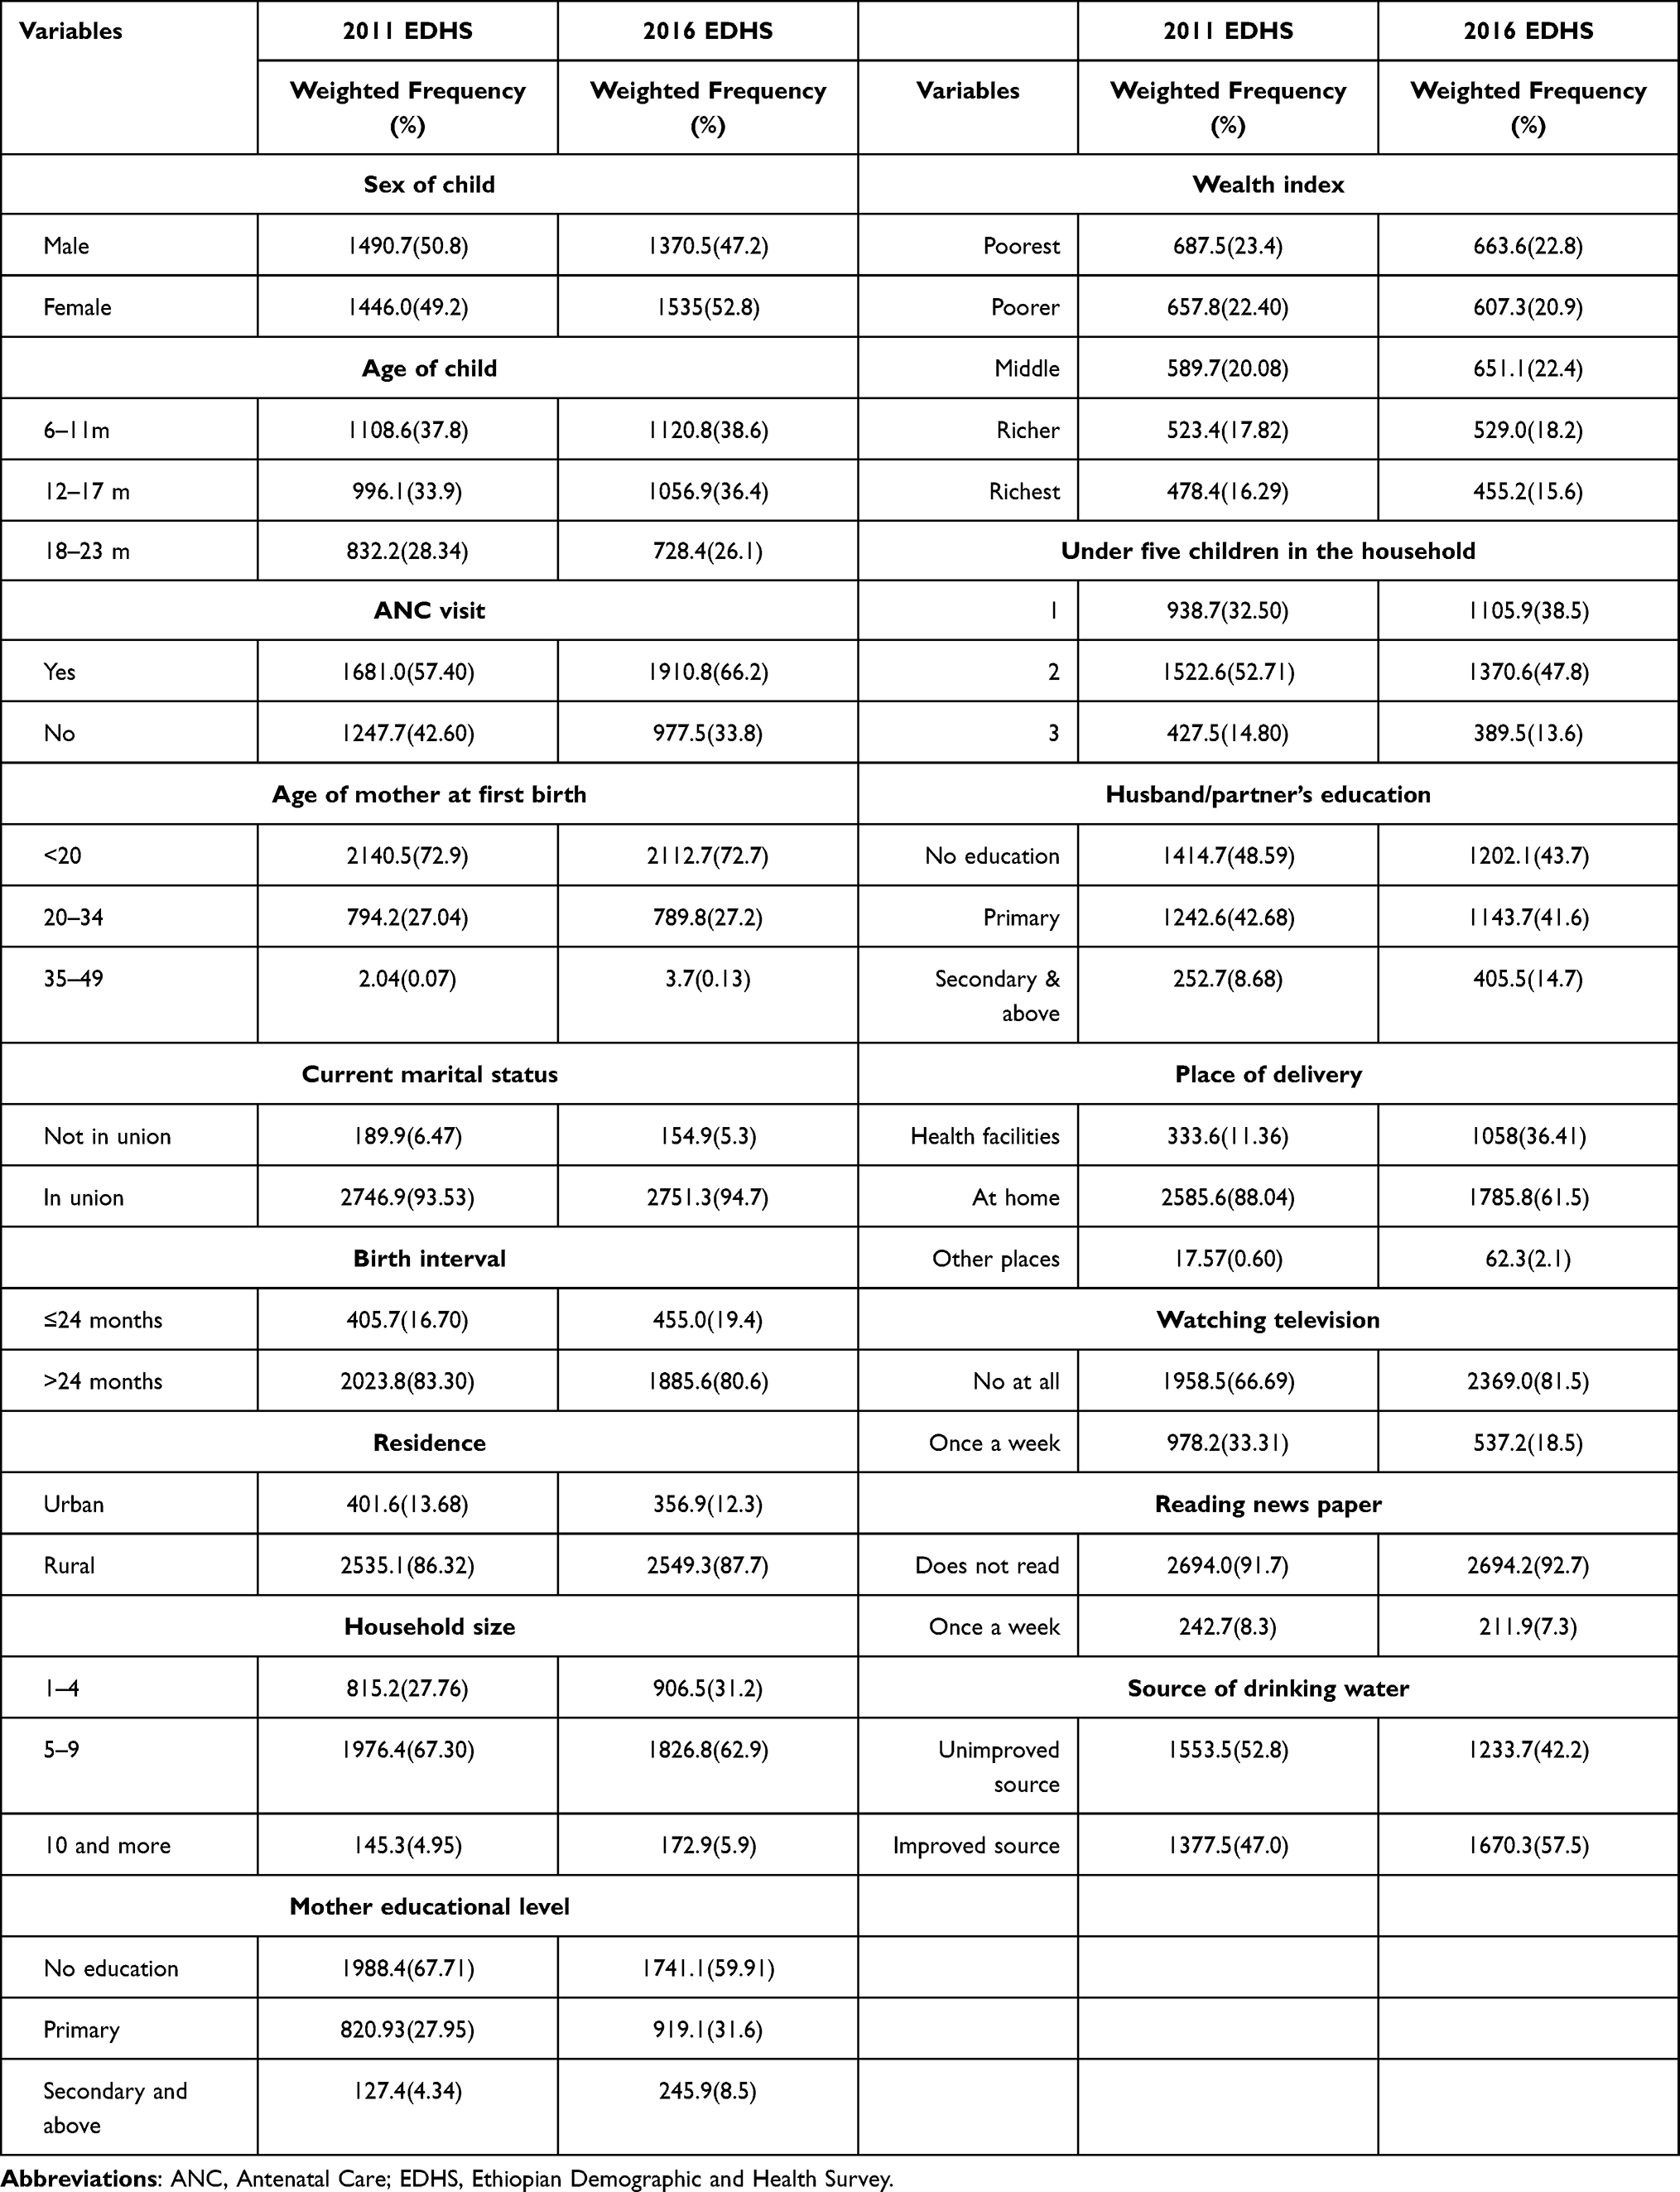 |
Table 1 Characteristics of the Study Participants in the 2011 and 2016 EDHS |
Overall, dietary diversity shows a slight increment across the survey. In both surveys, Breast milk, Grains, Legumes, and Dairy foods were the most commonly used up food groups while Meat/fish, vitamin A rich, and other fruits and vegetables were less frequently consumed (Figure 1). Of the children, only 13.3% (95% CI: 10.2–14.7%) in 2011 met the minimum acceptable diet compared to 24% (95% CI: 15.5–26.5%) in 2016.
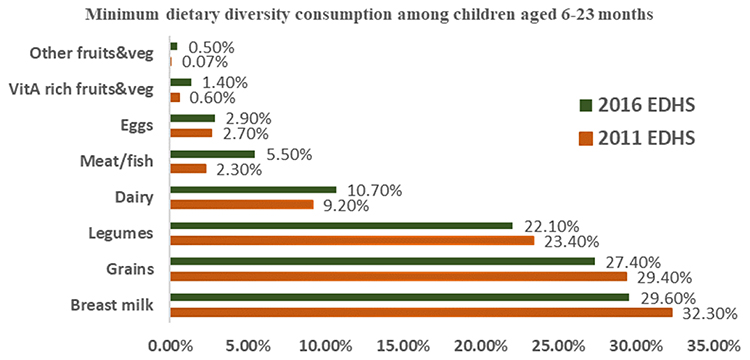 |
Figure 1 Minimum dietary diversity and food consumption among children aged 6–23 months in Ethiopia (2011, 2016 EDHS). Abbreviations: EDHS, Ethiopian Demographic and Health Survey; Veg, Vegetables. |
Spatial Trends of Dietary Diversity Among Children in Ethiopia
We presented the results in Figures 2 and 3. The regional distribution of dietary diversity demonstrated significant spatial variation across the country over time. The country’s diet variety was clustered significantly, according to the Global Moran’s I values (0.18–0.48).
 |
Figure 2 The global spatial autocorrelation of dietary diversity in 2011 EDHS. Abbreviation: EDHS, Ethiopian Demographic and Health Survey. |
 |
Figure 3 The global spatial autocorrelation of dietary diversity in 2016 EDHS. Abbreviation: EDHS, Ethiopian Demographic and Health Survey. |
The geographic distribution of inadequate dietary diversity is shown in Figures 4 and 5. Using Getis-Ord Gi* statistics, we identified significant spatial variability in the distribution of inadequate dietary diversity in the two survey periods. Districts from the South and North Wollo Amhara regions, Zone 4 and Zone 1 of Afar region, West Hararge and Jima of Oromia region, and Gurage and Zone 1 of SNNP, and Gambella regions were significantly associated with inadequate dietary diversity in the 2011 EDHS (Figure 4), whereas districts from the central and western parts of Ethiopia were significantly associated with adequate dietary diversity. The outliers were found on Amhara, Afar, Benishangul-Gumuz, Gambella, and SNNP regions (Figure 6).
 |
Figure 4 Hotspot analysis of inadequate dietary diversity among children in Ethiopia, 2011 EDHS. Abbreviation: EDHS, Ethiopian Demographic and Health Survey. |
 |
Figure 5 Hotspot analysis of inadequate dietary diversity among children in Ethiopia, 2016 EDHS. Abbreviation: EDHS, Ethiopian Demographic and Health Survey. |
 |
Figure 6 Cluster and outlier analysis of inadequate dietary diversity among children in Ethiopia, 2011. Abbreviation: EDHS, Ethiopian Demographic and Health Survey. |
In the 2016 EDHS, the highest prevalence of Inadequate dietary diversity (hotspots) was identified in Tigray, Afar, Amhara, Somali, and Gambella regions (Figure 5). We observed that the Inadequate diet diversity is worse in the northern part of Ethiopia. North Wollo, South Wollo, South Gondar, West Gojam, East Gojam, North Shewa, Wag Hemra, and Oromia Zone are the districts of the Amhara regions with high prevalence. The zone identified in the Tigray region is found in the southern and central parts. Similarly, four zones from the Afar region and three zones in the Somali region were significantly associated with a high inadequate dietary diversity. Furthermore, high clusters of inadequate dietary diversity include border areas of Tigray, in parts of Amhara, Afar, Somali, and Gambella (Figure 7).
 |
Figure 7 Cluster and outlier analysis of inadequate dietary diversity among children in Ethiopia, 2016. Abbreviation: EDHS, Ethiopian Demographic and Health Survey. |
Kriging Interpolation of Inadequate Diet Diversity
The Kriging approach predicted the distributions of inadequate dietary diversity by interpolating the collected data to areas where data were not available. High-risk areas are shown by red prediction zones, and children living in such areas were vulnerable to a lack of dietary diversity. According to EDHS 2011, Inadequate dietary diversity was detected in the Amhara, Afar, Tigray’s border areas, east SNNPR, south Oromia, the northern part of Benishangul-Gumuz, and Gambella regions, while relatively low inadequate dietary diversity was predicted in the Addis Ababa, west Oromia, Harari, and Dire Dawa regions (Figure 8). In the 2016 EDHS, Amhara, Afar, Southern Tigray, Somali, and Gambella (Zone1) were predicted as more risky areas for inadequate dietary diversity among children compared to other regions (Figure 9).
 |
Figure 8 Spatial Interpolation of interpolation of inadequate dietary diversity in Ethiopia, EDHS 2011. Abbreviation: EDHS, Ethiopian Demographic and Health Survey. |
 |
Figure 9 Spatial Interpolation of interpolation of inadequate dietary diversity in Ethiopia, EDHS 2016. |
Spatial Scan Analysis
A total of 216 significant clusters were discovered (43 in 2011, and 173 in 2016). Among them, there were 14 primary clusters and 63 secondary clusters. In 2011, the spatial window was found in Ethiopia’s Southern Somali area. The cluster’s spatial window has had a radius of 48.2 km and was centered at 9.721962 N,42.330861 E, with a relative risk (RR) of 1.14 and Log-Likelihood ratio (LLR) of 14.5. This suggests that children living within the spatial window were 1.14 times more vulnerable to inadequate dietary diversity than children living outside the window (Table 2, Figure 10). Whereas the secondary clusters’ spatial window was centered at 12.188915 N, 40.452641 E, with a 77.7 km radius, a RR of 1.14, and LLR of 10.3.
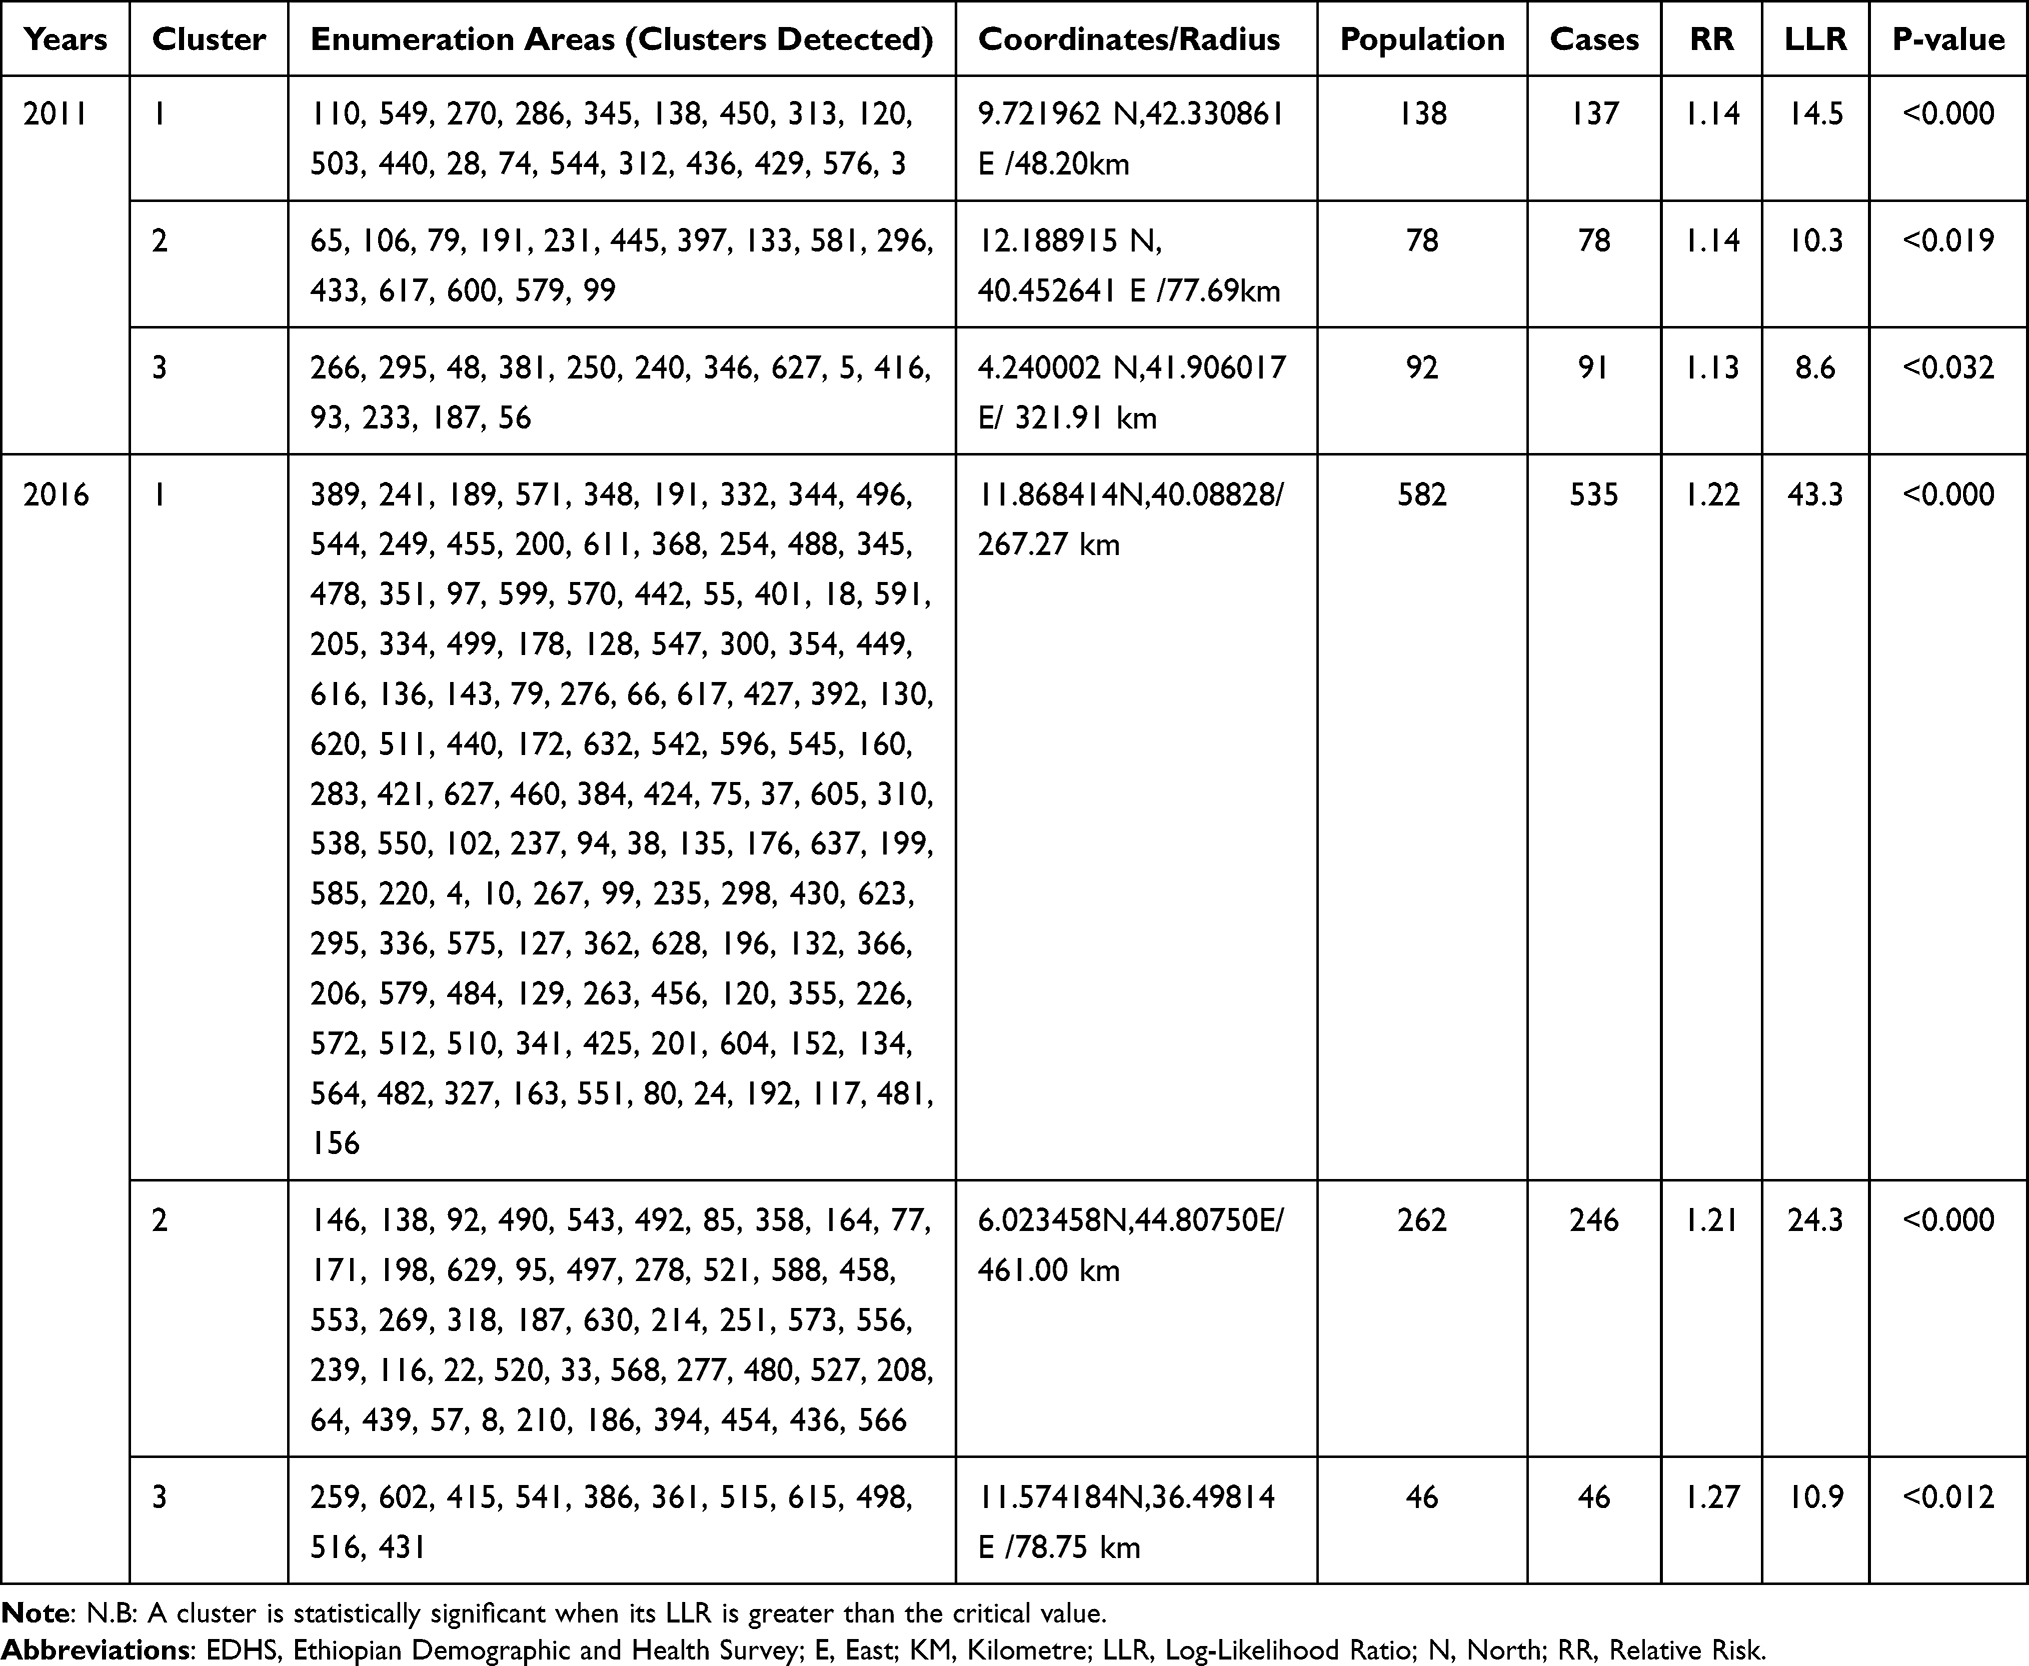 |
Table 2 Significant Spatial Clusters of Inadequate Dietary Diversity Among Children in Ethiopia, EDHS 2011, 2016 |
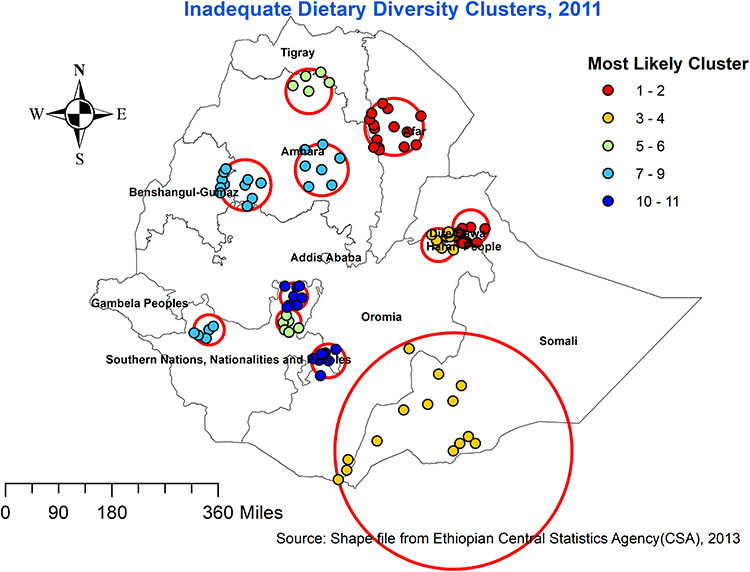 |
Figure 10 SaTScan scan statistics analysis of Inadequate dietary diversity, 2011 EDHS. Abbreviation: EDHS, Ethiopian Demographic and Health Survey. |
In 2016, the primary spatial window was in Somali, while secondary spatial windows were located in Afar and Dire Dawa regions. The primary clusters’ spatial window was centered at 11.868414 N,40.08828 E, with a radius of 267.3 km, a RR of 1.22, and a LLR of 43.3. The secondary clusters spatial window, on the other hand, was centred at 6.023458 N, 44.80750 E, with a 461.0 km radius, a RR of 1.21, and LLR of 24.3 (Table 2, Figure 11).
 |
Figure 11 SaTScan scan statistics analysis of Inadequate dietary diversity, 2016 EDHS. Abbreviation: EDHS, Ethiopian Demographic and Health Survey. |
Multilevel Analysis
From the total variation in dietary diversity across the participants, 28% in 2011 EDHS and 63% in 2016 EDHS was attributable to clustering. The comparison of each effect of model 0–3 is shown in Table 3. We saw decreased variance from ICC, MOR, and deviance. The log-likelihood ratio and proportional change in variances increased as global expectations. The smaller deviation, in particular, indicates that the model is fit.
 |
Table 3 Model Estimates of MDD in 2011 and 2016 EDHS |
The result of the multilevel analysis is presented below, Adjusted odds ratios (AOR) for 2011 and 2016 EDHS are shown in Tables 4 and 5 respectively. Individual/household level multivariable multilevel mixed-effect logistic regression analysis, the odd of having adequate dietary diversity were more than two times higher among children older than one year in both surveys, compared to infants. Similarly, children from households with good media exposure were greater odd of having adequate dietary diversity in both surveys. Furthermore, among community-level factors, children living in Amhara, Afar, Tigray, Somali, Benishangul-Gumuz, SNNP, and the Gambella regions were associated with having lower adequate dietary diversity compared to Dire Dawa.
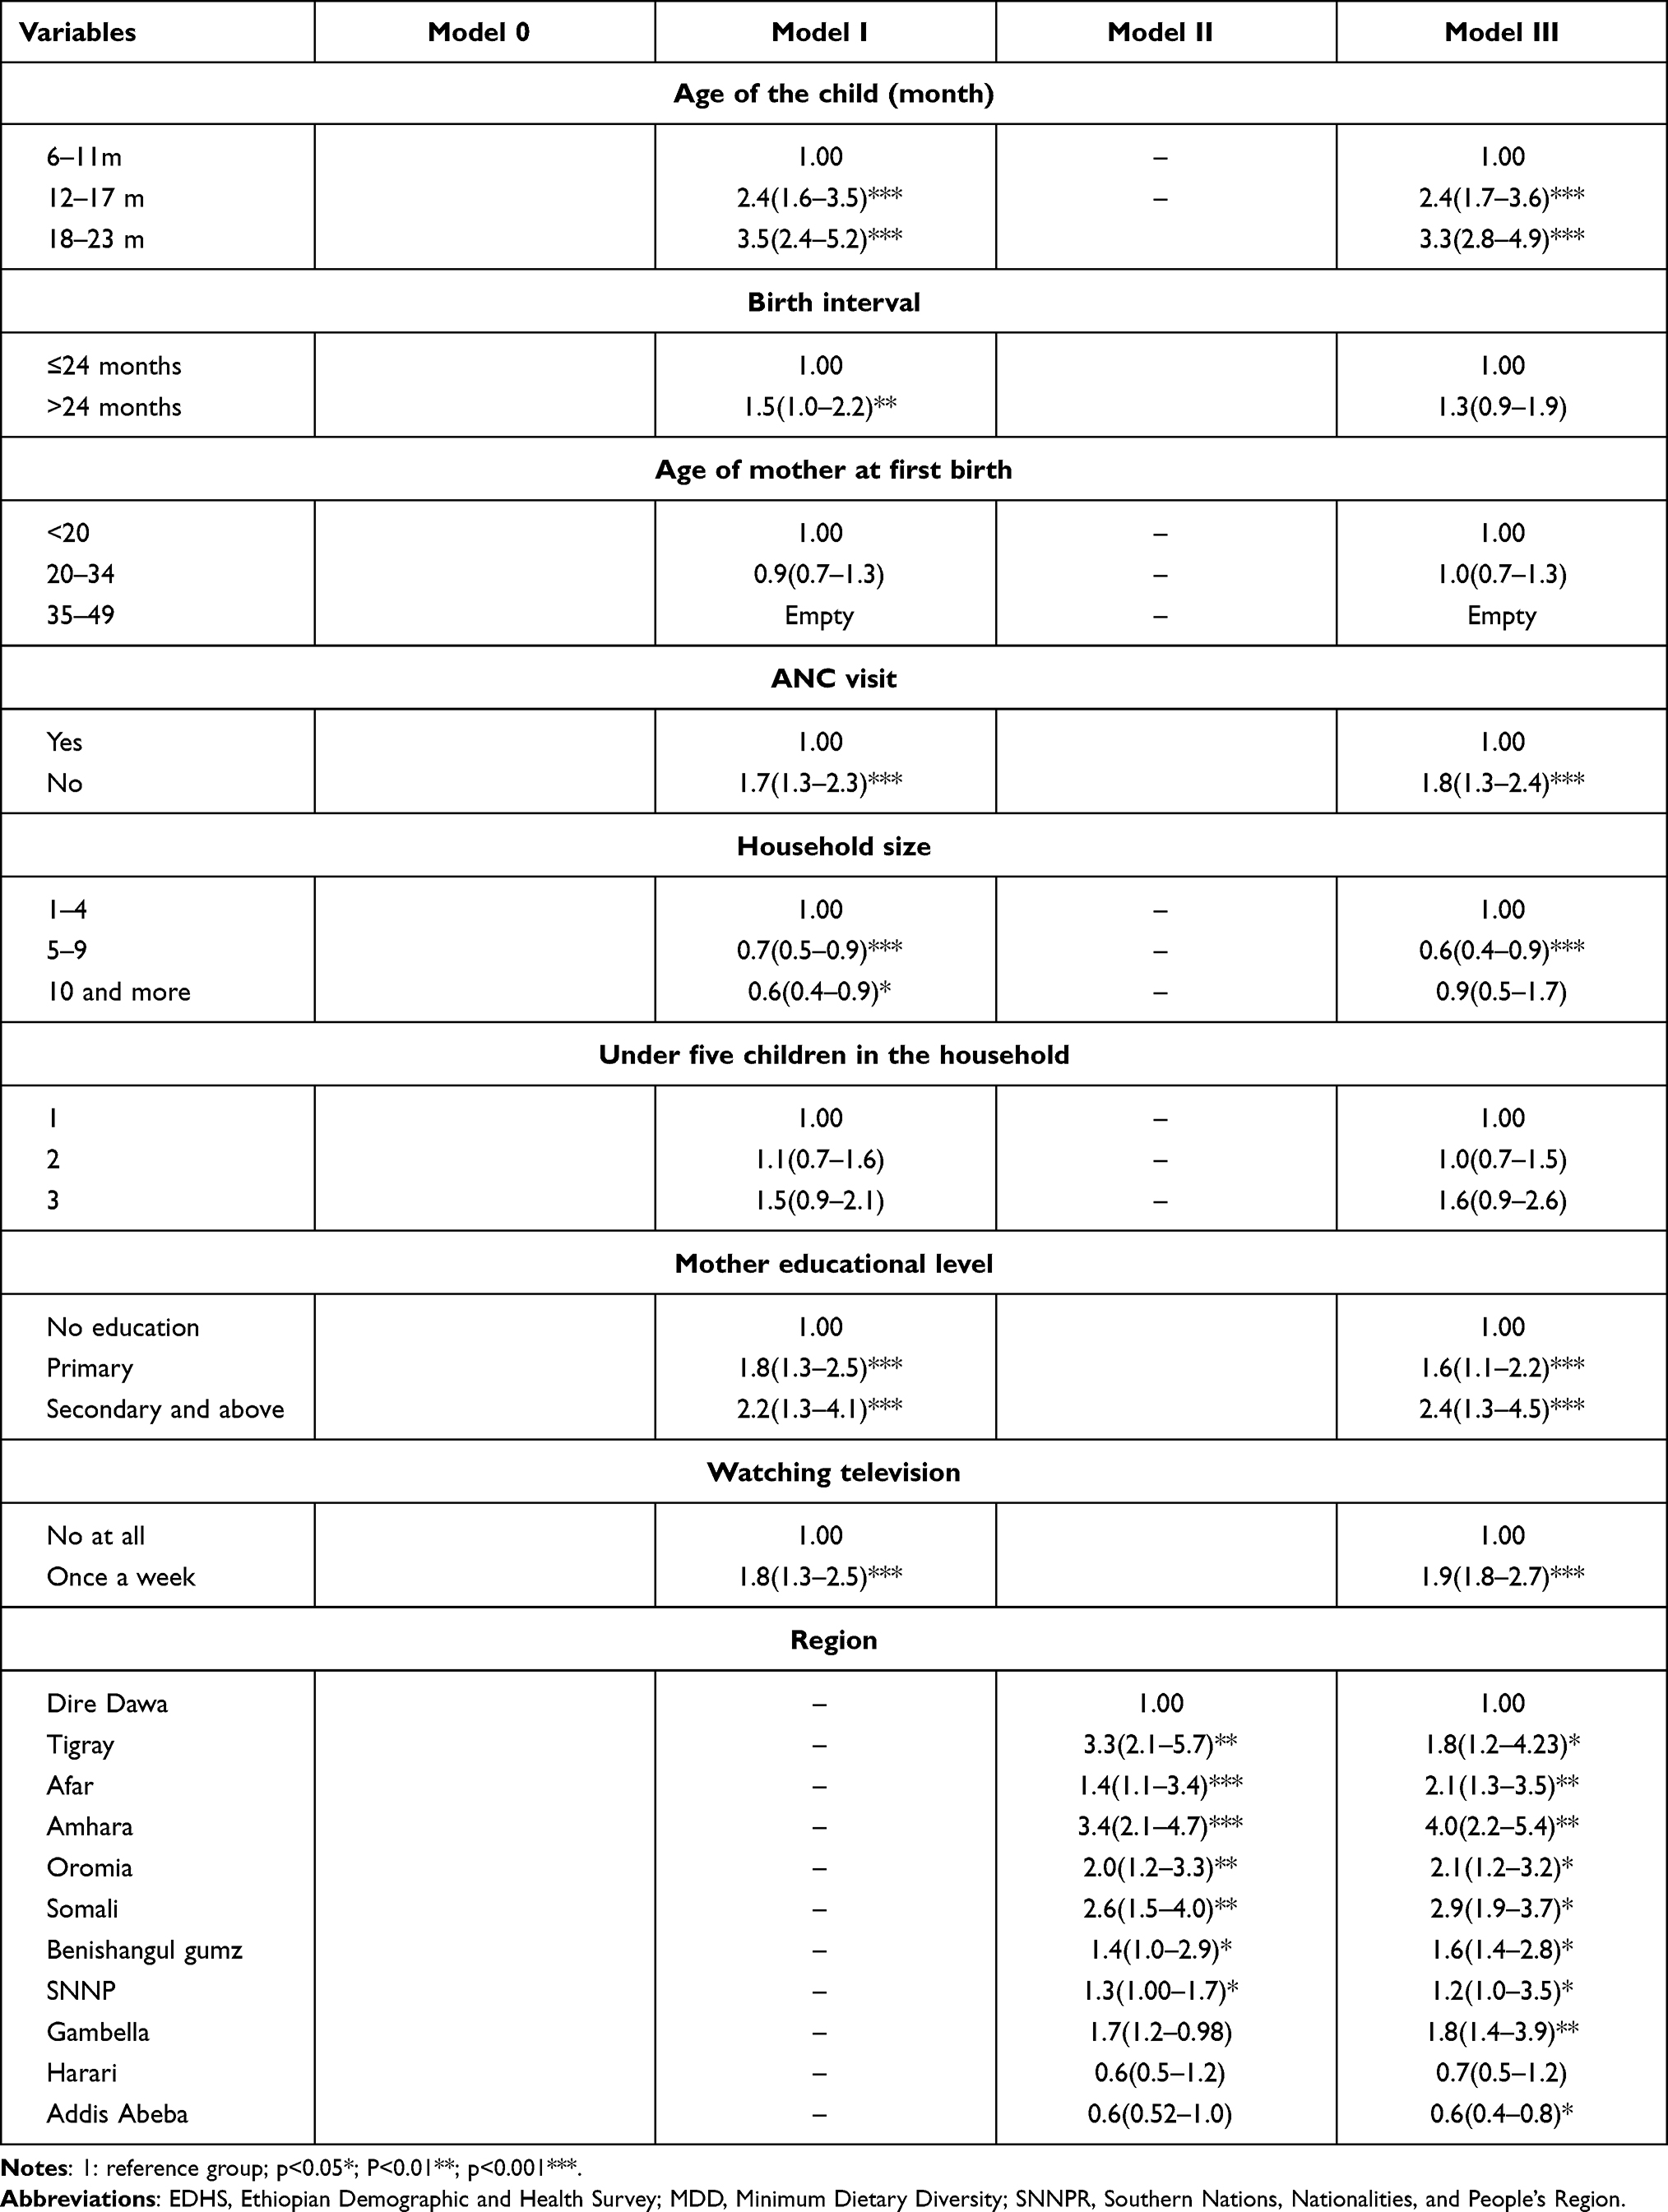 |
Table 4 Factors Associated with MDD in the 2011 EDHS. Results from Multilevel Analysis |
 |
Table 5 Factors Associated with MDD in the 2016 EDHS. Results from Multilevel Analysis |
In 2011 EDHS, having a mother who has completed formal education, large birth interval, having ANC visits, and living in the smaller family were positively associated with meeting the MDD (Table 4). Furthermore, in 2016 EDHS, a higher level of wealth index and children from urban households were positively associated with meeting the MDD (Table 5).
Discussion
We used a multilevel and spatial mapping approach based on the 2011 and 2016 EDHSs to examine the dietary diversity of children aged 0–23 months. This is, to the best of our knowledge, the first study to look into the geographical-level distribution of dietary diversity and their contributions/associations with Ethiopian children’s nutritional status. Further, we examined DD both at the individual and community levels.
Improvements in infant and young child feeding (IYCF) practices are critical for a child’s nutrition, health, and development, with long-term advantages.1,4,16 Based on two consecutive EDHS surveys, our results indicated that the minimum requirement of a diversified diet was met by 13.3% (95% CI: 10.2–14.7%) and 24% (95% CI: 15.5–26.5%) of the children aged 6–23 months in 2011 and 2016, EDHS respectively. In terms of figures from other Sub-Saharan African countries, this is in line with findings from Rwanda (23%),15 and Burundi (16%),15 which were lower than Tanzania (46%),16 while these findings are by far higher than a report from Zimbabwe, which is (2%).16 In the end, despite the progress that has been made, the child feeding practices have yet to progress to the point where they can be considered adequate.
So far, only a few research have looked at the spatial disparity of inadequate dietary diversities while considering the overall distribution of under-nutrition. Our study indicates that MDD among children at national and regional levels are non-random (Moran’s I: 0.18 and 0.48, 0.01) in 2011 and 2016 datasets respectively, which is consistent with prior research.30–32 Further, the result of regression analysis indicated that the observed variation in DD among children in Ethiopia is attributed to both individual and community-level factors. The finding of both spatial and regression analysis over the past two surveys identified high-risk regions consistently.
The study findings indicated a clear spatial pattern of inadequate dietary diversities across the regions of Ethiopia over the past decade. Significant clusters were detected in the Amhara, Afar, Benishangul-Gumuz, Somali, and Gambella in 2011 and 2016, and the SNNP region in 2011. The high rates of inadequate dietary diversities showed in the districts in the Tigray, Amhara, Afar, Somali, Benishangul-Gumuz, Gambella, and South Oromia. Overall, Tigray, Amhara, Afar, and Somali regions were among the higher risk regions of inadequate dietary diversities across time. The high-risk regions were consistently detected in both hotspot and cluster/outlier analyses, and they may be vulnerable to poor nutritional outcomes. Furthermore, previous studies conducted on childhood nutritional status identified these areas as higher risk regions for anthropometric failures.33–36 This might show that the findings are valid and highlight that proper child feeding practice plays a significant role in children’s nutritional status. Moreover, the Amhara, South and West Tigray, Afar, Somali, west Gambella, and Somali regions of Ethiopia have the highest magnitude of inadequate dietary diversity, according to spatial interpolations. This suggests that more attention and nutritional interventions are needed in the regions within the cluster windows.
The observed variations in dietary diversity can be ascribed to both individual and community-level factors, according to our findings. Our analysis indicated, older children had more adequate dietary intake as compared to younger children. Previous research has linked a higher risk of inadequate dietary diversity among younger children.15,20,21 We also found that media exposure, access, and utilization of radio and TV were also positively associated to meet the adequate DD in both surveys. This result was in line with previous research.13,15 Further, when compared others to in the Dire Dawa, regions such as Tigray, Amhara, Afar, Somali, and Benishangul-Gumuz have been negatively associated with child adequate dietary diversity across time.
According to the findings of this study, children from wealthier households had a more diverse diet than children from poorer households. Other research also suggested that children’s dietary diversity has been affected by households’ economic status.15,19,37 It could be a proxy for wealth because it reflects increased access to foods purchased outside the household.38 We also found that child dietary diversity is significantly associated with maternal education. Similar findings have been reported by other studies.15,20,21 This may be due to, Mothers who have received formal education are more knowledgeable about healthy child feeding, which may aid them in adopting essential nutrients.
These findings have valuable policy implications for intervention and program design. Our finding indicated that regions associated with significant inadequate dietary diversity among children aged between 6 and 23 months were consistent in the spatial and regression (Tables 4 and 5) analysis outputs. These findings will give attention and allow interventions to address hot spot areas associated with inadequate dietary diversity of children at local administrative levels. Furthermore, these findings are supremely important for the Ministry of Health and Regional Health Bureau to give attention to those hot spot areas for implementing intervention programs to have good progress towards achieving sustainable development goal target for nutrition.
This research had several strengths. To begin with, the study was based on large nationally representative datasets, thus it has adequate statistical power to generalize findings to children aged 6–23 months in the study area. Second, the study’s estimates were completed after the data had been weighted to account for probability sampling and nonresponse, ensuring that the results were representative at national and regional levels. Further, to explore the sources of variations in DD across time, spatial and multilevel analytical approaches were used. This allowed for the identification of similar and statistically significant hotspot areas with inadequate feeding practices across the surveys, as well as the development of effective interventions.
The current study has various limitations that must be noted when evaluating the results. The study’s cross-sectional design makes it Impossible to infer causation between the independent and dependent variables. Furthermore, this study did not consider several unobserved confounders, including Altitude and soil constraints, which were not investigated as part of the survey. The findings of this survey should be interpreted in light of the above limitations. However, we believe that our findings and recommendations will greatly contribute to a better understanding of Ethiopian childhood feeding practices.
Conclusion
According to the findings of this study, from the 2011 to 2016 survey in Ethiopia, the MDD for children as measured by WHO dietary assessment shows a slight increment. The spatial distribution of DD in both surveys was not random. A large area of the Amhara region, some parts of Afar, Somali, a few parts of Tigray, Benishangul-Gumuz, and Gambella were continued to be areas of inadequate dietary diversity. Reasons could include socioeconomic and demographic characteristics. Although greater children’s dietary diversity was consistently linked to improved household living standards, other sociodemographic characteristics impacted DD differently in each survey.
The fact that the spatial distribution and statistical association were well supported by one another showed the distribution is scientifically sound. The observed socio-demographic factors as well as districts with poor feeding practices can be used to develop localized intervention and preventative programs to improve children feeding practices. Further, as a practical recommendation, the authors believe that activities designed in a targeted approach to provide information and raising awareness about healthy feeding practices would be useful. The government’s initiatives to improve infant and young child feeding practices should be further scaled up.
Abbreviations
AOR, Adjusted Odds Ratio; ANC, Antenatal Care; CSA, Central Statics Agency; CI, Confidence Interval; COR, Crude Odds Ratio; DHS, Demographic and Health Survey; DD, Dietary Diversity; EA, Enumeration Area; EDHS, Ethiopia Demographic and Health Survey; ICC, Intra Class Correlation Coefficient; LLR, Log-Likelihood Ratio; MDD, Minimum Dietary diversity; MOR, Median odds ratio; OR, Odds Ratio; RR, Relative Risk; PVC, Proportional Change in Variance; SNNPR, Southern Nations, Nationalities, and Peoples’ Region; WHO, World Health Organization.
Data Sharing Statement
The data we used for this analysis is publicly available through the MEASURE DHS program, and you can access it from www.measuredhs.com after explaining the objectives of the study. The data is then accessible can be freely downloaded after receiving the authorization letter.
Ethics Approval and Consent to Participate
The study did not require ethical approval or participant consent because it was a secondary data analysis of publicly available survey data from the DHS program.
Acknowledgment
We would like to express our gratitude to the DHS program for providing the dataset for this work.
Author Contributions
All authors made a significant contribution to the work reported, whether that is in the conception, study design, execution, acquisition of data, analysis and interpretation, or in all these areas; took part in drafting, revising or critically reviewing the article; gave final approval of the version to be published; have agreed on the journal to which the article has been submitted; and agree to be accountable for all aspects of the work.
Funding
No funding was obtained for this study.
Disclosure
The authors declare that they have no conflicts of interest for this work.
References
1. Ty H, Krawinkel M. Dietary diversity score: a measure of nutritional adequacy or an indicator of healthy diet? J Nutr Health Sci. 2016;3:303.
2. Rathnayake K, Madushani P, Silva K. Use of dietary diversity score as a proxy indicator of nutrient adequacy of rural elderly people in Sri Lanka. BMC Res Notes. 2012;5:469. doi:10.1186/1756-0500-5-469
3. World Health Organization. Indicators for assessing infant and young child feeding practices; 2017.
4. World Health Organization. The importance of infant and young child feeding and recommended practices. In: Infant and Young Child Feeding: Model Chapter for Textbooks for Medical Students and Allied Health Professionals. Geneva: World Health Organization; 2009.
5. World Health Organization. Global Nutrition Monitoring Framework: operational guidance for tracking progress in meeting targets for 2025; 2017. Available from: https://apps.who.int/iris/handle/10665/259904. Accessed September 15, 2021.
6. World Health O, Food, Agriculture Organization of the United N. Sustainable Healthy Diets: Guiding Principles. Geneva: World Health Organization; 2019.
7. Dinku AM, Mekonnen TC, Adilu GS. Child dietary diversity and food (in) security as a potential correlate of child anthropometric indices in the context of urban food system in the cases of north-central Ethiopia. J Health Popul Nutr. 2020;39(1):11. doi:10.1186/s41043-020-00219-6
8. Khamis AG, Mwanri AW, Ntwenya JE, Kreppel K. The influence of dietary diversity on the nutritional status of children between 6 and 23 months of age in Tanzania. BMC Pediatr. 2019;19(1):518. doi:10.1186/s12887-019-1897-5
9. Belayneh M, Loha E, Lindtjørn B. Seasonal variation of household food insecurity and household dietary diversity on wasting and stunting among young children in a drought prone area in South Ethiopia: a cohort study. Ecol Food Nutr. 2021;60(1):44–69. doi:10.1080/03670244.2020.1789865
10. World Health Organization. Malnutrition. Available from: https://www.who.int/health-topics/malnutrition#tab=tab_1.
11. Webb P. Nutrition and the post-2015 sustainable development goals; 2014.
12. Solomon D, Aderaw Z, Tegegne TK. Minimum dietary diversity and associated factors among children aged 6–23 months in Addis Ababa, Ethiopia. Int J Equity Health. 2017;16(1):181.
13. Pérez-Rodrigo C, Artiach Escauriaza B, Artiach Escauriaza J, Polanco Allúe I. Dietary assessment in children and adolescents: issues and recommendations. Nutricion hospitalaria. 2015;31(Suppl 3):76–83.
14. Hannah Ritchie MR. Micronutrient deficiency; 2017. Available from: https://ourworldindata.org/micronutrient-deficiency.
15. Custodio E, Herrador Z, Nkunzimana T, Węziak-Białowolska D, Perez-Hoyos A, Kayitakire F. Children’s dietary diversity and related factors in Rwanda and Burundi: a multilevel analysis using 2010 demographic and health surveys. PLoS One. 2019;14(10):e0223237. doi:10.1371/journal.pone.0223237
16. UNICEF. Infant and young child feeding; 2021. Available from: https://data.unicef.org/topic/nutrition/infant-and-young-child-feeding/.
17. Ahmed KY, Page A, Arora A, Ogbo FA. Trends and factors associated with complementary feeding practices in Ethiopia from 2005 to 2016. Matern Child Nutr. 2020;16(2):e12926. doi:10.1111/mcn.12926
18. Damtie S, Tefera T, Haile M. Dietary diversity practice and associated factors among children aged 6–23 months in Robe Town, Bale Zone, Ethiopia. J Nutr Metab. 2020;2020:1–8. doi:10.1155/2020/9190458
19. Woldegebriel AG, Desta AA, Gebreegziabiher G, Berhe AA, Ajemu KF, Woldearegay TW. Dietary diversity and associated factors among children aged 6–59 months in Ethiopia: analysis of Ethiopian demographic and health survey 2016 (EDHS 2016). Int J Pediatr. 2020;2020:3040845. doi:10.1155/2020/3040845
20. Dafursa K, Gebremedhin S. Dietary diversity among children aged 6–23 months in Aleta Wondo District, Southern Ethiopia. J Nutr Metab. 2019;2019:1–10.
21. Temesgen H, Yeneabat T, Teshome M. Dietary diversity and associated factors among children aged 6–23 months in Sinan Woreda, Northwest Ethiopia: a cross-sectional study. BMC Nutr. 2018;4(1):5. doi:10.1186/s40795-018-0214-2
22. Central Statistical Agency (CSA) Ethiopia. Ethiopia Demographic and Health Survey (EDHS) 2011 Key Indicators Report. Addis Ababa, Ethiopia and Calverton, Maryland: CSA and ORC Macro; 2011.
23. Central Statistical Agency (CSA) Ethiopia. Ethiopia Demographic and Health Survey (EDHS) 2016 Key Indicators Report. Addis Ababa, Ethiopia and Calverton, Maryland: CSA and ORC Macro; 2016.
24. Geodatos. Ethiopia geographic coordinates. Available from: https://www.geodatos.net/en/coordinates/ethiopia.
25. Federal Democratic Republic of Ethiopia. Available from: https://www.nationsonline.org/oneworld/ethiopia.htm#:~:text=It%20is%20bordered%20by%20Djibouti,the%20U.S.%20state%20of%20Texas.
26. Wikipedia; 2020. Available from: https://en.wikipedia.org/wiki/Agriculture_in_Ethiopia#:~:text=Agriculture%20in%20Ethiopia%20is%20the,and%2080%25%20of%20total%20employment.&text=Agriculture%20accounts%20for%2046.3%20percent,80%25%20of%20the%20labour%20force.
27. Zimmerman DL, Zimmerman MB. comparison of spatial semivariogram estimators and corresponding ordinary kriging predictors. Technometrics. 1991;33:77–91. doi:10.1080/00401706.1991.10484771
28. K M. A spatial scan statistic. Commun Stat Theory Methodol. 1997;26:481–1496.
29. Merlo J, Y M, Chaix B, Lynch J, Rastam L. A brief conceptual tutorial on multilevel analysis in social epidemiology: investigating contextual phenomena in different groups of people. J Epidemiol Commun Health. 2005;59(9):729–736. doi:10.1136/jech.2004.023929
30. Marivoet W, Ulimwengu J, Sedano F. Spatial typology for targeted food and nutrition security interventions. World Dev. 2019;120:62–75. doi:10.1016/j.worlddev.2019.04.003
31. Alemu ZA, Ahmed AA, Yalew AW, Simanie B. Spatial variations of household food insecurity in East Gojjam Zone, Amhara Region, Ethiopia: implications for agroecosystem-based interventions. Agric Food Secur. 2017;6(1):36. doi:10.1186/s40066-017-0113-9
32. Busse H, Jogo W, Leverson G, Tesfay H. Food security prevalence, spatial variation, and socio-economic determinants in rural households with children under five years in Tigray, Ethiopia. Food Stud Interdiscip J. 2018;8(3):41–61.
33. Hagos S, Hailemariam D, WoldeHanna T, Lindtjørn B. Spatial heterogeneity and risk factors for stunting among children under age five in Ethiopia: a Bayesian geo-statistical model. PLoS One. 2017;12(2):e0170785. doi:10.1371/journal.pone.0170785
34. Tusa BS, Weldesenbet AB, Kebede SA. Spatial distribution and associated factors of underweight in Ethiopia: an analysis of Ethiopian demographic and health survey, 2016. PLoS One. 2020;15(12):e0242744. doi:10.1371/journal.pone.0242744
35. Alemu ZA, Ahmed AA, Yalew AW, Birhanu BS. Non random distribution of child undernutrition in Ethiopia: spatial analysis from the 2011 Ethiopia demographic and health survey. Int J Equity Health. 2016;15(1):198. doi:10.1186/s12939-016-0480-z
36. Haile D, Azage M, Mola T, Rainey R. Exploring spatial variations and factors associated with childhood stunting in Ethiopia: spatial and multilevel analysis. BMC Pediatr. 2016;16(1):49. doi:10.1186/s12887-016-0587-9
37. Demilew YM, Tafere TE, Abitew DB. Infant and young child feeding practice among mothers with 0–24 months old children in Slum areas of Bahir Dar City, Ethiopia. Int Breastfeed J. 2017;12(1):26. doi:10.1186/s13006-017-0117-x
38. Bersisa M, Heshmati A. A distributional analysis of uni-and multidimensional poverty and inequalities in Ethiopia. Soc Indic Res. 2021;155(3):805–835. doi:10.1007/s11205-021-02606-w
 © 2021 The Author(s). This work is published and licensed by Dove Medical Press Limited. The
full terms of this license are available at https://www.dovepress.com/terms
and incorporate the Creative Commons Attribution
- Non Commercial (unported, 3.0) License.
By accessing the work you hereby accept the Terms. Non-commercial uses of the work are permitted
without any further permission from Dove Medical Press Limited, provided the work is properly
attributed. For permission for commercial use of this work, please see paragraphs 4.2 and 5 of our Terms.
© 2021 The Author(s). This work is published and licensed by Dove Medical Press Limited. The
full terms of this license are available at https://www.dovepress.com/terms
and incorporate the Creative Commons Attribution
- Non Commercial (unported, 3.0) License.
By accessing the work you hereby accept the Terms. Non-commercial uses of the work are permitted
without any further permission from Dove Medical Press Limited, provided the work is properly
attributed. For permission for commercial use of this work, please see paragraphs 4.2 and 5 of our Terms.