")
Back to Journals » Drug Design, Development and Therapy » Volume 17
Exploration of Artemisinin Against IgA Nephropathy via AKT/Nrf2 Pathway by Bioinformatics and Experimental Validation
Authors Yang WG, Sun A , Zhu R, Liu N, He WJ, Liu LL
Received 7 February 2023
Accepted for publication 27 May 2023
Published 7 June 2023 Volume 2023:17 Pages 1679—1697
DOI https://doi.org/10.2147/DDDT.S403422
Checked for plagiarism Yes
Review by Single anonymous peer review
Peer reviewer comments 2
Editor who approved publication: Prof. Dr. Tin Wui Wong
Wei-guang Yang,* Ao Sun,* Rong Zhu, Nan Liu, Wei-jie He, Lin-lin Liu
Department of Nephrology, The First Affiliated Hospital of China Medical University, Shen Yang, Liao Ning, People’s Republic of China
*These authors contributed equally to this work
Correspondence: Lin-lin Liu, Department of Nephrology, The First Affiliated Hospital of China Medical University, 155 Nan Jing North Street in He Ping District, Shen Yang, Liao Ning, People’s Republic of China, Email [email protected]
Background: Artemisinin (ART) is a safe and effective antimalarial drug. In recent years, antimalarial drugs have demonstrated a good therapeutic efficacy in IgA nephropathy, suggesting that this may become a new treatment option.
Purpose: We aimed to evaluate the effect and mechanism of artemisinin in IgA nephropathy.
Methods: In this study, CMap database was used to predict the artemisinin therapeutic effect for IgA nephropathy. A network pharmacology approach was applied to explore the unknown mechanism of artemisinin in IgA nephropathy. We used molecular docking to predict the binding affinity of artemisinin with the targets. A mouse model of IgA nephropathy was established to investigate the therapeutic effect of artemisinin on IgA nephropathy. In vitro, the cell counting Kit-8 assay was used to evaluate the cytotoxicity of artemisinin. Flow cytometry and PCR assays were used to detect the effects of artemisinin on oxidative stress and fibrosis in lipopolysaccharide (LPS)-stimulated mesangial cells. Western blot and immunofluorescence were used to detect the expression of pathway proteins.
Results: CMap analysis showed artemisinin may reverse the expression levels of differentially expressed genes in IgA nephropathy. Eighty-seven potential targets of artemisinin in the treatment of IgA nephropathy were screened. Among them, 15 hub targets were identified. Enrichment analysis and GSEA analysis indicated that response to reactive oxygen species is the core biological process. AKT1 and EGFR had the highest docking affinity with artemisinin. In vivo, artemisinin could improve renal injury and fibrosis in mice. In vitro, artemisinin attenuated LPS-induced oxidative stress and fibrosis promoted AKT phosphorylation and Nrf2 nuclear translocation.
Conclusion: Artemisinin reduced the level of fibrosis and oxidative stress with IgA nephropathy through the AKT/Nrf2 pathway, which provided an alternative treatment for IgAN.
Keywords: IgA nephropathy, artemisinin, network pharmacology, AKT, Nrf2
Introduction
IgA nephropathy (IgAN) is a prevalent glomerular disease that has been on the rise in recent years. Patients with IgAN are mostly young people between the ages of 20–30. Among these patients, approximately 50% will progress to end-stage renal disease (ESRD) within 20 years.1,2 Currently, corticosteroids, immunosuppressive drugs and natural products derived from traditional Chinese medicine (TCM) have been used to treat IgAN, which showed efficacy in some patients.3–5 However, these regimens were challenged for the heterogeneity of patients’ responses and side effects. Identification of new therapies and exploration of the mechanisms of the therapies is a priority for IgAN.
A few previous studies showed that hydroxychloroquine (HCQ), an antimalarial drug, may reduce proteinuria in IgAN without evidence of adverse events.6,7 The mechanism may be associated with regulating the differentiation of CD4+ T cell subsets and mediating exosomes release.8,9
Artemisinin (ART), another antimalarial drug, was also proven to benefit some kidney diseases.8–10 ART is a sesquiterpene lactone extracted from the traditional Chinese plant Artemisia annua, which contains the specific endoperoxide bridge structure. In addition to significant antimalarial effects, artemisinin and its derivatives have exhibited other pharmacological properties, such as antitumor, antiviral, antifibrotic, and anti-inflammatory effects.11–13 However, the existing mechanisms cannot fully explain the molecular protective mechanism of HCQ and ART in glomerular injury in IgAN.
Previous study of IgAN lacked research on medication treatment targets based on big data. Therefore, we used bioinformatics and experimental validation to predict the mechanism of the ART for IgAN treatment, which provides new insights into the pharmacological properties of artemisinin in the treatment of IgAN. The flow chart of the study is shown in Figure 1.
 |
Figure 1 Flowchart of the study. Abbreviations: ART, Artemisinin; IgAN, IgA nephropathy; HT, Hub targets; HBP, Hub biological process. |
Materials and Methods
Microarray Dataset Preparation and Differentially Expressed Genes Analysis
Microarray datasets were downloaded from Gene Expression Omnibus (GEO, http://www.ncbi.nlm.nih.gov/geo). GSE93798 contained 20 normal human kidney glomerular compartment samples and 22 IgAN glomerular compartment samples. The GEO2R tool was used to identify Differentially Expressed Genes (DEGs) between IgAN samples and normal samples. A P-value <0.05 and |log2fold change|>0.5 was used as cut-off values.
CMap Analysis
The CMap (https://clue.io/) is an open platform that connects drugs with genes by the expression profiles.14 It was used to predict the therapeutical effect of artemisinin to IgA nephropathy. We input the upregulation and the downregulation DEGs with an output of normalized connective score. The negative score indicates gene expression changes in the opposite direction from the disease DEGs.
Target Collection
The chemical structure of artemisinin was obtained from PubChem website (Figure 2A). TCMSP (https://old.tcmsp-e.com/tcmsp.php), PharmMapper (http://www.lilab-ecust.cn/pharmmapper/), SwissTargetPrediction (http://www.swisstargetprediction.ch/) databases were used to screen the potential targets of artemisinin. The related targets involving IgA nephropathy were accessed using the OMIM (https://omim.org/), GeneCards (https://www.genecards.org/), TTD (http://db.idrblab.net/ttd/), DisGeNet (https://www.disgenet.org/). The predicted targets of artemisinin for IgA nephropathy were obtained by taking the intersection of the targets retrieved from the above databases. The protein–protein interaction (PPI) network was obtained by inputting all the targets we obtained into the STRING 11.5 (https://string-db.org/). Using Cytoscape 3.8.0, the interaction network maps of the targets were generated.
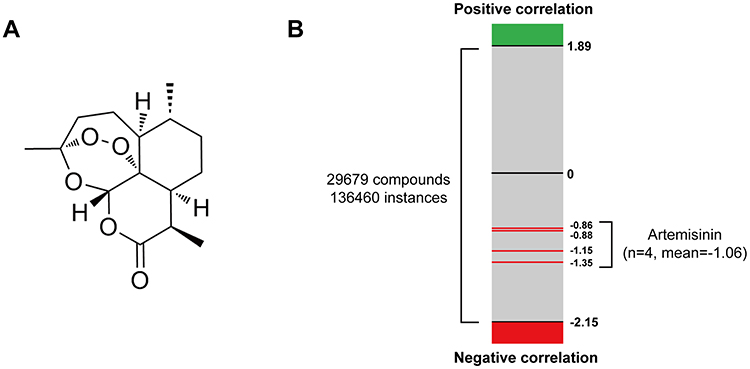 |
Figure 2 CMap analysis predicted the therapeutic effect of artemisinin for IgAN. (A) The chemical structure of artemisinin. (B) The bar graph shows all the output instances of different compounds in CMap analysis. The green and red edges represent positive and negative correlation with IgAN DEGs, respectively, while the red lines indicate the NCS value of artemisinin. |
Hub Targets Identification
The “MCODE” plugin of Cytoscape was used to identify the molecular modules. The criteria were set as follows: MCODE scores >3 and number of nodes >4. Hub genes were identified from the PPI network using CytoHubba plugin with the MCC methods.15 The top 15 genes were considered as hub targets.
Enrichment Analysis
Using the Metascape website (http://metascape.org/), enrichment analysis of gene ontology (GO) for biological process (BP), cellular component (CC), molecular function (MF), and Kyoto Encyclopedia of Genes and Genomes (KEGG) was performed separately.16 Based on the p-values of the obtained analysis results, bar graphs of the enrichment results were plotted by an online tool (https://www.bioinformatics.com.cn).
Gene Set Enrichment Analysis
The gene set enrichment analysis (GSEA) was performed using GSEA software (version 3.12.0). Gene set c5.go.bp.v7.4.symbols.gmt was downloaded from Molecular Signatures Database (http://software.broadinstitute.org/gsea/index.jsp). The normalized enrichment score (NES) and p value were specified.
Molecular Docking
The protein 3D conformations of the 7 target genes were obtained from the PDB database (https://www.rcsb.org/), which were de-polymerized, de-small molecule ligands, hydrogenated and de-watered using Pymol software (http://www.pymol.org/). Autodock vina program (https://vina.scripps.edu/) was used for semi-flexible docking of a small-molecule ligand (artemisinin) to a large-molecule receptor (protein). The lower affinity score indicates more stable docking. Then, we used PyMol software to visualize their docking results in 3D together with LigPlus software (https://www.ebi.ac.uk/thornton-srv/software/LigPlus/) for 2D results.
Cell Lines and Reagents
Mouse mesangial cells (SV40 MES13) were purchased from the cell bank of Chinese Academy of Sciences (Shanghai, China). High DMEM (GIBCO, USA) and F12 (GIBCO, USA) were mixed at a ratio of 3:1, and then add 5% Fetal bovine serum (FBS) (BI, USA). The cells were maintained at 37°C in 5% CO2. Artemisinin was purchased from Shanghai Aladdin Bio-Chem Technology Co., Ltd. (Shanghai, China). BSA was purchased from Beijing Solarbio Science & Technology Co., Ltd. (China). Lipopolysaccharides (LPS) were purchased from Sigma-Aldrich (USA); Primary antibodies against AKT, p-AKT and Tubulin were acquired from Abmart Shanghai Co., Ltd. (China); Primary antibodies against Lamin B were purchased from Wanleibio Co., Ltd. (China); Antibodies against Nrf2 were purchased from Proteintech (China)and IgA-FITC was purchased from Abcam (Cambridge, UK). Urine protein kits were obtained from Cloud-Clone Corp (Shanghai, China). Malondialdehyde (MDA) assay kits were obtained from Beyotime Co., Ltd. (China). Levels of blood urea nitrogen (BUN), serum creatinine (SCr) were determined using assay kits, Nanjing Jiancheng Bioengineering Institute (China).
Animals and Treatment
Eighteen female BALB/c mice were purchased from Beijing Spelford. All animal use was approved by Institutional Animal Care and Use Committee (IACUC) of China Medical University (approval number: 2022268) in strict accordance with the Guide for the Care and Use of Laboratory Animals by the National Institutes of Health. The mice were randomly divided into three groups: control group, IgAN group, and artemisinin-treated group. The IgAN model was established as described previously:17 each mouse was gavaged with bovine serum albumin (BSA) 800 mg/kg every other day for 9 weeks; 0.1 mL of castor oil + CCl4 was injected subcutaneously in a 5:1 mixture once a week, while 0.06 mL was injected intraperitoneally once every two weeks; 50 μg of lipopolysaccharides (LPS) was injected into the tail vein of each mouse at weeks 6 and 8. For the artemisinin-treated group, each mouse was treated with 46.6 mg/kg artemisinin by gavage once a day for 8 weeks from week 10 onwards. Mice in the normal control group were given the same dose of saline. All mice were fed and watered freely. The above treatments were continued until the end of 17th week.
Sample Collection
Urine and blood samples were collected after 8 weeks of drug administration. Blood urea nitrogen (BUN), serum creatinine (SCr), and urinary albumin creatinine ratio (UACR) were measured with commercial kits. The kidney was rapidly separated and then placed in liquid nitrogen for kit assay. Malondialdehyde levels in kidney were measured with commercial kits. The rest of the kidney was immersed into 4% paraformaldehyde for histological analysis.
Periodic Acid-Schiff Staining
Kidney tissues were fixed in 4% paraformaldehyde for 48 h. After dehydration, tissues were embedded in paraffin, and cut into 5μm sections. Next, these sections were deparaffinized, hydrated, and then stained with periodic acid-Schiff (PAS). The sections were observed under a light microscopy (Nikon, Japan).
IgA Immunofluorescence
Eight-micrometer frozen sections were prepared and fixed with cold acetone for 5 min. Tissue sections were then incubated with anti-IgA (1:100) and visualized using a fluorescence microscope (Nikon, Japan).
Real-Time PCR
Total RNA was isolated from tissues and cell lines by Trizol (Takara, Dalian, China) according to the protocol supplied by the manufacturers. Takara RNA PCR 3.0 Kit was used to perform RT-PCR. (Takara, Dalian, China). Quantitative real-time PCR was performed using Bio-Rad CFX96 system. RPS17 was used as an internal control. Gene expression was quantified by the comparative CT method, normalizing CT values to RPS17 and calculating relative expression values. Sequences of the primers used for PCR are shown in Table 1.
 |
Table 1 Primers Used in the Experiments |
Cytotoxicity Assay
The cells were inoculated in 96-well cell culture plates in appropriate quantities. After 24 h of incubation with the different concentrations of ART (Selleck, China), 10 μL CCK8 reagent (Biosharp, China) was added to each well. The plate was incubated for 4 h at 37°C in a CO2 incubator. The optical density (OD) of each well at 450 nm was measured by a Microplate Reader (BIOTEK, USA).
Reactive Oxygen Species (ROS) Assay
Cells were inoculated in appropriate numbers in 6-well cell culture plates. About 1μg/mL LPS was incubated for 24 h with or without the addition of artemisinin pretreated for 2 h. Intracellular ROS was evaluated by flow cytometry according to the manufacturer’s protocols.
Western Blotting
Nuclear and Cytoplasmic Extraction Reagents (Beyotime, Shanghai, China) were used for nuclear-cytoplasm separation. Protein samples were separated by were subjected to a 12% sodium dodecyl sulfate (SDS)/acrylamide gel. The proteins on acrylamide gel were transferred to a nylon membrane, which was blocked overnight. And they were respectively incubated with anti-AKT, anti-phosphorylated AKT and anti-Nrf2, then incubated with the corresponding HRP-coupled secondary antibodies. The gene Tubulin and lamin B were used as an internal control. Finally, blots were visualized with an enhanced chemiluminescence reagent (Beyotime, Shanghai, China) and analyzed with Image J software.
Nrf2 Immunofluorescence of Mesangial Cells
The cell climbing slices were incubated with primary antibody (anti-Nrf2, 1:100) and then with the corresponding secondary antibody. Then they were stained with 4,6-diamidino-2-phenylindole (DAPI) and visualized using a fluorescence microscope (Nikon, Japan).
Statistical Analysis
We used Prism 8 software for statistical analysis of the data. The presentation was in the form of mean (x) ± standard deviation (SD). Multiple samples were compared using ANOVA, and differences were considered statistically significant at P < 0.05 with a chi-square test level of 0.1.
Results
Prediction of the Therapeutic Effect of Artemisinin for IgAN
After excluding the invalid genes or genes not used in query, 89 significantly upregulated genes and 150 significantly downregulated genes with the highest |log2FC| value (Supplementary Tables 1 and 2) were uploaded to CMap database. There are 136,460 instances with normalized connective scores (NCS), and 29,679 compounds were screened in the output among which the four NCSs of artemisinin are −1.35, −1.15, −0.88 and −0.86 (Figure 2B). Negative values of NCSs indicate that artemisinin may reverse the expression of differentially expressed genes in IgA nephropathy.
Potential Targets of Artemisinin Against IgAN and PPI Network
For further studying the mechanism of artemisinin against IgAN, 311 targets of artemisinin and 1122 targets of IgAN were identified. Venn diagram identified 87 potential targets of artemisinin associated with IgAN (Figure 3A).
 |
Figure 3 PPI network construction for the targets of artemisinin against IgAN. (A) The Venn diagram identified 87 overlapping targets. (B) PPI network of the potential targets against IgAN. Nodes represent targets, and lines represent interactions between two targets. The redder and larger the node were, the higher the degree was. The redder and wider the edge were, the higher the combined score was. |
Then we constructed a PPI network of these 87 targets to explore their relationship. There are 85 nodes and 984 edges in the PPI network (Figure 3B). Two targets were excluded because of their no interaction with other targets. ALB, VEGFA, AKT1, CASP3 and EGFR showed the top 5 high degree (Figure 4B), suggesting that they were especially important in this network.
 |
Figure 4 Crucial clusters and hub targets identification. (A) Three crucial clusters of the PPI using MCODE plugin, with the score below. (B) Top 15 hub genes were screened by CytoHubba plugin. The bar chart represents degree value, while the dot and line chart represents CytoHubba score of MCC methods. (C) Volcano Plot showed the expression level and P value of the hub genes in the gene set GSE93798. The arrows of AKT1 and SRC overlapped. |
Identification of Clusters and Hub Targets in PPI Network
With the standard of MCODE score not less than 4, three clusters were screened out (Figure 4A). The first cluster includes 26 nodes and 296 edges with the seed gene KDR, and these genes were enriched in negative regulation of apoptotic process and signal transduction. The second cluster includes 16 nodes and 36 edges with the seed gene XIAP and was enriched in response to hypoxia and pathways in cancer. The third cluster includes 5 nodes and 8 edges with the seed gene RBP4.
Next, top 15 hub genes were screened according to the rank of cytohubba score (Figure 4B). Interestingly, we found that in the cluster of these 15 genes, every degree is 14, which means they all interact with each other.
To investigate whether artemisinin could regulate the expression levels of hub genes in IgAN, we first evaluate the expression of hub genes in IgAN patient glomeruli samples setting normal samples as comparison. We found that the |Log2FC| values of hub genes were less than 1 even 0.5 except ALB (Figure 4C). The decrease of ALB in IgAN may be due to the renal injury, in accordance with a previous clinical study.18 The findings suggest that there may not be a remarkable change in the expression level of these genes during the progression of IgAN. Analogously, these hub genes targeted by artemisinin may not have a remarkable expression change against IgAN.
Functional Enrichment Analysis
To further analyze the mechanism of artemisinin against IgAN, functional enrichment analyses of GO and KEGG for 87 overlapping targets were carried out. The primary enriched GO biological process (BP) terms were response to wounding, response to reactive oxygen species, muscle cell proliferation, response to peptide, regulation of cytokine production, and regulation of kinase activity (Figure 5A). And the involved GO molecular function (MF) terms were mainly kinase binding, transmembrane receptor protein kinase activity, phosphatase binding, cytokine receptor binding, and serine-type peptidase activity (Figure 5B). As for GO cellular component (CC), we enriched the top terms: vesicle lumen, membrane raft, perinuclear region of cytoplasm, endocytic vesicle, and cell–cell junction (Figure 5C). Also, the primary enriched KEGG pathways were pathways in cancer, proteoglycans in cancer, fluid shear stress and atherosclerosis, tuberculosis, and Chagas disease (American trypanosomiasis) (Figure 5D). The KEGG pathways have little relation to IgAN. The combined analysis of MF and CC suggested that the crucial targets are mainly located in perinuclear region and involve in the regulation of kinases even kinases themselves, or signal translocation in and out to nuclear. Changes in gene expression levels are usually not required in these types of molecular regulation which is in accordance with the expression analysis above of hub genes.
 |
Figure 5 Enrichment analysis of potential targets. GO biological process (BP) (A), molecular function (MF) (B), cellular component (CC) (C) and KEGG pathway (D) enrichment analysis for potential targets of artemisinin against IgAN. (E) Compound-target-biological process interaction network. The green rhombus nodes indicate the top 10 biological processes, the blue circular nodes indicate 15 hub targets, the red rectangle node represents artemisinin. (F) The Sankey diagram showed the interaction and each count of 15 hub targets and 6 top biological processes. |
In particular, we focused on the enriched biological processes. And a compound-target-biological process interaction network between artemisinin, 15 hub targets, and top 10 biological processes was constructed (Figure 5E). For ease of further analysis, we defined 6 biological processes with the lowest p value as hub biological processes, and used Sankey diagram to show the interaction between 15 hub targets and 6 hub biological processes (Figure 5F). Regulation of kinase activity exhibited the highest counts of hub target connections (10), followed by response to wounding (9), and response to reactive oxygen species (7). SRC was enriched in most hub biological processes (5), followed by AKT1 (4) and EGFR (4). Although ALB had the highest degree in PPI network, it did not show any interaction with hub biological processes. Our findings indicated that there are numerous connections between hub targets and hub biological processes.
Response to Reactive Oxygen Species (ROS) is the Crucial Biological Process of Artemisinin Against IgAN
In order to screen the hub biological process that plays the most important role in the progression of IgAN, we performed gene set enrichment analysis (GSEA) of 6 hub biological processes in the gene set GSE93798. The NES of all biological processes was greater than 1, while only two of them had the nominal p-value less than 0.05 (response to reactive oxygen species and response to peptide) (Figure 6A). Among this two, response to reactive oxygen species (ROS) attracted our attention. Studies have shown that high levels of oxidative stress exist in both plasma19,20 and renal tissue especially mesangial cells21,22 of IgAN patients. Our GSEA analysis suggested a decreased reflection to oxidative stress and antioxidant capacity in the transcriptome of patients. Thus, the balance between ongoing oxidative stress and the antioxidant defense system is broken. Hence, we assumed that artemisinin may have the potential to alleviate IgAN by response to ROS and scavenging it. Next, we focused on the 20 targets enriched in response to ROS (Figure 6B and C). AKT1 got the highest degree in total targets, while CASP3 got the highest degree in the cluster. We overlapped the 15 hub targets with 20 targets response to ROS and finally screened 7 targets (AKT1, EGFR, CASP3, MMP9, SRC, HIF1A, MAPK1) for further analysis (Figure 6D).
 |
Figure 6 Response to ROS is the crucial biological process of artemisinin against IgAN. (A) Gene set enrichment analysis (GSEA) of 6 hub biological processes in GSE93798 (Normal versus disease). The color of each legend on the right consists with the biological process curve above. NES and nominal p-value are shown in the legend. (B) Total and internal degrees of all the targets involved in response to ROS. (C) Network of these enriched targets. The redder the node was, the higher the degree was. (D) The Venn diagram identified an overlap of 7 targets between the hub targets and targets response to ROS. |
Identification of AKT1 as the Core Target by Molecular Docking Simulation
We analyzed the binding affinity of 7 targets with artemisinin by molecular docking simulation. Results showed that the docking affinity scores of 6 targets were less than −7 kcal/mol except CASP3, indicating artemisinin have high affinities for these target proteins (Figure 7A, Table 2). AKT1 and EGFR had the lowest affinity score (−8.7 kcal/mol). In the 3D structure, both AKT1 (Figure 7B) and EGFR (Figure 7C) offered a suitable combination pocket for artemisinin. In the 2D interaction diagram, amino acid residue Asn54 of AKT1 was observed to interact with artemisinin through hydrogen bonding, and hydrophobic effect was observed between amino acid residues Gln79, Thr82, Ile84, Val270, Tyr272, Arg273, Asp274, and Gly294 of AKT1 with artemisinin (Figure 7D). Meanwhile, EGFR could interact with artemisinin through only hydrophobic effect of amino acid residues Leu718, Val726, Ala743, Met793, Gly796, Cys797, Leu844, and Phe997(Figure 7E). The 3D and 2D visualized results of the other 5 targets are shown in Supplementary Figure 1. Considering the exist of hydrogen bond, AKT1 was identified as the core target of artemisinin against IgAN. Studies showed that AKT signaling pathway can be activated by artemisinin and protected from oxidative damage.23,24 On the other hand, various downstream targets of AKT such as Nrf2 have antioxidative activities.25 Therefore, we suggested that artemisinin protects glomerulus from oxidative damage of IgAN via activation of AKT pathway.
 |
Table 2 The Binding Affinity of Artemisinin with Proteins |
 |
Figure 7 Molecular docking of targets with artemisinin. (A) The binding affinity of artemisinin docking with 7 targets. The redder the bar was, the lower the affinity was. 3D docking structure and interactions of artemisinin binding to AKT1 (B) and EGFR (C). 2D interaction diagrams of artemisinin docking with AKT1 (D) and EGFR (E). |
Artemisinin Alleviates Kidney Damage and Renal Pathological Changes in Mice
To evaluate the protective effect of artemisinin on the kidneys of mice with IgA nephropathy model, urine samples and blood samples were obtained from mice to detect the urinary albumin creatinine ratio (ACR), blood urea nitrogen (BUN), and serum creatinine (SCr). As shown in Figure 8A–C, the model group mice exhibited higher levels of ACR, BUN and SCr compared with the control group, the increase in those can be alleviated by artemisinin. In addition, IgA deposition in glomeruli, proliferation of glomerular mesangial cells and extracellular matrix were significantly increased in the model group mice compared with the control group, while artemisinin treatment significantly alleviated these changes (Figure 8D and E).
 |
Figure 8 Effects of Artemisinin on renal function related parameters and histopathological. (A) Urinary albumin creatinine ratio (ACR). (B) Serum creatinine. (C) Blood urea nitrogen (BUN). (D) IgA immunofluorescence of renal tissue. (E) PAS staining of renal tissue. White arrows indicate mesangial cell proliferation and extracellular matrix increase. (All data are presented as mean ± SD. ##p<0.01, ###p<0.001: compared with the control group; *p<0.05, **p <0.01: compared with the model group). |
Artemisinin Alleviates Oxidative Stress and Renal Extracellular Matrix Production in Mice
In order to further study the effect of artemisinin on oxidative stress, MDA levels in renal cortex were detected. The model group mice exhibited higher levels of MDA compared with the normal control group, but the MDA level of mice in the artemisinin-treated group was significantly decreased (Figure 9A). The PCR results showed that the expression levels of FN, LN, Col4, α-SMA and TGF-β genes in the kidney cortical tissues of mice in the model group were significantly higher than those in the control group. Meanwhile, the increase in those can be alleviated by artemisinin (Figure 9B).
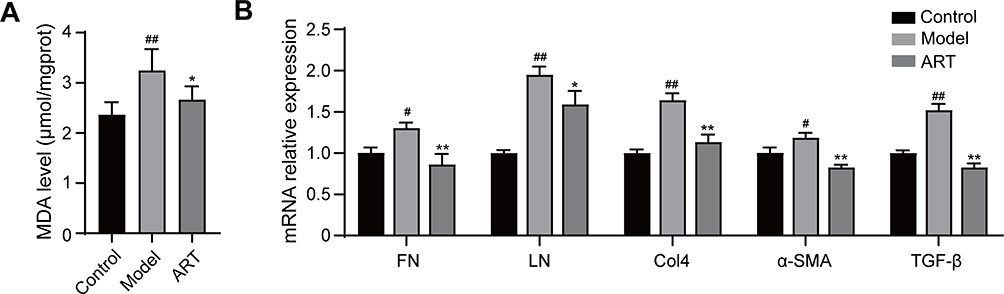 |
Figure 9 Artemisinin suppressed the production of Malondialdehyde and extracellular matrix in the renal cortex of mice. (A) Effect of artemisinin on Malondialdehyde (MDA). (B) Real-time PCR analysis was used to assess the mRNA levels of FN, LN, Col4, α-SMA and TGF-β. (All data are presented as mean ± SD. #p<0.05, ##p<0.01: compared with the control group; *p<0.05, **p<0.01: compared with the model group). |
Artemisinin Inhibits Oxidative Stress-Induced Extracellular Matrix Elevation in Mesangial Cells
Since the injury of mesangial cells is considered to be one of the key factors in the pathogenesis of glomerular disease. Therefore, we performed in vitro experiments using mesangial cells. Artemisinin at concentrations of 1.5 μM, 3 μM, 6 μM and 12 μM had no significant effect on cell viability, while cell viability decreased significantly at the concentration of 25 μM (Figure 10A). Artemisinin (12 μM, 2h) treatment significantly inhibited the LPS-induced increase in intracellular ROS (Figure 10B and C). Meanwhile, the cellular LN mRNA level was significantly increased in the LPS group compared with the control group, and there was a decreasing trend of FN, LN and Col4 mRNA in the artemisinin group, among which the LN mRNA expression was significantly different (Figure 10D).
 |
Figure 10 Artemisinin suppressed the production of reactive oxygen species and extracellular matrix of mesangial cells. (A) The viability of mesangial cells treated with artemisinin (0, 1.5, 3, 6.12, 25, 50 μM) was determined by Cell Counting Kit-8 assay. (B and C) Intracellular ROS was determined by flow cytometry assays. (D) Real-time PCR analysis was used to assess the mRNA levels of FN, LN, Col4. (All data are presented as mean ± SD. #p<0.05, ##p<0.01: compared with the control group; *p<0.05, **p<0.01: compared with the LPS group). |
Activation of AKT/Nrf2 Signaling Pathway by Artemisinin
Combined with the conclusions from network pharmacology and molecular docking, we further clarified whether artemisinin could act with AKT. As shown in Figure 11A and B, the expression level of p-AKT/AKT in mesangial cells increased significantly after artemisinin treatment compared with LPS group, indicating that artemisinin could activate the p-AKT in mesangial cells. Erythroid-derived nuclear factor 2-like protein 2 (Nrf2) is a core transcription factor that regulates the endogenous antioxidant signaling pathway in the body and can maintain the body’s redox homeostasis.26 Given that AKT is one of the protein kinases that activates Nrf2, the reversal of oxidative stress mediated by artemisinin through enhanced AKT activity may be mediated, at least in part, by increasing Nrf2 activity. Western blotting showed that artemisinin could promote the expression of Nrf2 in the nucleus of mesangial cells, and there was a concentration-dependent trend (Figure 11C–E). Immunofluorescence assay also showed that artemisinin could promote the translocation of Nrf2 into the nucleus, which was consistent with Western blotting results (Figure 11F).
 |
Figure 11 Artemisinin active AKT/Nrf2 pathway in mesangial cell. (A and B) Western blot analysis of p-AKT/AKT. (C–E) Western blot analysis of Nrf2 in cytoplasmic and nuclear. (F) Nrf2 Immunofluorescence of mesangial cells. (All data are presented as mean ± SD. #p<0.05, ##p<0.01: compared with the LPS group). |
Discussion
Studies have shown that markers of oxidative stress are elevated in the serum and renal tissues of patients with IgAN.27,28 Furthermore, elevated levels of oxidative stress have been associated with proteinuria and disease progression in patients with IgAN.24 In inflammatory states, glomerular production of excessive reactive oxygen species (ROS) leads to mesangial cell growth and extracellular matrix production,29,30 which ultimately leads to irreversible damage of the glomerular. Therefore, therapy targeting reactive oxygen species may be an effective strategy to prevent the progression of IgAN. Related studies have shown that artemisinin and its analogs can improve tissue damage by inhibiting oxidative stress.31 The renal protective effects of artemisinin have been gradually discovered in recent years.11,32,33 However, few articles have analyzed the mechanism of its treatment for IgA nephropathy. There is a lack of studies targeting on artemisinin for the treatment of IgA nephropathy.
In this study, we used CMap database to predict the therapeutic effect of artemisinin, and take the analysis method of network pharmacology to construct drug-target and disease-target networks. By evaluating the expression of 15 hub targets in transcriptome data, we speculated that there might be other biological process which these targets were involved in, such as epigenetic modifications, changes of the binding affinity to other proteins, changes in cell distribution, etc. It is not easy to analyze these effects from transcriptome data. Therefore, we decided to consider the mechanism of artemisinin against IgAN from the perspective of biological processes or signaling pathways by enrichment analysis and GSEA analysis. Then, we found that artemisinin may be involved in reaction to reactive oxygen species. We ultimately screened 7 targets overlapped by of the hub targets and targets involved in response to ROS. Then, we docked these 7 genes with artemisinin separately and found that AKT1 has the closest docking results. Additionally, the vast array of targets and pathways that were screened in this study may help to guide future research on ART for the treatment of IgAN.
For pharmacological testing, we constructed a mouse model of IgA nephropathy by LPS+BSA+CCl4. Proteinuria is an independent risk factor for the progression of IgAN. Reducing urinary protein is one of the key aspects for improving the prognosis of IgAN. In this study, the urinary ACR (evaluating the urinary protein level) and various indexes of renal function in mice were normalized after 8 weeks treatment with artemisinin. At the same time, the kidney tissues of mice treated with artemisinin showed weakly positive IgA immunofluorescence, and the renal pathological changes were reduced. It indicates that artemisinin can effectively reduce the kidney injury in IgAN mice. Moreover, the MDA level in the kidney tissue of mice in the IgAN model group was significantly increased, and artemisinin could significantly reverse this change, which indicating that artemisinin plays an important role in the progression of IgA nephropathy by inhibiting the activation of reactive oxygen species.
In recent years, the protective role of Nrf2 in renal diseases has been increasingly investigated, and activation of Nrf2 can improve the antioxidant and anti-inflammatory capacity of the body, thereby reducing cell or tissue damage.34,35 The AKT/Nrf2 signaling pathway is related to anti-oxidative stress36,37 and is a promising target for IgA nephropathy.38 In our present study, we found that artemisinin reduced ROS and extracellular matrix production in an LPS-induced inflammatory environment, which is consistent with Sun et al’s study.39 It indicates that artemisinin can alleviate oxidative stress as well as reduce the secretion of extracellular matrix caused by oxidative stress. The effect of artemisinin on the AKT/Nrf2 signaling pathway was verified in in vitro experiments. The results showed that the expression level of p-AKT/AKT was significantly increased in mesangial cells after artemisinin treatment, and the expression of Nrf2 in the nucleus was elevated in a concentration-dependent manner. Immunofluorescence results showed that the expression of Nrf2 in the nucleus was significantly enhanced. This finding indicated the activation of the AKT/Nrf2 signaling pathway by artemisinin (Figure 12).
 |
Figure 12 Artemisinin protects mesangial cells from oxidative damage of IgAN via activation of AKT/Nrf2 pathway. |
The study had some limitations. Firstly, the results that demonstrated the regulatory effect of artemisinin on the AKT/NRF2 signaling pathway were only verified by the cell experiment. Thus, further investigations should be explored through animal experiments. Secondly, we used a single dose of artemisinin in the study. Future studies should focus on the dose-dependent effects of artemisinin.
Conclusion
In summary, our study identified the potential core targets and underlying pharmacological mechanisms of artemisinin in the treatment of IgA nephropathy by applying bioinformatics, network pharmacology, molecular docking and experimental validation. Our study revealed artemisinin could lower fibrosis and oxidative stress in IgA nephropathy via the AKT/Nrf2 pathway, which provided an alternative treatment for IgAN. However, additional research is needed to corroborate these conclusions.
Abbreviation
AKT, RAC-alpha serine/threonine-protein kinase; ART, Artemisinin; BP, biological process; BUN, blood urea nitrogen; CC, cellular component; DEGs, differentially expressed genes; ESRD, end-stage renal disease; GEO, Gene Expression Omnibus; GO, gene ontology; GSEA, gene set enrichment analysis; IgAN, IgA nephropathy; KEGG, Kyoto Encyclopedia of Genes and Genomes; LPS, lipopolysaccharide; MDA, Malondialdehyde; MF, molecular function; NCS, normalized connective scores; Nrf2, Erythroid-derived nuclear factor 2-like protein 2; PAS, periodic acid-Schiff; PPI, protein–protein interaction; ROS, reactive oxygen species; RT-PCR, real-time quantitative polymerase-chain reaction; SCr, serum creatinine; TCM, traditional Chinese medicine; UACR, urinary albumin creatinine ratio.
Data Sharing Statement
The data sets presented in this study can be found in online repositories. The names of the repository/repositories and accession number(s) can be found in the article. Other data used to support the findings of this study are available from the corresponding author upon request.
Ethics Approval and Informed Consent
All animal use was approved by Institutional Animal Care and Use Committee (IACUC) of China Medical University (approval number: 2022268) in strict accordance with the Guide for the Care and Use of Laboratory Animals by the National Institutes of Health. The use of human data in GSE93798 was approved by the ethics committee of the First Affiliated Hospital of China Medical University (approval number: 202355).
Acknowledgments
We would like to thank Ang-ting Ke for his help in bioinformatics.
Funding
This study was supported by National Natural Science Foundation of China (81970617 and 81500525) and Natural Science Foundation of Liaoning Province (2019-MS-367).
Disclosure
The authors report no conflicts of interest in this work.
References
1. Berthoux FC, Mohey H, Afiani A. Natural history of primary IgA nephropathy. Semin Nephrol. 2008;28(1):4–9. doi:10.1016/j.semnephrol.2007.10.001
2. Schena FP, Nistor I. Epidemiology of IgA nephropathy: a global perspective. Semin Nephrol. 2018;38(5):435–442. doi:10.1016/j.semnephrol.2018.05.013
3. Hu Q, Jiang L, Yan Q, Zeng J, Ma X, Zhao Y. A natural products solution to diabetic nephropathy therapy. Pharmacol Ther. 2023;241:108314. doi:10.1016/j.pharmthera.2022.108314
4. Shahin DHH, Sultana R, Farooq J, et al. Insights into the uses of traditional plants for diabetes nephropathy: a review. Curr Issues Mol Biol. 2022;44(7):2887–2902. doi:10.3390/cimb44070199
5. Seikrit C, Stamellou E, Rauen T, Floege J. TESTING the effects of corticosteroids in patients with IgA nephropathy. Nephrol Dial Transplant. 2022;37(10):1786–1788. doi:10.1093/ndt/gfac221
6. Tang C, Lv JC, Shi SF, Chen YQ, Liu LJ, Zhang H. Long-term safety and efficacy of hydroxychloroquine in patients with IgA nephropathy: a single-center experience. J Nephrol. 2022;35(2):429–440. doi:10.1007/s40620-021-00988-1
7. Liu LJ, Yang YZ, Shi SF, et al. Effects of hydroxychloroquine on proteinuria in IgA nephropathy: a randomized controlled trial. Am J Kidney Dis. 2019;74(1):15–22. doi:10.1053/j.ajkd.2019.01.026
8. Bai L, Li J, Li H, et al. Renoprotective effects of artemisinin and hydroxychloroquine combination therapy on IgA nephropathy via suppressing NF-kappaB signaling and NLRP3 inflammasome activation by exosomes in rats. Biochem Pharmacol. 2019;169:113619. doi:10.1016/j.bcp.2019.08.021
9. Bai L, Li H, Li J, et al. Immunosuppressive effect of artemisinin and hydroxychloroquine combination therapy on IgA nephropathy via regulating the differentiation of CD4+ T cell subsets in rats. Int Immunopharmacol. 2019;70:313–323. doi:10.1016/j.intimp.2019.02.056
10. Xia M, Liu D, Liu Y, Liu H. The therapeutic effect of artemisinin and its derivatives in kidney disease. Front Pharmacol. 2020;11:380. doi:10.3389/fphar.2020.00380
11. Chen Y, Zheng S, Wang Z, et al. Artesunate restrains maturation of dendritic cells and ameliorates heart transplantation-induced acute rejection in mice through the PERK/ATF4/CHOP signaling pathway. Mediators Inflamm. 2021;2021:2481907. doi:10.1155/2021/2481907
12. Chen S, Wu L, He B, et al. Artemisinin facilitates motor function recovery by enhancing motoneuronal survival and axonal remyelination in rats following brachial plexus root avulsion. ACS Chem Neurosci. 2021;12(17):3148–3156. doi:10.1021/acschemneuro.1c00120
13. Huang XT, Liu W, Zhou Y, et al. Dihydroartemisinin attenuates lipopolysaccharide induced acute lung injury in mice by suppressing NFkappaB signaling in an Nrf2 dependent manner. Int J Mol Med. 2019;44(6):2213–2222. doi:10.3892/ijmm.2019.4387
14. Subramanian A, Narayan R, Corsello SM, et al. A next generation connectivity map: L1000 platform and the first 1,000,000 profiles. Cell. 2017;171(6):1437–1452 e1417. doi:10.1016/j.cell.2017.10.049
15. Chin CH, Chen SH, Wu HH, Ho CW, Ko MT, Lin CY. CytoHubba: identifying hub objects and sub-networks from complex interactome. BMC Syst Biol. 2014;8(Suppl 4):S11. doi:10.1186/1752-0509-8-S4-S11
16. Tripathi S, Pohl MO, Zhou Y, et al. Meta- and orthogonal integration of influenza “OMICs” data defines a role for UBR4 in virus budding. Cell Host Microbe. 2015;18(6):723–735. doi:10.1016/j.chom.2015.11.002
17. Meng T, Li X, Ao X, et al. Hemolytic Streptococcus may exacerbate kidney damage in IgA nephropathy through CCL20 response to the effect of Th17 cells. PLoS One. 2014;9(9):e108723. doi:10.1371/journal.pone.0108723
18. Li H, Lu W, Li H, et al. Immune characteristics of IgA nephropathy with minimal change disease. Front Pharmacol. 2021;12:793511. doi:10.3389/fphar.2021.793511
19. Camilla R, Suzuki H, Dapra V, et al. Oxidative stress and galactose-deficient IgA1 as markers of progression in IgA nephropathy. Clin J Am Soc Nephrol. 2011;6(8):1903–1911. doi:10.2215/CJN.11571210
20. Duni A, Liakopoulos V, Roumeliotis S, Peschos D, Dounousi E. Oxidative stress in the pathogenesis and evolution of chronic kidney disease: untangling ariadne’s thread. Int J Mol Sci. 2019;20(15):3711. doi:10.3390/ijms20153711
21. Suzuki D, Miyata T, Saotome N, et al. Immunohistochemical evidence for an increased oxidative stress and carbonyl modification of proteins in diabetic glomerular lesions. J Am Soc Nephrol. 1999;10(4):822–832. doi:10.1681/ASN.V104822
22. Chen HC, Guh JY, Chang JM, Lai YH. Differential effects of circulating IgA isolated from patients with IgA nephropathy on superoxide and fibronectin production of mesangial cells. Nephron. 2001;88(3):211–217. doi:10.1159/000045992
23. Liu L, Zhao X, Silva M, Li S, Xing X, Zheng W. Artemisinin protects motoneurons against axotomy-induced apoptosis through activation of the PKA-Akt signaling pathway and promotes neural stem/progenitor cells differentiation into NeuN(+) neurons. Pharmacol Res. 2020;159:105049. doi:10.1016/j.phrs.2020.105049
24. Wang P, Tian X, Tang J, et al. Artemisinin protects endothelial function and vasodilation from oxidative damage via activation of PI3K/Akt/eNOS pathway. Exp Gerontol. 2021;147:111270. doi:10.1016/j.exger.2021.111270
25. Li H, Tang Z, Chu P, et al. Neuroprotective effect of phosphocreatine on oxidative stress and mitochondrial dysfunction induced apoptosis in vitro and in vivo: involvement of dual PI3K/Akt and Nrf2/HO-1 pathways. Free Radic Biol Med. 2018;120:228–238. doi:10.1016/j.freeradbiomed.2018.03.014
26. Zhao K, Wen LB. DMF attenuates cisplatin-induced kidney injury via activating Nrf2 signaling pathway and inhibiting NF-kB signaling pathway. Eur Rev Med Pharmacol Sci. 2018;22(24):8924–8931. doi:10.26355/eurrev_201812_16662
27. Vas T, Wagner Z, Jenei V, et al. Oxidative stress and non-enzymatic glycation in IgA nephropathy. Clin Nephrol. 2005;64(5):343–351. doi:10.5414/CNP64343
28. Chen JX, Zhou JF, Shen HC. Oxidative stress and damage induced by abnormal free radical reactions and IgA nephropathy. J Zhejiang Univ Sci B. 2005;6(1):61–68. doi:10.1631/jzus.2005.B0061
29. Pfeilschifter J. Cross-talk between transmembrane signalling systems: a prerequisite for the delicate regulation of glomerular haemodynamics by mesangial cells. Eur J Clin Invest. 1989;19(4):347–361. doi:10.1111/j.1365-2362.1989.tb00241.x
30. Schlondorff D, Banas B. The mesangial cell revisited: no cell is an island. J Am Soc Nephrol. 2009;20(6):1179–1187. doi:10.1681/ASN.2008050549
31. Pan K, Lu J, Song Y. Artesunate ameliorates cigarette smoke-induced airway remodelling via PPAR-gamma/TGF-beta1/Smad2/3 signalling pathway. Respir Res. 2021;22(1):91. doi:10.1186/s12931-021-01687-y
32. Zhang H, Qi S, Song Y, Ling C. Artemisinin attenuates early renal damage on diabetic nephropathy rats through suppressing TGF-beta1 regulator and activating the Nrf2 signaling pathway. Life Sci. 2020;256:117966. doi:10.1016/j.lfs.2020.117966
33. Diao L, Tao J, Wang Y, Hu Y, He W. Co-delivery of dihydroartemisinin and HMGB1 siRNA by TAT-modified cationic liposomes through the TLR4 signaling pathway for treatment of lupus nephritis. Int J Nanomedicine. 2019;14:8627–8645. doi:10.2147/IJN.S220754
34. Antar SA, Abdo W, Taha RS, et al. Telmisartan attenuates diabetic nephropathy by mitigating oxidative stress and inflammation, and upregulating Nrf2/HO-1 signaling in diabetic rats. Life Sci. 2022;291:120260. doi:10.1016/j.lfs.2021.120260
35. Mohany M, Ahmed MM, Al-Rejaie SS. Molecular mechanistic pathways targeted by natural antioxidants in the prevention and treatment of chronic kidney disease. Antioxidants. 2021;11(1):15.
36. Duan H, Li M, Liu J, et al. An integrated approach based on network analysis combined with experimental verification reveals PI3K/Akt/Nrf2 signaling is an important way for the anti-myocardial ischemia activity of Yi-Qi-Tong-Luo capsule. Front Pharmacol. 2022;13:794528. doi:10.3389/fphar.2022.794528
37. Ding H, Li Z, Li X, et al. FTO alleviates CdCl2-induced apoptosis and oxidative stress via the AKT/Nrf2 pathway in bovine granulosa cells. Int J Mol Sci. 2022;23(9):4948. doi:10.3390/ijms23094948
38. Wu MY, Chen CS, Yiang GT, et al. The emerging role of pathogenesis of IgA nephropathy. J Clin Med. 2018;7(8):225. doi:10.3390/jcm7080225
39. Sun Z, Ma Y, Chen F, Wang S, Chen B, Shi J. Artesunate ameliorates high glucose-induced rat glomerular mesangial cell injury by suppressing the TLR4/NF-kappaB/NLRP3 inflammasome pathway. Chem Biol Interact. 2018;293:11–19. doi:10.1016/j.cbi.2018.07.011
 © 2023 The Author(s). This work is published and licensed by Dove Medical Press Limited. The full terms of this license are available at https://www.dovepress.com/terms.php and incorporate the Creative Commons Attribution - Non Commercial (unported, v3.0) License.
By accessing the work you hereby accept the Terms. Non-commercial uses of the work are permitted without any further permission from Dove Medical Press Limited, provided the work is properly attributed. For permission for commercial use of this work, please see paragraphs 4.2 and 5 of our Terms.
© 2023 The Author(s). This work is published and licensed by Dove Medical Press Limited. The full terms of this license are available at https://www.dovepress.com/terms.php and incorporate the Creative Commons Attribution - Non Commercial (unported, v3.0) License.
By accessing the work you hereby accept the Terms. Non-commercial uses of the work are permitted without any further permission from Dove Medical Press Limited, provided the work is properly attributed. For permission for commercial use of this work, please see paragraphs 4.2 and 5 of our Terms.