Back to Journals » Nature and Science of Sleep » Volume 17

Explainable Machine Learning Assists in Revealing Associations Between Polysomnographic Biomarkers and Incident Type 2 Diabetes in Men
Authors Nguyen DP ![]() , Catcheside P, Lechat B
, Catcheside P, Lechat B ![]() , Wittert G, Vakulin A, Adams R
, Wittert G, Vakulin A, Adams R ![]() , Appleton SL
, Appleton SL ![]()
Received 17 December 2024
Accepted for publication 18 July 2025
Published 30 August 2025 Volume 2025:17 Pages 2013—2025
DOI https://doi.org/10.2147/NSS.S512262
Checked for plagiarism Yes
Review by Single anonymous peer review
Peer reviewer comments 2
Editor who approved publication: Prof. Dr. Ahmed BaHammam
Duc Phuc Nguyen,1 Peter Catcheside,1 Bastien Lechat,1 Gary Wittert,2 Andrew Vakulin,1 Robert Adams,1,3 Sarah L Appleton1,2
1Flinders Health and Medical Research Institute-– Sleep Health (Adelaide Institute for Sleep Health), College of Medicine and Public Health, Flinders University, Bedford Park, SA, 5042, Australia; 2Freemasons Centre for Male Health and Wellbeing, Level 7, South Australian Health and Medical Research Institute (SAHMRI), Faculty of Health and Medical Sciences, The University of Adelaide, Adelaide, SA, 5005, Australia; 3Respiratory and Sleep Service, Southern Adelaide Local Health Network, SA Health, Adelaide, SA, Australia
Correspondence: Duc Phuc Nguyen, Flinders Health and Medical Research Institute-– Sleep Health (Adelaide Institute for Sleep Health), College of Medicine and Public Health, Flinders University, Bedford Park, SA, 5042, Australia, Email [email protected]
Introduction: Type 2 diabetes (T2D) shows bidirectional relationships with polysomnographic measures. However, no studies have searched systematically for novel polysomnographic biomarkers of T2D. We therefore investigated if state-of-the-art explainable machine learning (ML) models could identify new polysomnographic biomarkers predictive of incident T2D.
Methods: We applied explainable ML models to longitudinal cohort study data from 536 males who were free of T2D at baseline and identified 52 cases of T2D at follow-up (mean 8.3, range 3.5– 10.5 years). Beyond ranking biomarker importance, we explored how the explainable ML model approach can identify novel relationships, assist in hypothesis testing, and provide insights into risk factors.
Results: The top five most predictive biomarkers included waist circumference, glucose, and three novel sleep biomarkers: the number of 3% desaturations in non-supine sleep, mean heart rate in supine sleep, and mean hypopnea duration. Explainable machine learning identified a significant association between the number of non-supine desaturation events (threshold of 19 events) and incident T2D (Odds ratio = 2.4 [95% CI 1.2– 4.8], P = 0.013). No significant associations were found using continuous or quartiled versions of non-supine desaturation. Additionally, the model provided an individualized risk factor breakdown, supporting a more personalized approach to precision sleep medicine.
Conclusion: Explainable ML supports the role of established biomarkers and reveals novel biomarkers of T2D likely to help guide further hypothesis testing and validation of more robust and clinically useful biomarkers. Although further validation is needed, these proof-of-concept data support the benefits of explainable ML in prospective data analysis.
Keywords: explainable machine learning, type 2 diabetes, polysomnographic biomarkers, obstructive sleep apnoea
Introduction
Obstructive sleep apnoea (OSA) and type 2 diabetes (T2D) show bidirectional relationships that potentially exacerbate each other’s effects on overall health.1,2 Although the pathophysiological mechanisms linking OSA and diabetes are not fully understood, chronic intermittent hypoxia, inflammation, sleep fragmentation and increased sympathetic drive could potentially all contribute to dysregulation of glucose metabolism.1,3,4
The relationship between OSA severity and T2D has been studied extensively and multiple OSA severity markers derived from polysomnography have been found to be associated with prevalence and incidence of T2D. For example, the apnoea hypopnea index (AHI), a frequency count of respiratory airflow reduction (hypopnea) or complete cessation (apnoea) due to upper airway collapse during sleep and the most common index for quantifying OSA severity, has shown modest associations of moderate-severe with incident diabetes.1,5–8 However, we and others have reported no association of OSA severity based on the AHI with diabetes incidence.9–11 Other markers related to OSA severity and polysomnographic measures also shown to be associated with T2D include oxygen saturation metrics,5,9,10,12 AHI in rapid eye movement (REM),13 time spent in REM sleep14 and total sleep time.5 AHI in rapid eye movement (REM) sleep has been associated with glycaemic control in diabetes13 and insulin resistance.15 Previous studies only have focused on the association between limited markers of OSA severity and type 2 diabetes, with no systematic search or cross-validation of the best biomarkers. Additionally, traditional statistical models constrained by underlying assumptions regarding linear relationships, distribution shapes and model structures may mask potentially complex effects of biomarkers that may interact with other variables. For example, relationships between biomarkers and multiple outcomes may not be linear and may be co-dependent on other variables such as gender, body habitus and potentially a wide range of inter-related variables. Applying arbitrary cutoffs for biomarkers to help address potential nonlinear effects is unlikely to fully resolve this issue. These gaps in the literature underscore the need for new approaches that can systematically test for more complex non-linear and co-dependent relationships between variables to help reveal and rank the most important biomarkers to overcome the key limitations with traditional statistical models.
Explainable machine learning (ML) has the potential to systematically discover novel biomarkers, as it has demonstrated its power in drug discovery,16 critical illness,17 mental health18 and hypertension in OSA.19 In contrast to traditional ML approaches where the accuracy of prediction is the main priority, explainable ML focuses on both the accuracy and the transparency of how the model predicts the outcome. This transparency is completed by comprehensively looking into individual predictions (local explanations) to understand the global behavior of the ML model.20 This state-of-the-art explainable ML goes further than traditional ML by revealing not only the importance of the biomarkers but also the nature and direction of the relationship between the biomarker and the outcome. This makes it particularly suitable for medical applications where a greater understanding of causal relationships and predictive power are typically of primary interest.
This study aims to investigate whether state-of-the-art explainable ML models can provide deeper insights into the relationship between polysomnographic features and the development of type 2 diabetes (T2D). The focus is threefold: first, to rank the importance of individual biomarkers; second, to move beyond ranking and explore how explainable ML can uncover novel relationships between sleep physiology and T2D risk; and third, to support hypothesis testing by offering interpretable insights into potential risk factors. The overall study design is shown in Figure 1.
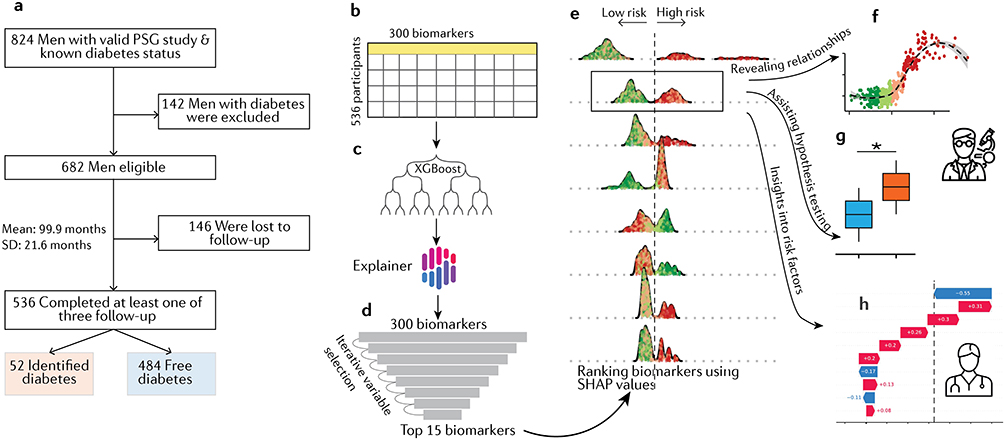 |
Figure 1 Schematic demonstrating data-driven approaches for exploring the association between sleep biomarkers and type 2 diabetes. (a) Flow diagram of the study and follow-up assessments. (b) Biomarkers and features from different domains including sleep, breathing disorders, and demographics were extracted to input into the XGBoost machine learning model. (c) The trained model was passed through the AI Explainer framework for estimating the relative importance of biomarkers based on Shapley values. (d) The least important biomarker was removed from the data, and this process repeated until the top 15 most important biomarkers were found (d and e). (e) The output of the explainable ML model was used to reveal novel biomarkers (f), assist hypothesis testing (g), and gain insights into risk factors and assist treatment approaches (h). |
Methods
Data Collection
Approval for the conduct of these Men Androgens Inflammation Lifestyles Environment and Stress (MAILES) study assessments was provided by the Central Adelaide Local Health Network Human Research Ethics Committee, with approval numbers 02305H, 2010054, HREC/17/TQEH/74, HREC/15/TQEH/127 and H-2020-109. This study complied with the Declarations of Helsinki. All participants provided signed consent for participation in all stages of data collection. All data used in this report was de-identified. Detailed data collection methods for the MAILES baseline have previously been reported.21 Briefly, participants underwent clinical assessment (including anthropometry, sphygmomanometry, a fasting blood sample was drawn) and completed questionnaires regarding sociodemographics, doctor-diagnosed medical conditions, chronic disease risk factors, and medication use, The polysomnography (PSG) sub-study methodology [8-channel in-home unattended polysomnography (Embletta X100, Embla Systems, Colorado) measuring EEG, EOG, EMG, nasal pressure, thoracic and abdominal effort, oximetry, body position, and limb movements] is previously described.22 Briefly, the final number of participants included in this study was 536 (52 with incident diabetes vs 484 free of diabetes at the follow-up assessment, Figure 1a).
Outcomes and Biomarkers
As previously described,10 participants with pre-existing diabetes identified during the 2007–10 clinical assessments were excluded from the present analyses based on criteria including self-reported doctor-diagnosed diabetes, fasting plasma glucose ≥7.0 mmol/L, glycated haemoglobin (HbA1c) ≥6.5%, or use of diabetes medications. In those free of diabetes at baseline, participation in the three follow-up assessments after the PSG sub-study was used to ascertain incident diabetes as illustrated in Figure 1a. Incident cases were identified through one or more of the following measures:
- Postal survey in 2015–16: self-report of doctor-diagnosed diabetes or use of diabetes medications.
- Clinical follow-up from June 2018 to March 2020: self-report of doctor-diagnosed diabetes, use of diabetes medications, fasting plasma glucose ≥7.0 mmol/L or non-fasting plasma glucose ≥11.0 mmol/L, and glycated haemoglobin (HbA1c) ≥6.5%.
- Postal survey in October 2020 to January 2021: self-report of doctor-diagnosed diabetes or use of diabetes medications.
The study identified T2D cases using a combination of standard clinical diagnostics and self-reported data. Of the 52 incident cases of diabetes, 18 (35%) were identified with an elevated plasma glucose or HbA1c at the second follow-up in 2018–20. Self-reported doctor diagnosed diabetes has been shown to be valid23 and captures diabetes that is controlled through diet or medication use.
No data cleaning procedures were applied to this dataset for the current study. A full list of biomarkers was shown in Supplementary Table S1.
Machine Learning Model
We used the XGBoost machine learning model24 to predict the incidence of type 2 diabetes (Figure 1b and c). XGBoost was chosen because it outperforms other ML models, particularly for tabular data, and requires less tuning.25 This is important as it significantly reduces the computational time required for iterative feature selection in this study to address multicollinearity. Model hyperparameters, such as maximum depth and learning rate, were determined through five-fold cross-validation. The final values selected were a max_depth of 16 and a learning_rate of 0.23. Additionally, to address the imbalance in the number of incident type 2 diabetes cases (52 vs 484), we applied a weight to the positive class using scale_pos_weight = 9. Imbalanced data were handled by assigning a higher weight to the minority (positive) class in the loss function.26 This ensures that misclassified rare events are penalized more heavily, helping the model focus on them. This approach does not require a resampling method, making it suitable for the XGBoost model.27
Local Explanation and Shapley Values
In our study, the output of the XGBoost model represents the log odds of a participant developing type 2 diabetes. While the XGBoost model provides a final output, its decision-making process is opaque. To gain insight into how each biomarker contributes to the model output, we used TreeExplainer20 to compute Shapley values, a parameter from game theory used to infer the contribution of each feature to the outcome (Figure 1c). These Shapley values were calculated for each participant based on their biomarker values. Shapley values assess all possible combinations of biomarkers and quantify each biomarker’s marginal contribution by measuring how the prediction changes when a feature is included or excluded. Since computing Shapley values is computationally expensive, we used TreeExplainer to approximate them,20 making the approach feasible for datasets with a large number of features and complex models. Since the output of the XGBoost model is in log odds, the Shapley values in our study represent the change in log odds of incident diabetes.
We ranked the importance of each feature by calculating the mean absolute value of the Shapley values for each biomarker. Higher values indicate more important biomarkers (Figure 1d and e). Additionally, by examining individual Shapley values for each feature, we can clearly examine the contribution of each biomarker to the final prediction for a specific participant (Figure 1f–h).
Iterative Feature Selection
We used an iterative process to rank the importance of biomarkers. In the iterative feature selection process [1], the XGBoost model was initially trained on all 299 features (N), and feature importance was ranked using Shapley values. The least important feature was then removed, and the model was retrained with the remaining N-1 features. This process was repeated iteratively, removing the least important feature at each step and retraining model, until only 15 features remained, ranked from highest to lowest importance. The issue with correlated features is that they tend to underestimate each other’s contribution when included together in a machine learning model. If all correlated features are removed at once, it can result in the complete elimination of important variables. In contrast, the iterative process eliminates only one correlated feature at a time and reassesses the importance of the remaining features by retraining the model. This allows for a systematic reassessment of the contribution of each feature, reducing the impact of multicollinearity, particularly in high-dimensional datasets.28
Statistical Analysis
Traditional statistical models with adjusted factors were used to demonstrate the utility of explainable ML in assisting hypothesis testing. The adjusted model also aimed to help further test the reliability of the ML model in extracting independent predictors of T2D. We utilized logistic regression to examine the relationship between novel biomarkers and the incidence of diabetes. Our model included covariates of age, glucose concentration, testosterone levels, and waist circumference at baseline. To automatically address potential nonlinear relationships between these covariates and the outcome, we employed a generalized additive model (GAM),29 where the covariates are modeled as smooth functions. However, the independent variables in our study were assumed to be linear. The detailed equations of the models are as follows:
Model 1

Model 2

Model 3

Model 4

In which,  is a logit function,
  is the intercept and
  is a spline function to account for nonlinear relationships. Ndesat is the continuous number of nonsupine desaturation events ≥3%. Ndesat_4categories is four quartile categories. Ndesat_2categories is a categorical variable determined by applying the explainable ML threshold. Similarly, HR_2categores and Hypopnea duration_2categories are categorical variables determined using application of each explainable ML threshold.
Results
Participants in the longitudinal study, who underwent 8 channel home-based polysomnography in 2010–11 (n=824) and were free of diabetes at baseline (n=682) were eligible for inclusion in the analysis. Of these, 78.6% (n=536) completed at least one follow-up assessment, between 2015 and 2021. A total of 536 participants (52 diabetes cases) were included in the analysis (Figure 1a). Demographic, health, and polysomnographic characteristics of the sample overall are shown in Table 1. The cohort comprised of middle aged and older men (aged 41.6–87.2 years) of who 82% reported post high school education. Participants had high rates of overweight or obesity (79.2% with BMI ≥25.0), hypertension and poor sleep quality. At least mild OSA (AHI≥10/hr) was present in 49.8%, and severe OSA, (AHI ≥30/hr) was present in 9.6%.
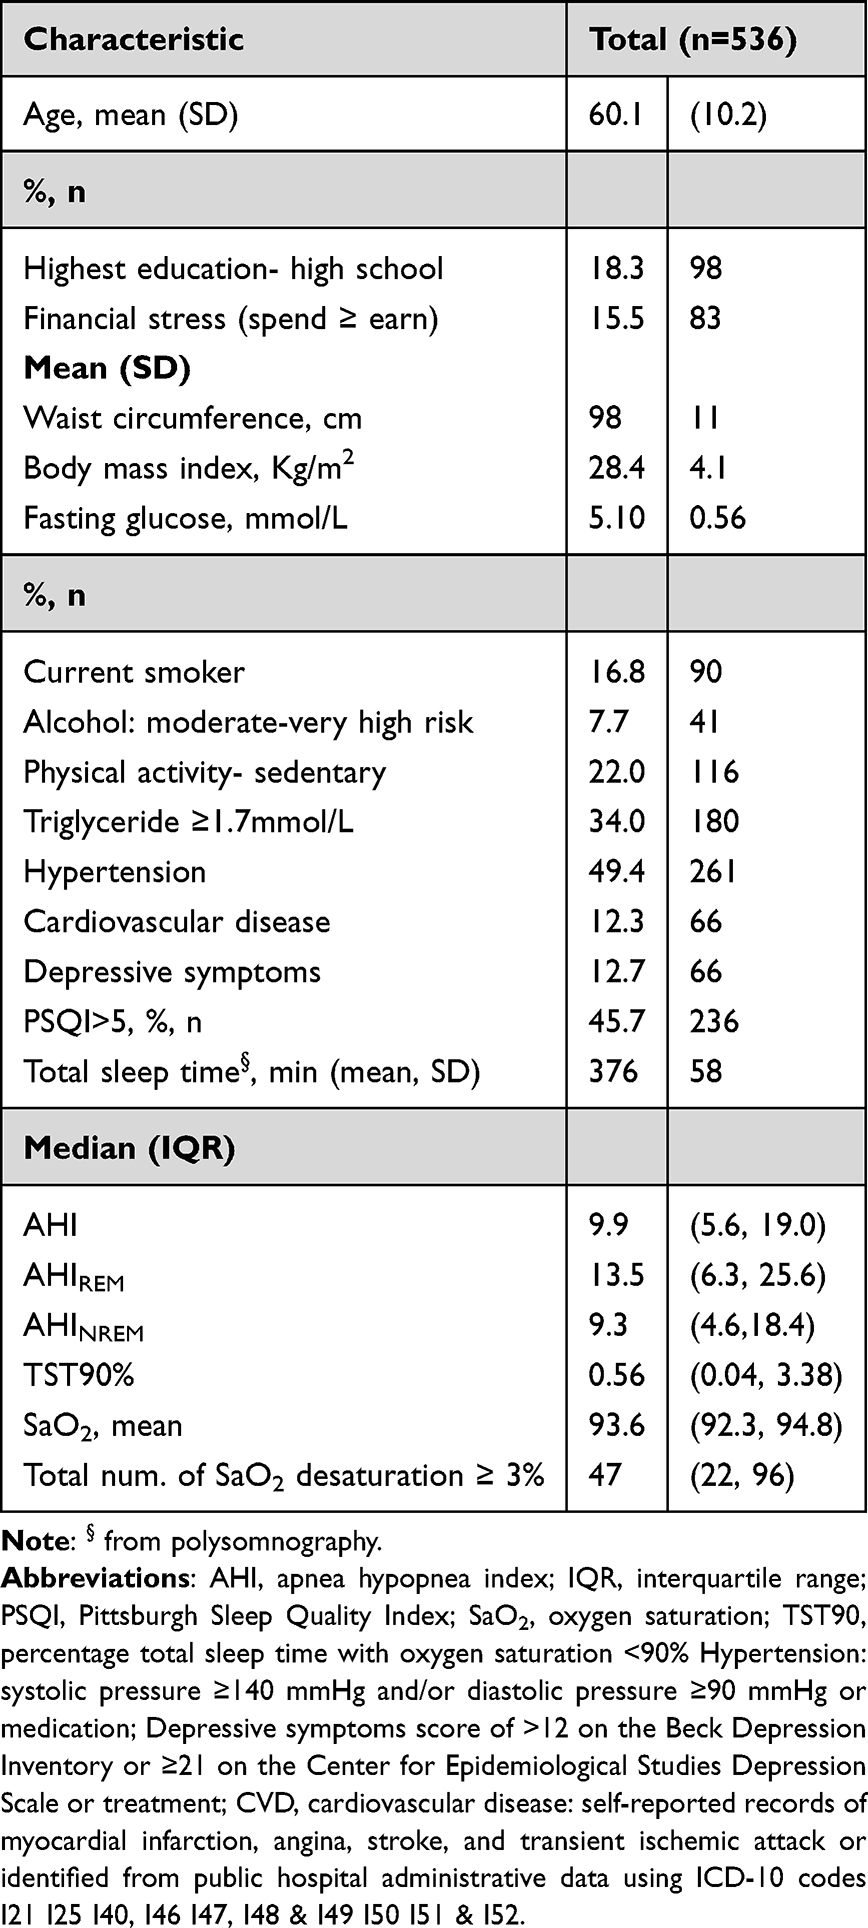 |
Table 1 Demographic, Health, and Polysomnographic Characteristics of the Sample Overall and in Relation to OSA Severity |
Discovery of Novel Biomarkers
As expected, the strongest biomarker associated with the incidence of T2D was baseline plasma glucose concentration (Figure 2a). Among the top five most predictive biomarkers, apart from glucose and waist circumference, we identified three novel biomarkers including the total number of 3% desaturations in non-supine sleep, mean heart rate (HR) in the supine position, and mean duration of hypopnea. In the top 15 biomarkers, we also identified baseline glycated haemoglobin (HbA1c), and testosterone level. Other novel biomarkers not previously reported in the literature also emerged across various domains, including descriptive measures of sleep (ie, total sleep time, sleep on the left side), sleep breathing disorder (snoring), and oxygen saturation metrics (ie, mean SaO2 levels in REM sleep and wake). Traditional AHI was ranked in 81st. The full list of biomarkers ranked from most to least important is shown in Supplementary Table S1.
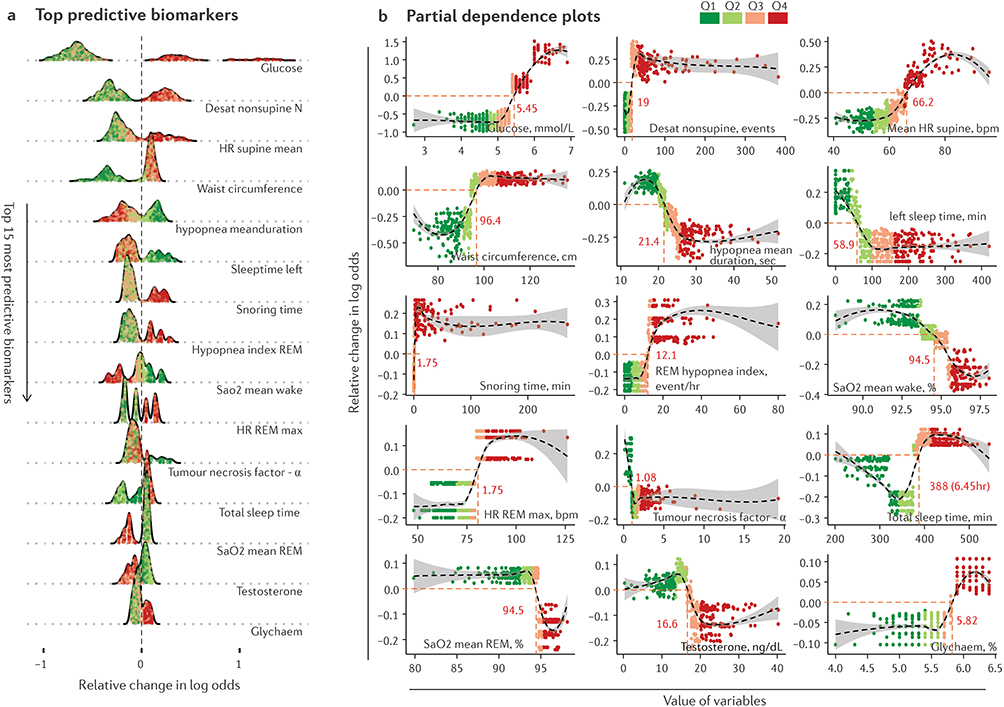 |
Figure 2 Explainable ML reveals novel biomarkers associated with diabetes. (a) Top 15 strongest biomarkers associated with incident T2D. The ranking is based on the mean absolute Shapley values (see Methods for details). Colors indicate the values of biomarkers categorized into four quartiles. A positive change in log odds indicates a higher risk of T2D. (b) The relationship between the top 15 biomarkers and the risk of T2D. The change in log odds is indicated on the y-axis, while the change in biomarker values is shown on the x-axis. The black dashed lines represent smooth curves across the data points to illustrate the overall shape of the relationship. Dot points indicate data from 536 participants. |
Relationship Between Top Biomarkers and Diabetes
To explore the direction and shape of relationships between the top biomarkers associated with T2D risk, we used partial dependence plots, where the relative change in log odds of incident diabetes is plotted against the range of values of a given biomarker (Figure 2b). Among the top five biomarkers, for example, we observed a sigmoid-shaped relationship between glucose concentration levels, mean HR in the supine position, and mean hypopnea duration. The number of non-supine SaO2 desaturations and waist circumference exhibited more distinct step changes indicative of a strong threshold of risk. As shown in Figure 2b, specifically, by utilizing the zero crossing of log odds change, we determined the threshold for non-supine SaO2 desaturation as 19 events and a male waist circumference of 96.4 cm. Incident diabetes was associated with shorter hypopnea duration and lower SaO2 levels in wake or REM sleep while a typical U-shaped relationship with total sleep time was also evident (Figure 2b). Higher testosterone levels were associated with lower T2D risk compared to lower testosterone levels.
Explainable Machine Learning to Assist Incident T2D Prediction
We further investigated if explainable ML could be useful to predict future incident T2D. Specifically, we tested the statistical significance of novel biomarkers to predict incident T2D onset using a logistic regression model adjusted for age, serum glucose and testosterone concentrations and waist circumference measured at baseline (see Methods for details). Model 1, which used the continuous value of non-supine SaO2 desaturation events at baseline to predict future incident T2D, failed to reject the null hypothesis (Table 2). This is expected as the relationship between the biomarkers and risk is nonlinear as observed in Figure 2b. To help deal with nonlinear relationships, we applied a traditional approach to categorize continuous values into quartiles (Model 2). However, model 2 also failed to reject the null hypothesis (Table 2). We further performed Model 3, where non-supine desaturation events were categorized based on the threshold identified by explainable ML (≥19 events) as shown in Figure 2b. The model showed a strong association between the number of desaturation events and incident T2D (Odds ratio = 2.41 [95% CI 1.20 to 4.82], P-value = 0.013, Table 1). We finally added mean HR in REM sleep and mean hypopnea duration as categorized using the identified thresholds in Figure 2b, which all showed better model fits and strong associations of these novel biomarkers with incident diabetes (Model 4, Table 2).
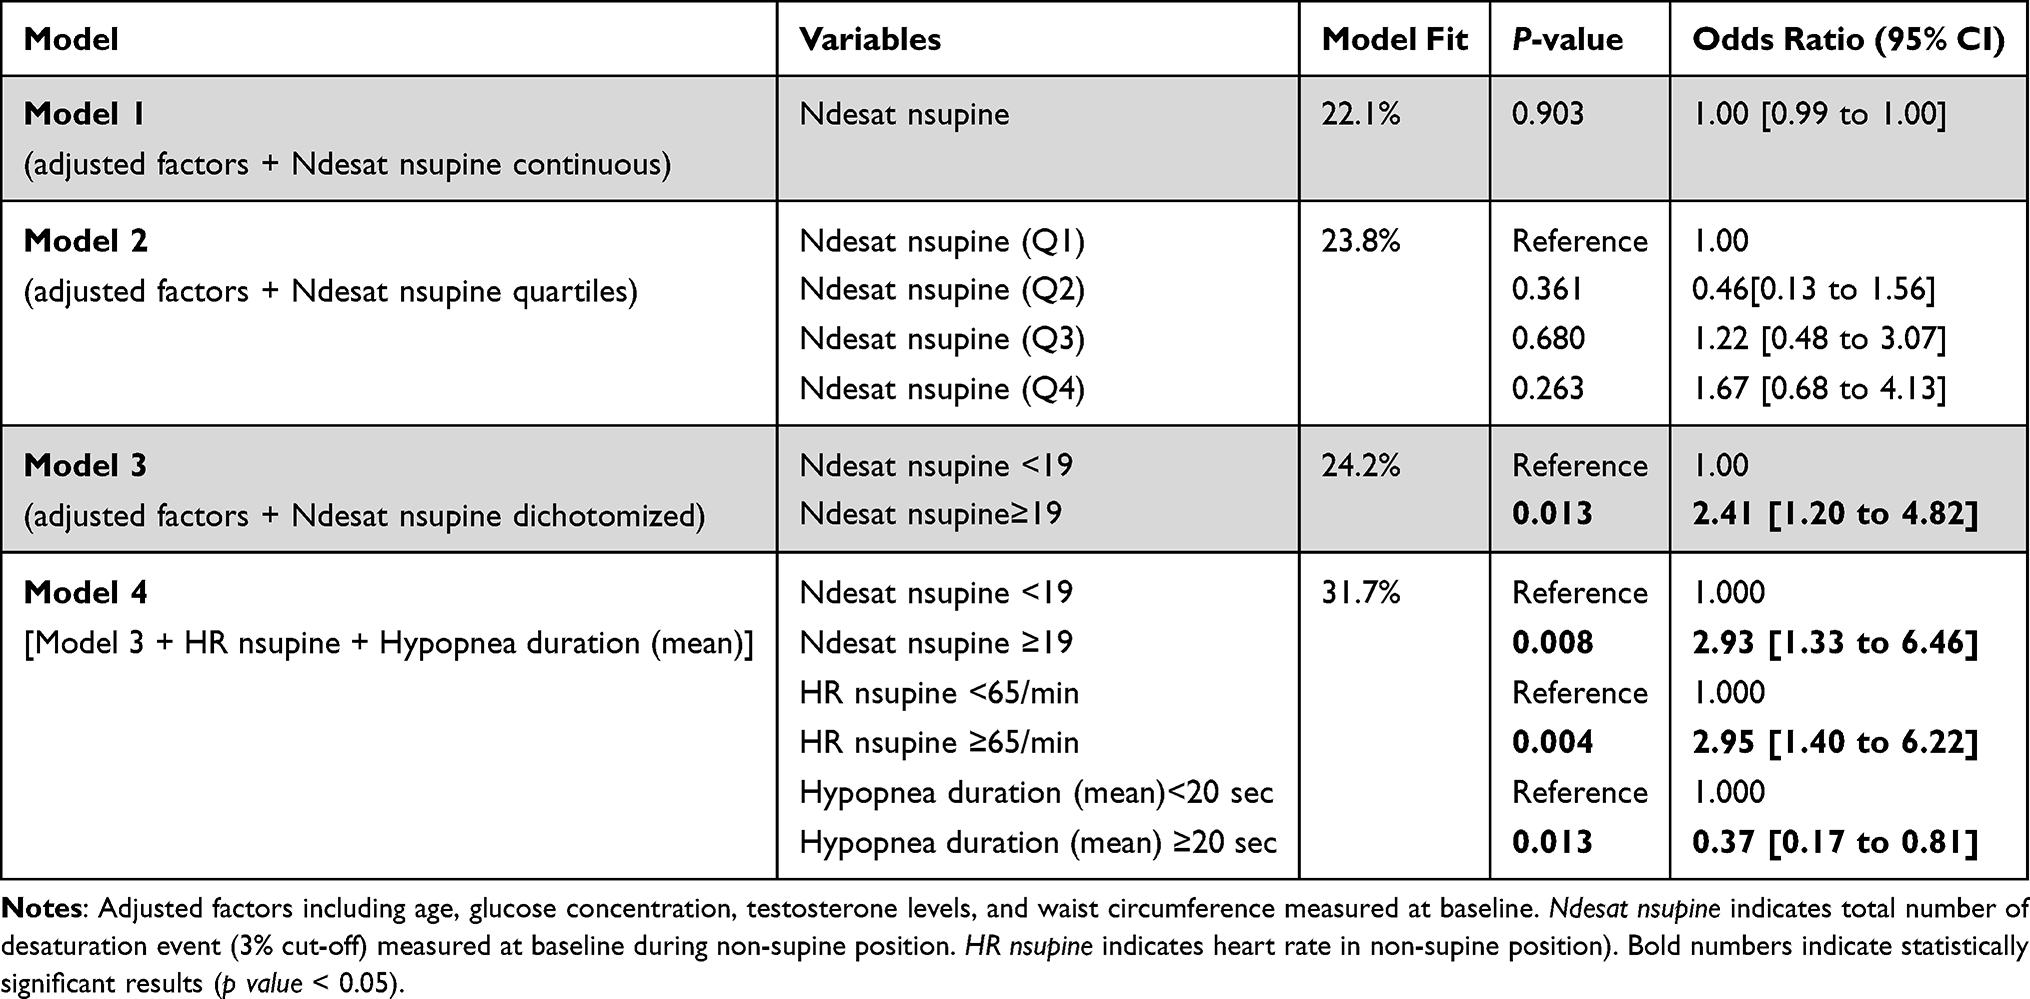 |
Table 2 Explainable Machine Learning Assisting Hypothesis Testing Association Between Diabetes and OSA Biomarkers |
Precision Medicine Approach to Risk Factor Assessment
We further explored the detailed output of explainable ML by examining two typical scenarios where participants initially exhibited similar glucose concentration levels at baseline but subsequently showed different outcomes at follow-up assessments. In Figure 3a and b, we considered two typical participants who had normal serum glucose concentration levels at baseline (4.8 mmol/L). However, other risk factors were associated with the outcome. Figure 3a shows biomarkers that were strongly associated with a very low risk of T2D, while an unfavorable range of PSG and an inflammatory biomarker (tumor necrosis factor alpha) placed the participant in Figure 3b at high risk of T2D, despite a healthy waist circumference (88.3 cm).
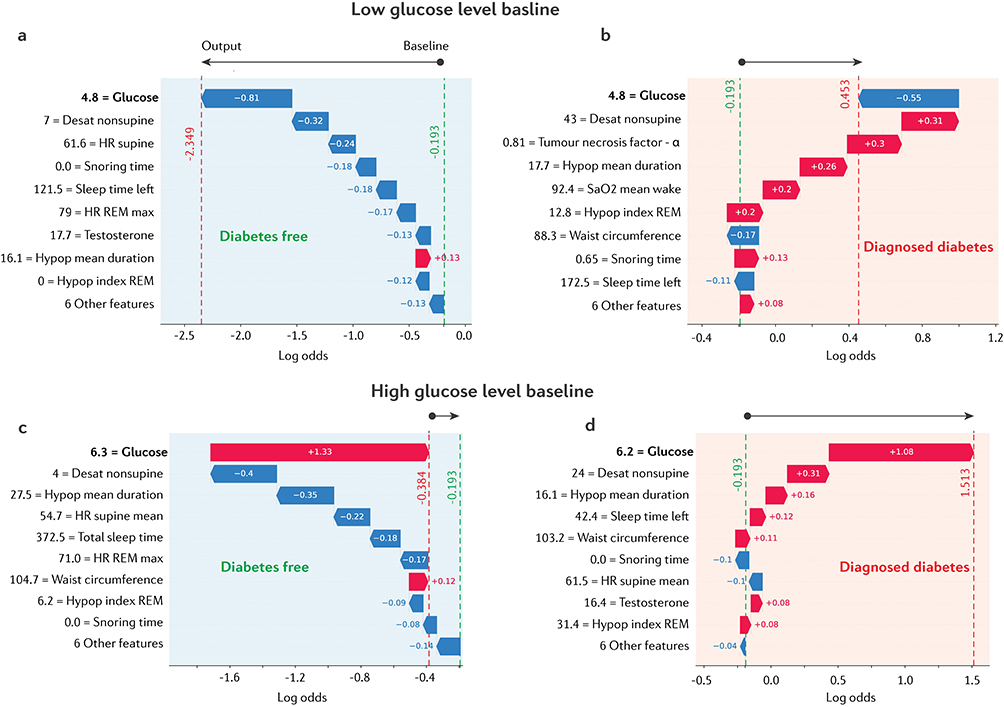 |
Figure 3 Comparison of typical scenarios leading to different outcomes at follow-up assessment. (a and b) Comparison of two participants with serum low glucose concentrations at baseline. (c and d) Comparison of two participants with high serum glucose concentrations at baseline. Red and blue colors indicate increased or decreased risk, respectively. The baseline risk for all participants was calculated as the mean of the model output, indicated by green dashed lines (log odds = −0.193), while the final risk outcome is indicated by red dashed lines after adding the additive contributions of all other risk factors. |
In the second scenario as shown in Figure 3c and d, high baseline glucose concentrations were observed in two participants. The risk of T2D for the participant in Figure 3c was associated with a range of sleep biomarkers. This participant was free of T2D at the follow-up assessment despite a high waist circumference (104.7 cm). Conversely, the participant in Figure 3d, with an unfavorable range of risk factors, combined with a high fasting glucose concentration, placed them into a high-risk category consistent with their T2D diagnosis at follow-up. For this participant, several biomarkers associated with elevated T2D risk could potentially be targeted to reduce risk.
Discussion
This study applied an explainable ML approach to explore associations between OSA biomarkers and incident T2D over around 8 years. This approach detected both well established and novel biomarkers associated with increased incident T2D risk. We further demonstrate that the explainable ML approach substantially benefits T2D risk factor identification and cut-off selection otherwise missed by our more traditional statistical modelling approaches10 due to non-linear relationships and sharper transition points than reliably discernible via inter-quartile ranges. This more detailed risk assessment approach may have important clinical applications to improve T2D risk identification and management and help to identify potential underlying mechanisms and more effective risk-modifying interventions suggested by this approach. The novelty of our analytical approach lies in our use of ML not just for prediction tasks, but to gain insights into the relationship between high-dimensional polysomnographic features and incident T2D. This opens new opportunities for exploring these novel biomarkers and potentially advancing personalized medicine approaches.
Fasting serum glucose, HbA1c,30 serum testosterone31,32 and waist circumference33 are established biomarkers and were identified in the top 15 biomarkers, supporting the validity of this approach. We also observed mean hypopnea duration to be associated with incident diabetes, consistent with recent findings that shorter apnoea-hypopnea event duration was associated with all-cause mortality risk in the Sleep Heart Health Study.34 The presence of hypopnea index in REM sleep in the top 15 biomarkers is similar to findings of the DREAM Study of US Veterans.35 Ding et al reported that a cluster analysis derived PSG phenotype characterised by frequent events in REM sleep with hypoxia was associated with incident diabetes independent of age, sex, race, fasting glucose, however, the association did not persist with additional adjustment for BMI and BMI change. Our finding that mean HR in the supine position predicted incident diabetes is also consistent with the findings of5 who showed an association between incident diabetes and mean total sleep time and heart rate. Even with established biomarkers associated with T2D we were able to more comprehensively evaluate the nature of the relationships via explainable ML. For example, we identified a sharp step-like transition point in the relationship between the odds of incident T2D and waist circumference. Based on the profile of the relationship, we identified that participants with a waist circumference above 96 cm were at significantly higher risk of incident T2D compared to those with a smaller waist circumference. This is comparable with previous research that identified a waist circumference above 94 cm for men as indicative of an increased risk of developing T2D33 and guideline waist circumference values of ≥94 cm and 102 cm for men based on increased risk and substantially increased risk of chronic conditions respectively (WHO 2000). Another example was fasting serum glucose concentrations which showed a sigmoidal relationship with T2D risk. Our results identified baseline glucose levels above 5.45 mmol/L as being associated with significantly increased risk of incident T2D at follow-up, consistent with the threshold typically used to define normal fasting plasma glucose levels as less than 5.55 nmol/L.36 This finding is striking because explainable ML not only confirmed known biomarkers linked to T2D but also identified critical thresholds for evaluating increased risk. While well-controlled studies are required to confirm the utility of identified novel biomarkers and the identified thresholds of elevated risk, a greater understanding of the strength and directions of individual and multiple biomarker relationships with T2D could be valuable for clinicians and patients to target preventative interventions to help reduce overall risks.
Furthermore, we demonstrated proof-of-concept to support the utility of multivariable risk prediction models guided by explainable ML. Epidemiological studies commonly categorize continuous variables using quartiles to help account for potential non-normal or non-linear relationships. However, our observation of a sharp sigmoidal relationship between non-supine desaturation events and increased odds of incident T2D at a cut-off ≥19 events identified by explainable ML was not discernible between quartiles. While nonlinear models are advocated for use instead of categorizing variables,37 they may not model nonsmoothed relationships well.29 Data-driven optimal cut-points could potentially be bias towards fitting relationships that may not necessarily exist.38 Thus, as with any approach, data-driven methods require independent validation to confirm the presence of reliably reproducible relationships. Nevertheless, explainable ML clearly has significantly improved power to detect complex multivariable effects not easily discernible through more traditional methods, but still requires further testing of novel biomarkers on independent data.38
Our study has limitations that could be addressed in future studies. The thresholds established using data from middle-aged and older men, may not generalize to women or younger populations. This is especially relevant for variables such as waist circumference, which likely require sex-specific cut-off points. Whether the specific cut-off threshold for non-supine desaturation events applies to other demographic groups is also unknown. Men with OSA show worse beta-cell function compared to women,39 further supporting sex-specific differences in type 2 diabetes risk for which different thresholds may well need to be applied. Overfitting issues might result in identifying irrelevant biomarkers. To mitigate this, we used Shapley values for feature ranking, which provides a more interpretable and robust alternative to permutation-based methods. The model’s correct identification of known T2D biomarkers further supports its reliability and reduces overfitting risk. Although strategies to reduce overfitting were applied, a limitation of our study is the lack of independent datasets for validation. Thus, further cross-sectional and longitudinal validation studies remain needed in independent and more diverse cohorts, including women and young men, to determine the reliability of the identified biomarkers and thresholds.
High ranking novel biomarkers identified through this approach are hypothesis generating and clearly warrant further investigation. However, as with more traditional statistical methods, associations may not be causal and require cautious speculation and interpretation surrounding potential mechanisms. As reviewed by Landry et al,40 patients with supine predominant or supine isolated OSA are younger and have a lower BMI and AHI compared to non-positional OSA patients. The association of 3% desaturations in non-supine sleep with incident diabetes may reflect in part the diabetes risk associated with older age, obesity and more frequent respiratory events. Given high rates of supine predominant OSA (50–60%) and supine isolated OSA (20–30%) in clinical sleep populations and epidemiological studies,40 the persistence of OSA in the non-supine position may reflect a more severe OSA phenotype.
Our finding that mean HR in the supine position predicted incident diabetes is also consistent with the findings of Kendzerska et al5 who showed an association between incident diabetes and mean total sleep time and heart rate. Continuous sympathetic stimuli occurring at the end of respiratory events promotes increased the sympathetic drive and increased heart rate41 has been linked to insulin resistance.42 Higher incident diabetes risk with lower mean hypopnea duration in this study is consistent with increased all-cause mortality risk with shorter apnoea-hypopnea event duration in the Sleep Heart Health Study,34 which the authors speculated may indicate a predisposition to augmented autonomic nervous system responses or increased ventilatory instability. The Multi-Ethnic Study of Atherosclerosis study also showed shorter hypopnea and apnoea events to be associated with lower circulatory delay, lower arousal threshold43 so multiple potential mechanisms could potentially help explain novel associations.
It was of interest to observe a low ranking of AHI (81st) in the Shapley values. Associations of varying strength between incident diabetes and OSA severity assessed by the AHI have been reported.10 Previous studies have also reported no association of diabetes incidence with AHI including the Wisconsin Sleep Cohort Study1,19 a study of US veterans.9 Nocturnal hypoxemia metrics have been consistently described as predictors of diabetes. It is also worth noting that AHI ranked only 81st in importance in explaining incident diabetes risk. This is perhaps not surprising given that AHI is a somewhat arbitrary and highly variable manually scored composite outcome of apnoea, hypopnea, desaturation and arousal events. Thus, the measure itself is problematic for identifying underlying pathophysiological mechanisms, and previous studies typically show only weak and inconsistent associations between AHI a range of clinical endpoints. Systematic ranking of all available candidate biomarkers head-to-head without the need a-prior assumptions, linear model constraints or overly restricted variable choices is a comprehensive and efficient approach to potential biomarker investigation.
In conclusion, explainable ML not only supports the relevance of established biomarkers but also identifies new biomarkers for T2D, which could play a key role in guiding future hypothesis testing and the development of more reliable and clinically applicable biomarkers. Although further validation is needed, these proof-of-concept findings underscore the value of explainable ML in prospective data analysis.
Data Sharing Statement
The data that support the findings of this study are available from the senior authors, RA ([email protected]) and SA ([email protected]), upon reasonable request.
Acknowledgment
The authors thank the MAILES study participants for ongoing study participation since 2000-2002. Funding for the MAILES study was provided by The National Health and Medical Research Council of Australia, The Freemasons Centre for Male Health and Wellbeing, ResMed Foundation, National Heart Foundation and the Hospital Research Foundation Group.
Author Contributions
Robert Adams and Sarah Appleton are co-senior authors.
Conceptualization: DPN, RA, SA, GW
Formal Analysis: DPN, PC, SA
Writing – Original Draft: DPN, SA, PC
Writing – Review & Editing: DPN, RA, SA, BL, AV, GW
Methodology: DPN, RA, SA, BL, GW, AV, PC
All authors gave final approval of the version to be published; agreed on the journal to which the article has been submitted; and agreed to be accountable for all aspects of the work.
Funding
The Men, Androgens, Inflammation, Lifestyle, Environment & Stress (MAILES) Study was supported by the NH&MRC of Australia (grant numbers NHMRC 627227 and 1122342), the Hospital Research Foundation Group, and Freemasons Centre for Male Health and Wellbeing.
Disclosure
Professor Peter Catcheside reports grants from National Health and Medical Research Council, grants from Defence Science and Technology Group, Compumedics Ltd, Invicta Medical, Garnett Passe and Rodney Williams Memorial Foundation, MND Australia, American Academy of Sleep Medicine, Lifetime Support Authority, Flinders Foundation, and a patent US-20210327584-A1 with royalties paid to Flinders University. Dr Bastien Lechat reports grants from Withings. Dr Andrew Vakulin reports grants from National Health and Medical Council of Australia (NHMRC), Philips Respironics, ResMed, ResMed Foundation, Lifetime Support Authority, Medical Research Future Fund (MRFF), and a patent PCT/AU2019/051147 Decision Support Software System for Sleep Disorder Identification licensed to Philips Respironics. Professor Robert Adams reports grants from National Health and medical Research Council, The Hospital Research Foundation, National Heart Foundation, ResMed Foundation, Philips Respironics, and Australian Government. The other authors have no competing interests to disclose.The abstract of this paper was presented at the 2024 Australasian Sleep Association conference as a poster presentation with interim findings. The poster’s abstract was published in Poster Abstracts in Sleep Advances: https://doi.org/10.1093/sleepadvances/zpae070.142.
References
1. Reutrakul S, Mokhlesi B. Obstructive sleep apnea and diabetes: a state of the art review. Chest. 2017;152(5):1070–1086. doi:10.1016/j.chest.2017.05.009
2. Tasali E, Mokhlesi B, Van Cauter E. Obstructive sleep apnea and type 2 diabetes: interacting epidemics. Chest. 2008;133(2):496–506. doi:10.1378/chest.07-0828
3. Tomic D, Shaw JE, Magliano DJ. The burden and risks of emerging complications of diabetes mellitus. Nat Rev Endocrinol. 2022;18(9):525–539. doi:10.1038/s41574-022-00690-7
4. Pamidi S, Tasali E. Obstructive sleep apnea and type 2 diabetes: is there a link? Front Neurol. 2012;3. doi:10.3389/fneur.2012.00126.
5. Kendzerska T, Gershon AS, Hawker G, Tomlinson G, Leung RS. Obstructive sleep apnea and incident diabetes a historical cohort study. Am J Respir Crit Care Med. 2014;190(2):218–225. doi:10.1164/rccm.201312-2209OC
6. Li X, Sotres-Alvarez D, Gallo LC, et al. Associations of sleep-disordered breathing and insomnia with incident hypertension and diabetes: the Hispanic community health study/study of latinos. Am J Respir Crit Care Med. 2021;203(3):356–365. doi:10.1164/rccm.201912-2330OC
7. Siddiquee AT, Kim S, Thomas RJ, Lee M-H, Lee SK, Shin C. Obstructive sleep apnoea and long-term risk of incident diabetes in the middle-aged and older general population. ERJ Open Res. 2023;9(2):00401–2022. doi:10.1183/23120541.00401-2022
8. Strausz S, Havulinna AS, Tuomi T, et al. Obstructive sleep apnoea and the risk for coronary heart disease and type 2 diabetes: a longitudinal population-based study in Finland. BMJ Open. 2018;8(10):e022752. doi:10.1136/bmjopen-2018-022752
9. Wojeck BS, Inzucchi SE, Qin L, Yaggi HK. Polysomnographic predictors of incident diabetes and pre-diabetes: an analysis of the DREAM study. J Clin Sleep Med. 2023;19(4):703–710. doi:10.5664/jcsm.10414
10. Appleton SL, Naik G, Nguyen DP, et al. Associations of polysomnographic measures of obstructive sleep apnea, and nocturnal oxygen saturation with incident type 2 diabetes mellitus in middle‐aged and older men. J Sleep Res. doi:10.1111/jsr.14357
11. Reichmuth KJ, Austin D, Skatrud JB, Young T. Association of sleep apnea and type II diabetes: a population-based study. Am J Respir Crit Care Med. 2005;172(12):1590–1595. doi:10.1164/rccm.200504-637OC
12. Leong WB, Jadhakhan F, Taheri S, Chen YF, Adab P, Thomas GN. Effect of obstructive sleep apnoea on diabetic retinopathy and maculopathy: a systematic review and meta-analysis. Diabetic Med. 2016;33(2):158–168. doi:10.1111/dme.12817
13. Grimaldi D, Beccuti G, Touma C, Van Cauter E, Mokhlesi B. Association of obstructive sleep apnea in rapid eye movement sleep with reduced glycemic control in type 2 diabetes: therapeutic implications. Diabetes Care. 2014;37(2):355–363. doi:10.2337/dc13-0933
14. Resnick HE, Redline S, Shahar E, et al. Diabetes and sleep disturbances: findings from the sleep heart health study. Diabetes Care. 2003;26(3):702–709. doi:10.2337/diacare.26.3.702
15. Mangas-Moro A, Casitas R, Sánchez-Sánchez B, et al. Characteristics of obstructive sleep apnea related to insulin resistance. Sleep Breathing. 1–10.
16. Wong F, Zheng EJ, Valeri JA, et al. Discovery of a structural class of antibiotics with explainable deep learning. Nature. 2024;626(7997):177–185. doi:10.1038/s41586-023-06887-8
17. Lauritsen SM, Kristensen M, Olsen MV, et al. Explainable artificial intelligence model to predict acute critical illness from electronic health records. Nat Commun. 2020;11(1). doi:10.1038/s41467-020-17431-x
18. Joyce DW, Kormilitzin A, Smith KA, Cipriani A. Explainable artificial intelligence for mental health through transparency and interpretability for understandability. NPJ Digit Med. 2023;6(1). doi:10.1016/j.chest.2017.05.009
19. Martinot JB, Le-Dong NN, Malhotra A, Pépin JL. Respiratory effort during sleep and prevalent hypertension in obstructive sleep apnoea. Eur Respir J. 2023;61(3):2201486. doi:10.1183/13993003.01486-2022
20. Lundberg SM, Erion G, Chen H, et al. From local explanations to global understanding with explainable AI for trees. Nat Mach Intell. 2020;2(1):56–67. doi:10.1038/s42256-019-0138-9
21. Grant JF, Martin SA, Taylor AW, et al. Cohort profile: the men androgen inflammation lifestyle environment and stress (MAILES) study. Int J Epidemiol. 2014;43(4):1040–1053. doi:10.1093/ije/dyt064
22. Appleton SL, Vakulin A, Wittert GA, et al. The association of obstructive sleep apnea (OSA) and nocturnal hypoxemia with the development of abnormal HbA1c in a population cohort of men without diabetes. Diabet Res Clin Pract. 2016:114. doi:10.1016/j.diabres.2015.12.007.
23. Comino EJ, Tran DT, Haas M, et al. Validating self-report of diabetes use by participants in the 45 and up study: a record linkage study. BMC Health Serv Res. 2013;13(1). doi:10.1186/1472-6963-13-481
24. Chen T, Guestrin C. XGBoost: a scalable tree boosting system. In:
25. Shwartz-Ziv R, Armon A. Tabular data: deep learning is not all you need. Information Fusion. 2022;81. doi:10.1016/j.inffus.2021.11.011
26. Chawla NV, Japkowicz N, Kotcz A. special issue on learning from imbalanced data sets. ACM SIGKDD Explorations Newsl. 2004;6(1):1–6. doi:10.1145/1007730.1007733
27. Elor Y, Averbuch-Elor H. To SMOTE, or not to SMOTE? arXiv Preprint.
28. Guyon I, Weston J, Barnhill S, Vapnik V. Gene selection for cancer classification using support vector machines. Mach Learn. 2002;46(1–3):389–422. doi:10.1023/A:1012487302797
29. Hastie T, Tibshirani R. Generalized additive models. Stat Sci. 1986;1(3). doi:10.1214/ss/1177013604
30. Gallwitz B, Guzman J, Dotta F, et al. Exenatide twice daily versus glimepiride for prevention of glycaemic deterioration in patients with type 2 diabetes with metformin failure (EUREXA): an open-label, randomised controlled trial. Lancet. 2012;379(9833):2270–2278. doi:10.1016/S0140-6736(12)60479-6
31. Bhasin S, Lincoff AM, Nissen SE, et al. Effect of testosterone on progression from prediabetes to diabetes in men with hypogonadism a substudy of the TRAVERSE randomized clinical trial. JAMA Intern Med. doi:10.1001/jamainternmed.2023.7862
32. Wittert G, Bracken K, Robledo KP, et al. Testosterone treatment to prevent or revert type 2 diabetes in men enrolled in a lifestyle programme (T4DM): a randomised, double-blind, placebo-controlled, 2-year, phase 3b trial. Lancet Diabetes Endocrinol. 2021;9(1):32–45. doi:10.1016/S2213-8587(20)30367-3
33. Siren R, Eriksson JG, Vanhanen H. Waist circumference a good indicator of future risk for type 2 diabetes and cardiovascular disease. BMC Public Health. 2012;12(1). doi:10.1186/1471-2458-12-631
34. Butler MP, Emch JT, Rueschman M, et al. Apnea-hypopnea event duration predicts mortality in men and women in the sleep heart health study. Am J Respir Crit Care Med. 2019;199(7):903–912. doi:10.1164/rccm.201804-0758OC
35. Ding Q, Qin L, Wojeck B, et al. Polysomnographic phenotypes of obstructive sleep apnea and incident type 2 diabetes results from the dream study. Ann Am Thorac Soc. 2021;18(12):2067–2078. doi:10.1513/AnnalsATS.202012-1556OC
36. Tirosh A, Shai I, Tekes-Manova D, et al. Normal fasting plasma glucose levels and type 2 diabetes in young men. N Engl J Med. 2005;353(14):1454–1462. doi:10.1056/nejmoa050080
37. Bennette C, Vickers A. Against quantiles: categorization of continuous variables in epidemiologic research, and its discontents. BMC Med Res Methodol. 2012;12:12. doi:10.1186/1471-2288-12-21
38. Naggara O, Raymond J, Guilbert F, Roy D, Weill A, Altman DG. Analysis by categorizing or dichotomizing continuous variables is inadvisable: an example from the natural history of unruptured aneurysms. Am J Neuroradiol. 2011;32(3):437–440. doi:10.3174/ajnr.A2425
39. Temple KA, Leproult R, Morselli L, Ehrmann DA, Cauter E, Van, Mokhlesi B. Sex differences in the impact of obstructive sleep apnea on glucose metabolism. Front Endocrinol. 2018;9(JUL). doi:10.3389/fendo.2018.00376
40. Landry SA, Beatty C, Thomson LDJ, et al. A review of supine position related obstructive sleep apnea: classification, epidemiology, pathogenesis and treatment. Sleep Med Rev. 2023:72. doi:10.1016/j.smrv.2023.101847.
41. Hla KM, Young TB, Bidwell T, Palta M, Skatrud JB, Dempsey J. Sleep apnea and hypertension: a population-based study. Ann Intern Med. 1994;120(5):382–388. doi:10.7326/0003-4819-120-5-199403010-00005
42. Wang L, Cui L, Wang Y, et al. Resting heart rate and the risk of developing impaired fasting glucose and diabetes: the Kailuan prospective study. Int J Epidemiol. 2015;44(2):689–699. doi:10.1093/ije/dyv079
43. Borker PV, Reid M, Sofer T, et al. Non-REM apnea and hypopnea duration varies across population groups and physiologic traits. Am J Respir Crit Care Med. 2021;203(9):1173–1182. doi:10.1164/rccm.202005-1808OC
 © 2025 The Author(s). This work is published and licensed by Dove Medical Press Limited. The
full terms of this license are available at https://www.dovepress.com/terms
and incorporate the Creative Commons Attribution
- Non Commercial (unported, 4.0) License.
By accessing the work you hereby accept the Terms. Non-commercial uses of the work are permitted
without any further permission from Dove Medical Press Limited, provided the work is properly
attributed. For permission for commercial use of this work, please see paragraphs 4.2 and 5 of our Terms.
© 2025 The Author(s). This work is published and licensed by Dove Medical Press Limited. The
full terms of this license are available at https://www.dovepress.com/terms
and incorporate the Creative Commons Attribution
- Non Commercial (unported, 4.0) License.
By accessing the work you hereby accept the Terms. Non-commercial uses of the work are permitted
without any further permission from Dove Medical Press Limited, provided the work is properly
attributed. For permission for commercial use of this work, please see paragraphs 4.2 and 5 of our Terms.