Back to Journals » Journal of Hepatocellular Carcinoma » Volume 8
Experimental Validation of Novel Glypican 3 Exosomes for the Detection of Hepatocellular Carcinoma in Liver Cirrhosis
Authors Aydin Y, Koksal AR, Thevenot P, Chava S, Heidari Z, Lin D, Sandow T, Moroz K, Parsi MA, Scott J, Cohen A, Dash S
Received 1 July 2021
Accepted for publication 18 November 2021
Published 8 December 2021 Volume 2021:8 Pages 1579—1596
DOI https://doi.org/10.2147/JHC.S327339
Checked for plagiarism Yes
Review by Single anonymous peer review
Peer reviewer comments 2
Editor who approved publication: Dr Laura A. Dawson
Yucel Aydin,1 Ali Riza Koksal,1,2 Paul Thevenot,3 Srinivas Chava,1 Zahra Heidari,4 Dong Lin,1 Tyler Sandow,5 Krzysztof Moroz,1 Mansour A Parsi,2 John Scott,1 Ari Cohen,3,6 Srikanta Dash1,7
1Department of Pathology and Laboratory Medicine, Tulane University Health Sciences Center, New Orleans, LA, USA; 2Department of Gastroenterology and Hepatology, Tulane University Health Sciences Center, New Orleans, LA, USA; 3Institute of Translational Research, Ochsner Health, New Orleans, LA, USA; 4Chemical and Biomedical Engineering, Tulane University, New Orleans, LA, USA; 5Department of Radiology, Institute of Translational Research, Ochsner Health, New Orleans, LA, USA; 6Multi-Organ Transplant Institute, Ochsner Health, New Orleans, LA, USA; 7Southeast Louisiana Veterans Health Care System, New Orleans, LA, USA
Correspondence: Srikanta Dash Email [email protected]
Background and Aims: Hepatocellular carcinoma (HCC) developing in the context of preexisting cirrhosis is characterized by impaired autophagy that results in increased exosome release. This study was conducted to determine whether circulating exosomes expressing glypican 3 (GPC3) could be utilized as a biomarker for HCC detection and treatment response in patients with cirrhosis.
Methods: Immunohistochemistry was performed to assess p62 and GPC3 expression in the lesion and adjacent tissue from cirrhosis with HCC. GPC3-enriched exosomes were captured by an enzyme-linked immunosorbent assay (ELISA). The diagnostic specificity of serum exosome-derived GPC3 (eGPC3) was determined using samples obtained from malignancy-free controls, malignancy-free cirrhotics, cirrhotics with confirmed HCC, and patients with a non-HCC malignancy. The performance of eGPC3 was validated using serum samples of HCC patients received chemotherapy.
Results: We found that the expression of p62 and GPC3 was significantly increased in HCC tissues compared to adjacent cirrhotic liver. Impaired autophagy and exosome shedding were confirmed in HCC cell lines. Mass spectroscopic analysis revealed that GPC3 was enriched in exosomes isolated from HCC cell lines. An affinity ELISA assay was developed that specifically captures GPC3 positive exosomes in the serum. Total exosome concentration and eGPC3 were significantly elevated in cirrhotic patients with HCC as compared to the reference control groups. Furthermore, decreases in post-treatment exosome concentration and eGPC3 levels were more closely correlated with response to locoregional chemotherapy compared to change in serum AFP in HCC patients awaiting liver transplantation.
Conclusion: We developed an affinity exosome capture assay to detect GPC3 enriched exosomes. Our preliminary assessment shows that GPC3 positive exosomes can be used for HCC detection and prediction of treatment outcomes.
Keywords: hepatocellular carcinoma, autophagy, exosome, glypican 3, surveillance
Corrigendum for this paper has been published.
Graphical Abstract:

Introduction
Hepatocellular carcinoma (HCC) is the fifth most common cancer and the second leading cause of cancer-related mortality worldwide.1–3 Even though a great progress has been made in the treatment of HCC including curative resection or liver transplantation, tumor-directed therapies such as radiofrequency ablation, trans-arterial chemoembolization (TACE), radioembolization, as well as new systemic therapy beyond sorafenib, disease prognosis remains very poor.4–6 Recent HCC surveillance data from the United States show improved 5-year overall survival following treatment in HCC diagnosed in its early stages (44% versus 11%).7–11 Liver ultrasound (US) alone or combination with serum alpha-fetoprotein (AFP) every 6-months is the standard of care for HCC screening of patients with cirrhosis, although this approach lacks the sensitivity and specificity to reliably detect HCC at an early stage.12–14 During the last several years, numerous biomarkers have been introduced for surveillance and early detection of HCC in cirrhotic patients. The most promising targets include glypican 3 (GPC3), Osteopontin, Golgi protein-73 as well as several microRNAs and non-coding RNAs candidates. However, these candidates have yet to establish superiority to routine liver US and serum AFP.15,16 In addition, the molecular mechanisms, which link these biomarkers to HCC initiation, progression, and metastasis are unclear. Focusing on validated, tumor-derived candidate biomarkers should improve early-stage HCC diagnosis and access to the full range of treatment options to maximize patient outcomes.
Over the past several decades, chronic hepatitis C virus (HCV) infection has been the major risk factor for HCC.8 The rising incidence of metabolic syndrome, non-alcoholic fatty liver disease (NAFLD) is projected to soon become the predominant underlying HCC etiology.17–19 Although the number of HCV cured continues to rise, many of these patients still suffer from cirrhosis due to chronic inflammation, which may be further complicated by other risk factors including metabolic syndrome and excessive alcohol consumption.20 Noninvasive biomarkers that can predict the natural course of chronic liver disease, cirrhosis outcome, early prediction of premalignant disease and HCC are still urgently needed.
Autophagy is a lysosomal degradation process that provides cellular protection and increases the life span of many model organisms including mammals.21 During chronic liver disease hepatocytes, the major cell type in the liver, are exposed to a wide range of viral and non-viral insults that trigger stress response pathways. Autophagy is activated during the cellular stress response to reduce hepatic stress, restore cellular homeostasis, and promote cell viability. However, the capacity to sustain high autophagic activity declines with age and during chronic disease processes like HCC on a background of cirrhosis.22 Previous studies from our laboratory showed that hepatic adaptive response to multifaceted HCV microbial stress modulates the autophagy process leading to HCC development in cirrhosis. Furthermore, we demonstrated that HCC initiation in cirrhosis is mechanistically linked to impaired autophagy.23–26 Chaperone-mediated autophagy and endosomal micro autophagy (exosome release) are specially activated as a compensatory, prosurvival mechanism under stress.23,26 The excessive release of non-degradable cellular cargoes/biomolecules through exosome release alleviates stress thereby promotes cell survival. Exosomes are double-layered extracellular vesicles of 50–150 nm diameter released by all mammalian cell during the normal physiological response to stress. Aberrant exosome secretion occurs during the cellular adaptive response to excessive stress caused tumor cell metabolism and proliferation. Exosomes are endocytic origin and are formed as intraluminal vesicles by inward budding of the late endosome or multivesicular bodies (MVBs).27 Many recent publications claim that exosomes play an important role in cell-to-cell communication and cancer metabolism.28–31 They carry numerous biomolecules, such as noncoding RNAs (ncRNAs), microRNAs and circular RNAs that regulate gene transcription and translation. There is growing evidence suggesting that they play an important role in hepatobiliary cancers.31 We hypothesize that HCC-derived exosomes carry specific proteins, nucleic acids in the form of mRNA, and small RNAs (miRNA or non-coding RNAs) that can be explored as a potential biomarker for early detection of HCC in cirrhosis.
Glypicans belong to a group of heparan-sulfate proteoglycans, a large family of plasma membrane-associated glycoproteins involved in endocytosis, lysosomal degradation, recycling, endosomal escape into cytosol, fusion into MVBs, and exosome release.32 GPC3 is involved in the endocytosis and degradation of cell surface receptors and plays an important role in HCC growth and differentiation by regulating activities of many signaling pathways.33–36 GPC3 and other proteoglycans play a role in ligand internalization, sorting, and degradation in the endosomes and MVBs. Exosomes express glypicans on their cellular surface. Recently, some researchers have reported that glypican exosomes can be used for the detection of pancreatic cancer and gastrointestinal cancers.37–41 Although GPC3 expression is increased in HCC and accurately differentiates HCC from the benign liver, clinical studies have produced controversial results on the utility of soluble serum GPC3 for detecting HCC.42–45
We proposed that HCC-derived exosomes were enriched with GPC3 and that levels of exosome-derived GPC3 (eGPC3) in serum could provide superior diagnostic performance compared to AFP. We performed this proof-of-principle study to test whether HCC-specific exosomes detection is an accurate serum biomarker for HCC diagnosis in patients with cirrhosis.
Methods
Immunohistochemistry (IHC)
Five-micron tissue sections were prepared from paraffin embedded HCC tissues and control non-HCC liver described previously.26 Tissue sections were deparaffinized for 15 minutes at 50–60° C followed by treatment with xylene twice for 5 minutes. The tissue sections were rehydrated by sequential treatment with 100%, 95%, and 80% alcohol. Peroxidase quenching was carried out by incubation with 3% hydrogen peroxide and 100% methanol for 5 minutes. The slides were placed in a plastic Coplin jar with Reveal Decloaker RTU (RV 1000 Biocare Medical) for 25 minutes at 95°C in a steamer for heated antigen retrieval. Following this step, the slides were allowed to cool at room temperature for 20 minutes. The tissue sections were rinsed in deionized, distilled water and marked using a PAP pen. The slides were incubated with a blocking sniper (Biocare Medical) for 10 minutes and incubated with a primary antibody for 1 hour at room temperature. The primary antibodies used were SQSTM1/p62 mouse monoclonal antibody in 1:200 dilution (88588S, Cell signaling) and pre-diluted antibody to glypican-3 (PM396 AA, Biocare Medical). After the primary antibody incubation, slides were washed 3 times in Tris Buffer Saline (TBS) (pH 8.0), incubated with a MACH 4 mouse probe (UP534, Biocare Medical,) for 20 minutes and MACH 4 HRP Polymer (Biocare Medical, MRH534) for 30 minutes each, then washed 3 times using TBS. Finally, Diaminobenzidine (DAB) chromogen reagent (BDB2004L, BioCare Medical) was used to develop the staining for 1–5 minutes. The slides were then counterstained with Hematoxylin (Biocare Medical, CATHE-M) for 30 seconds and Tacha’s bluing Solution (Biocare Medical, HTBLU-M) for 30 seconds, mounted, and observed by light microscopy. H&E-stained sections of all specimens, including cancer and non-cancer cases, were examined, and scored independently by two pathologists who are experienced in hepatobiliary pathology following the IHC evaluation. Scores were assigned to the intensity and percentage of positive staining. Scoring as follows: 0 means negative staining, 1 (weak), 2 (medium) and 3, (strong) according to a previous publication.46 Multiplying the intensity of score and proportion of immunopositive cells (0–100%), a semi quantitative staining score ranged from 0 to 300 was established for statistical analysis.
Cell Lines and Chemicals
All cell lines were purchased commercially. Primary human hepatocytes (PHHs) were obtained from XenoTech LLC (Kansas City, MO) and cultured with hepatocyte culture media supplemented with 10% human serum (Invitrogen, Brown Deer, WI). HCC cell lines Hep G2 cells (Wu Laboratory), Huh-7, Huh-7PX, and Huh-7AF (Pawlotsky Laboratory), HLE and HLF (Wilkens Laboratory) Huh-7.5 (Rice Laboratory) were grown in Dulbecco’s Modified Eagle’s Medium supplemented with 10% fetal bovine serum, nonessential amino acids, sodium pyruvate, and penicillin, streptomycin, and amphotericin B (Gibco, Carlsbad, CA). Torin1 (475991) was purchased from Sigma-Aldrich.
Immunocytochemistry and Western Blotting
PHHs or HCC cells were immobilized on glass slides and stained for p62 and glypican 3 by immunostaining using a standard protocol established in our laboratory.24 Exosomes and adherent cells were isolated from the cultures and lysates (20 μg of protein) prepared and examined for expression of p62, glypican 1, glypican 3 and exosome markers, CD9, TSG101 by SDS-PAGE electrophoresis and Western blotting using a standard protocol established in the laboratory.24 In brief, cells were lysed in ice-cold lysis buffer (50 mM Tris HCl pH 8.0, 140 mM NaCl, 1.5 mM MgCl2, 0.5% NP-40 with complete protease inhibitor from Invitrogen) for 10 minutes in ice (about 1 × 10⁶ cells/200 μL). Cells pelleted by low-speed centrifugation. The detergent compatible (DC) protein assay determined protein concentration. Samples were boiled for 10 minutes at 80 °C in the presence of 1× sodium dodecyl sulfate-polyacrylamide gel electrophoresis (SDS-PAGE)-loading buffer (250 mM Tris-HCl pH 6.8, 40% glycerol, 8% SDS, 0.57M β-mercaptoethanol, 0.12% bromophenol blue). Approximately 20 μg of protein was loaded onto 12% SDS-PAGE and transferred into a nitrocellulose membrane (LC2001 Thermo Scientific). The membrane was blocked using a solution containing 5% of blotting-grade milk power (Bio-Rad, Hercules, CA, USA) for 2 hours then incubated with a primary antibody. Antibodies to p62 (sc-28359), glypican 3 (sc-65443), glypican 1 (sc-365000), TSG101 (sc-7964), CD9 (sc-13118) and glyceraldehyde-3-phosphate dehydrogenase (GAPDH) (sc-365062) were purchased from Santa Cruz Biotechnology. After overnight incubation at 4°C on a rocker, the antigen-antibody complex was visualized with horseradish peroxidase (HRP)-conjugated goat anti-rabbit or anti-mouse Immunoglobulin G (IgG) and the ECL detection system (RPN2232 Amersham ECL, GE Healthcare Biosciences, Pittsburgh, PA, USA).
DQ-Red BSA Staining
DQ™ Red BSA (D12051, Thermo Scientific) is a fluorogenic substrate that is endocytosed in cells and traffics through early endosomes to late endosomes that then fuse with acidic hydrolase containing lysosomes. This leads to the formation of endo-lysosomes that degrade DQ-Red BSA, de-quenching the fluorescence of the dye attached to this cargo, therefore, produces bright red spots in endo-lysosomes.47 Equal number of cells was seeded in 6-well plate. Then, untreated and Torin1-treated live cells were incubated with DQ-Red BSA for one hour. After washing cells with PBS, cells were fixed with 4% paraformaldehyde and counterstained with Hoechst 33342 (H3570, Thermo Scientific). Cells were examined using fluorescent microscopy.
Exosome Isolation from Cell Culture Media
Fetal Bovine Serum-free conditioned cell culture media were collected and centrifuged at 2000 × g for 30 minutes to remove cells and debris. Exosomes were isolated using the Total Exosome Isolation Reagent for cell culture supernatant (4478359, InvitrogenTM, Thermo Fisher Scientific®, Waltham, MA, USA). According to the manufacturer’s instructions, 0.5 volume of reagent for 1 volume of cell culture media were vortexed. The samples were incubated overnight at 4°C. The next day samples were centrifuged at 10.000 × g for 1 hour at 4°C then supernatant was discarded. The exosome pellet was retrieved after removal of the supernatant and resuspended in 100 μL 1x phosphate buffered saline (PBS) for downstream analyses.
Exosome Isolation from Serum
Exosomes were isolated using the exosome Isolation Reagent (4478360, InvitrogenTM, Thermo Fisher Scientific®, Waltham, MA, USA) according to the manufacturer’s instructions. Briefly, serum samples were centrifuged at 2000 × g for 30 minutes to remove cell and debris. The serum samples then were filtered through 0.22 μm syringe filter (Millipore). 0.2 volumes of total exosome isolation reagent were added to serum (40 μL of isolation reagent to 200 μL of serum) and mixed the serum-reagent mixture by vortexing. The samples were incubated for 30 minutes at room temperature. After incubation, the samples were centrifuged at 10,000 × g for 10 min at 4°C. The exosome pellet was retrieved after removal of the supernatant and resuspended in 100 μL PBS for downstream analyses.48–50
Nanoparticle Tracking Analysis
Nanoparticle tracking analysis (NTA) is a powerful technique that measures both laser light scattering and the Brownian motion of the exosomes in the liquid phase.51,52 NanoSight NS300 instruments (Malvern, UK) was used to visualize by the light scatter by exosomes after laser illumination, and their Brownian motion. Exosomes are secreted after the fusion of MVBs with the plasma membrane, whereas microvesicles are thought to bud directly from the plasma membrane. The majority of EVs occur within the sub-micron range (30–1000 nm) where exosomes are believed to be most abundantly present in the lowest size range (30–150 nm). The NTA software enables the sizing of single particles by tracking their mean squared displacement and thereby calculating their theoretical hydrodynamic diameter using the Stokes-Einstein equation. Based on knowing the sample volume, NTA also allows for an accurate estimation of particle concentration. Exosome samples were diluted in 1:1000 and the suspensions were passed through a flow chamber and are illuminated using a laser source. Video recorded for each sample was analyzed with NTA software version 2.3 to determine the concentration and size of the measured particles with the corresponding standard error. NanoSight system was calibrated with polystyrene latex microbeads of 50, 100 and 200nm (Thermo Scientific) before analysis.
LC-MS Analysis
We performed a high-sensitivity liquid chromatography-mass spectrometry (LC-MS/MS) analysis of extracellular vesicles derived from human hepatocellular carcinoma cells (Huh-7.5) to determine the list of proteins enriched in HCC exosomes. The high-sensitivity LC-MS/MS at the University of Wisconsin Biotechnology Center, 425 Henry Mall Madison, WI53706. A protein identification software Mascot search engine (Version 2.2.07) was used for mass spec data analysis.
Cryogenic Transmission Electron Microscopy (CryoTEM) and Immunogold Labeling
The exosome samples were blotted on a lacey carbon-coated copper grid (200-mesh, electron microscopy sciences) using an automated system, Vitrobot (FEI, Hillsboro, OR), operated at 100% humidity for 2 seconds. For immunogold labeling, exosomes were first blocked with 0.5% BSA and then successively incubated with mouse anti-glypican antibodies followed by rabbit anti-mouse (Dako, Glostrup, Denmark). The next, samples were incubated by 10-nm gold particles (Cytodiagnostics) for 2 h at room temperature. Samples were then contrasted and embedded in a mixture of 0.4% uranyl acetate and 1.8% methylcellulose. The grids were washed with PBS followed by double distilled water and stained with 0.4% uranyl acetate/1.8% methylcellulose and then dried. Exosomes were observed using a TecnaiTM G2 Spirit BioTWIN transmission electron microscope (TEI) and images were taken with an AMT CCD camera (Advanced Microscopy Techniques, Woburn, MA, USA) at 150 kV.
Bead-Based Exosome Immunoaffinity Capture and Flow Analysis
A 10µL volume of streptavidin latex beads (Invitrogen) was washed with PBS and incubated with biotinylated anti-CD9 for one hour. The beads were washed three times with PBS and blocked with 100 mM glycine and 2% BSA for one hour at room temperature. The beads were suspended in PBS and added to exosomes to a final concentration of 108 particle/mL for overnight incubation at 4°C in a shaker. The next day beads were washed three times using 2% BSA in PBS. For the detection of exosome proteins, beads were incubated with Laemmli buffer, boiled, and subjected to Western blot analysis. For flow analysis, affinity-purified exosomes were washed once in 2% BSA in PBS and centrifuged at 14,800 × g for one minute and blocked with 10% BSA while rotating at room temperature. Purified exosomes were then washed with 2% BSA in PBS, centrifuged at 14,800 × g for one minute, and incubated with primary antibody to either glypican 1 (sc-36500, Santa Cruz) or glypican 3 (MA5-16368, Thermo Scientific) for one hour while rotating at 4°C. Following centrifugation at 14,800 × g for one minute, the beads were washed with 2% BSA in PBS and stained with Alexa fluor 488-conjugated antibody (Invitrogen) for one-hour with rotation at 4°C. Beads were washed three times with 2% BSA in PBS and then analyzed by flow cytometry. Secondary antibody incubation alone with exosomes was used as control and to establish positive staining gates in the acquisition and analysis software.
Serum Cohort Study
Peripheral blood specimens were obtained through a prospective study approved by the Ochsner Health Institutional Review Board (protocol 2016.131.B) and included 93 patients. This study was also conducted in accordance with the Declaration of Helsinki. HCC was diagnosed by biopsy or met the Liver Imaging Reporting and Data System (LI-RADS) class LR-4 or LR-5. All patients in the cohort were reviewed by a multidisciplinary tumor board and selected for bridge to transplant locoregional therapy with doxorubicin-eluting bead transarterial chemoembolization (DEB-TACE). Blood was obtained immediately prior to procedure after obtaining informed consent for participation in the study. A second blood specimen was collected at routine CT/MRI follow-up visit 30 days following the DEB-TACE procedure. Patients with cirrhosis undergoing routine HCC surveillance were consented for the study and blood collected at 6-month visit following a normal ultrasound visit and normal serum AFP. Peripheral blood was collected, processed to obtain serum, and stored at ultra-low temperature within 2 hours of collection. Clinical data for cirrhosis etiology, tumor radiographic burden, as well as baseline and follow-up complete metabolic panel, complete blood count, and serum AFP values were extracted from the electronic medical record. Serum samples from individuals with non-HCC malignancy (n = 10) were obtained from Louisiana Consortium Research Center with IRB approval (protocol 16-911367E). Serum samples from healthy controls (n = 25) were obtained from Clinical Pathology of Tulane Health Sciences Center.
Treatment Response to DEB-TACE Locoregional Therapy
An interventional radiologist blinded to the purpose of the study following routine follow-up imaging independently assessed response to treatment. Treatment response was evaluated using the Modified Response Evaluation Criteria for Solid Tumors (mRECIST) for HCC.53 An objective response to treatment was defined by mRECIST of complete or partial response.
Exosome Immunocapture and Detection of Multiple Exosome Protein by Enzyme-Linked Immunosorbent Assay (ELISA)
A custom ELISA for exosome capture and multiplex analysis was developed for analyzing low volume serum samples. In brief, 96-well polystyrene ELISA plates were coated with a 1:1000 diluted CD63 polyclonal rabbit antibody (EXOAB- CD63A-1, System Biosciences) in bicarbonate/carbonate coating buffer (100 mM) overnight at 4°C. The plates were then washed with PBS three times and blocked with 100 μL of 1% BSA-PBS 1 hour at room temperature. Following three washes in PBS, cell culture- or serum-isolated exosomes were added in a final volume of 50 μL and incubated overnight at 37°C. After three washes in PBS, replicate samples were incubated with either anti-CD9 mouse monoclonal antibody, mouse monoclonal antibody to HSC70, or mouse monoclonal antibody to GPC3 each diluted to a concentration of 1 μg/mL and incubated for 1 hour at 37°C. After three washes with PBS, the plate was incubated with 100 μL of HRP-conjugated anti-mouse antibody at a dilution of 1:1000 in 1% BSA in PBS for one hour at room temperature. Following three washes with PBS, the reaction was developed with 100 μL of TMB substrate (7004, Cell Signaling) for 30 minutes. The reaction was halted with 50 μL of stop solution (H2SO4) and the optical density (OD) recorded at 450 nm within 30 minutes.
Statistical Analyses
All statistical analyses were performed using GraphPad Prism software version 5.0 for Windows (GraphPad Company, San Diego, CA, USA). ImageJ software version 1.52p (NIH, Bethesda, MD, USA) was used to process the images derived from Western blot and immunostaining. The variables were investigated using visual (histograms, probability plots) and analytical methods (D’Agostino & Pearson omnibus normality test and Shapiro–Wilk test) to test for a normal data distribution. Ordinal variables and continuous variables failing tests for normal distribution were compared by the Mann–Whitney U-test. Student's t-test was used to evaluate differences between the two groups when the variables were normally distributed. Wilcoxon analysis was used for comparing pretreatment and post-treatment glypican 3, CD9, and AFP levels in the serum cohort studies. Serum glypican 3 and p62 levels were used in Receiver operating characteristics (ROC) analysis to discriminate the non-cirrhotic controls, cirrhotic controls, confirmed HCC, and non-HCC malignancy groups. The coefficient of variation values in ELISA results were used to generate the ROC curve for locoregional treatment response prognosis in patients with HCC. Sensitivity, specificity, positive predictive, and negative predictive values were calculated for optimal cut-offs obtained by ROC analysis. All measurements were performed in triplicate (n = 3). An overall 5% type-I error was used to infer statistical significance. P values were represented as ns P > 0.05, *P < 0.05, **P < 0.01, ***P < 0.001 in the figures.
Results
Elevated GPC3 and p62 Expression in Autophagy-Deficient HCC Tissue
Histologic sections of previously confirmed and verified by pathologist, cases of HCC with adjacent cirrhotic liver were selected for the IHC (Figure 1A and D, H and E, x 200). We first confirmed impaired autophagy, evidenced by increased expression of the autophagy flux protein p62. The expression of p62 was examined by IHC in 58 HCC specimens containing a reference margin to the cirrhotic liver. In total 89.6% of specimens evaluated, confirming impaired autophagic flux in HCC (Figure 1B). Semiquantitative IHC scoring analysis revealed nearly 10-fold increased p62 expression in the HCC lesion compared to adjacent cirrhotic tissue (Figure 1C). Immunostaining for GPC3 confirmed expression was restricted to the HCC lesion, with 80% of the specimens staining positive for GPC3 relative to negative stained cirrhotic liver background (Figure 1E and F). There was not significant difference among the etiologies of cirrhosis in terms of p62 and GPC3 expressions (Supplementary Table 1).
 |
Figure 1 Immunohistochemical staining of p62 and glypican 3 (GPC3) in cirrhotic livers with HCC. (A and D) Histologic sections of HCC with adjacent liver cirrhosis (H&E, ×200). (B and C) The expression of p62 in HCC and adjacent cirrhotic livers (various etiologies) with semiquantitative scoring for expression of the entire cohort. (E and F) Representative expression of GPC3 in HCC and adjacent cirrhotic livers (various etiologies) with semiquantitative scoring for expression of the entire cohort. Original image magnification was 200×. Data indicate mean ± standard error of mean and analyzed by Student’s t-test. ***P < 0.001. |
Impaired Autophagic Flux with Increased p62 and GPC3 Expression in HCC Cell Lines
We next confirmed whether HCC cell lines and non-transformed primary hepatocytes could recapitulate impaired autophagy and increased GPC3 expression specific to HCC. A panel of 6 HCC cell lines was examined for p62 expression levels compared to primary human hepatocytes (PHH) using immunocytochemistry (Figure 2A). Productive autophagy was evident in PHH control cells as well as the HCC line HLE. However, all other HCC lines had prominent cytoplasmic staining for p62, evidenced by significantly higher staining OD (Figure 2B), supporting indicating defective autophagic flux. Elevated p62 protein expression was also confirmed by Western blot (Figure 2C). DQ-Red BSA endocytosis assay with Torin1 stimulation was used to confirm productive autophagy between the autophagy-deficient HCC lines (Huh-7, Huh-7PX, and Huh-7.5) compared to autophagy-sufficient HCC cell line HLE. Autophagy-sufficient HLE cells demonstrated bright DQ-BSA fluorescence signal that increased after treatment with an autophagy inducer Torin1 (Figure 2D). The autophagy-deficient HCC lines were negative for DQ-BSA fluorescence that could only be induced following Torin1 treatment. Torin1 decreased p62 levels in the autophagy-deficient HCC lines, confirming impaired autophagy (Figure 2E). We next verified that deficient autophagy is linked with increased GPC3 expression. HCC-specific GPC3 expression was examined by immunostaining along with expression of glypican 1 (GPC1), which is malignancy-associated but not HCC specific (Figure 2F). Expression of GPC3 was restricted to the autophagy-deficient HCC lines while GPC1 was present in both the autophagy-sufficient and -deficient HCC lines Immunostaining OD for GPC3 was significantly elevated with reference to the HLE line (Figure 2G). Immunostaining results for GPC1 and GPC3 between autophagy-sufficient and -deficient HCC lines were confirmed by Western blot (Figure 2H), confirming a mechanistic link between impaired autophagy and GPC3 expression in HCC.
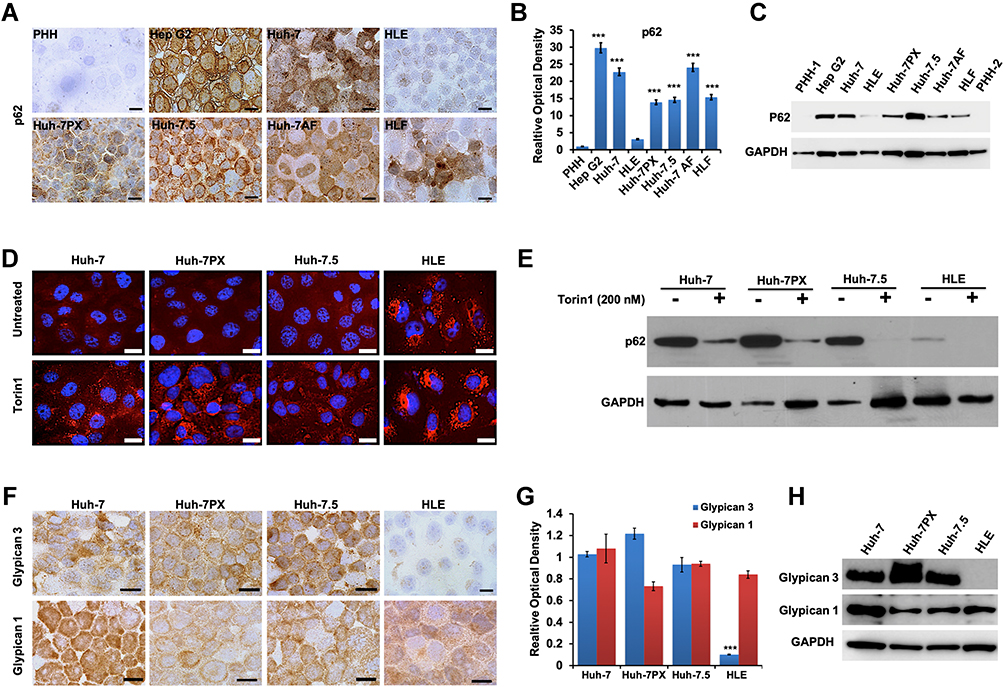 |
Figure 2 Association between p62, autophagy status, and glypican 3 (GPC3) expression in HCC cell lines and normal hepatocytes. (A) A panel of HCC cell lines and primary human hepatocytes (PHH) immunostained for p62. Scale bars = 20 μm. (B) Relative optical density (OD) of p62 immunostaining per representative view field. The results are expressed as the mean ± standard deviation (SD). ***P < 0.001. For each cell line 10 view fields were quantified. (C) Representative Western blot of whole cell extracts for p62 and loading control. (D) The images of DQ-Red BSA uptake and processing in autophagy-deficient (Huh-7, Huh-7PX, and Huh-7.5) and an autophagy-competent (HLE) HCC cell lines ± Torin1 treatment (200 nM). Scale bars = 20 μm. (E) Representative Western blot analysis of p62 degradation after Torin1 treatment in autophagy-deficient (Huh-7, Huh-7PX, and Huh-7.5) and an autophagy-competent (HLE) HCC cell lines. (F) GPC3 and glypican 1 (GPC1) immunostaining in autophagy-deficient (Huh-7, Huh-7PX, and Huh-7.5) and an autophagy-competent (HLE) HCC cell lines. Scale bars = 20 μm. (G) Relative OD of GPC3 and GPC1 immunostaining per representative view field. Data indicate mean ± SD. ***P < 0.001. (H) Representative Western blot analysis showing the expression of GPC3 and GPC1 in autophagy-deficient (Huh-7, Huh-7PX, and Huh-7.5) and an autophagy-competent (HLE) HCC cell lines. The data are resulted in three independent experiments. |
Autophagy-Deficient HCC Lines Secrete GPC3-Enriched Exosomes
We next analyzed exosomes isolated from the autophagy-deficient and -competent HCC lines to confirm a relationship between autophagy status and exosome release. Exosomes were isolated from culture supernatants of HLE (autophagy-competent) and Huh-7.5 (autophagy-deficient) HCC lines and characterized by cryoTEM. Vesicular structures with a bilayer lipid membrane were detected in the isolates from both HCC lines. The bilayer lipid membrane morphology and vesicle diameter (30–150 nm) were consistent with cell-derived exosomes (Figure 3A). NTA revealed the light scattering properties and Brownian motion of exosome from the HLE and Huh-7.5 cells in the liquid phase differed, although the exosome size between the cell lines were similar (Figure 3B). Autophagy-deficient Huh-7.5 cells also secreted exosomes at a higher concentration per cell (P = 0.03) compared to autophagy-competent HLE cells (Figure 3C). Exosomes isolated both lines were characterized by Western blot for expression of the tetraspanin CD9, enriched in the exosome membrane, and TSG101, a protein involved in recruitment an internalization of cargo into MVBs (Figure 3D). These analyses show that the exosome concentration is low in a cell line with active autophagy as compared to a cell line with defective autophagy. We performed an LC-MS analysis using exosomes isolated from Huh-7.5 cells. Content of the exosomes isolated from the Huh-7.5 autophagy-deficient line were further characterized using LC-MS. Bioinformatic analyses revealed 129 proteins including GPC3. The majority of the proteins are exclusively cytoplasmic in origin (51 proteins) or shared between the cytoplasmic and nuclear or membrane compartments (39 proteins cytoplasmic and nuclear, 12 proteins cytoplasmic and membrane-bound, and 15 proteins present in all compartments). An additional 6 proteins are exclusively nuclear and 6 others exclusively membrane-bound (Figure 4A). A breakdown of all proteins identified by LC-MS is contained in Extended Data File 1. Immunogold labeling was used to confirm the location of GPC1 and GPC3 in TEM preparations of exosomes isolated from autophagy-deficient Huh-7.5 and autophagy-competent HLE cells (Figure 4B). In agreement with Western blot analysis from whole cell extracts, we observed GPC1 expression in exosomes isolated from both Huh-7.5 and HLE, independent of autophagy status. GPC3 immunolabeling was specific to the autophagy-deficient Huh-7.5 cells. Exosome flow cytometry confirmed GPC1 expression in both preparations (Figure 4C) with GPC3 expression restricted to exosomes isolated from autophagy-deficient Huh-7.5 (Figure 4D). GPC3 staining of the exosomes were confirmed by complete loss of fluorescent signal when the primary antibody only was omitted (Figure 4E). These results were also confirmed by Western blot analysis on the same culture-isolated exosome preparations (Figure 4F). GPC3 expression restricted to exosomes derived from autophagy-deficient Huh-7.5 was confirmed by all methods evaluated.
 |
Figure 3 Characterization of exosomes released from an autophagy-deficient and an autophagy-competent HCC cell line. (A) Cryogenic transmission electron microscopy (cryoTEM) images of exosomes purified from culture supernatants of autophagy-deficient (Huh-7.5) and autophagy-competent (HLE) HCC lines. Left panel (low magnification). Right panel (high magnification). (B) Top panel: Representative image of exosome Brownian motion in liquid phase using Nanoparticle tracking analysis (NTA). Bottom panel: Size distribution profile of exosomes with mean and mode of the population diameter ± standard error. (C) Exosome concentration in the culture supernatant quantified by NTA. The results are expressed as the mean ± standard deviation and analyzed by Student`s t-test. *P < 0.05. (D) Representative Western blot for TSG101 and CD9 in cell lysates and exosomes isolated from autophagy-deficient Huh-7.5 and autophagy-competent HLE cell cultures. All experiments were performed in triplicate. |
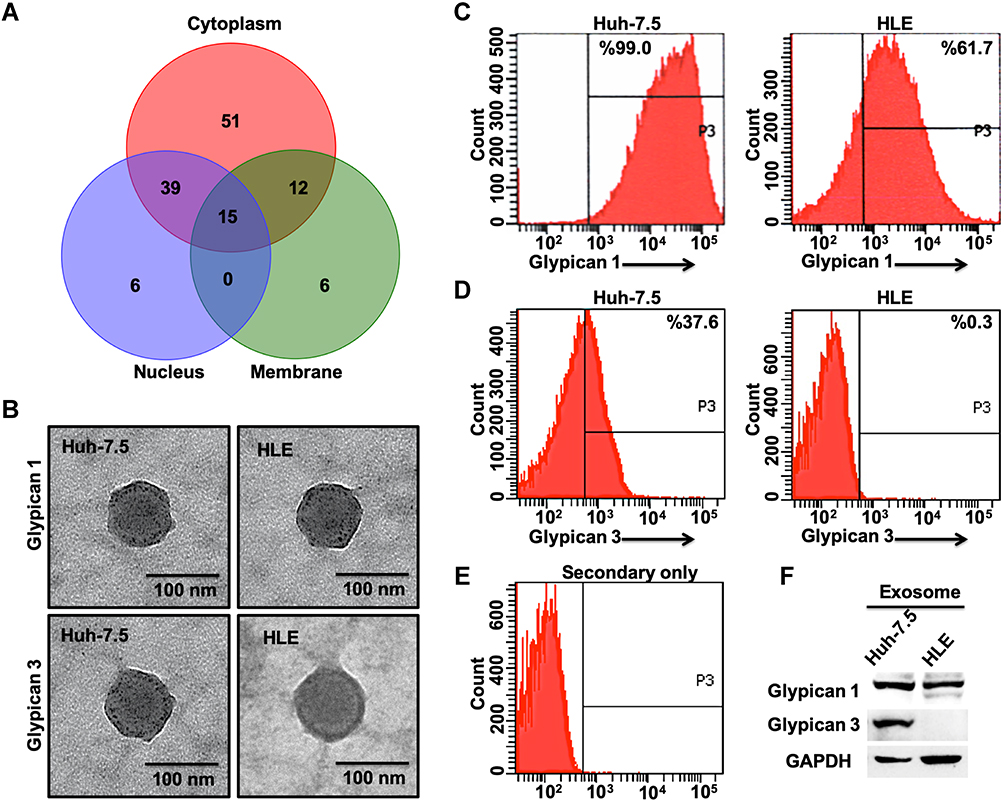 |
Figure 4 Glypican 3 (GPC3)-enriched exosomes are release exclusively from autophagy-deficient hepatocellular carcinoma (HCC) cells. (A) Cell compartment breakdown of 129 proteins identified by proteomic analysis of exosomes isolated from autophagy-deficient Huh-7.5. (B) Representative immunogold-transmission electron microscopy images of exosomes labeled against glypican 1 (GPC1) and GPC3 after isolation from autophagy-deficient (Huh-7.5) and autophagy-competent (HLE) HCC lines. (C) Fluorescence histograms of bead-captured exosomes from Huh-7.5 and HLE stained for GPC1. (D) Fluorescence histograms of bead-captured exosomes from Huh-7.5 and HLE stained for GPC3. (E) Background fluorescence of bead-captured exosomes with primary antibody omitted. (F). Representative Western blot analysis of GPC1 and GPC3 in purified exosomes isolated from Huh-7.5 and HLE cultures. All experiments were in triplicate. |
Impaired Autophagy Response in HCC Increases Exosome Release
The extent of lysosomal MVB degradation during autophagy is directly related to the quantity of exosomes released. Using serum isolated from a cohort of non-cirrhotic (n = 25) and cirrhotic with (n = 25) and without HCC (n = 25), we investigated the relationship between exosome concentration and HCC disease status using NTA. Exosomes isolated from the serum of each cohort were similar in size distribution and matched the anticipated size distribution for circulating exosomes ranging from 30 to 150 nm (Figure 5A). Having confirmed defective autophagy in the HCC tissue, we examined the hypothesis that impaired autophagy results in the increased release of exosomes into peripheral circulation in patients with HCC. As expected, the concentration of exosomes in patients with HCC was significantly higher with respect to both non-cirrhotic healthy controls and cirrhosis without HCC (Figure 5B). Comparison of exosome size among the groups was not statistically different (Figure 5C). To verify NTA analysis, the exosome-derived concentration of CD63 (eCD63) tetraspanin was quantified in the purified exosomes from each group by ELISA. In agreement with NTA analysis, eCD63 concentration was significantly elevated in HCC compared cirrhotic and non-cirrhotic controls (Figure 5D). Receiver operating characteristic (ROC) curves were utilized to determine the accuracy of eCD63 to differentiate HCC from cirrhotic and non-cirrhotic controls. Area under the curve (AUC) was used to compare eCD63 assay performance. An AUC of 0.95 was obtained for eCD63 in differentiating HCC from patients without cirrhosis (P < 0.0001), with an AUC of 0.87 in distinguishing HCC from patients with cirrhosis alone (P < 0.0001) (Figure 5E). This data confirms that CD63 exosome content in the plasma accurately identifies patients with confirmed HCC.
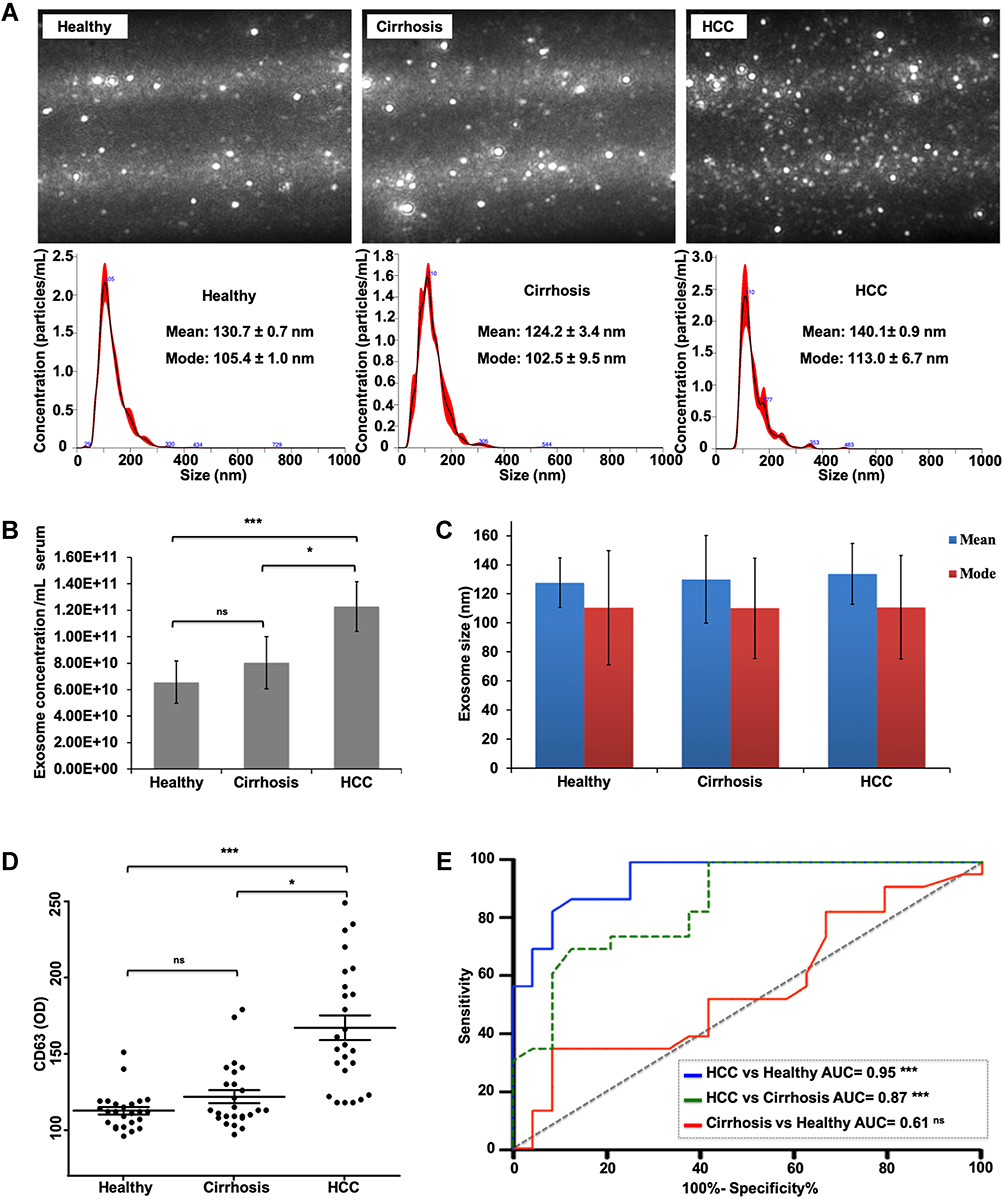 |
Figure 5 Characterization of circulating exosomes among non-cirrhotics and cirrhotics with and without hepatocellular carcinoma (HCC). (A) Representative nanoparticle tracking analysis (NTA) images and distribution plots from exosomes isolated from the serum. Size distribution profile of exosomes with mean and mode of the population diameter ± standard error. (B) Serum exosome concentrations determined by NTA (n=25 per sample group). Data indicate mean ± standard deviation (SD) and analyzed by Student`s t-test. P values were displayed as nsP > 0.05, *P < 0.05, ***P < 0.001. (C) The size distribution of isolated exosomes among sample groups. The results are expressed as the mean ± SD and analyzed by Student`s t-test. (D) The concentration of exosome-derived CD63 (eCD63). Data indicate mean ± standard error of mean and analyzed by Student`s t-test. P values were displayed as nsP > 0.05, *P< 0.05, ***P < 0.001. (E) Receiver operating characteristic (ROC) curves for eCD63 in distinguishing HCC from non-cirrhotic controls (solid blue), HCC from cirrhosis alone (dashed green), and cirrhosis from non-cirrhotic controls (solid red). |
Diagnostic Performance of Serum eGPC3 for HCC
The conventional ELISA assay has proven to be a rapid, high throughput approach for molecular analysis of proteins expressed on the exosomes surface. Using this approach, we characterized the levels of GPC3 in serum from patients without cirrhosis (n = 25), cirrhosis with (n = 25) and without HCC (n = 25), as well as serum from patients with malignancy other than HCC (n = 10). Demographic data for the serum cohort are disclosed in Supplementary Table 2. Exosome-associated GPC3 was prominently detected in patients with HCC with a small percentage of cirrhotic patients without HCC having GPC3 levels slightly above baseline (Figure 6A). GPC3 was notably absent in exosome preparations from non-cirrhotic and non-HCC malignancy controls. The GPC3 content in the isolated exosomes was significantly higher in HCC patients compared to healthy control, cirrhosis, and other cancers (P < 0.0001). The performance of eGPC3 in detecting HCC was analyzed using ROC analysis to tabulate AUC (Figure 6B). The eGPC3 level was able to discriminate HCC from cirrhotic patients without HCC (AUC 0.95, P < 0.0001) as well as HCC from non-cirrhotic controls (AUC 1.0, P < 0.0001) while outperforming AFP (AUC 0.72, P < 0.007) in discriminating HCC from cirrhosis without HCC. Exosome-derived p62 (ep62) was similar among all patient groups investigated (Figure 6C), with ep62 level unable to distinguish disease status in the cohort (Figure 6D).
 |
Figure 6 Exosome-derived glypican 3 (eGPC3) and p62 (ep62) levels as prognostic performance in detecting hepatocellular carcinoma (HCC). (A) Concentration of eGPC3 among cohort disease groups (n = 25 in healthy, cirrhosis, and HCC. n = 10 in other tumors). P values were displayed as nsP > 0.05 and ***P < 0.001. (B) Receiver operating characteristic (ROC) curves of eGPC3 in HCC compared to other disease states with AFP ROC as reference. P values were displayed as **P < 0.01 and ***P < 0.001. (C) ep62 concentrations among cohort groups. P values were displayed as nsP > 0.05. (D) ROC curve analysis for ep62 level compared HCC to other disease states. Data indicate mean ± standard error of mean and analyzed by Student`s t-test. P values were displayed as nsP > 0.05. |
Prognostic Value of eGPC3 for HCC Treated with DEB-TACE
We next evaluated the role of eGPC3 in prognosis of trans arterial chemoembolization and whether eGPC3 levels changed in accordance with response to treatment. In order to allow facilitate multiplex screening from a small volume serum sample, an affinity ELISA with anti-CD63 capture was utilized to isolate exosomes from the serum (Supplementary Figure 1A). Using this assay, multiple aliquots of a single serum specimen can be analyzed for several exosome-associated targets (Supplementary Figure 1B and C). Exosome concentration standard curves were developed by serial dilution of exosomes isolated from HCC cell lines. As there is currently no consensus regarding the quantification of tumor-derived exosomes as a fraction of total exosomes, the OD of the ELISA was utilized to analyze eGPC3 content before and after therapy (Supplementary Figure 1D).
Using the affinity ELISA exosome capture method, we analyzed paired serum samples from HCC patients receiving first-line DEB-TACE. Cohort demographics are outlined in (Supplementary Table 3). After treatment follow-up imaging, patients were grouped based on response to treatment using mRECIST for HCC. Scores were groups in responders (complete or partial response to treatment) and non-responders (stable disease or progressive disease). The eGPC3 and eCD9 content in the bound exosomes was determined in 100 μL serum aliquots and cross-referenced with the clinical serum AFP value at each time point. Of the 43 patients examined, only 32.5% of patients had an abnormal AFP value (AFP > 20 ng/mL) at baseline. Patients responding to DEB-TACE were found to have decreased eGPC3 (P = 0.038) and eCD9 (P = 0.04) at treatment follow-up (Figure 7A and B). As anticipated, the post-treatment AFP level was not yet significantly changed with respect to baseline when considering all AFP values or only AFP values above the normal threshold (P = 0.84) (Figure 7C). In contrast, there was no reduction in eGPC3 levels in non-responders, with a trend toward increasing eGPC3 (Figure 7D). The eCD9 content and serum AFP level were also not significantly altered post-treatment in the non-responder group (Figure 7E and F). ROC curve analysis of change in eCD9 content of the CD63-bound exosomes was found to be more predictive for response to treatment than change in AFP. In the responder group there was a mean decrease of 21.6% in eCD9 post-treatment with ROC analysis sensitivity of 72.7% and specificity of 88.2% (Figure 7G). A mean increase in eGPC3 of 11.9% was present in non-responders, with a ROC analysis sensitivity of 77.7% and specificity of 78.5% (Figure 7H). Collectively, these results show that changes in exosome concentration, tetraspanin fraction, and GPC3 content may also have implications in correlating treatment response and disease progression.
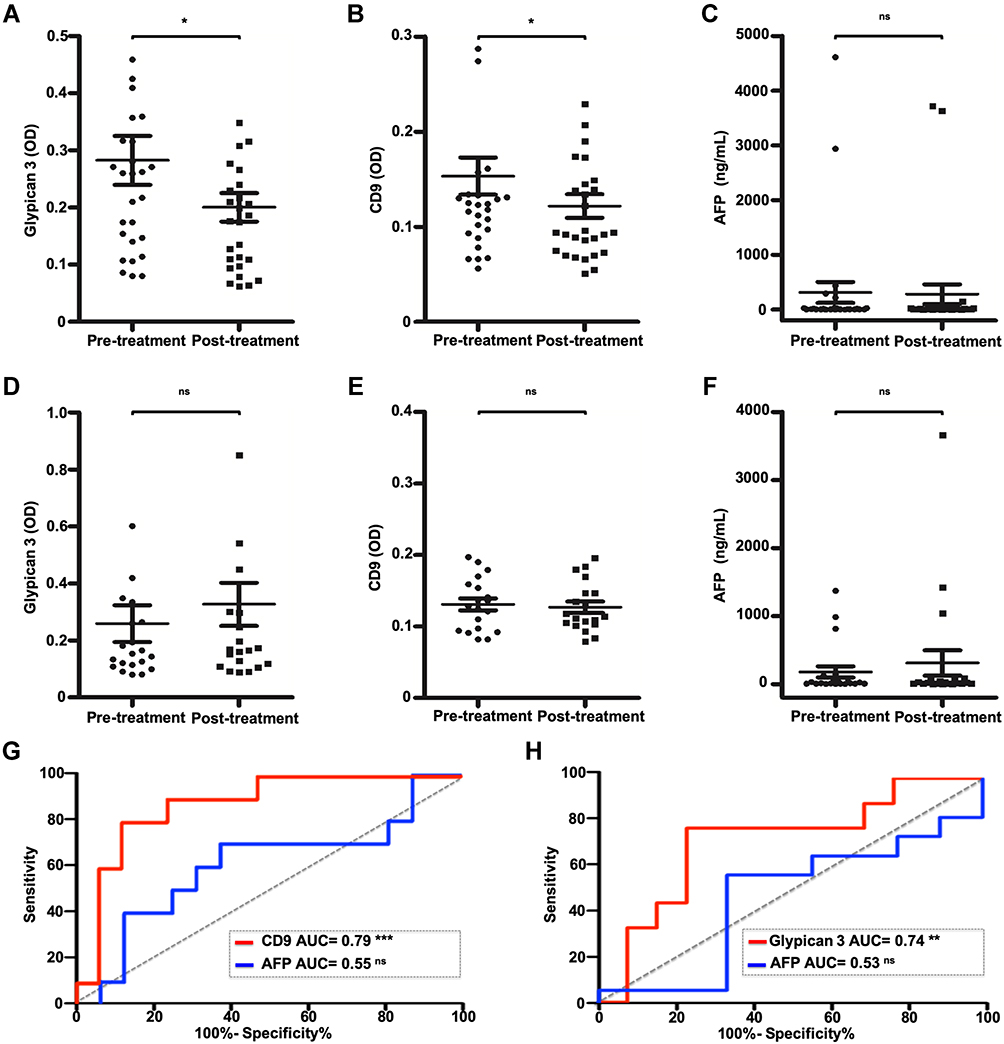 |
Figure 7 Changes in exosome-derived glypican 3 (eGPC3) and CD9 (eCD9) in response to tumor-directed therapy for hepatocellular carcinoma (HCC). (A) Affinity capture ELISA optical density (OD) for eGPC3 before and after doxorubicin-eluting bead transarterial chemoembolization (DEB-TACE) in patients responding to therapy. (B) OD for eCD9 in patients responding to treatment. (C) Serum AFP levels in treatment responsive patients. (D) OD for eGPC3 in patients who did not respond to DEB-TACE. (E) OD for eCD9 in treatment non-responders. (F) Serum AFP levels in treatment non-responders. (G) Receiver operating characteristic (ROC) curve plots for decrease in eCD9 content compared to AFP decrease post-treatment for response to treatment. (H) ROC curve plot of in eGPC3 compared to increase in AFP for non-response to treatment. Data indicate mean ± standard error of mean and analyzed by paired t-test. P values were displayed as nsP > 0.05, *P < 0.05, **P < 0.01, ***P < 0.001. |
Discussion
Autophagy functions as a tumor suppressor in hepatocytes promoting endo-lysosomal and autophagosome-lysosomal degradation, which provides protection against cellular transformation. Impaired autophagy has been linked to several human diseases such as neurodegenerative disorders, microbial infection, aging, and many types of cancer including HCC.54 Impaired autophagy leads to the accumulation of p62, and polyubiquitinated proteins.55 Although highly expressed in the fetal liver, GPC3 is not expressed in the healthy adult liver but is reactivated within the HCC lesion. A variety of growth factor receptors, including some linked to oncogenic signaling pathways, are controlled by GPC3.54 GPC3 is also involved in endocytosis, degradation of MVBs, and exosome release. Impaired autophagy inhibits degradation of GPC3 and MVBs, providing the mechanism through which GPC3 activates oncogenic signaling pathways in HCC.56,57
In this study, we show increased expression of p62 and GPC3 within the HCC lesion independent of underlying cirrhosis etiology. Increased p62 and GPC3 expression was also observed in HCC cell lines compared to normal hepatic cells, supporting an autophagy-deficient status in HCC cells. We found that autophagy-deficient HCC cells secrete more exosomes as compared to autophagy-sufficient cells. GPC3 expression was restricted to exosomes isolated from HCC cell lines confirming eGPC3 status can differentiate malignant from benign liver cells. This finding was then translated to HCC surveillance to test the hypothesis that serum exosome concentration and eGPC3 levels can serve as an HCC surveillance biomarker in cirrhotic patients.
Exosome isolation/purification remains a major barrier to clinical implementation of exosome-based diagnostic biomarkers. Several isolation strategies have been utilized for biochemical and morphological characterization of exosomes.58 Ultracentrifugation is the gold standard for exosome isolation, although from a translational perspective, this approach lacks high throughput capability.59 Molecular-based exosome isolation strategies offer a translatable, high throughput alternative with concessions in exosome integrity and purity that may interfere with downstream analysis. We address this issue by using immunoaffinity capture to isolate circulating exosomes from the serum. Using this approach, we developed a conventional, affinity ELISA-based exosome assay for multiplex analysis of protein expression in a high throughput format.60
Our results demonstrate that total exosome concentration is significantly elevated in patients with HCC meeting diagnostic criteria compared to subjects with cirrhosis and non-cirrhotic controls. The size of the exosomes however was not significantly different among the groups. The exosome concentrations obtained using CD63 ELISA strongly correlated with matched samples analyzed using the NTA-based approach to exosome quantification. Although the exosome concentration between cirrhotic and non-cirrhotic controls did not reach significance, eCD63 levels were elevated in patients with cirrhosis. This finding was anticipated given the role of autophagy-deficiency in malignant transformation of HCC and could provide a rationale for increased surveillance for suspected pre-malignant changes in the liver. Our study demonstrates that serum eGPC3 accurately distinguishing patients with HCC from non-cirrhotic controls, cirrhotic controls, and individuals with other non-HCC malignancy. GPC3 exosome status more accurately confirmed HCC diagnosis compared to serum AFP. In addition to improved diagnostic performance, exosome concentration and eGPC3 level were also prognostic for response to tumor-directed locoregional chemotherapy. Decreased eGPC3 level and exosome concentration after locoregional chemotherapy were associated with an objective response to treatment. Serum ep62 level did not differ among analysis groups, suggesting this marker may not be applicable for HCC detection.
Many recent studies evaluated individual and combined diagnostic values of serum alpha-fetoprotein (AFP), des-gamma-carboxyprothrombin (DCP), glypican-3 (GPC3) and golgi protein 73 (GP73) in diagnosing HCC.61–75 One study by Li et al showed combination of serum levels of miR-122, GPC3 and AFP improved power of HCC detection.66 Several studies showed that the sensitivity of circulating GPC3 is superior to AFP for detecting HCC.42–45 An initial study by Capurro et al found GPC3 was undetectable in healthy individuals but present in more than half of the HCC patients tested.43 Approximately 40% of biopsy-confirmed and radiographic criteria HCC present with normal serum AFP levels. Hippo et al showed that an NH(2)-terminal cleavage of GPC3 between Arg (358) and Ser (359) was detectable in 50–72% of HCC sera, further supporting GPC3 as a novel serological marker essential for the early detection of HCC.76 A study by Li et al confirmed the utility of serum GPC3 in AFP-null HCC, revealing 48.8% of patients presenting with normal serum AFP were GPC3 positive.77 Using an ELISA approach, Nakatsura et al detected soluble secreted GPC3 protein in 40.0% (16/40) of HCC patients but negative in the sera from subjects with cirrhosis (0/13), chronic hepatitis (0/34), and healthy donors (0/60).78 Qiao et al reported that GPC3 is a better marker for HCC detection than AFP using a cohort of 189 patients (101 HCC, 40 cirrhosis, 18 chronic hepatitis, and 30 healthy donors).79 Tangkijvanich et al reported 53% GPC3 positive HCC patients, with values ranging from 35.5–7826.6 ng/mL.80 A meta-analysis of 17 published studies performed by Liu et al confirmed the diagnostic accuracy of serum GPC3 for detecting HCC from non-HCC cirrhosis. They found that serum GPC3 is an acceptable biomarker for accurate diagnosis of HCC.67 Despite similar results from several independent groups, the sensitivity and specificity of circulating GPC3 ultimately failed to outperform standard of care HCC surveillance.81–86 We found that eGPC3 has improved sensitivity for detecting HCC compared to soluble GPC3 in the serum. Our data indicate that serum GPC3 does not adequately reflect its actual bioavailability in the blood, as most GPC3 is bound to the exosomes in HCC.
Conclusion
Our results support the prior observations indicating that exosomal glypican-3 is a promising HCC biomarker that can accurately detect HCC as well as treatment response. The affinity isolation method used in this paper for the detection of GPC3 is specific that can be adapted to any laboratory using a small volume of serum samples. The exosomal GPC3 detection has a very high predictive values that correlate with ultrasound evaluation of HCC treatment. However, the sensitivity of exosomal glypican-3 detection is not satisfactory and needs to be improved. We propose that more basic research need to be conducted to understand the mechanisms of glypican-3 release by exosomes in HCC tumors. This may facilitate inclusion of additional HCC specific markers along with GPC3 should increase the sensitivity of HCC detection and treatment response.
Abbreviations
AFP, alpha-fetoprotein; AUC, area under curve; CryoTEM, cryogenic transmission electron microscopy; DEB-TACE, doxorubicin-eluting bead transarterial chemoembolization; ELISA, enzyme-linked immunosorbent assay; eGPC3, exosome-derived glypican 3; GAPDH, glyceraldehyde 3-phosphate dehydrogenase; GPC1, Glypican 1; GPC3, Glypican 3; HCC, hepatocellular carcinoma; HCV, hepatitis C virus; LC-MS, Liquid chromatography-mass spectrometry; NAFLD, non-alcoholic fatty liver disease; NTA, nanoparticle tracking analyses; mRECIST, Modified Response Evaluation Criteria for Solid Tumors; MVB, multivesicular body; OD, optical density; PHH, primary human hepatocyte; ROC, receiver operating characteristic; TACE, transarterial chemoembolization; TEM, transmission electron microscopy; US, ultrasound.
Acknowledgments
Authors acknowledge our collaborators who have supplied reagents and supported our research in the hepatitis research laboratory at Tulane University Health Sciences Center. This work was directly supported by Veterans Affairs Merit Review Grant: 1I0IBX004516-01A1 and Louisiana Clinical and Translational Science (LACaTS) Center Grant: U54GM104940. Ali Riza Koksal was supported by funds received from the Akdamar Fellowship Program provided by Department of Gastroenterology and Hepatology, Tulane University Health Sciences Center.
Funding
Veterans Affairs Merit Review Grant: 1I01BX004516-01A1, and Louisiana Clinical and Translational Science (LA CaTS) Center Grant: U54 GM104940.
Disclosure
Dr Paul Thevenot reports grants from American Society of Transplant Surgeons, during the conduct of the study. The authors report no other conflicts of interest in this work.
References
1. Kim HS, El-Serag HB. The epidemiology of hepatocellular carcinoma in the USA. Curr Gastroenterol Rep. 2019;21(4):17. doi:10.1007/s11894-019-0681-x
2. Kulik L, El-Serag HB. Epidemiology and management of hepatocellular carcinoma. Gastroenterology. 2019;156(2):477–491.e471. doi:10.1053/j.gastro.2018.08.065
3. McGlynn KA, Petrick JL, El-Serag HB. Epidemiology of hepatocellular carcinoma. Hepatology. 2021;73 Suppl 1(Suppl1):4–13. doi:10.1002/hep.31288
4. Degroote H, Piñero F, Costentin C, et al. International study on the outcome of locoregional therapy for liver transplant in hepatocellular carcinoma beyond Milan criteria. JHEP Rep. 2021;3(5):100331. doi:10.1016/j.jhepr.2021.100331
5. Qing X, Xu W, Zong J, Du X, Peng H, Zhang Y. Emerging treatment modalities for systemic therapy in hepatocellular carcinoma. Biomark Res. 2021;9(1):64. doi:10.1186/s40364-021-00319-3
6. Raza A, Sood GK. Hepatocellular carcinoma review: current treatment, and evidence-based medicine. World J Gastroenterol. 2014;20(15):4115–4127. doi:10.3748/wjg.v20.i15.4115
7. Altekruse SF, McGlynn KA, Reichman ME. Hepatocellular carcinoma incidence, mortality, and survival trends in the United States from 1975 to 2005. J Clin Oncol. 2009;27(9):1485–1491. doi:10.1200/JCO.2008.20.7753
8. D’Ambrosio R, Degasperi E, Anolli MP, et al. Incidence of liver and non-liver-related outcomes in patients with HCV-cirrhosis after SVR. J Hepatol. 2021. doi:10.1016/j.jhep.2021.09.013
9. Demirtas CO, Brunetto MR. Surveillance for hepatocellular carcinoma in chronic viral hepatitis: is it time to personalize it? World J Gastroenterol. 2021;27(33):5536–5554. doi:10.3748/wjg.v27.i33.5536
10. Mittal S, Kanwal F, Ying J, et al. Effectiveness of surveillance for hepatocellular carcinoma in clinical practice: a United States cohort. J Hepatol. 2016;65(6):1148–1154. doi:10.1016/j.jhep.2016.07.025
11. Roberts SK, Majeed A, Kemp W. Controversies in the management of hepatitis B: hepatocellular carcinoma. Clin Liver Dis. 2021;25(4):785–803. doi:10.1016/j.cld.2021.06.006
12. Bruix J, Sherman M. Management of hepatocellular carcinoma: an update. Hepatology. 2011;53(3):1020–1022. doi:10.1002/hep.24199
13. Tan CH, Low SC, Thng CH. APASL and AASLD consensus guidelines on imaging diagnosis of hepatocellular carcinoma: a review. Int J Hepatol. 2011;2011:519783. doi:10.4061/2011/519783
14. Yang JD, Kim WR. Surveillance for hepatocellular carcinoma in patients with cirrhosis. Clin Gastroenterol Hepatol. 2012;10(1):16–21. doi:10.1016/j.cgh.2011.06.004
15. Singal AG, Nabihah T, Mehta A, et al. GALAD demonstrates high sensitivity for HCC surveillance in a cohort of patients with cirrhosis. Hepatology. 2021. doi:10.1002/hep.32185
16. Tsuchiya N, Sawada Y, Endo I, Saito K, Uemura Y, Nakatsura T. Biomarkers for the early diagnosis of hepatocellular carcinoma. World J Gastroenterol. 2015;21(37):10573–10583. doi:10.3748/wjg.v21.i37.10573
17. Foerster F, Gairing SJ, Müller L, Galle PR. NAFLD-driven HCC: safety and efficacy of current and emerging treatment options. J Hepatol. 2021;49(21):
18. Loosen SH, Kostev K, Keitel V, Tacke F, Roderburg C, Luedde T. An elevated FIB-4 score predicts liver cancer development: A longitudinal analysis from 29,999 patients with NAFLD. J Hepatol. 2021;S0168-8278(21)02028-6. doi:10.1016/j.jhep.2021.08.030.
19. Wong CR, Nguyen MH, Lim JK. Hepatocellular carcinoma in patients with non-alcoholic fatty liver disease. World J Gastroenterol. 2016;22(37):8294–8303. doi:10.3748/wjg.v22.i37.8294
20. Minami T, Tateishi R, Fujiwara N, et al. Impact of obesity and heavy alcohol consumption on hepatocellular carcinoma development after HCV eradication with antivirals. Liver Cancer. 2021;10(4):309–319. doi:10.1159/000513705
21. Nakamura S, Yoshimori T. Autophagy and longevity. Mol Cells. 2018;41(1):65–72. doi:10.14348/molcells.2018.2333
22. Escobar KA, Cole NH, Mermier CM, VanDusseldorp TA. Autophagy and aging: maintaining the proteome through exercise and caloric restriction. Aging Cell. 2019;18(1):e12876. doi:10.1111/acel.12876
23. Aydin Y, Koksal AR, Reddy V, et al. Extracellular vesicle release promotes viral replication during persistent HCV infection. Cells. 2021;10(5):984. doi:10.3390/cells10050984
24. Aydin Y, Stephens CM, Chava S, et al. Chaperone-mediated autophagy promotes beclin1 degradation in persistently infected hepatitis C virus cell culture. Am J Pathol. 2018;188(10):2339–2355. doi:10.1016/j.ajpath.2018.06.022
25. Bao L, Chandra PK, Moroz K, et al. Impaired autophagy response in human hepatocellular carcinoma. Exp Mol Pathol. 2014;96(2):149–154. doi:10.1016/j.yexmp.2013.12.002
26. Chava S, Lee C, Aydin Y, et al. Chaperone-mediated autophagy compensates for impaired macroautophagy in the cirrhotic liver to promote hepatocellular carcinoma. Oncotarget. 2017;8(25):40019–40036. doi:10.18632/oncotarget.16685
27. Baixauli F, Lopez-Otin C, Mittelbrunn M. Exosomes and autophagy: coordinated mechanisms for the maintenance of cellular fitness. Front Immunol. 2014;5:403. doi:10.3389/fimmu.2014.00403
28. Kalita-de Croft P, Sharma S, Sobrevia L, Salomon C. Extracellular vesicle interactions with the external and internal exposome in mediating carcinogenesis. Mol Aspects Med. 2021;101039. doi:10.1016/j.mam.2021.101039
29. Raposo G, Stoorvogel W. Extracellular vesicles: exosomes, microvesicles, and friends. J Cell Biol. 2013;200(4):373–383. doi:10.1083/jcb.201211138
30. Zhang Q, Yang X, Liu H. Extracellular vesicles in cancer metabolism: implications for cancer diagnosis and treatment. Technol Cancer Res Treat. 2021;20:15330338211037821. doi:10.1177/15330338211037821
31. Zheng W, Ji D, Zhou Y, et al. Exosomal noncoding RNAs in hepatobiliary cancer: a rising star. Mol Cancer Ther. 2021;20(10):1777–1788. doi:10.1158/1535-7163.MCT-21-0363
32. Christianson HC, Belting M. Heparan sulfate proteoglycan as a cell-surface endocytosis receptor. Matrix Biol. 2014;35:51–55. doi:10.1016/j.matbio.2013.10.004
33. Capurro M, Martin T, Shi W, Filmus J. Glypican-3 binds to frizzled and plays a direct role in the stimulation of canonical Wnt signaling. J Cell Sci. 2014;127(Pt 7):1565–1575. doi:10.1242/jcs.140871
34. Capurro MI, Shi W, Filmus J. LRP1 mediates hedgehog-induced endocytosis of the GPC3-hedgehog complex. J Cell Sci. 2012;125(Pt 14):3380–3389. doi:10.1242/jcs.098889
35. Capurro MI, Xu P, Shi W, Li F, Jia A, Filmus J. Glypican-3 inhibits hedgehog signaling during development by competing with patched for hedgehog binding. Dev Cell. 2008;14(5):700–711. doi:10.1016/j.devcel.2008.03.006
36. Christianson HC, Svensson KJ, van Kuppevelt TH, Li JP, Belting M. Cancer cell exosomes depend on cell-surface heparan sulfate proteoglycans for their internalization and functional activity. Proc Natl Acad Sci U S A. 2013;110(43):17380–17385. doi:10.1073/pnas.1304266110
37. Kaseb AO, Hassan M, Lacin S, et al. Evaluating clinical and prognostic implications of glypican-3 in hepatocellular carcinoma. Oncotarget. 2016;7(43):69916–69926. doi:10.18632/oncotarget.12066
38. Lewis JM, Vyas AD, Qiu Y, Messer KS, White R, Heller MJ. Integrated analysis of exosomal protein biomarkers on alternating current electrokinetic chips enables rapid detection of pancreatic cancer in patient blood. ACS Nano. 2018;12(4):3311–3320. doi:10.1021/acsnano.7b08199
39. Melo SA, Luecke LB, Kahlert C, et al. Glypican-1 identifies cancer exosomes and detects early pancreatic cancer. Nature. 2015;523(7559):177–182. doi:10.1038/nature14581
40. Wu Y, Liu H, Ding H. GPC-3 in hepatocellular carcinoma: current perspectives. J Hepatocell Carcinoma. 2016;3:63–67. doi:10.2147/JHC.S116513
41. Yang KS, Im H, Hong S, et al. Multiparametric plasma EV profiling facilitates diagnosis of pancreatic malignancy. Sci Transl Med. 2017;9(391). doi:10.1126/scitranslmed.aal3226
42. Abdelgawad IA, Mossallam GI, Radwan NH, Elzawahry HM, Elhifnawy NM. Can glypican3 be diagnostic for early hepatocellular carcinoma among Egyptian patients? Asian Pac J Cancer Prev. 2013;14(12):7345–7349. doi:10.7314/APJCP.2013.14.12.7345
43. Capurro M, Wanless IR, Sherman M, et al. Glypican-3: a novel serum and histochemical marker for hepatocellular carcinoma. Gastroenterology. 2003;125(1):89–97. doi:10.1016/S0016-5085(03)00689-9
44. Guo M, Zhang H, Zheng J, Liu Y. Glypican-3: a new target for diagnosis and treatment of hepatocellular carcinoma. J Cancer. 2020;11(8):2008–2021. doi:10.7150/jca.39972
45. Yang SL, Fang X, Huang ZZ, et al. Can serum glypican-3 be a biomarker for effective diagnosis of hepatocellular carcinoma? A meta-analysis of the literature. Dis Markers. 2014;2014:127831. doi:10.1155/2014/127831
46. Schaeffeler E, Hellerbrand C, Nies AT, et al. DNA methylation is associated with downregulation of the organic cation transporter OCT1 (SLC22A1) in human hepatocellular carcinoma. Genome Med. 2011;3(12):82. doi:10.1186/gm298
47. Frost LS, Dhingra A, Reyes-Reveles J, Boesze-Battaglia K. The use of DQ-BSA to monitor the turnover of autophagy-Associated Cargo. Methods Enzymol. 2017;587:43–54.
48. Colombo M, Raposo G, Théry C. Biogenesis, secretion, and intercellular interactions of exosomes and other extracellular vesicles. Annu Rev Cell Dev Biol. 2014;30:255–289. doi:10.1146/annurev-cellbio-101512-122326
49. Lotvall J, Hill AF, Hochberg F, et al. Minimal experimental requirements for definition of extracellular vesicles and their functions: a position statement from the international society for extracellular vesicles. J Extracell Vesicles. 2014;3:26913. doi:10.3402/jev.v3.26913
50. Vestad B, Llorente A, Neurauter A, et al. Size and concentration analyses of extracellular vesicles by nanoparticle tracking analysis: a variation study. J Extracell Vesicles. 2017;6(1):1344087. doi:10.1080/20013078.2017.1344087
51. Dragovic RA, Gardiner C, Brooks AS, et al. Sizing and phenotyping of cellular vesicles using nanoparticle tracking analysis. Nanomedicine. 2011;7(6):780–788. doi:10.1016/j.nano.2011.04.003
52. Saveyn H, De Baets B, Thas O, Hole P, Smith J, Van der Meeren P. Accurate particle size distribution determination by nanoparticle tracking analysis based on 2-D brownian dynamics simulation. J Colloid Interface Sci. 2010;352(2):593–600. doi:10.1016/j.jcis.2010.09.006
53. Lencioni R, Llovet JM. Modified RECIST (mRECIST) assessment for hepatocellular carcinoma. Semin Liver Dis. 2010;30(1):52–60. doi:10.1055/s-0030-1247132
54. Choi AM, Ryter SW, Levine B. Autophagy in human health and disease. N Engl J Med. 2013;368(19):1845–1846. doi:10.1056/NEJMra1205406
55. Komatsu M, Waguri S, Koike M, et al. Homeostatic levels of p62 control cytoplasmic inclusion body formation in autophagy-deficient mice. Cell. 2007;131(6):1149–1163. doi:10.1016/j.cell.2007.10.035
56. Filmus J, Capurro M. The role of glypicans in hedgehog signaling. Matrix Biol. 2014;35:248–252. doi:10.1016/j.matbio.2013.12.007
57. Song HH, Shi W, Filmus J. OCI-5/rat glypican-3 binds to fibroblast growth factor-2 but not to insulin-like growth factor-2. J Biol Chem. 1997;272(12):7574–7577. doi:10.1074/jbc.272.12.7574
58. Koritzinsky EH, Street JM, Star RA, Yuen PS. Quantification of exosomes. J Cell Physiol. 2017;232(7):1587–1590. doi:10.1002/jcp.25387
59. Zarovni N, Corrado A, Guazzi P, et al. Integrated isolation and quantitative analysis of exosome shuttled proteins and nucleic acids using immunocapture approaches. Methods. 2015;87:46–58. doi:10.1016/j.ymeth.2015.05.028
60. Logozzi M, De Milito A, Lugini L, et al. High levels of exosomes expressing CD63 and caveolin-1 in plasma of melanoma patients. PLoS One. 2009;4(4):e5219. doi:10.1371/journal.pone.0005219
61. Cao W, Sharma M, Imam R, Yu J. Study on diagnostic values of Astrocyte Elevated Gene 1 (AEG-1) and glypican 3 (GPC-3) in hepatocellular carcinoma. Am J Clin Pathol. 2019;152(5):647–655. doi:10.1093/ajcp/aqz086
62. Caviglia GP, Ciruolo M, Abate ML, et al. Alpha-fetoprotein, protein induced by vitamin K absence or antagonist II and glypican-3 for the detection and prediction of hepatocellular carcinoma in patients with cirrhosis of viral etiology. Cancers. 2020;12:11. doi:10.3390/cancers12113218
63. Ge S, Wang D, Lv B, et al. HCRP1, ID4 and glypican-3: an optimal panel of biomarkers for diagnosis of hepatocellular carcinoma. Int J Clin Exp Pathol. 2018;11(12):5774–5782.
64. Jeon Y, Jang ES, Choi YS, Kim JW, Jeong SH. Glypican-3 level assessed by the enzyme-linked immunosorbent assay is inferior to alpha-fetoprotein level for hepatocellular carcinoma diagnosis. Clin Mol Hepatol. 2016;22(3):359–365. doi:10.3350/cmh.2016.0033
65. Jing JS, Ye W, Jiang YK, et al. The value of GPC3 and GP73 in clinical diagnosis of hepatocellular carcinoma. Clin Lab. 2017;63(11):1903–1909. doi:10.7754/Clin.Lab.2017.170712
66. Li J, Qiyu S, Wang T, Jin B, Li N. Improving the detection of hepatocellular carcinoma using serum AFP expression in combination with GPC3 and micro-RNA MiR-122 expression. Open Life Sci. 2019;14:53–61. doi:10.1515/biol-2019-0007
67. Liu JW, Zuo XL, Wang S. Diagnosis accuracy of serum glypican-3 level in patients with hepatocellular carcinoma and liver cirrhosis: a meta-analysis. Eur Rev Med Pharmacol Sci. 2015;19(19):3655–3673.
68. Liu S, Wang M, Zheng C, Zhong Q, Shi Y, Han X. Diagnostic value of serum glypican-3 alone and in combination with AFP as an aid in the diagnosis of liver cancer. Clin Biochem. 2020;79:54–60. doi:10.1016/j.clinbiochem.2020.02.009
69. Terzi E, Salvatore V, Negrini G, Piscaglia F. Ongoing challenges in the diagnosis of hepatocellular carcinoma. Expert Rev Gastroenterol Hepatol. 2016;10(4):451–463. doi:10.1586/17474124.2016.1124758
70. Unić A, Derek L, Duvnjak M, et al. Diagnostic specificity and sensitivity of PIVKAII, GP3, CSTB, SCCA1 and HGF for the diagnosis of hepatocellular carcinoma in patients with alcoholic liver cirrhosis. Ann Clin Biochem. 2018;55(3):355–362. doi:10.1177/0004563217726808
71. Waidely E, Al-Yuobi AR, Bashammakh AS, El-Shahawi MS, Leblanc RM. Serum protein biomarkers relevant to hepatocellular carcinoma and their detection. Analyst. 2016;141(1):36–44. doi:10.1039/C5AN01884F
72. Wu M, Liu Z, Li X, Zhang A, Li N. Dynamic changes in serum markers and their utility in the early diagnosis of all stages of hepatitis B-associated hepatocellular carcinoma. Onco Targets Ther. 2020;13:827–840. doi:10.2147/OTT.S229835
73. Xu D, Su C, Sun L, Gao Y, Li Y. Performance of serum glypican 3 in diagnosis of hepatocellular carcinoma: a meta-analysis. Ann Hepatol. 2019;18(1):58–67. doi:10.5604/01.3001.0012.7863
74. Zhao S, Long M, Zhang X, et al. The diagnostic value of the combination of golgi protein 73, glypican-3 and alpha-fetoprotein in hepatocellular carcinoma: a diagnostic meta-analysis. Ann Transl Med. 2020;8(8):536. doi:10.21037/atm.2020.02.89
75. Zhou F, Shang W, Yu X, Tian J. Glypican-3: a promising biomarker for hepatocellular carcinoma diagnosis and treatment. Med Res Rev. 2018;38(2):741–767. doi:10.1002/med.21455
76. Hippo Y, Watanabe K, Watanabe A, et al. Identification of soluble NH2-terminal fragment of glypican-3 as a serological marker for early-stage hepatocellular carcinoma. Cancer Res. 2004;64(7):2418–2423. doi:10.1158/0008-5472.CAN-03-2191
77. Li B, Liu H, Shang HW, Li P, Li N, Ding HG. Diagnostic value of glypican-3 in alpha fetoprotein negative hepatocellular carcinoma patients. Afr Health Sci. 2013;13(3):703–709. doi:10.4314/ahs.v13i3.26
78. Nakatsura T, Yoshitake Y, Senju S, et al. Glypican-3, overexpressed specifically in human hepatocellular carcinoma, is a novel tumor marker. Biochem Biophys Res Commun. 2003;306(1):16–25. doi:10.1016/S0006-291X(03)00908-2
79. Qiao SS, Cui ZQ, Gong L, et al. Simultaneous measurements of serum AFP, GPC-3 and HCCR for diagnosing hepatocellular carcinoma. Hepatogastroenterology. 2011;58(110–111):1718–1724.
80. Tangkijvanich P, Chanmee T, Komtong S, et al. Diagnostic role of serum glypican-3 in differentiating hepatocellular carcinoma from non-malignant chronic liver disease and other liver cancers. J Gastroenterol Hepatol. 2010;25(1):129–137. doi:10.1111/j.1440-1746.2009.05988.x
81. Beale G, Chattopadhyay D, Gray J, et al. AFP, PIVKAII, GP3, SCCA-1 and follisatin as surveillance biomarkers for hepatocellular cancer in non-alcoholic and alcoholic fatty liver disease. BMC Cancer. 2008;8(1):200. doi:10.1186/1471-2407-8-200
82. Jia X, Gao Y, Zhai D, et al. Assessment of the clinical utility of glypican 3 as a serum marker for the diagnosis of hepatocellular carcinoma. Technol Cancer Res Treat. 2016;15(6):780–786. doi:10.1177/1533034615605248
83. Ozkan H, Erdal H, Kocak E, et al. Diagnostic and prognostic role of serum glypican 3 in patients with hepatocellular carcinoma. J Clin Lab Anal. 2011;25(5):350–353. doi:10.1002/jcla.20484
84. Wang Y, Yang H, Xu H, et al. Golgi protein 73, not glypican-3, may be a tumor marker complementary to alpha-fetoprotein for hepatocellular carcinoma diagnosis. J Gastroenterol Hepatol. 2014;29(3):597–602. doi:10.1111/jgh.12461
85. Yasuda E, Kumada T, Toyoda H, et al. Evaluation for clinical utility of GPC3, measured by a commercially available ELISA kit with Glypican-3 (GPC3) antibody, as a serological and histological marker for hepatocellular carcinoma. Hepatol Res. 2010;40(5):477–485. doi:10.1111/j.1872-034X.2010.00624.x
86. Zhou S, O’Gorman MR, Yang F, Andresen K, Wang L. Glypican 3 as a serum marker for hepatoblastoma. Sci Rep. 2017;7:45932. doi:10.1038/srep45932
 © 2021 The Author(s). This work is published and licensed by Dove Medical Press Limited. The
full terms of this license are available at https://www.dovepress.com/terms
and incorporate the Creative Commons Attribution
- Non Commercial (unported, 3.0) License.
By accessing the work you hereby accept the Terms. Non-commercial uses of the work are permitted
without any further permission from Dove Medical Press Limited, provided the work is properly
attributed. For permission for commercial use of this work, please see paragraphs 4.2 and 5 of our Terms.
© 2021 The Author(s). This work is published and licensed by Dove Medical Press Limited. The
full terms of this license are available at https://www.dovepress.com/terms
and incorporate the Creative Commons Attribution
- Non Commercial (unported, 3.0) License.
By accessing the work you hereby accept the Terms. Non-commercial uses of the work are permitted
without any further permission from Dove Medical Press Limited, provided the work is properly
attributed. For permission for commercial use of this work, please see paragraphs 4.2 and 5 of our Terms.